Embed Size (px)
Citation preview

Samoa
Education for All 2015 National Review
This report was prepared by the relevant national authorities in view of the World Education Forum (Incheon, Republic of Korea, 19‐22 May 2015). It was submitted in response to UNESCO’s invitation to its Member States to assess progress made since 2000 towards achieving Education for All (EFA). The views and opinions expressed in this document are those of the authors and do not commit UNESCO. The designations employed and the presentation of material do not imply the expression of any opinion whatsoever on the part of UNESCO concerning the legal status of any country, territory, city or area or of its authorities, or concerning the delimitation of its frontiers or boundaries. The paper can be cited with the following reference: “Education for All 2015 National Review Report: Samoa”. For further information, please contact: [email protected]

1 | P a g e
GOVERNMENT OF SAMOA MINISTRY OF EDUCATION, SPORTS & CULTURE
SAMOA
EDUCATION FOR ALL 2015 Review

2 | P a g e
TableofContentsMESSAGE .................................................................................................................................................. 3
FOREWORD ............................................................................................................................................... 4
ACRONYMS ............................................................................................................................................... 5
ACKNOWLEDGEMENTS .............................................................................................................................. 6
EXECUTIVE SUMMARY ............................................................................................................................... 7
CHAPTER 1 ................................................................................................................................................ 9
Introduction .......................................................................................................................................... 9
1.1 Background .................................................................................................................................... 9
1.2 Education Development ................................................................................................................ 9
1.3 Educational Policies and Law ....................................................................................................... 15
CHAPTER 2 .............................................................................................................................................. 18
AnalysisofSixEFAGoals .................................................................................................................... 18
2.1 Early Childhood Education and Care [ECCE] ................................................................................. 19
2.2 Universalisation of Primary Education ......................................................................................... 23
2.3 Life Skills and Lifelong Learning .................................................................................................... 30
2.4 Adult Literacy ............................................................................................................................... 40
2.5 Gender Parity and Equality .......................................................................................................... 44
2.6 Quality of Education .................................................................................................................... 47
2.7 Summary ..................................................................................................................................... 53
CHAPTER 3 .............................................................................................................................................. 55
ReviewofEFAStrategiesandSectorManagement .......................................................................... 55
3.1 Assessment of EFA Strategies ...................................................................................................... 55
3.2 Enabling/Constraining Factors ..................................................................................................... 56
3.3 Lessons Learned / Best Practices ................................................................................................. 56
CHAPTER 4 .............................................................................................................................................. 57
EmergingChallengesandGovernmentPriorities ............................................................................ 57
4.1 Emerging development challenges .............................................................................................. 57
4.2 National Policy Directions ............................................................................................................ 60
4.3 Implications for future education development .......................................................................... 61
4.5 Vision for Education Beyond 2015 ............................................................................................... 61
CHAPTER 5 .............................................................................................................................................. 63
ConclusionsandRecommendations ................................................................................................. 63
5.1 Conclusion ................................................................................................................................... 63
5.2 Recommendations ....................................................................................................................... 63
REFERENCES ............................................................................................................................................ 65

3 | P a g e
MESSAGEMINISTER OF EDUCATION, SPORTS AND
CULTURE

4 | P a g e
FOREWORD

5 | P a g e
ACRONYMS ADB Asian Development Bank APTC Australian Pacific Technical College AusAID Australian Aid CCCS Congregational Christian Church of Samoa ECE Early Childhood Education EFA Education for All ESD Education for Sustainable Development ESP Education Sector Plan ESP II Education Sector Program II EU European Union FBEAP Forum Basic Education Action Plan FoE Faculty of Education GoS Government of Samoa ICT Information and Communications Technology IEPSD Inclusive Education Policy for Students Living with Disability JICA Japan International Cooperation Agency MDGs Millennium Development Goals MESC Ministry of Education, Sports and Culture MoF Ministry of Finance MSS Minimum Service Standards NCECES National Council for Early Childhood Education Samoa NCPF National Curriculum Policy Framework NGOs Non Government Organisations NUS National University of Samoa NTDF National Teacher Development Framework NZAid New Zealand Aid PaBER Pacific Benchmarking for Educational Results PEDF Pacific Education Development Framework PSET Post School Education and Training PSSC Pacific Senior School Certificate PTA Parents and Teacher Association SDS Strategy for the Development of Samoa SEN Student Education Number SMIPBE Science and Mathematics Improvement Project for Basic Education SNE Special Needs Education SPBEA Secretariat of the Pacific Board for Educational Assessment SPECA Samoa Primary Education Certification Assessment SPP Strategic Policies and Plan SQA Samoa Qualifications Authority SSLS Samoa Secondary Leaving Certificate SWAp Sector Wide Approach TVET Technical and Vocational Education and Training UN United Nations UNDP United National Development Programme UNESCO United Nations Educational, Scientific and Cultural Organisation UNFPA United Nations Population Fund UNICEF United Nations International Children’s Emergency Fund USP University of the South Pacific

6 | P a g e
ACKNOWLEDGEMENTS
The Samoa 2015 Review Report on Education for All has been published with the support, advice
and inputs of many individuals and organization.
Acknowledgment is extended to all Government Ministries and Corporations, institutions and
organizations, civil society and individuals for their contribution to this report. Their contributions,
more decisively made our task easier than it seemed at first.
We are grateful to the members of the MESC’s Core Executive who gave guidance and comments
that were crucial to the finalization of the report.
Special thanks to the Government of Samoa (GoS) for their endless support to education, and
UNESCO for their guidance, patience and assistance whilst developing this report.
We want to thank members of the EFA Taskforce who volunteered their time to be part of a small
group of contributors and reviewers for each of the six EFA goals; they gave valuable insights and
provided inputs that are reflected in each EFA goal.

7 | P a g e
EXECUTIVESUMMARYThe preparation of the report started in October 2013 by the Policy, Planning and Research Division of MESC.
The EFA Task Force was formed in November 2013.
This report is a compilation of findings on the status of the EFA Action Plan since 2000. It highlights the
achievements and identifies challenges that need to be considered beyond 2015.
It is anticipated that this report will provide MESC and the education sector a clear direction for development
and decision making in the provision of quality effective and efficient education developments and services.
Ultimately it will provide the government of Samoa sound measures to continuously support educational
enhancement.
The EFA Task Force was reconvened in November 2013, comprising selected officers from within the MESC,
approved by the MESC Core Executive. The Task Force consists of 17 people. The Assistant Chief Executive
Officer (ACEO), PPRD is the Chairperson and the MESC Core Executive is the managing body.
Information and data collected to prepare this report was obtained from data and documents provided by
MESC, Government Ministries, Authorities and NGOs.
This Report comprises 5 Chapters:
Chapter 1 ‐ Introduction
Chapter 2 ‐ Tracking Progress
Chapter 3 ‐ Review of EFA Strategies and Sector Management
Chapter 4 ‐ Emerging Challenges and Development Priorities
Chapter 5 ‐ Conclusion and Recommendations
The 2015 Review Report covers the period from 2000 to 2014. The report assesses the progress of Samoa’s
achievement towards the six EFA Goals, endorsed in 2000, at the World Education Forum in Dakar, Senegal.
The following are the six EFA goals, highlighting some of the content:
Early Childhood Education
ECE in Samoa is provided mainly by NGOs. The participation rate remains low, with the actual number
assumed to be higher because of the known existence of community‐run, unregistered pre‐schools.
Little is known about how equitable the current provision of ECE provision is or how good the quality of what is
offered for those enrolled. Anecdotally, the quality is highly variable as a result of many contributing factors.
Achieving Universal Primary Education
Most children go on to complete the full cycle of eight years of primary education. Primary drop‐out rates
have been low over recent decades, with current rates showing remarkably no children at all dropping out in
2013.
Life Skills and Lifelong Learning
In addition to formal schooling, civil societies play an important role in the delivery of basic education. These
include ‘ā’oga faifeau’ that supplement regular education and NGOs and church groups that provide second
chance educational programs for early school leavers.
MESC has incorporated into schools practical subjects and TVET programmes to meet the learning needs of all
students and of the economy.

8 | P a g e
The 2011 Census indicated that 5.7 percent of the economically active persons 15 years and over were not
employed. Majority of this number are males accounting for 67.1% while female accounted for 32.9%.
Literacy
The official reported literacy level of Samoans is very high. The results of the 2011 Population and Household
Census Report indicated that 98 percent of the populations 15‐24 years old are literate with females a little
more literate than males.
Gender Parity and Equality
National and international policies and frameworks which focus on improving the situation of women and girls
do not reflect the situation in Samoa. Gender parity exists at the primary level, but at the secondary and
tertiary levels, females dominate enrolment. A concern also is that of the performance of boys. There is a
likelihood that more males will repeat and less likely to survive to Year 8. More males are less likely to
complete, secondary and tertiary education as compared to girls. There are concerns over reverse gender gap
due to links to higher risk of male unemployment, crime and violence against women and children.
Quality Education
Improving the quality of education is highlighted in the SDS and in the newly developed Education Sector Plan.
This priority is reflected in the formal formation of the Education Sector to promote the achievement of high
quality education and training to meet the national socioeconomic and cultural goals of the government and
country.
The quality of education is depended on several factors. Teacher shortage remains a challenge. Literacy and
numeracy rates need to be addressed. School facilities, equipment, teaching and learning materials, and
teacher training have improved over the years with the assistance of the Government and development
partners.

9 | P a g e
CHAPTER1
Introduction
1.1 Background1.1.1 Country Context
The Education Sector of Samoa serves a population of 187,8201 on a land area of 2,820 km2 (43% arable)
comprising the two main islands of Upolu and Savai’i and eight small islands. 76% of the population lives in
Upolu, with 20% in the urban area of the capital city, Apia.
Samoa is a middle‐income country with a per capita GDP of SAT$8,2992 in 2011, a population annual growth
rate 0.8% and a Human Development Index of 0.688, placing Samoa 99th out of 187 countries, in the medium
human development group. The 2008 Samoa Poverty Report highlighted education in regard to high user
costs, over and above school fees, and ‘with many young men in the rural areas being frequently less well
educated and thus unable to get anything but the lowest paid employment, if such employment is even
available. The cycle of poverty can therefore be perpetuated. Education is therefore one of the most critical
issues.’
Only around 12% of Samoa’s total population is engaged in formal paid employment. Two‐thirds of the
potential labour force is absorbed by subsistence village agriculture, a dominant sector in the Samoan
economy. Samoa is reliant on foreign imports and has a large trade deficit. The economy is largely driven by
tourism (20‐25% of GDP), remittances (25% of GDP), and foreign aid. Private sector growth is constrained by a
narrow resource base, including a scarcity of skilled labour.
Economic growth, averaging 1.7% per annum prior to cyclone Evan in December 2012, has now ‐ largely as a
result ‐ slowed to 0.8%. Employment has also been affected by a downturn in the manufacturing sector and a
reduction of the operations of Samoa’s single largest private employer (exporting motor vehicle parts) due to
the global downturn and the 2011 Japanese earthquake and tsunami. Agriculture and tourism are seen as
offering potential for growth in domestic consumption, exports and employment creation.
Samoa is widely seen as a model Pacific nation in terms of governance. Its policy framework encompass some
of the best in the region, including a comprehensive development strategy backed by an outputs‐based budget
linked to costed sector plans.
1.2 EducationDevelopment1.2.1 Role of Education in the Context of National Development
The Strategy for the Development of Samoa (SDS) is the basis for government ministries, corporations and
state owned enterprises to formulate their corporate plans and performance targets. The current SDS 2012‐
2016 has as its theme, “boosting productivity for sustainable development”, and its vision is “improved quality
of life for all.”
Education is crucial to the vision of “improved quality of life for all” under the current Strategy for the
Development of Samoa (SDS) 2012 – 2016, as the seventh SDS Key Outcome of ‘Improved Focus on Access to
Education, Training and Learning Outcome’. The aim is to increase and broaden access to education, ranging
from Early Childhood Education (ECE) to Post School Education and Training3 [PSET] in both formal and non‐
formal institutions as well as ensuring the gradual integration of inclusive education. It is envisaged that the
successful implementation of the key strategic areas will lead to improvements in other social areas such as
1Most of the data in this section is from the Samoa Bureau of Statistics 2011 Population and Housing Census
2 Extract from Samoa Bureau of Statistics 2011 Population and Housing Census in the Samoa Education Sector Plan 2013 – 2018. Apia, Samoa 3 Samoa Education Sector Plan (2013). Apia, Samoa
10 | P a g e
nutrition, better livelihood opportunities and ultimately reduced criminal activity.
SDS 2012‐2016 identifies the Strategic Areas for the Education Sector as follows:
1 Progress Quality teaching and learning at all levels;
2 Access to relevant educational and training opportunities at all levels;
3 Strengthen linkages between education and training development to national goals;
4 Improve coordination of planning and policy development at all levels; and
5 Upgrade facilities and resources and sustain efficient management across the sector.
SDS 2012‐2016 also lays an emphasis on the effective implementation of development strategies aimed at
seven national development goals. The third of these goals is ‘Improved Education Outcomes’. The SDS
notes moves toward a sector plan and sector‐wide Medium Term Expenditure Framework.
Over the years, the scope of institutions and agencies operating in the education sector has increased. The
number of Early Childhood Education (ECE) centres has increased. Schools and Post School Education and
Training (PSET) providers have expanded the scope of their work to include vocational skills and training.
The Public Sector Reform process involves strengthening performance and management capacity at all levels
of government, including the development of performance monitoring approaches. Education is identified as
a service, and one of the critical core functions of Government is to ensure that access to quality public
education is guaranteed for all Samoans.
1.2.2 Education in Samoa Today
The education sector comprises: government and non‐government primary and secondary schools; early
childhood education (ECE); post school education and training (PSET) of which the largest provider is the
National University of Samoa (NUS); and the policy, planning and regulation bodies – MESC for schools and
ECE, and the Samoa Qualifications Authority (SQA) for PSET.
Early Childhood Education
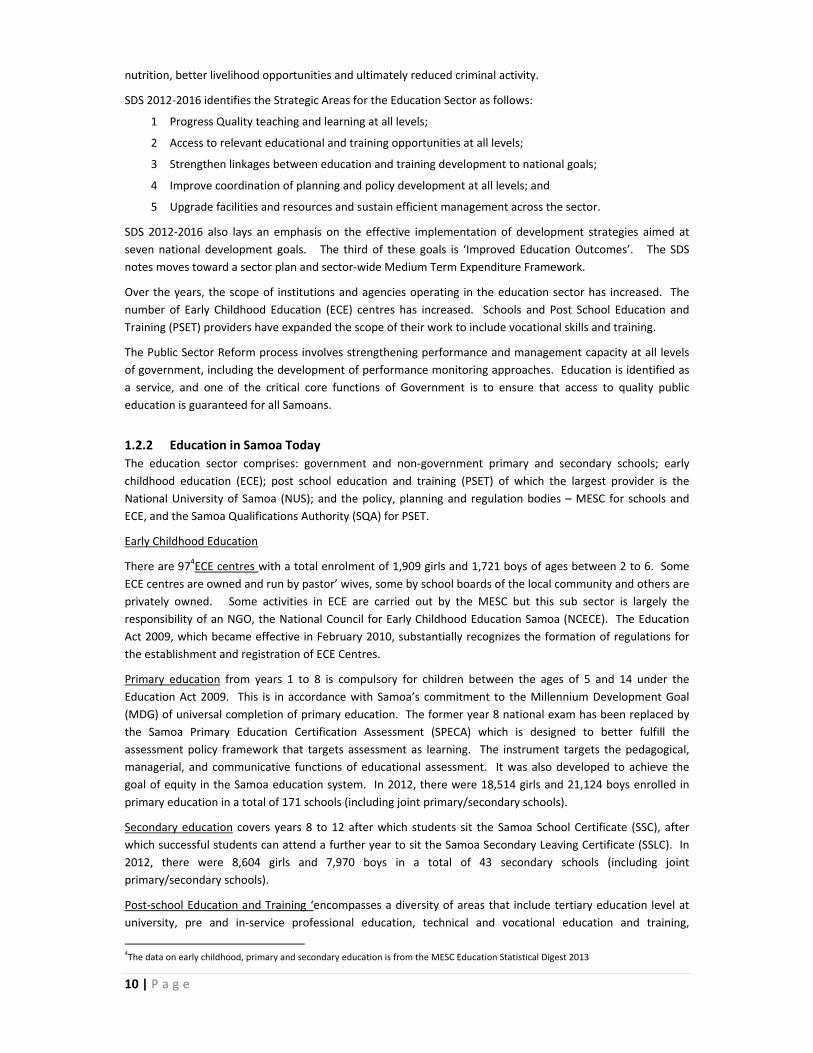
There are 974ECE centres with a total enrolment of 1,909 girls and 1,721 boys of ages between 2 to 6. Some
ECE centres are owned and run by pastor’ wives, some by school boards of the local community and others are
privately owned. Some activities in ECE are carried out by the MESC but this sub sector is largely the
responsibility of an NGO, the National Council for Early Childhood Education Samoa (NCECE). The Education
Act 2009, which became effective in February 2010, substantially recognizes the formation of regulations for
the establishment and registration of ECE Centres.
Primary education from years 1 to 8 is compulsory for children between the ages of 5 and 14 under the
Education Act 2009. This is in accordance with Samoa’s commitment to the Millennium Development Goal
(MDG) of universal completion of primary education. The former year 8 national exam has been replaced by
the Samoa Primary Education Certification Assessment (SPECA) which is designed to better fulfill the
assessment policy framework that targets assessment as learning. The instrument targets the pedagogical,
managerial, and communicative functions of educational assessment. It was also developed to achieve the
goal of equity in the Samoa education system. In 2012, there were 18,514 girls and 21,124 boys enrolled in
primary education in a total of 171 schools (including joint primary/secondary schools).
Secondary education covers years 8 to 12 after which students sit the Samoa School Certificate (SSC), after
which successful students can attend a further year to sit the Samoa Secondary Leaving Certificate (SSLC). In
2012, there were 8,604 girls and 7,970 boys in a total of 43 secondary schools (including joint
primary/secondary schools).
Post‐school Education and Training ‘encompasses a diversity of areas that include tertiary education level at
university, pre and in‐service professional education, technical and vocational education and training,
4The data on early childhood, primary and secondary education is from the MESC Education Statistical Digest 2013
11 | P a g e
theological and providers of religious instruction, apprenticeship, non‐formal and on the job training’5. In
2011, a total number of 2,269 female students and 2,011 male students enrolled in formal PSET providers
either registered or listed with SQA.
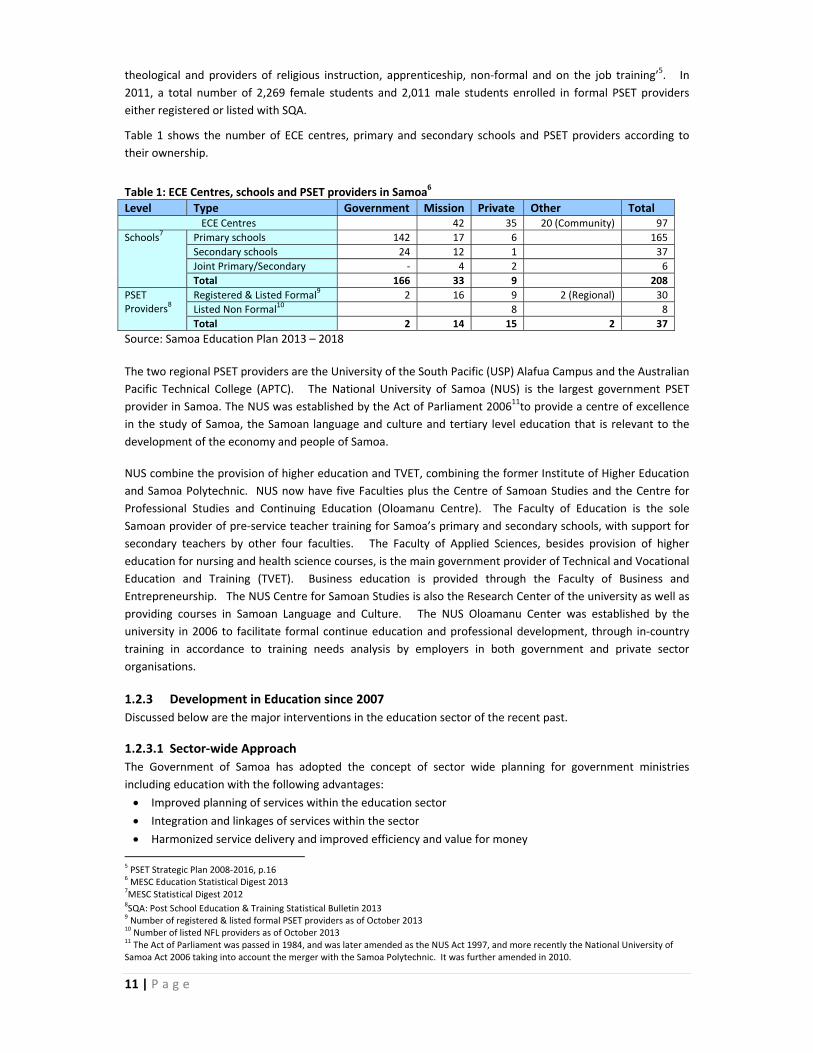
Table 1 shows the number of ECE centres, primary and secondary schools and PSET providers according to
their ownership.
Table 1: ECE Centres, schools and PSET providers in Samoa6
Level Type Government Mission Private Other TotalECE Centres 42 35 20 (Community) 97
Schools7 Primary schools 142 17 6 165
Secondary schools 24 12 1 37
Joint Primary/Secondary ‐ 4 2 6
Total 166 33 9 208
PSET Providers
8
Registered & Listed Formal9 2 16 9 2 (Regional) 30
Listed Non Formal10 8 8
Total 2 14 15 2 37
Source: Samoa Education Plan 2013 – 2018
The two regional PSET providers are the University of the South Pacific (USP) Alafua Campus and the Australian
Pacific Technical College (APTC). The National University of Samoa (NUS) is the largest government PSET
provider in Samoa. The NUS was established by the Act of Parliament 200611to provide a centre of excellence
in the study of Samoa, the Samoan language and culture and tertiary level education that is relevant to the
development of the economy and people of Samoa.
NUS combine the provision of higher education and TVET, combining the former Institute of Higher Education
and Samoa Polytechnic. NUS now have five Faculties plus the Centre of Samoan Studies and the Centre for
Professional Studies and Continuing Education (Oloamanu Centre). The Faculty of Education is the sole
Samoan provider of pre‐service teacher training for Samoa’s primary and secondary schools, with support for
secondary teachers by other four faculties. The Faculty of Applied Sciences, besides provision of higher
education for nursing and health science courses, is the main government provider of Technical and Vocational
Education and Training (TVET). Business education is provided through the Faculty of Business and
Entrepreneurship. The NUS Centre for Samoan Studies is also the Research Center of the university as well as
providing courses in Samoan Language and Culture. The NUS Oloamanu Center was established by the
university in 2006 to facilitate formal continue education and professional development, through in‐country
training in accordance to training needs analysis by employers in both government and private sector
organisations.
1.2.3 Development in Education since 2007
Discussed below are the major interventions in the education sector of the recent past.
1.2.3.1 Sector‐wide Approach The Government of Samoa has adopted the concept of sector wide planning for government ministries
including education with the following advantages:
Improved planning of services within the education sector
Integration and linkages of services within the sector
Harmonized service delivery and improved efficiency and value for money
5 PSET Strategic Plan 2008‐2016, p.16
6 MESC Education Statistical Digest 2013
7MESC Statistical Digest 2012
8SQA: Post School Education & Training Statistical Bulletin 2013
9 Number of registered & listed formal PSET providers as of October 2013
10 Number of listed NFL providers as of October 2013
11 The Act of Parliament was passed in 1984, and was later amended as the NUS Act 1997, and more recently the National University of
Samoa Act 2006 taking into account the merger with the Samoa Polytechnic. It was further amended in 2010.

12 | P a g e
Providing a strategy for sectoral development and priority setting for government
Facilitating international development assistance to support the Government of Samoa priorities
Providing support to the sector member agencies
Coherent collective advice to the Ministry of Finance (MoF) on how best to allocate funds to the sector
Provision of information and promotion of developmental priorities on behalf of the sector as a whole
The Education Sector comprises all providers of education and training both formal and non‐formal as well as
all government agencies that have responsibility for policy, planning, funding and quality assurance. The
sector covers four levels of education namely:
Early Childhood Education (ECE);
Primary schools;
Secondary schools;
Post school education and training (PSET), which includes Higher Education.
1.2.3.2 Education Sector Plan (ESP) July 2013 – June 2018
The ESP 2013‐2018 reflects the government’s concern and policies for the educational welfare and
development of all our people. It brings together previous macro‐level national plans that did not recognise
Education as a sector of its own. In doing so, it aims to ensure that education makes a positive and permanent
contribution to our national development plans and to achieving the international development goals. Driven
by the continuing need for improved access, equity for all and provision of quality educational opportunities,
the ESP 2013‐2018 also reflects our determination that lasting benefits will only be derived through improved
efficiency, effectiveness and value for money.
1.2.3.3 Education Sector Programme II
The goal of ESP II is the establishment of a more equitable and effective education system that enhances
learning outcomes of young people for further study, work, and adult life. The programme has 5
components12: (i) curriculum reform and assessment systems; (ii) developing effective teachers; (iii) improving
access to quality education; (iv) strengthening capacity to undertake research, evaluation, policy analysis and
planning; and (v) strengthening capacity to implement and manage development projects. Added to these
components is component 6 known as SchoolNet focusing on enhancing quality of education by delivering the
curriculum, assessment, learning materials, teacher training and learning through information and
communications technology (ICT). Highlights of the achievements of ESP II:
New bilingual primary curriculum
One of the major reforms being implemented is the introduction of a New Bilingual Primary Curriculum. This is
complemented by the development of a Bilingual Policy. The policy not only focuses on the English language
but also places emphasis on the Samoan language.
The new outcomes‐based curriculum is student‐oriented and contextualized to the changing needs of Samoan
students and society. It clearly outlines the need for Samoan to be taught from Year One to Year 13 to ensure
that our students retain and learn about the importance of our language and to master the basics from an
early age. Being able to read and write in Samoan is a major contributing factor to success in all other subjects.
National Teacher Development Framework (NTDF)
12 Samoa Education Sector Plan July 2013 – June 2018

13 | P a g e
The quality of the teaching force is one of the many factors determining student‐learning achievement. A
NTDF is a comprehensive system for development and management of high quality school teachers. It
includes the development and implementation of legislation governing registration, standards, remuneration
and a professional development strategy13. It aims to improve quality by improving teachers’ commitment,
motivation and morale as well as their professional skills.
The NTDF provides a policy framework for teacher management, professional standards and development as
well as conditions of work and salary negotiations. Implementation enables the Teachers’ Bill to formalise the
establishment of the Teachers Commission and the enforcement of the Teacher Registration system.
The implementation of the NTDF enables the teacher appraisal process, and to diagnose teacher development
needs and to monitor teacher practices and to evaluate the impact of student learning.
1.2.3.4 Samoa School Fees Grant Scheme (SSFGS)
Primary:
SSFGS was launched in 2010 with financial and technical assistance from the Governments of Australia and New Zealand to provide grants to primary school in lieu of school fees. Originally supporting the establishment and implementation of Minimum Service Standards (MSS), its targets14 include:
(a) The reduction of the financial burden of schooling for parents, and
(b) Transferring part of the responsibility of school performance to schools through reliable funding of
school improvement plans to meet MESC’s MSS.
The programme includes the transfer of funding from development partners to MESC’s budget with donor
funding to cease in financial year 2014/2015.
Since the beginning of the scheme, there have been tremendous improvements in terms of resourcing schools
with learning and teaching materials. School Principals are empowered to make decisions on key priorities to
purchase to support learning in the classrooms. The SSFGS has also fostered better working relationships
between schools and their communities. In the long term, it is envisaged that the investment will contribute
to the improvement of learning outcomes in our primary schools. As well, there has been an increase in the
enrolment numbers in the different year levels.
Secondary:
The secondary scheme was launched in July 2013 to extend school fee grant to secondary schools with
financial assistance from the Government of New Zealand. The programme involves a gradual transfer of
funding from development partners to MESC’s budget, with donor funding to cease in the financial year
2016/2017.
The scheme is only in its first year of implementation, and has been instrumental in providing the needed
resources for the schools. Principals are empowered to make decisions on what the priorities of the school
are, to assist in procuring learning materials to support learning in the classroom.
1.2.3.5 Samoa Inclusive Education Demonstration Programme (SIEDP)
SIEDP is a 5 year project with funding from the Government of Australia. Implemented from 2009 – 2014, the
project demonstrates a model of service provision for girls and boys with disabilities for inclusive education
which can be replicated and supported by the Government of Samoa in its future programme development.
13 National Teacher Development Framework
14 Samoa Education Sector Plan July 2013 – June 2018, p. 16

14 | P a g e
In the implementation of SIEDP, an enabling environment for inclusive education is further developed, with
the aim to reach those children and young people currently not in education. This includes students with
disabilities, and those from families’ living in disadvantaged circumstances who have not been able to ensure
their children’s participation in education. Current work focuses on primary and secondary education with the
inclusion of boys and girls with disabilities from rural and remote areas.
The delivery of this programme has been unique with the use of service providers that specialize in working
with children with disabilities.
The programme focuses not only on facilitating access to mainstream schools for children with a disability, but
also ensuring that the institutions are equipped to take on the children’s needs to retain them and provide a
quality education.
1.2.3.6 Pacific Benchmarking for Education Results (PaBER)
The PaBER Program is an initiative that was endorsed by the Pacific Forum Education Ministers Meeting
[FEdMM] in October 2010, funded by AusAID for a pilot of three countries to look into ways to improve literacy
and numeracy. The program involves Papua New Guinea, Solomon Islands and Samoa. The aim of the PaBER
program is to improve literacy and numeracy levels of children in the Pacific region. It will equip policy makers
in Pacific countries with the information and knowledge to drive interventions that will have a real effect on
learning results.
PaBER has conducted the first round of Pacific Islands Literacy and Numeracy Assessment (PILNA) Testing and
the results have shown a need to relook at the implementation of policies that impact on teaching. These
include benchmarking on four key policy domains: (a) Teacher Quality; (b) Curriculum and Materials; (c) School
Governance and Management; and (d) Assessment Systems.
1.2.3.7 Minimum Service Standards (MSS)
The call for quality improvement in education is not new. It forms the basis for the Whole School Approach to
school Improvement. It brings about three new initiatives to be applied at school level which were: (a) a
cyclical annual School Improvement Model; (b) Improvement in the management and organization of the
school; and (c) a performance management system linked to school improvement, professional development
and MESC priorities.
MSS are the basic expectations of those conditions in a school that will achieve for the learners a quality
education. The four areas specified in the MSS: (i) School Environment; (ii) School Management and Learning;
(iii) Teacher Professional Knowledge, Practice and Values; and (iv) Student achievement. These areas taken
together, the MSS indicate the status of the performance of a school achieving the MSS or quality education.
The implementation of the MSS has allowed schools to improve their school environments both in the physical
surroundings and classroom teaching and learning. It has also encouraged teachers to reassess their
professional pedagogical needs.
1.2.3.8 Samoa Primary Education Certification Assessment (SPECA)
The former Year 8 national examination has been replaced by the Samoa Primary Education Certification
Assessment which is designed to better fulfill the assessment policy framework that targets assessment as
learning. The instrument targets the pedagogical, managerial and communicative functions of educational
assessment. It was also developed to achieve the goal of equity in the Samoa education system so that the
assessment will no longer be used for selection into secondary schools.

15 | P a g e
1.2.3.9 Samoa Secondary Leaving Certificate (SSLC)
The Samoa Secondary Leaving Certificate replaces the regional Pacific Senior School Certificate (PSSC) that was
administered by the Secretariat of the Pacific Board for Educational Assessment (SPBEA). The development of
the localization started in 2012 with the Internal Assessment component fully administered in Samoa to make
way for the full localization of the examination in 2013. All examinations are locally set and marked.
1.2.3.10 SchoolNet and Community Access Project
The SchoolNet and Community Access Project is funded by a grant from the Asian Development Bank [ADB] to
improve the quality of education and teacher support in Samoa through interconnection of local schools and
creation of community access facilities, and to enhance an enabling environment for poverty reduction in the
rural communities of Samoa by improving the quality of education outcomes by strengthening teacher
competence training/program through providing ICT connection to local schools and creation of community
access facilities.
Equipment and e‐resource s have been delivered, and installed in senior secondary and colleges around the
country. Teachers and students are using the equipment and e‐resources to further understanding and easy
access to learning materials.
1.3 EducationalPoliciesandLaw
1.2.1 Samoa Constitution
The Constitution of Samoa was adopted in 1961 and enacted in 1962. The Constitution guarantees the right to
education, but does not specifically indicate it. However, it implies that education should follow bilingualism.
1.2.3 National Policies and Laws
These are the major policies and laws that guide education in Samoa:
1.2.3.1 Bilingual Education Policy
The vision for Samoa’s education system is bilingualism. It seeks to ensure additive bilingualism, that is, the
continuing development and maintenance of Samoan language whilst acquiring English with both languages
developing high levels of proficiency.
The goal of the new Samoan bilingual primary curriculum is for students to be able to learn the content of all
their subjects in both English and Samoan. It is often felt that the teaching of the language will only occur in
the actual language subject classes, and in the other content classes language is not important. However, in a
system where there is just one language, it now recognized that a great deal of the learning that takes place in
the content classes is actually language related.
The policy distinguishes between two situations:
where English and Sāmoan are taught as subjects, or as languages to be learnt by the student
where English and Sāmoan are used as languages for the teaching of another subject (e.g. maths).
The key provision addressed by the new policy is the ‘language of instruction’ or the ‘medium of instruction’
provision. These are stipulated below:

16 | P a g e
Figure 1: Medium of Instruction (MoI) Provision
Source: MESC, Bilingual Education Policy Handbook.
1.2.3.2 Compulsory Education Act 1991/1992
The Compulsory Education Act was in place since 1992 but not strictly enforced. The Act stipulates that
children between the ages of 5 – 14 should be at school. They are to remain in schools until they complete
Year 8 or earlier if reaches the age of 14 years.
Initiatives in place to address the enforcement of compulsory education include the realization of the
Education Act 2009 allowing government to fine parents for children not at school. In 2010, the SSFGS was
introduced to assist parents financial to cover payment of school fees.
1.2.3.3 Education Act 2009
The Education Act 2009 binds the State to regulate and makes provision for school education and early
childhood education in Samoa. The Act enforces compulsory education between 4 years to 14 years old. It
also makes provisions for Special Needs Education and Early Childhood Education.
1.2.3.4 Samoa Education Sector Plan July 2013 – June 2018
The Education Sector Plan July 2013 – June 2018 brings together the forward plans of the MESC, the SQA, and
the NUS, together with the arrangements and monitoring these plans. It strengthens Samoa’s Sector Wide
Approach [SWAp]15, involving all stakeholders in tackling the development needs of the education sector in
Samoa. Education is the key to the SDS including the need to improve employment prospects and reduces the
scarcity of skilled labour that constraints private sector growth.
The vision of the sector plan is that all people in Samoa are educated and productively engaged. The mission
of the agencies supporting the sector is: to promote the achievement of high quality education and training to
meet the national, economic, social, and cultural goals of Samoa. The ESP has 5 goals, with associated Sector
Outcomes to be achieved by 2018.
1.2.3.5 Strategy for the Development of Samoa 2012 – 2016
The SDS presents Samoa's development vision, its medium-term national development goals, and the key development strategies and priority sectors for the development of Samoa. It is a development
agenda for the government, national stakeholders and development partners.
15 Education Sector Plan July 2013 – June 2018. p. 7

17 | P a g e
1.2.4 International and Regional Frameworks
The notion of lifelong learning and the need for a holistic and integrated education system is stressed in a
number of international and regional frameworks that Samoa has committed to. These are the Pacific Plan
(2005), Education for All (EFA 2000), Pacific Forum Basic Education Action Plan (FBEAP 2001), Millennium
Development Goals (MDGs 2001), and the Decade of Education for Sustainable Development (DESD 2005).
Samoa is also a signatory to the Convention for the Rights of the Child and the Convention for the Elimination of
All Forms of Discriminations against Women.
EFA focuses on ways of providing basic education to everyone; the MDGs emphasise the challenges of poverty
and provide a set of tangible and measurable development goals within which education is a significant input
and indicator; the FBEAP stresses the role of basic education in achieving a higher level of personal and society
security and development; and DESD promotes a set of underlying values, relational processes and
behavioural outcomes which should characterise learning in all circumstances.
The primary context of the implementation of all these initiatives is the national level. To ensure maximum
impact is attained, there needs to be closer monitoring and coordination between the national level strategies
to meet these initiatives. All sectors are integral to the achievement of these international and regional
frameworks.
1.2.4.1 Convention for the Rights of the Child (CRC)
Samoa ratified the CRC on the 29th of November 1994 thereby making a commitment to the child’s right to
education as stipulated in Article 28 of CRC. Education is recognised to be essential for all children. The article
stresses the ‘right must be achieved on the basis of equal opportunity’.
1.2.4.2 Convention for the Elimination of All Forms of Discriminations against Women (CEDAW)
Samoa acceded to the CEDAW on the 24th of September 1992. Article 10 of the CEDAW was stipulated to help
women receive all forms of education, health and family planning, to stop stereotyping in school books,
encourage the education of boys and girls together and to get women and girls’ full participation in sports. By
ratifying the convention, the Government acknowledges the strategic objectives contained within CEDAW
relating to the elimination of gender discrimination against girls and women.
1.2.4.3 Biwako Millennium Framework: Towards an Inclusive, Barrier‐free, Rights‐based Society
for Persons with Disabilities in Asia and the Pacific [BMF]
The Pacific Islands Forum leaders meeting in 2003 confirmed and endorsed the BMF as a guiding framework
for addressing issues of human rights and inclusion of people with disabilities in the Pacific. The Forum also
endorsed recommendations of the Pacific Islands Forum Education Ministers who also met in the same year,
and made a number of recommendations concerning the improvement of education for children with
disabilities.

18 | P a g e
CHAPTER2
AnalysisofSixEFAGoals
Article 26 of the 1948 Universal Declaration of Human Rights states that “everyone has the right to education.” Not only is education a basic human right, it also equips individuals with the skills and knowledge to lead better lives and underpins human development. But education is still not a right recognised by all, and many who miss out on education miss out on the opportunity to improve their lives.
The Education for All movement is a global commitment to provide quality basic education for all children, youth and adults. The movement wanted to bring the benefits of education to “every citizen in every society” to improve educational opportunities in the primary schools and a massive reduction in adult illiteracy by the year 2000
In 2000, the Dakar Framework for Action, endorsing a comprehensive vision for education, anchored in human rights, and affirming the importance of learning at all ages and emphasizing the need for special measures to reach the poorest, most vulnerable and most disadvantaged groups in society by the year 2015. The six goals established in The Dakar Framework for Action, Education for All: Meeting Our Collective Commitments are:
THE EFA GOALS
Goal 1: Ensuring and improving comprehensive early childhood care and education especially for
the most vulnerable and disadvantaged children
Goal 2: Ensuring by 2015 all children have access to and complete, free and compulsory primary
education of good quality
Goal 3: Ensuring that the learning needs of all young people and adults are met through equitable
access to appropriate learning and life skills programmes
Goal 4: Achieving a 50% improvement in levels of adult literacy by 2015
Goal 5: Eliminating gender disparities in primary and secondary education by 2005, and achieving
gender equality in education by 2015
Goal 6: Improving all aspects of the quality and excellence of education with measurable learning
outcomes
The EFA goals also contribute to the global pursuit of the eight Millennium Development Goals (MDGs) adopted by
189 countries and the world’s leading development institutions in 2000. Two MDGs relate specifically to education
but none of the eight MDGs can be achieved without sustained investment in education. Education gives the skills
and knowledge to improve health, livelihoods and promote sound environmental practices.

19 | P a g e
2.1 EarlyChildhoodEducationandCare[ECCE]
Expanding and improving comprehensive early childhood care and education especially for the
most vulnerable and disadvantaged children
2.1.1 Introduction
ECE was first introduced in Samoa in the early 1970’s as a private undertaking and community initiative. Official
recognition of preschools by Government was given through a Cabinet Approval in 1976. Since then, there has been
a rapid growth of preschools, kindergartens and Early Childhood Centres in Samoa.
ECE centres are the responsibility of the private sector under the management of various non‐government bodies. In
2013, there were 97 ECE centres run by five NGOs as indicated in Table 2. These include the various churches and
religious groups, boards, women’s committee groups, individuals and organisations namely; (i) Methodist, (ii)
Catholic (iii) Faaea – as part of Congregational Christian church of Samoa (CCCS), (iv) Komiti Tumama, and (v) Private
ECE centers.
Table 2: Number of ECE Centres by Controlling Authourity, 2013
Source: MESC Statistical Digest 2013
Early childhood care provisions in Sāmoa vary considerably in their quality, accessibility to both students and parents,
and their professionalism. It is estimated that less than 10% of the current preschools in Sāmoa adhere to the
National Council of Early Childhood Services (NCECES) standards and less than 11% of preschool‐aged children in
Sāmoa attend a preschool. The NCECCES has not been rigorous in ensuring that preschools adhere to the NCECCES
standards prior to registration. As a result preschools have established themselves according to their own standards,
which quite often is well below par. During our visits, we found many of the preschools to be far too small and
under‐resourced to cater for their enrolments; preschools generally are not child‐friendly and have not been
designed with children in mind; there is no provisions for inclusive education, and certainly none of the preschools
are equipped to deal with students with physical disabilities, for example students in wheelchairs. Levels of
qualification and experience of preschool teachers varied considerably with few teachers actually able to produce
their teaching certification documents. Adherence to the ECCE curriculum also varies with most preschools never
having sighted the ECCE curriculum booklet. Protocols taught to the preschool staff through MESC workshops were
poorly followed; and it seemed that staff is slow to adopt new initiatives.
Funding for ECE is provided mainly by the communities through fundraising activities, churches and community
members, fees levied, donations and gifts from individuals and families, and donor agencies. An annual per capita
grant of $375,000.00 is provided by the Government to registered ECEs.
Training for teachers has been the responsibility of the NCECE Inc, the Council appointed by Government to oversee
ECE in Samoa, and the National University of Samoa’s [NUS] Faculty of Education [FoE]. More recently in 2013, the
Australia‐Pacific Training College [APTC] has offered a hands‐on 13 weeks course to up‐skill teachers and those
working in ECE centres. A second cohort of the programme will graduate in 2014.
2.1.2 Analysis
The overview of ECE in Samoa is shown in Table 3, indicating that 3,639 children attended ECE in 2013. In the same
year, 19% of ECE students entered primary school.

20 | P a g e
Table 3: Overview of ECE Response Reference year
Number of children under the official age of entry to primary school 3,639 2013
Percentage of children entering Grade 1 with ECCE experiences 19% 2013
Enrolment ratios in ECCE services disaggregated by sex 1:1 2013
Total public funding for ECCE services as % of GNP SAT535,000 2013
Existence of ECCE Act (legal base) Yes – Education Act 2009 2009
Early childhood education in Samoa is for children from two and half years old to five years old (if birth date falls
after 1st July of the school year). Programmes are administered under the umbrella of the NCECE. The MESC
continues to work collaboratively with the NCECE to: (i) monitor and enforce the ECE age requirement, (ii) to provide
pre‐service and in‐service professional development for teaching staff, (iii) provide ECE training Certificate for
interested candidates and (iv) monitor the effective implementation of curriculum guidelines and resource kits.
Financial assistance given to the NCECE from the Annual Government Grant is for the provision of stationery for ECE
centers and assistance in professional developments.
Table 4: GER for ECE
2000 2001 2002 2003 2004 2005 2006 2007 2008 2009 2010 2011 2012 2013
GER 97 96 100 86 80 75 104 97 87 86 73 79 73 73
GPI for GER 1.2 1.2 1.02 1.08 1.05 1 1 1.11 1.02 1.05 1.09 1.04 1.03 1.05
Source: MESC Statistical Digest 2013
GER as shown in Table 4 remained above 90% from 2000 until 2007, except in 2003 and 2004. It gradually declined from 2008 until 2010, reaching the lowest of 73 in 2012 and 2013.
GPI for ECE is above 1 over the years. This indicates that females dominate pre schools.
2.1.2.1 Access and Participation
Enrolment for ECE has fluctuated over the years, while the number of ECE Centres declined as shown by Table 5 and
6. As of July 2013, there were 97 registered preschools. A typical ECE Centre has the minimum number of children at
1516 per trained ECE teacher. ECE caters for approximately 3639 children aged between 2.5 – 5 years in 201317.
There is access variation across the country. A handful of pre‐schools are located in the urban area, the majority are
distributed throughout the rural villages. While each ECE Centre has its own origin and identity, its own aims and
policies, all are open to every child that wishes access to an early childhood education.
Table 5 shows that the number of ECE Centres registered with NCECES has declined over the years due to ECE
Centres failure to comply with national standards. Government has been pushing for one ECE Centre per village as
some villages have more than one ECE Centre causing poor attendance in some centres.
Table 5: Number of ECE Centres registered with NCECES, 2003 – 2013
2003 2004 2005 2006 2007 2008 2009 2010 2011 2012 2013
Number of registered ECE Centres
127 122 121 114 111 102 100 97 101 103 97
Source: MESC, ECE Database
The enrolment levels of children in ECE Centres as indicated in Table 6 have gradually decreased from 4,832 in 2003
to 3,674 in 2012, although highs were experienced in 2006 and 2007. Table 6 also showed that females dominate
ECE.
16 NCECES, Standards for Samoa Preschool, Apia, 2002
17 MESC, Education Statistical Digest, Apia, 2013

21 | P a g e
Table 6: Number of children enrolled in ECE, 2003 – 2013
GENDER 2003 2004 2005 2006 2007 2008 2009 2010 2011 2012 2013
Male 2321 2202 2135 2479 2197 2074 1993 1688 1915 1815 1796
Female 2511 2303 2137 2494 2438 2108 2087 1846 1999 1869 1878
TOTAL 4832 4505 4272 4973 4635 4182 4080 3534 3914 3684 3674Source: MESC, ECE Database
2.1.2.2 Quality and Efficiency
Child care‐giving in Samoa extends beyond the boundaries of ECE Centres, as families play an important role in this
aspect. ECE is typically seen as the main input for preparing children for primary school. For the purpose of this
indicator, we are focusing on child care‐giving in ECE Centres. The standards for Samoa Pre‐Schools states that a
class size must be:
A minimum of 15 students to one trained ECE teacher
The teacher/pupil ratio is 1:15
A maximum of 30 students to a trained ECE teacher in‐charge, with one assistant
ECE in Samoa is financed primarily by donations from community members, churches and tuition fees. The
Government of Samoa provides a per capita grant to preschools. This is 7.5% of $5,000,000.00 of a government grant
to mission, private, ECE and special schools.
ECE Centres offer ECE for children usually on average, for 4 days a week, operating at most, 3 hours a day. Essentially
each ECE Centre has their own programmes, timetables and schedule for implementation. Typically, however, the
ECE day includes language experiences, music, songs, games, and free play, both indoors and outdoors. Health and
good nutrition are encouraged. Some use both English and Samoan, and cultural values such as sharing and respect
for others are encouraged. In many ECE centres however, there is a predominance of academic and songs,
programmes are often formally structured with teaching methods tending towards rote learning and drilling.
In 2013, there were an estimated total of 311 teachers mostly females. ECE Centres employ their own staffs who are
paid by the fees levied, church donations and other funds. Some receive no remuneration and assistance by other
people mostly parents are offered voluntarily.
2.1.2.3 Measuring Disparities
There is a high percentage of enrolment in private ECE Centres. Table 7 shows that 50.3 percent of children enrolled
in ECE attend private ECE Centres. This is very high when compared with other providers.
Table 7: Distribution of children enrolled in ECE among community groups, 2012 – 2013
Group
2012 2013
Number enrolled % of enrolment Number enrolled % of enrolment
Methodist 742 21.2% 915 25.1%
Catholic 442 12.6% 399 11%
Komiti Tumama 83 2.4% 90 2.5%
CCCS – Faaea 472 13.5% 447 12.3%
Private 1,759 50.3% 1788 49.1%
TOTAL 3,498 100% 3639 100%
Source: MESC, ECE Database
2.1.3 Remaining gaps, issues and challenge
The major constraint facing ECE is the lack of a developmental policy framework with which to clarify resourcing, set
minimum service standards, ensure providers are registered and quality assured, and set out a strategic direction for
the sub‐sector.
22 | P a g e
The provision of a good and sound educational foundation in the early childhood years is crucial for future learning
and development of the children. This is fully recognized by the Government in its education policies. However, in
the medium and long term, Government and the Ministry will not have sufficient resources to directly and/or fully
fund early childhood institutions. Under the Strategic Policies and Plan nevertheless, measures proposed include
exploration of ways to fund ECE teachers’ salaries; encourage teachers to which the Ministry can affect
Government’s assistance, contribution and support to the development of early childhood education.
Funding to support ECE initiatives and development remains a concern. Remuneration for ECE staff has been a long‐
standing issue with some centres being able to afford salaries for staff while others depend on voluntary services.
There is an inadequate supply of ECE teachers to meet the needs of ECE centres. This adds to the problem of quality
of ECE teachers in many ECE centres. There is an increasing demand for opportunities for pre‐service and in‐service
training both locally and overseas.
2.1.4 Conclusion and way forward (including post 2015)
ECE development in Samoa today has been largely piece meal and uncoordinated. Although there is a national
coordinating body, it has not had strong and close relationships with MESC and has not proved effective in its
operations due to a lack of an ECE policy and the enforcement of ECE Standards.
As discussed, ECE development has been largely haphazard to‐date and grown to what it is without being
underpinned by policy and strategic direction. For these reasons, providing equitable access has not been possible.
Most children do not have the opportunity to access ECE.
The issues and challenges for ECE will continue to hinder developments if it continues to be the responsibility of the
NGOs. Government needs to consider taking ECE under its wings if ECE is to grow and provide a sound education in
the early years of a child’s life. An initial high priority will be the development of an ECE policy by MESC. With the
move to sector approach and formalising of ECE as part of the sector and subsequent budget allocations, we can
expect to see dramatic improvements in this sub‐sector.

23 | P a g e
2.2 UniversalisationofPrimaryEducation
Ensuring that by 2015, all children, particularly girls, children in difficult circumstances and
those belonging to ethnic minorities, have access to and complete free and compulsory primary
education of good quality.
2.2.1 Introduction
One of the goals of education in Samoa is the achievement of universal primary education. “Universal primary
education aims not only to expand access to primary education for all children, but also the improvement of the
education system’s internal efficiency so that all pupils actually complete the primary cycle”.18
Table 8 provides the overview of primary education. In 2013, there were 165 primary schools – 142 government
schools, 17 mission schools and 6 private primary schools. There were 39,578 students of which 21,124 were males
and 19,414 were females. The student‐teacher ratio for government schools was 28 students to one teacher while
mission schools had a ratio of 26 students to one teacher. Private schools had a lower ratio of 19 students to one
teacher when compared with government and mission schools.
Table 8: Overview of primary education, 2013 Government Mission Private Total
Schools 142 17 6 165 Students Males Females
33,525 17,647 15,878
4,990 2,423 2,567
2,023 1,054 969
39,578 21,124 19,414
Teachers 1,178 169 101 1,448 S/T Ratio 28 26 19 * Excludes combined schools Source: MESC, Education Statistical Digest 2013
2.2.1.1 Policies and Legislation
Compulsory Education
Primary education covers an eight‐year cycle from Years 1 to 8. The Compulsory Education Act has been in place
since 1991/1992, but has lacked enforcement. Legislation requires that every child is hereby required to have his
name enrolled on the register of some Government or registered school from the time he attains the age of five
years until either he attains the age of 14 years or sooner completes the work of Year 8.
Although penalties are set out in the legislation, none has been imposed due to several factors like limited human
resources and coordination of resources.
The recently passed Education Act 2009 seeks to give “attendance officers” the power to detain and question
children of compulsory school‐age who are not at school during school hours. The enforcement of compulsory
education legislation is also included as part of MESC’s SPP for July 2006 – June 2015.
Education Act 2009
The Act regulates and makes provision for school education and early childhood education in Samoa. The Act
enforces compulsory education for children between 5‐14 years old. It also gives careers the responsibility to ensure
that compulsory aged children are enrolled in a school and provides necessary requirements for the attendance of
compulsory aged children.
18 UNICEF, op. cit., p. 49.
24 | P a g e
The same legislation makes provision for the welfare of students both in a primary and secondary school and also in
ECE centres.
Samoa School Fee Grants Scheme [SSFGS]
Since the implementation of the SSFGS for primary schools in 2010, enrolment numbers have increased in the
various year levels. This has assisted families to send their children to school. It also assisted retention by removing
cost barriers to enrolment and to assist schools in meeting the Minimum Service Standards stipulated by the
Ministry. The SSFGS benefits students in 142 Government schools, 15 mission schools and 3 Special Schools.
2.2.2.2 Trends in Primary Education
Gross and Net Intake Rates (GIR/NIR) for Primary
GIR remained constant as shown by Table 8 from 2007 – 2013, despite a drop to 108 in 2012. This indicates a high
degree of access to primary education. It also indicates a high number of first timers into schools.
Table 9: GIR and NIR for primary education, 2000‐2013
Source: MESC Manumea Database
NIR gives a “precise” measurement of first‐time access to primary education of the eligible, primary school‐entrance
age population. As shown by Table 8, NIR was high in 2000 before it started to decline, and remained between the
68‐72% ranges. This indicates a low degree of timely access to primary education for the official school entrance age
children, and a low proportion of pupils of the same age in Year 1.
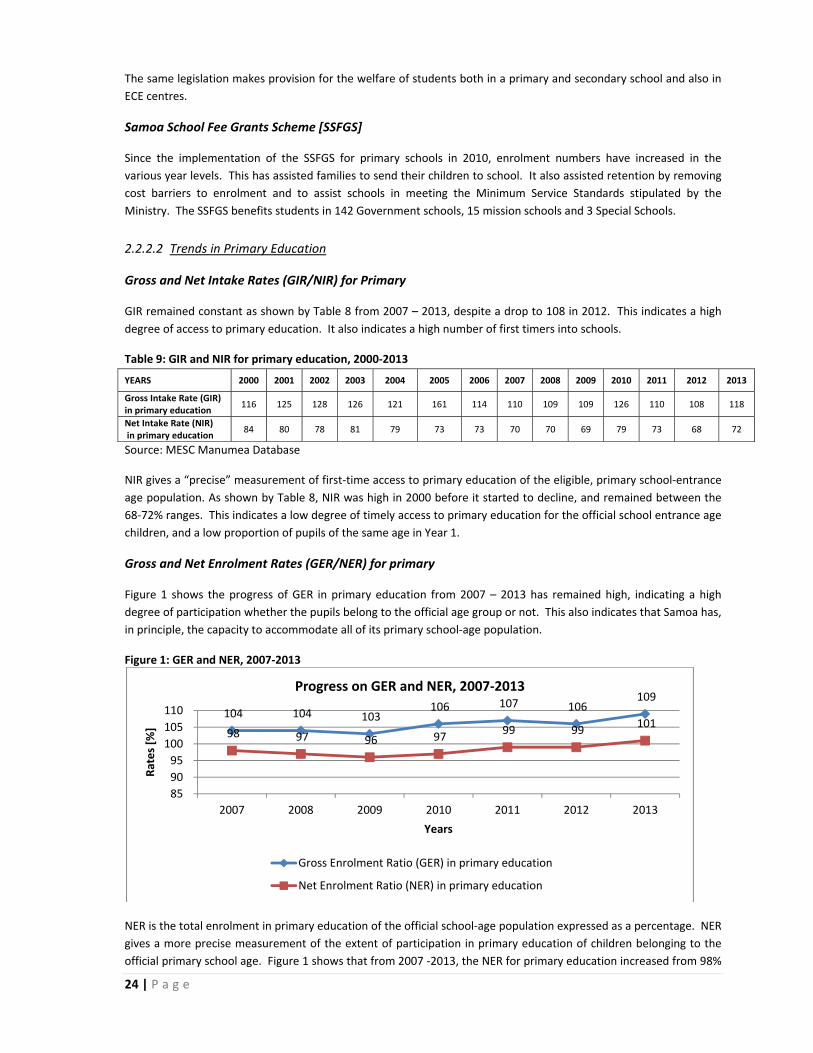
Gross and Net Enrolment Rates (GER/NER) for primary
Figure 1 shows the progress of GER in primary education from 2007 – 2013 has remained high, indicating a high
degree of participation whether the pupils belong to the official age group or not. This also indicates that Samoa has,
in principle, the capacity to accommodate all of its primary school‐age population.
Figure 1: GER and NER, 2007‐2013
NER is the total enrolment in primary education of the official school‐age population expressed as a percentage. NER
gives a more precise measurement of the extent of participation in primary education of children belonging to the
official primary school age. Figure 1 shows that from 2007 ‐2013, the NER for primary education increased from 98%
104 104 103 106 107 106
109
98 97 96 97 99 99
101
85
90
95
100
105
110
2007 2008 2009 2010 2011 2012 2013
Rates [%
]
Years
Progress on GER and NER, 2007‐2013
Gross Enrolment Ratio (GER) in primary education
Net Enrolment Ratio (NER) in primary education
YEARS 2000 2001 2002 2003 2004 2005 2006 2007 2008 2009 2010 2011 2012 2013
Gross Intake Rate (GIR) in primary education
116 125 128 126 121 161 114 110 109 109 126 110 108 118
Net Intake Rate (NIR) in primary education
84 80 78 81 79 73 73 70 70 69 79 73 68 72

25 | P a g e
to 101% in 2013, reflecting an improved participation levels of children of primary age in primary education over this
period, despite a negative drift from 2008 – 2010.
NER reached 101%19 in 2013 as the projected growth rate was 0.8%.
Table 10: Adjusted Net Enrolment Rate for primary education, 2007‐2013
YEARS 2007 2008 2009 2010 2011 2012 2013
Adjusted Net Enrolment Ratio (ANER) in primary education
99 100 96 98 100 100 10220
Source: MESC Manumea Database
ANER is adjusted net enrolment rate. ANER means the official primary age (5‐12 years old) as well as the students
aged 11 and 12 years old in secondary as a percentage of the official population primary age.
Repetition Rate [RR]
Repetition Rate is the proportion of pupils that repeat a year level. Repetition rate has decreased, as repetition is
discouraged in schools to ensure that the students learn systematically through the levels.
Table 11: Repetition rate for primary education, 2007‐2013
Primary 2000 2001 2002 2003 2004 2005 2006 2007 2008 2009 2010 2011 2012 2013
1.4 1.1 2.3 2.1 1.7 1.4 1.4 1.2 1.1 1 1 1.4 1 0.9 Source: MESC Manumea Database
Promotion Rate [PR]
Promotion Rate is the proportion of pupils or students who have successfully completed a grade and proceeded to
the next grade in the following year. Automatic progression is not practiced in Samoa. Table 12 details the
promotion rate in primary education by year level from 2007 – 2013. Promotion Rate in all year levels besides Years
8 to 9, and Year 1 to 2 is above 94 per cent, indicating a sound internal efficiency of the education system at these
year levels. The lower the promotion rate from Year 8 to 9 over the years indicates a low transition rate and a high
dropout rate.
The percentage of repeaters for primary schools has decreased from 2007 to 2010 and in 2011; it reaches a peak of
1.4 and started to decline again until 2013.
Table 12: Promotion Rate for primary education by Grade
Year Year Levels
1‐2 2‐3 3‐4 4‐5 5‐6 6‐7 7‐8 8‐9
2006‐2007 90 99 99 99 97 98 94 89
2007‐2008 92 98 101 97 97 97 97 89
2008‐2009 91 100 100 98 99 98 97 90
2009‐2010 96 102 99 99 98 101 98 89
2010‐2011 84 94 98 95 96 94 95 86
2011‐2012 92 99 99 96 98 97 99 86
2012‐2013 96 101 101 99 100 100 10121 89
Source: MESC Manumea Database
19 Samoa Bureau of Statistics projected growth rate used for 2012 onwards is 0.8%
20 ibid
21 Figures include repeaters as we do not separate repetition and new entrants

26 | P a g e
Drop‐out Rate
Drop‐out rate is the proportion of pupils or students who left school without completing a given grade in a given
school year. Drop‐out in all year levels besides Year 1 to 2 and Year 8 to 9 have a lower proportion of students
leaving school before completing the school year. This indicates a sound internal efficiency of the education system.
A higher drop‐out rate in Year 1 to 2 and Year 8 to 9 indicates a higher proportion of students leaving school before
completing the school year.
Primary drop‐out rates have been low over recent years, except 2010‐2011 which indicated a very high dropout rate.
The tsunami of late 2009 contributed to the high dropout rate for the 2010‐2011 periods. Students were affected
both mentally and physically, and often preferred to stay home rather than attending school. The drop in the 2011 ‐
2012 periods is attributed to the introduction of the SSFGS and the enforcement of Compulsory Education.
Statistics shows no child dropping out in 2013.
Table 13: Dropout Rate for primary education
Year
Year Levels
1‐2 2‐3 3‐4 4‐5 5‐6 6‐7 7‐8 8‐9
2006‐2007 6 0 0 0 2 1 5 9
2007‐2008 5 1 0 2 2 2 2 10
2008‐2009 6 0 0 1 1 1 3 9
2009‐2010 1 0 0 0 1 0 1 9
2010‐2011 11 5 1 4 4 6 4 12
2011‐2012 5 1 0 3 2 2 1 12
2012‐2013 0 0 0 0 0 0 0 0
Source: MESC Manumea Database
Survival Rate [SR] in Primary Education
Survival rate is the proportion of a cohort of pupils or students who reach each successive year level expressed as a
percentage of pupils enrolled in Year 1 of a given cycle in a given school year. Table 14 presents the survival rate to
Year 5, the end of middle primary and Year 8, the end of upper primary during the period 2007 – 2013. Table 14
shows a low survival rate to the last grade of primary due to high drop out in Years 1‐2 in earlier years.
Table 14: Survival Rate for primary education, 2007‐2013
Source: MESC Manumea Database
Survival rate to Year 5 has improved over the years reaching a record high of 92% in 2013. This indicates a high level
of retention and a low incidence of drop‐out with high internal efficiency.
Survival rate for Year 8 has improved although at a very slow rate. The level of retention is low and drop‐out high as
compared to survival rate to Year 5. The survival rate has started to improve since the SSFGS was implemented.
YEARS 2007 2008 2009 2010 2011 2012 2013
Survival Rate to Grade 5 in primary education
86 84 90 91 90 91 92
Survival Rate to last grade in primary education
85 81 81 83 81 84 87
Primary Cohort Completion Rate 85 81 81 83 81 84 87

27 | P a g e
Primary Cohort Completion Rate
The Primary Cohort Completion Rate [PCCR] is the estimated proportion of a cohort of pupils who complete the last
grade of primary education as a percentage of pupils enrolled in the first grade of a given cycle in a given school year.
PCCR as indicated by Table 14 has remained above 80 percent reaching a peak of 87% in 2013. This indicates a high
level of success in completing primary education as a result of high retention and low drop‐out incidences despite
13% of the cohort not completing primary education.
Transition Rate [TR] from primary to secondary education
The Transition Rate is the proportion of pupils or students who progress from the final grade of one level to the first
grade of the next level, expressed as a percentage of enrolment in the final grade of the preceding year. The
transition rate from primary to secondary as indicated by Table 15 has remained at the 80 – 90 percentiles indicating
the degree of transition or access to the next level of education. The transition rate is contributed to the students
who do not pass the Year 8 examination. In 2013, a replacement assessment for Year 8 sees the end of a selective
process to Year 9.
Table 15: Transition Rate for primary education, 2007‐2013
YEARS 2007 2008 2009 2010 2011 2012 2013
Effective Transition Rate (ETR) from primary to general secondary
education 89 89 90 89 86 86 89
Source: MESC Manumea Database
Table 16 shows transition rate from primary to secondary education by gender. It shows that there is an equal access to secondary education for both boys and girls. The rates remain around the 42 and 47 rates.
Table 16: Effective Transition Rate (Primary to Secondary)
2007 2008 2009 2010 2011 2012 2013
Male 45 44 45 46 44 46 47
Female 46 45 45 45 43 42 41
Source: MESC Manumea Database
Pupil/Teacher Ratio [PTR] for primary
The pupil/teacher ratio for primary schools in Samoa is 1:30. As can be seen in Table 16, the ratio has not been
breached since 2007. This signifies a smaller class, and that the number of students per teacher allows the teacher
to pay more attention to individual students, and thus contribute to better scholastic performance and learning
achievement. This indicator does not take into account all factors that could also affect the quality of
teaching/learning and pupil performance. It also does not take into consideration larger schools in the Apia Urban
area that are way above the maximum capacity of schools.
Table 17: Pupil/Teacher Ratio for primary education, 2007‐2013
YEARS 2007 2008 2009 2010 2011 2012 2013
Pupil/Teacher Ratio (PTR) in primary education
01:28 01:27 01:27 01:26 01:25 01:24 01:26
Source: MESC Manumea Database
Teacher Qualifications
The percentage of Primary teachers with Certificate qualifications has gradually decreased over the years. The trend
as shown by Table 18 will continue to decrease as the majority of these teachers are close to retiring. Diploma and
Degree holders are slowly increasing as teachers are encouraged to up‐skill and seek further professional training
and qualifications.

28 | P a g e
Table 18: Percentage of Teacher in primary education by level of academic qualification
Qualification 2007 2008 2009 2010 2011 2012 2013 2014
Certificates 18.5 17.5 16.7 15.7 14.5 13.3 12.8 12.1
Diploma 80.1 81.2 81.7 82.7 83.9 84.2 84.7 84.3
Bachelors 1.4 1.3 1.6 1.6 1.7 2.5 2.6 3.6
Source: MESC Pelican database
The percentage of primary school teachers having the required academic qualification to teacher at primary
education level according to national standards has decreased in the Certificate level while those holding Diplomas
have increased. This supports the Ministry’s stance on teachers to up‐skill their qualifications and develop
professional development.
Table 19: Percent of primary teachers with the required teaching qualification and approved national standards
Qualification 2007 2008 2009 2010 2011 2012 2013 2014
Teaching Certificate 18.3 17.2 16.5 15.5 14.3 13.1 12.6 11.9
Teaching Diploma 80.1 81.2 81.7 82.7 83.9 84.2 84.7 84.3
Source: MESC Pelican database
Compulsory and free education for children with disabilities
Primary education is compulsory in Samoa, and enforced by the enactment of the Education Act 2009. As discussed
earlier, the Compulsory Education Act requires all children to attend school between the ages of 5 to 14 years. All
children including those with special needs are within this age group. However, as the legislation lacks enforcement,
there are children with special needs not enrolled in schools.
In 2013, there were 349 students with disabilities educated in schools throughout Samoa. MESC in 2013 started
collecting data for SNE, as it has been dependent on SNE institutions to provide data on SNE students. Out of 51429
students enrolled in schools in 2013, only 0.68% of that number are students with disabilities. Even though Inclusive
Education is in place to include disability students in normal schools, there is only a small portion of these students
attend normal schools.
NGOs still play the most important role in educating children with special needs. These NGOs are Loto Taumafai,
Fiamalamalama and SENESE. They are education centres for children with disability that operates as ‘special
schools’, in that they are segregated in both setting and most programmes. Mission and private schools are also
providers of education to some children with special needs.
Notably, Samoa is also a signatory to and has responded to the following plans and frameworks which relate to SNE:
The Asian and Pacific Decade of Disabled Persons with Disabilities
The Salamanca Statement and Framework for Action
The Biwako Millennium Framework
The PEDF
EFA
Public Expenditure of Primary Education Public expenditure on primary education had increased over the years since the FY 2006/2007 before it was reduced and stayed constant years later. Much of the money goes to teaching services, teacher development and stationery.

29 | P a g e
Figure2: Financing Primary Education
Source: MESC
2.2.2 Remaining gaps, issues and challenge
The constraints on achieving equity in the provision of primary schooling remain persistent. The key constraint
keeping children out of school or enrolling and then dropping out is related to families’ economic situation and the
open and hidden costs of educating a child.
At the primary level, it is recognized that there are still small numbers of hard‐to‐reach, vulnerable families living
very poorly in remote areas that are not sending their children to school despite legislations and incentives put in
place. Reaching all children with disabilities and enrolling them in appropriate education remains a challenge.
Today’s policy of increasingly including children with special needs in mainstream primary and secondary schools
brings different potential constraints ‐ teachers not yet with the knowledge and skills ( or the professional support)
to do justice to the disabled students in their school.
2.2.3 Conclusion and way forward (including post 2015)
Primary enrolment has remained relatively constant over the years. Net enrolment rates are high, but survival rates
are lower and declining. The latter is due to lack of parental support and low priority on education. The Compulsory
Education Act has been in place since 1992 but not strictly enforced. The Education Act 2009 was enacted in 2010
fines parents for children not in school. In 2010, the School Fee Grant Scheme covers full payment of fees for
primary education. Government’s strong commitment including budget support should reverse the trend in survival
rate.
1% 2% 2% 2% 2% 2% 2%
22% 21%
34%
45%41% 39% 41%
0%
10%
20%
30%
40%
50%
2006/2007 2007/2008 2008/2009 2009/2010 2010/2011 2011/2012 2012/2013
Financial Years
Corelation between Public Expenditure on Primary Education as Percentage of Total Government Expenditure and as a Percentage of GDP, FY 2006/2007 ‐ 2012/2013
Public currentexpenditure on primaryeducation as apercentage of GNP/GDP
Public expenditure onprimary education as apercentage of totalpublic expenditure oneducation

30 | P a g e
2.3 LifeSkillsandLifelongLearning
Ensuring that the learning needs of all young people and adults are met through equitable
access to appropriate learning and life skills programmes
2.3.1 Introduction
The focus is on education and training in terms of knowledge and skills needed for coping and managing one’s
everyday life at different phases of the life cycle.
One of the goals of education in Samoa is to “improve adult literacy and access to life skills and continuing education
for adults and youth”22. Further to this, the aims of the education sector include related objectives as23:
At primary level – promoting individual development such as encouraging independent and creative thinking; achieving an understanding of the need to protect and sustain the natural and cultural environment
At secondary level – developing cultural understanding such as knowledge and understanding of customs and values relating to people and property in faa Samoa; encouraging community development such as preparing for proper and effective participation as a member of the local and national community
At PSET level – enhancing provision for livelihood opportunities, self employment and income generation in PSET.
2.3.2 Analysis
Secondary education covers years 8 to 12 after which students sit the Samoa School Certificate, after which
successful students can attend a further year to sit the Samoa Secondary Leaving Certificate (SSLC). In 2012, there
were 8,604 girls and 7,970 boys in a total of 43 secondary schools (including joint primary/secondary schools).
NER for secondary remained constant around 68 – 72% as shown by Table 20, reaching a high of 725 in 2011 before
dropping again to 69% and 68% in 2012 and 2013 respectively.
Table 20: NER Secondary Schools
School Level 2008 2009 2010 2011 2012 2013
Secondary 70 70 70 72 69 68
Source: MESC, Manumea Database
Drop‐out rates increase as students enter and progress through the secondary school cycle. Table 21 show that
around 70% of children leave primary school and enter Year 9. Throughout the secondary cycle, drop out is
significant, as the table shows, although, over the long term, a slight decrease is evident. The highest drop‐out
unsurprisingly occurs from Year 12 to 13, when highly selective assessment (the Senior Secondary Certificate)
restricts entry for most.
The available data on enrolment and drop‐out cannot provide insight into the equity dimension of secondary school
access. Reliable analysis is not yet available on where those students not in school or dropping out live (in towns, in
rural and remote areas), whether or not they come from economically disadvantaged households, or whether they
have disabilities or learning difficulties, for example.
22 MESC, SPP, p. 12.
23 ibid., pp. 11‐14.

31 | P a g e
Table 21: Dropout Rates (percentage) by Year Level, 1995 – 2013
Source: MESC Statistical Digest 2013
The 2011 Census indicated that 94% of the economically active population of 15+ years of age were employed. Of
that number 73% were males and 27% were females. 35.6% of the employed population was engaged in subsistence
agriculture, farming and fishing. 46% of them are males, while 7.6% are females.
In the year 2011, 64% of females were involved in non‐economically active activities like domestic duties (68%),
attend school (52%), incapable (49%) and not stated (38%). Economically active or the Labour force (L) group consists
of all persons 15 years and over who were employed (E) and unemployed (U) during the reference period. Work was
defined as any activity concerned with providing the necessities of life. Furthermore, high proportion of men
engaged in subsistence work compared to women is expected in Samoa as men are more likely to deal with heavy
manual labour work outside the house such as farming and fishing activities.24
Table 22 indicates that 2,720 or 5.7 percent of the economically active persons 15 years and over were not
employed. Majority of this number are males accounting for 1,824 (6.8%) while female accounted for 896 (5.2%).
Unemployment for young people is on the rise. Measuring unemployment is a challenging task in Samoa because a
lot of excess labour is absorbed by subsistence agriculture. A high proportion of young people work as family
workers for free, which can be a semi‐disguised form of unemployment.
Table 22: Employment indicators, 2011 TOTAL MALE FEMALE ECONOMICALLY ACTIVE POPULATION [AGED 15+] 47,881 34,763 13,118
Employed population 45,161 32,939 12,222
Number employed in subsistence [agriculture, farming, fishing] 16,085 15,154 931
Percentage of employed in subsistence work 35.6 46.0 7.6
Number employed in non‐subsistence work 29,076 17,785 11,291
Unemployed population 2720 1824 896
Percentage of unemployed population 5.7 5.2 6.8
NOT‐ECONOMICALLY ACTIVE POPULATION [AGED 15+] 67,990 24,836 43,154 Percentage engaged in domestic duties 71.4
Percentage engaged in attending school 23.0
Percentage not capable of working 5.6
Source: SBS (2011) Population and Housing Census
Educational attainment for 15 years and over
Table 23 shows that about 87 percent of the population 15+ achieved the Pacific Secondary School Certificate (PSSC)
or less, 6 percent completed a Post‐secondary Certificate, 4 percent gained Diplomas, while only 3 percent of the
total had ever completed a first degree or higher qualification. The results indicate that Samoa still need to recruit
more qualified personnel for its workforce in‐order to lead and sustain its social and economic developments in the
future.
24 SBS. Population and Housing Census 2011. p.71-77
1 ‐ 2 2 ‐ 3 3 ‐ 4 4 ‐ 5 5 ‐ 6 6 ‐ 7 7 ‐ 8 8 ‐ 9 9 ‐ 1 0 1 0 ‐ 1 1 1 1 ‐ 1 2 1 2 ‐ 1 3
1 9 9 4 ‐ 1 9 9 5 6 0 0 * 1 0 * 2 0 * 1 6 9 5 3 9 4 2
1 9 9 5 ‐ 1 9 9 6 9 1 0 3 5 4 0 * 2 0 1 5 9 3 8 4 9
1 9 9 6 ‐ 1 9 9 7 1 0 2 1 2 2 2 0 * 1 7 5 8 1 5 4 9
1 9 9 7 ‐ 1 9 9 8 9 1 0 5 1 5 0 * 1 6 1 0 9 2 5 4 2
1 9 9 8 ‐ 1 9 9 9 8 2 2 3 2 7 0 * 1 5 6 8 1 7 4 2
1 9 9 9 ‐ 2 0 0 0 6 0 * 1 3 2 5 0 * 1 1 1 0 1 2 1 7 4 7
2 0 0 0 ‐ 2 0 0 1 5 1 0 1 0 * 2 0 * 1 1 1 0 1 3 1 0 4 4
2 0 0 1 ‐ 2 0 0 2 7 0 * 0 * 2 0 * 1 2 1 0 9 1 5 6 3 9
2 0 0 2 ‐ 2 0 0 3 5 1 0 4 1 3 2 9 4 1 2 4 3 8
2 0 0 3 ‐ 2 0 0 4 8 0 0 1 2 3 3 9 1 1 1 4 1 5 3 1
2 0 0 4 ‐ 2 0 0 5 7 2 3 2 2 2 4 1 0 9 1 3 8 3 9
2 0 0 5 ‐ 2 0 0 6 8 4 1 2 4 2 5 9 9 1 8 3 4 1
2 0 0 6 ‐ 2 0 0 7 6 0 0 0 2 1 5 9 8 1 9 4 3 9
2 0 0 7 ‐ 2 0 0 8 5 1 0 * 2 2 2 2 1 0 9 2 0 6 4 0
2 0 0 8 ‐ 2 0 0 9 6 0 * 0 * 1 1 1 3 9 9 1 8 4 3 9
2 0 0 9 ‐ 2 0 1 0 1 0 * 0 0 1 0 * 1 9 9 1 5 6 3 5
2 0 1 0 ‐ 2 0 1 1 1 1 5 1 4 4 6 4 1 2 1 1 1 7 1 2 2 7
2 0 1 1 ‐ 2 0 1 2 5 1 0 3 2 2 1 1 2 1 1 1 7 5 2 5
2 0 1 2 ‐ 2 0 1 3 0 0 * 0 * 0 0 0 0 * 1 0 5 1 3 7 3 1
Y e a rY e a r L e v e l s

32 | P a g e
Table 23: Highest Qualification attained by Age Group and by Gender
Source: SBS: Population and Housing Census 2011
Post School Education and Training
The Post School Education and Training (PSET) sub‐sector of Samoa’s education system encompasses all learning that
occur outside of the formal early childhood, primary, and secondary education levels. PSET includes tertiary level
education at university, pre and in service professional education, technical and vocational education, theological
and providers of religious instruction, apprenticeship, non‐formal and on the job training. It encompasses diversity
of areas that include tertiary level education at university, pre and in‐service teacher education, technical and
vocational education, and professional education, non‐formal and on the job training.
In 2012 there were 5,259 (Figure 2) students enrolled at PSET Formal Providers, a 23% increase from 2011. NUS
enrolments (including the Apprenticeship Scheme) increased by 8% from the previous year whilst total Mission
Providers enrolments rose by 22%. Initial availability of data from USP was also one of the contributing factors to the
overall increase in student count.
Figure 2: Total PSET Formal Providers Enrolments, Figure 3: Total PSET Enrolment by Gender
2007 – 2012 2007 – 2012
Source:PSET Statistical Bulletin 2013
Over the past six years, the ratio of female to male students remained constant (Figure 3) with one in two students
being female. Available data for the period 2010 to 2012 has shown that female students are however more likely to
enroll in higher level programmes than male students. Gender gaps also exist in certain fields such as the Trades
areas where almost all of the students are male.

33 | P a g e
Figure 4: Enrolment by Programme of Study Figure 5: Field of Study by Gender 2012 2012
Source: PSET Statistical Bulletin 2013
Level of study – In 2012 (Figure 4), 25% students enrolled in degree level programmes and 72% below degree level.
Compared to 2011, degree level enrolments stood at 20% and below degree level was at 78%. 3% of students
enrolled in courses that did not necessarily lead up to a qualification (Non awards) in 2011 and 2012. Majority of
international students enrolled in Bachelors (71%) and Diploma (10%) level programmes in 2012. Two students
enrolled at USP in 2012 to undertake PhD level qualifications in the Agriculture field.
Figure 5 shows that in 2012, the proportion of females relative to males enrolled at PSET Providers was 51% and 49%
respectively. There were as many females studying full‐time and part‐time as male students. A higher proportion of
males (52%) than females (48%) were enrolled in Certificate and Diploma programmes however females were more
likely (60%) than males (40%) to enroll in degree level programmes. More male than female students however
enrolled in Masters level programmes.
Figure 6: Enrolment by Age Group and mode of Study, 2012
Source: PSET Statistical Bulletin 2013
Participation rates across all age groups remain low as shown by Figure 6. The highest participation was amongst the
20‐24 year olds with 12%. Four students enrolled in 2012 were below the age of 15. Information on the ages of 17%
of students enrolled in 2012 was not available. The majority (92%) of younger students (below the age of 24) who
enrolled in 2012 studied on a full‐time basis. In comparison, a slightly lower proportion (55%) of students aged 25+
studied on a full‐time basis.
Figure 6 shows that the majority of younger students (below the age of 24) enrolled in Certificate level programmes
whereas students aged 25+ were more likely to enroll in Bachelor programmes than in the other programme levels.

34 | P a g e
Technical and Vocational Education and Training [TVET]
Training for TVET is offered at tertiary and vocational institutions, the main being the Institute of Technology of the
National University of Samoa. TVET comprises of a range of programmes and courses offered at different levels.
In the secondary schools, TVET is offered as practical subjects including agriculture, food and textiles technology, arts
and crafts and design technology. Non‐government owned and operated institutions include Don Bosco Technical
Centre [Catholic Church], Laumua o Punaoa Technical Centre and Uesiliana College (Methodist Church), and the
Leulumoega School of Fine Art (Congregational Christian Church).
Nationally registered TVET Institutions
Table 24: Number and Types of Post School Education and Training Formal Providers Provider Type Name of PSET Formal Provider Registration Status
25
Government PSET
National University of Samoa Registered
Samoa Shipping Maritime Academy26
Registered
Private PSET
Apia Institute of Office Technology Not Registered
Early Childhood Education Teachers Training Institute27
Registered
June Ryan School of Music28
Not Registered
Le Iunivesite o Amosā o Savavau29
Not Registered
Martin Hautus Institute of Learning – Samoa 30
Registered
Oceania University of Medicine Samoa Registered
Pacific International Uni‐Tech 31
Not registered
Tesese Institute of Administrative Studies Registered
Samoa Institute of Secretaries and Administrators Not Registered
Small Business Enterprise Centres32
Registered
Mission PSET
Apia Harvest Centre Bible College Not Registered
Don Bosco Technical Centre Registered
Harvest Bible College Registered
Ierusalema Fou Theological Institute Not Registered
Laumua o Punaoa Technical Centre Registered
Leulumoega Fou School of Fine Arts Not Registered
Malua Bible School Registered
Malua Theological College33
Not Registered
Moamoa Theological College Not Registered
Piula Theological College34
Not Registered
RHEMA Bible Training Centre – South Pacific Registered
South Pacific Nazarene Theological College Registered
Uesiliana Technical and Vocational Center Registered
Vailima Fou Theological College Registered
Vailima Fou Theological College Registered
Worldwide Mission Training Centre Registered
Youth With A Mission35
Not Registered
Regional PSET
Australia‐Pacific Technical College36
Registered
University of the South Pacific Not Registered
TOTAL 30 PSET Formal Providers 54% Registered
Source: PSET Statistical Bulletin 2013
25 Registration status correct as of 31 March 2014
26 Provider not included in the Annual PSET survey 2013
27 Previously listed as the National Council for Early Childhood Education
28 Provider did not respond to the Annual PSET Survey 2013
29 Ibid
30 Ibid
31 Provider did not respond to the Annual PSET Survey 2013
32 ibid
33 ibid
34 Provider not included in the Annual PSET Survey 2013ibid
35 YWAM data not included in the PSET Bulletin as the Provider did not offer “Programmes” as defined
36 Provider did not respond to the Annual PSET Survey 2013

35 | P a g e
TVET Enrolment
Enrolment data for the period 2007‐2011 indicates a steady trend in PSET enrolment figures with student numbers
ranging from 4000 – 4500 as shown by (Table 25. Enrolment numbers for the NUS, as the only Government PSET
Formal Provider was steady from 2007‐2009 before dramatically increasing in 2010. A further increase in 2011 was
noted due to an influx in Foundation Programme students’ intake. A total of 3022 students enrolled at NUS in 2011
including students admitted under the Apprenticeship Scheme administered by the Ministry of Commerce Industry
and Labour (MCIL).
Figure 7 shows Private Provider enrolments have decreased since 2007 with a total of only 544 students enrolling in
2011. A downward trend was also noted for Mission Providers for the same period of 2007 – 2011 with a total
student intake of 704 in 2011. The data shows the Government as the leading provider of TVET programmes.
Table 25: Provider Enrolments, 2007‐2011
Source: PSET Statistical Bulletin 2014
Table 26: GER by Age Groups in PSET Providers
GER 15‐19 20‐24 25‐39 40‐59 60+
2010 2.9% 2.83% 1.37% 0.63% 0.04%
2011 8.6% 10.9% 1.7% 0.9% 0.2%
2012 7.9% 12.1% 2.01% 0.77% 0.98% Source: PSET Statistical Bulletin 2010, 2011, 2012, 2013
Table 26 above shows the GER by age group of all PSET formal providers. There is a huge increase in the number of
students in different age groups educated by different PSET providers, as indicated by the increase in GER from 2010
to 2011. The age group with the highest increase in GER from 2010 to 2011 is the 20‐24 years old participant at a rate
of 8.07%, thus signifies more students of that particularly age group are in PSET education. In 2012, GER increases in
all age groups except age group 15‐19 which showed a decline.
Figure 8 shows PSET enrolment by gender. The data demonstrates that there is a balance in the overall enrolment
between females and fames, despite a big variance in provider numbers.
Figure 7: PSET Enrolment Trends by Provider, Figure 8: PSET Enrolment Trends and Gender, 2007‐2011 2007‐2011
Source: PSET Statistical Bulletin 2013.

36 | P a g e
PSET Enrolment Formal Providers by Programme Type, 2011
In 2013, 5259 students enrolled in 28 PSET Formal Providers (not including APTC and YWAM) to undertake Post
School Education and Training with 2704 or 51.4% were females. The NUS (excluding Apprenticeship students)
enrolled 3121 students, 1783 or 57.1% were female.
Participation rate remain low for all age groups. The highest participation was amongst the 20‐24 year olds with a
12% rate. Four students enrolled in 2012 were below the age of 15. Information on the ages of 17% of students
enrolled in 2012 was not available/accessible.
Table 27: Participation Rate by Age Group, 2011 and 2012
Source: SQA (2012) PSET Statistical Bulletin 2013
The majority of students totaling 2446 [57.6%] were enrolled in the Certificate Programmes, 835 students [19.7%]
were enrolled in the Diploma and 845 [19.9%] in Degree level and higher. 120 students [2.9%] were enrolled in
courses that did not necessarily lead to the award of a qualification.
1708 of the total PSET enrolment were in the age group of 15‐19 years old which often represented students that
transition straight from schools to PSET. That is about 8.6% of the total population of age group 15‐19 enrolled in
PSET.
Table 28: PSET Enrolment by Programme Type, 2011
Source: SQA (2012) PSET Statistical Bulletin.
PSET Formal Providers – Graduates, 2007‐2011
The data shows an increasing trend in overall graduates from PSET during the period 2007‐2011 with an overall total
of 7956 students gaining PSET qualifications.
Table 29 indicates that between 2007 – 2011 55.7% of males achieved PSET qualifications. Private Provider graduate
figures have increased from 2007 to 2011 with an overall total of 593 students attaining qualifications. Mission
Provider graduate numbers also increased with over 1685 graduates during the 2007‐2011 periods. 1368 or 81.2%
were male. The Regional Provider APTC has produced a total of 867 graduates since opening in 2008. 286 or 33% of
graduates were females.
Graduate figures for NUS (including the Apprenticeship Scheme) during 2007‐2011 remained stable for the first four
years before dramatically increasing in 2011. A total of 4609 students graduated from NUS during the same five year
period, with a slightly higher number of 2460 or 53.4% of female graduates.
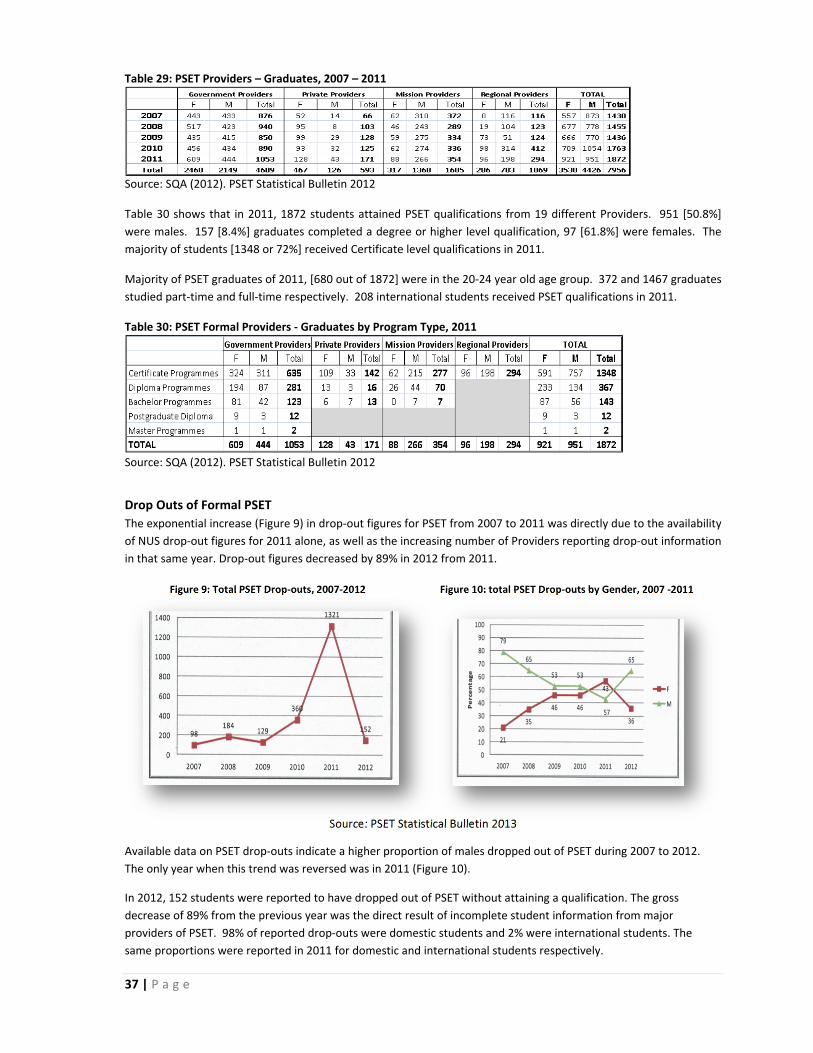
37 | P a g e
Table 29: PSET Providers – Graduates, 2007 – 2011
Source: SQA (2012). PSET Statistical Bulletin 2012
Table 30 shows that in 2011, 1872 students attained PSET qualifications from 19 different Providers. 951 [50.8%]
were males. 157 [8.4%] graduates completed a degree or higher level qualification, 97 [61.8%] were females. The
majority of students [1348 or 72%] received Certificate level qualifications in 2011.
Majority of PSET graduates of 2011, [680 out of 1872] were in the 20‐24 year old age group. 372 and 1467 graduates
studied part‐time and full‐time respectively. 208 international students received PSET qualifications in 2011.
Table 30: PSET Formal Providers ‐ Graduates by Program Type, 2011
Source: SQA (2012). PSET Statistical Bulletin 2012
Drop Outs of Formal PSET
The exponential increase (Figure 9) in drop‐out figures for PSET from 2007 to 2011 was directly due to the availability
of NUS drop‐out figures for 2011 alone, as well as the increasing number of Providers reporting drop‐out information
in that same year. Drop‐out figures decreased by 89% in 2012 from 2011.
Figure 9: Total PSET Drop‐outs, 2007‐2012 Figure 10: total PSET Drop‐outs by Gender, 2007 ‐2011
Source: PSET Statistical Bulletin 2013
Available data on PSET drop‐outs indicate a higher proportion of males dropped out of PSET during 2007 to 2012.
The only year when this trend was reversed was in 2011 (Figure 10).
In 2012, 152 students were reported to have dropped out of PSET without attaining a qualification. The gross
decrease of 89% from the previous year was the direct result of incomplete student information from major
providers of PSET. 98% of reported drop‐outs were domestic students and 2% were international students. The
same proportions were reported in 2011 for domestic and international students respectively.

38 | P a g e
79% of reported drop‐outs studied full‐time while 21% were part‐time students. The proportion of full‐time students
that dropped out in 2012 has decreased by 2% compared to reported 2011 figures while proportion of part‐time
students increased by the same amount in 2012 relative to 2011.
The majority (37%) of drop‐outs in 2012 enrolled in programmes under the Engineering & Related Technologies field.
A high percentage (34%) of students that studied in the Management and Commerce field also dropped‐out in 2012.
All three international students that dropped‐out studied in Society and Culture related programmes.
TVET teachers and facilitators by type of TVET Centers and/or programmes
Table 30: PSET Formal Provider Lecturers and Trainers by Gender and Highest level of Qualification Attained 2012
Source: PSET Statistical Bulletin 2013
In 2012, there were 328 (Table 30) PSET lecturers and trainers in Samoa, with the majority (48%) working in Mission
PSET Providers. The majority (32%) of PSET lecturers and trainers had attained Bachelors level qualifications, most
(54%) of who were employed by NUS. There were more male lecturers than females.
2.3.3 Remaining gaps, issues and challenge
Many PSET providers have insufficient organisational capacity to achieve quality standards. They are constrained too
by the inadequate knowledge and skills of many PSET lecturers and trainers, and also by a lack of budget to support
courses adequately.
In 2011, 32.9% of the 152 permanent lecturers and trainers at NUS had Masters degrees or PhDs. In 2011, 45.9 % of
lecturers and trainers employed by 4 Private PSET Providers had Diploma or a lower level of qualification as their
highest attained. The figure was 55.4% for those employed in 11 Mission PSET Providers. The degree holders are
largely concentrated in the Australia Pacific Technical College (APTC) and the bible/theological colleges.
Learning resource materials and equipment are also central to good quality higher education and TVET in particular.
If these resources are lacking in TVET, the learning shifts from an applied/authentic focus to a more theoretical
approach. Appropriate IT support and access to library facilities and resources are all key ingredients of PSET quality.
A critical constraint for all Samoan PSET providers is a lack of funds (for non‐salary expenditure). Without the
necessary funding on an ongoing basis, it is extremely difficult to keep equipment up to date.
2.3.4 Conclusion and way forward (including post 2015)
Lifelong learning becomes a key principle of education as renewed focus due to rapid economic demographic and
environmental changes requiring learners to continue to explore and master entirely new skills throughout life.
Lifelong learning is further supported by technological change, strengthening the concept of learning occurring in
multiple settings at any time. This, however, does not diminish the key role and mission of schools to support
learning. Education systems will have to reflect on how to best to harness and integrate informal learning that takes
place outside the classroom.

39 | P a g e
Societal and economic transformations have impacted education requirements. Education systems are called upon
to equip young people not only with traditional knowledge and skills, but increasingly with competencies and
attitudes to function in rapidly changing societies and labour markets. This means that education for the future
should go beyond academic achievements and cognitive skills to value ‘non‐cognitive’ and application skills and
competencies such as critical thinking, problem solving, collaboration, communication and technological literacy as
well as education for social cohesion.

40 | P a g e
2.4 AdultLiteracy
Achieving a 50 percent improvement in levels of adult literacy by 2015, especially for women,
and equitable access to basic and continuing education for all adults
2.4.1 Introduction
“Literacy is the ability to identify, understand, interpret, create, communicate and compute using printed and written materials associated with varying contexts. Literacy involves a continuum of learning in enabling individuals to achieve his or her goals, develop his or her knowledge and potentials, and participate fully in the community and wider society”37.
The GoS through its SDS for 2012 – 2016 made a commitment to improving the quality of education, at all levels, to achieve higher rates of literacy and numeracy. Through a review of its previous three‐year strategy, the Government learnt that educational outputs must include more functionally literate and numerate persons.38 One of the goals of education, under MESC’s SPP for July 2006 – June 2015, is to “improve adult literacy and access to life skills and continuing education for adults and youth”.
2.4.2 Analysis
Literacy is defined as the ability to read and write with understanding a simple statement of everyday life in any language. Hence someone who can only write his/her name and not able to write a sentence about his/her everyday life will not be considered literate. Likewise, someone who can read but cannot write will not be considered literate. In addition, someone who understands instructions but not able to read or write will not be considered literate
39.
The results of the 2011 Population and Household Census Report highlighted in Table 31 shows that 98 percent of the population 15‐24 years old40 was literate with females a little more literate than males41. Some factors apart from formal school that contributed to the high literacy in Samoa included informal schools by churches after formal school hours to teach reading and writing for young church members, the usual family prayer services in the evenings in traditional villages where bible reading and hymns singing are encouraged, and, the weekly Sunday schools, Youth programs and Choir practices where young church members attended as part of their normal routine of the week.
Table 31: Literacy Rate for Persons 15‐24 years of age, 2011
POPULATION LITERATE PERSON LITERATE RATES
AGE TOTAL MALE FEMALE TOTAL MALE FEMALE TOTAL MALE FEMALE
TOTAL 49659 25806 23853 48613 25074 23539 97.9 97.2 98.7
15 4587 2410 2177 4468 2339 2129 97.4 97.1 97.8
16 4180 2163 2017 4073 2079 1994 97.4 96.1 98.9
17 3920 2100 1820 3829 2033 1796 97.7 96.8 98.7
18 3616 1890 1726 3528 1819 1709 97.6 96.2 99.0
19 3511 1828 1683 3447 1782 1665 98.2 97.5 98.9
20 3041 1662 1379 2975 1613 1362 97.8 97.1 98.8
21 3216 1634 1582 3141 1585 1556 97.7 97.0 98.4
22 2891 1485 1406 2840 1447 1393 98.2 97.4 99.123 2838 1461 1377 2791 1433 1358 98.3 98.1 98.6
24 2847 1458 1389 2794 1423 1371 98.1 97.6 98.7
Source: Samoa Bureau of Statistics, Population and Housing Census 2011
37 Definition of literacy as agreed during a June 2003 meeting organized by UNESCO Institute for Education, the Basic Education Section of UNESCO
and the UIS. (2008) International Literacy Statistics: A Review of Concepts, Methodology and Current Data. UNESCO Institute for Statistics. Montreal. p.25 38 MOF, Strategy for the Development of Samoa 2012 – 2016.
39 Definition of literacy adopted by the Samoa Bureau of Statistics for the Population and Housing Census 2011 Report. Samoa Bureau of Statistics.
Samoa. p. 69 40 Literacy rate is collected by the SBS through the census, and having the head of the household responding yes to the question of whether the
person can read and write 41 This was the latest census conducted for Samoa by the Samoa Bureau of Statistics in 2011. Population and Housing Census 2011: Analytical
Report. Samoa.

41 | P a g e
Youth (15‐24 years old) literacy rates
The 2006 National Census reported that 90.5% of youths of 15 years and over in Samoa were literate. 89% were male and 92% were female. The most recent census in 2011 reported showed an improvement by 7.4%. For those 15 years of age and above, female literacy rate was 98.8% while male literacy rate was 97.2%42. This indicates that over a period of five years, there was an improvement in the literacy rates for adults.
Table 32: Youth Literacy Rate of 15 – 24 years old, 2006 and 201143 Census Year National Indicator Number Percentage (%) or Ratio
2011 Literacy rate (15 ‐ 24 years) 33,445 97.9
Male 17,363 97.2
Female 16,082 98.7
2006 Literacy rate (15 ‐ 24 years) 32002 90.5
Male 16913 89
Female 15089 92
Youth Literacy Rate has improved to 97.9% in 2011 from 90.5% recorded during the 2006 Population Census. This gives an estimate of 728 illiterate adult members aged 15‐24 years old amongst the Samoan Population. Literacy is generally considered as one of the generic skills required for employment.
Highest level of education completed or attained for 15 years and above
In terms of highest level of qualification completed, the 2006 National Census indicates that 55% of the adults (15 +)
population completed Secondary as their highest level of education attained and 11% completed Tertiary. After five
years, the 2011 National Census recorded that 51.4% (87%) of the adults population managed to complete
Secondary as their highest level of education and 41.6% (12%) completed Tertiary level. This indicates an
improvement in transition rate from secondary to tertiary, and a huge improvement of the adult population who
completed tertiary level education.
Adult literacy and continuing basic education programmes by type of programme
There are no specific programmes in Samoa to cater for adult literacy except for ongoing Basic Education Continuing
programmes conducted by different government ministries, cooperation and Non‐Government Organizations.
Table 33: Learners Participating in Adult Continuing Programmes, 2007‐2013 2007 2008 2009 2010 2011 2012 2013
654 330 2055 3374 8027 6030 8561
Source: PSET Statistical Bulletin 2012
The data in Table 33 shows that participants in adult continuing basic education programmes increased over the
years with the after a very low numbers at the earlier years of the start of the programme in 2007 and 2008.
This indicates that the participation and access of adults to continuing basic education programme is improving from
year to year
Completion rate in adult literacy and/or continuing basic education programmes by type of programme
It is the understanding that all those who participated in the above continuing education programmes have completed these short term (non‐formal) trainings they attended, except for the Apprenticeship Training Scheme (742 participants from 2007 to 2013), and the Trades Testing Scheme (121 participants from 2007 to 2013). Both these trainings are offered by the Ministry of Commerce, Industry and Labour.
42 SBS. Population and Housing Census 2011. p.69
43 Years of data availability is in line with the National Census

42 | P a g e
Bilingual Policy The bilingual policy of MESC was implemented through the new primary school curriculum and facilitated through
the use of a bilingual language handbook developed for this purpose. The intention of the policy was that Samoan
literacy would be established first in Years 1‐3, with English being introduced in Year 4 as a subject44. The medium of
instruction was Samoan up to Year 6. At Year 7, the medium of instruction switched to English with Samoan as a
subject only for two years before a national examination was sat in Year 8 in English. English is the sole medium of
instruction throughout secondary level.
The National University of Samoa (NUS) implemented a language policy, which made Samoan a compulsory subject for all Foundation Year students and ensured inclusion in the communication courses delivered at the Institute of Technology. The Centre for Samoan Studies (CSS) had developed and restructured its programme to allow the offering of a Bachelor of Samoan Studies (BSS) degree.
Improving Library Services The tsunami of September 2009 brought financial assistance to the Lepa/Lotofaga education district through a young avid reader and book lover who died during the tsunami. Funds were donated to set up the Atua‐Farmers Library fully resourced for the use by the students of the district schools. It also brought a bus to transport students from around the district to use the library.
Table 34: Transition Rate, 2006 ‐ 2012
Source: PSET Statistical Bulletin 2013
Table 34 shows the transition rate form Year 13 to PSET45. The rate has not been stable, despite an increase in intake.
Table 35: total Graduates by Provider Type, Gender and Age Group
Source: PSET Statistical Bulletin 2013
Table 35 shows that the majority of participants in PSET are in the age range of 15 – 19 years old. The majority are females attending government run institutions.
2.4.3 Remaining gaps, issues and challenge
Despite the achievements that have been made in sector development, Samoa continues to experience the
challenge of achieving sustainable improvement in quality of education. Literacy at all levels remains a challenge.
Adult Literacy is not widely documented, as there are no specific programmes to cater for adult literacy. Our main
source of data for adult literacy is from the Samoa Census of Population and Housing, taking place every 5 years. The
information is based on asking the respondents if they can read and write. The latest Samoa Census of Population
and Housing was conducted in 2011.
44 MESC SPP 2006 – 2015. p.34
45 Data is for NUS’ foundation Programme

43 | P a g e
School Literacy is measured by national examinations. Over the years, results have shown high percentage of at risk
students at both primary and secondary levels. The pattern is worse in SPELL 2 sat at Year 6 as compared to SPELL 1
sat at Year 4. This can testify that there is a lack of effective intervention strategies to address the issue, and that the
SPELL Test may not be a valid or reliable survey tool.
2.4.4 Conclusion and way forward (including post 2015)
There needs to be a more vigorous and hard push for improvement in literacy. Be it basic, in the school or adult
literacy. Literacy is community issue, and the community needs to provide support and assistance to assist students
at risk, in order for the cycle to be reversed. .
There are no specific programmes to cater for adult literacy, with the efforts of Providers focusing on continuing
programmes that is relevant to the daily needs of the community. These are the programmes conducted outside of
the formal education system, including tertiary level education at university, pre and in‐service professional
education, technical and vocational education, theological and providers of theological instruction, apprenticeship,
non‐formal and on the job training.

44 | P a g e
2.5 GenderParityandEquality
Eliminating gender disparities in primary and secondary education by 2005 and achieving gender equality in education by 2015 with a focus on ensuring girls’ full and equal access to and
achievement in basic education of good quality
2.5.1 Introduction
Gender policies in Samoa are found in MESC’s SPP for 2006 – 2015, Ministry of Women, community and Social
Development’s (MWCSD) policies, NCPF and also national curriculum statements requiring gender‐inclusiveness,
non‐sexism, and equity in terms of fairness in access, treatment and outcome. Strategies to promote gender
equality are outlined in Government ministries’ corporate plans and in NGO’s strategic plans. All these contribute to
the overall Strategy for the Development of Samoa. Other strategies are included in Samoa’s response to global
frameworks such as the UN Convention on the Elimination of All Forms of Discrimination against Women (CEDAW),
EFA, MDGs and the Commonwealth Plan of Action for Gender Equality 2005 – 2015.
Samoa’s gender policies and strategies during the last decade focused on the well‐being, participation and
advancement of women and girls, a concern that it echoed in the CEDAW, EFA, MDGs and the Commonwealth Plan
of Action for Gender Equality. There is an emerging awareness and concern over the underachievement of boys and
recognition of the need for a gender inclusive response in national initiatives that provides more choices and
opportunities for not only women, but also men, youth and children. One of the goals of education in MESC’s
current SPP is to address this situation because it impacts on the makeup of the work force and all other aspects of
society.
2.5.2 Analysis
Gender parity in education has been achieved but concern over the performance of boys, with males less likely to
complete secondary and tertiary education compared to girls. There are concerns over reverse gender gap due to
links to higher risk of male unemployment, crime and violence against women and children.
There is a significant equity issue inside schools too. There is growing concern about the education of boys. Boys are
over‐represented in literacy and numeracy at risk categories and in dropout rates at both primary and secondary
levels. The trend of boys outnumbering girls at secondary school has been evident since 1996 and it is still
continuing. Sixty three per cent of boys attend secondary education, compared with 78 per cent of girls. Girls also
make up the majority (59%) of enrolments in the PSSC Examination.
Early Childhood Education [ECE]
Figure 8 shows that ECE Enrolment declined over the years. A total of 4,635 children were enrolled in ECE centers in
2007, and gradually declining until 2010 and 2011, before declining again in 2012 and 2013. This corresponds to the
decline in the number of ECE centers over the years. Furthermore, it shows that there is a low degree of participation
of children in ECE.
Figure 8: ECE Enrolment by Gender, 2013
Source: MESC ECE Database
0
500
1000
1500
2000
2500
3000
2007 2008 2009 2010 2011 2012 2013
Enrolm
ent
Years
Early Childhood Enrolment 2007 ‐ 2013
Male
Female
10
20
30
40
50
60
70
2007 2008 2009 2010 2011 2012 2013
Percentage
Years
Percentage of ECE Enrolment 2007 ‐ 2013
Male
Female

45 | P a g e
Figure 9 shows that for 2012, there was equal representation of male and females in ECE. In 2013, there was a 2%
increase for females while males accounted for 48% of the enrolment. ECE intake for 2013 favoured girls.
Figure 9: ECE Enrolment by Gender, 2012 Figure 10: ECE Enrolment by Gender, 2013
Source: MESC Statistical Digest 2012 Source: MESC Statistical Digest 2013
Literacy gender Parity Index
As discussed in Goal 4, the 2011 census reported that the overall literacy rate for females was 98.7% while males
were 97.2%. The GPI for literacy is 0.94, which indicates that proportionately, there are fewer females than males
who are literate. There are more males who have literacy skills than females.
Ratio of Boys to Girls
Table 36 shows that males dominated enrolment in primary. . This means that there are more males than females
enrolled in primary education. The rate fluctuates between 47% and 49%. In secondary education, more females are
enrolled than males. The rate fluctuates between 51% and 53%.
Table 36: Gender Parity and Equality in Education
Gender Parity and Equality in Education 2007 (%) 2008 (%) 2009 (%) 2010 (%) 2011 (%) 2012 (%) 2013 (%)
Female enrolment in Primary and Secondary (as a percentage of the
total enrolment)
Primary 48% 48% 48% 48% 47% 49% 48%
Secondary 53% 52% 53% 53% 53% 51% 52%
Source: MESC Statistical Digest 2013
ECE Teachers Table 37 shows that the number of ECE teachers varied over the years. Over the ten year period (2001‐2011), there
was an increase of 159% in the number of teachers employed. The lowest number of only 129 teachers was recorded
in 2001, whereas it reached its peak of 376 in 2003. With gender disaggregation, female teachers outnumber their
male counterparts.
Table 37: Early Childhood Education (ECE) Teachers, 2001 – 2013
Source: MESC Statistical Digest 2012 & 2013
Primary and Secondary Teachers Table 38 shows there are more female teachers than male teachers in primary education. It remained unchanged at 78% from 2010 to 2013. In secondary education, although there are more female teachers than male teachers, the percentage is not as high as in primary. The highest percentage recorded was in 2013 of 55%.
Table 38: Percent of Female teachers in primary and secondary schools, 2007 – 2013 2007 2008 2009 2010 2011 2012 2013
Female teachers in Primary and secondary (as a percentage of the
total number)
Primary 77% 78% 77% 78% 78% 78% 78%
Secondary 53% 53% 52% 54% 54% 52% 55%
Source: MESC Manumea Database
No of Teachers 2001 2002 2003 2004 2005 2006 2007 2008 2009 2010 2011 2012 2013
Female 122 111 359 343 291 336 302 259 290 292 320 327 295
Male 7 12 17 9 10 7 12 9 7 11 14 16 12
TOTAL 129 123 376 352 301 343 314 268 297 303 334 343 307

46 | P a g e
Table 39 shows GPI of GER. GPI at primary level is used to assess gender difference in intakes between boys and girls. GPI for primary is dominated by males while secondary is dominated by females. This means there are more males attending primary education, but a reverse trend is noted for secondary education.
Table 39: Gender Parity Index46 (of GER)
YEARS 2007 2008 2009 2010 2011 2012 2013
GPI – PRIMARY 0.93 0.93 0.92 0.92 0.93 0.94 0.92
GPI ‐ SECONDARY 1.12 1.10 1.12 1.13 1.12 1.05 1.08
Source: MESC Manumea Database
2.5.3 Remaining gaps, issues and challenge
There is growing concern about the education of boys. Boys are over‐represented in literacy and numeracy at risk
categories and in dropout rates at both primary and secondary levels. The trend of girls outnumbering boys at
secondary school has been evident since 1996 and it is still continuing. Girls also make up the majority (59%) of
enrolments in the PSSC Examination. Key factors to consider in educating boys will be engaging them and motivating
them to want to learn through the use of appropriate teaching methods and relevant curriculum materials. It will
also be important to gain the support of parents and the wider community. Often it is not that students can learn, it
is that they do not want to or cannot see the point. In addition limited pathways from secondary to PSET may also be
a factor.
2.5.4 Conclusion and way forward (including post 2015)
Key factors to consider in educating boys will be engaging them and motivating them to want to learn through the
use of appropriate teaching methods and relevant curriculum materials. It will also be important to gain the support
of parents and the wider community. Often it is not that students can’t learn it is that they don’t want to or can’t see
the point and limited pathways from secondary to PSET may also be a factor.
The focus of education in Samoa and plans need to shift to the male student. Subjects and courses need
to consider gender balance in their developments. Samoa needs to look at role models for boys to
encourage them to progress in life.
46 GPI is calculated as the result of the GIR for girls divided by the GIR for boys

47 | P a g e
2.6 QualityofEducation
Improving all aspects of the quality of education, and ensuring excellence of all so that recognized and measurable learning outcomes are achieved by all, especially in literacy,
numeracy and essential life skills
2.6.1 Introduction
Quality is at the heart of education, and what takes place in classrooms and other learning environments is
fundamentally important to the future well being of children, young people and adults. A quality education system is
one that satisfies basic learning needs, and enriches the lives of learners and their overall experience of living47.
The GoS through its SDS is fully committed to the achievement of quality goals which include the improvement of
literacy and numeracy, teacher quality, curriculum materials and assessment policy, management of education,
infrastructure, financing, community participation and support, and monitoring and evaluation.
Following an extended pre‐planning period of procuring and contracting external and national consultants,
establishing processes and systems, physical infrastructure and procurement of resources, the development of the
new primary curriculum commenced in July 2009. Seven curriculum statements are completed and externally
reviewed. The new primary curriculum reflects a shift from inputs to an outcomes based curriculum.
The teaching of vocational subjects has been supported with the provision of an annual budget. 75% of secondary
schools and colleges currently offer vocational subjects such as Visual Arts, Design Technology, Food and Textiles
Technology, to name a few. The Science and Mathematics Improvement Project in Basic Education (SMIPBE) have
resulted in a marked improvement in the students’ performance in mathematics and science.
In terms of upgrading teacher content knowledge and pedagogical skills, scholarships are offered to pre‐service and
in‐service teachers at the NUS. There is also on‐going partnership with the Faculty of Education (FoE) in course
development and teaching. Since May 2009, an Alternative modular approach to pre‐service teacher training has
been offered by the FoE.
Many PSET providers have insufficient organisational capacity to achieve quality standards. They are constrained too
by the inadequate knowledge and skills of many PSET lecturers and trainers, and also by a lack of budget to support
courses adequately.
In 2011, 32.9% of the 152 permanent lecturers and trainers at NUS had Masters degrees or PhDs. In 2011, 45.9 % of
lecturers and trainers employed by 4 Private PSET Providers had Diploma or a lower level of qualification as their
highest attained. The figure was 55.4% for those employed in 11 Mission PSET Providers. The degree holders are
largely concentrated in the Australia Pacific Technical College (APTC) and the bible/theological colleges.
Learning resource materials and equipment are also central to good quality higher education and TVET in particular.
If these resources are lacking in TVET, the learning shifts from an applied/authentic focus to a more theoretical
approach. Appropriate IT support and access to library facilities and resources are all key ingredients of PSET quality.
A critical constraint for all Samoan PSET providers is a lack of funds (for non‐salary expenditure). Without the
necessary funding on an ongoing basis, it is extremely difficult to keep equipment up to date.
2.6.2 Analysis
Literacy in Schools
47 Guidelines for EFA. Monitoring, Evaluation and Assessment: Identifying and Reaching the Unreached. UNESCO, Bangkok. p. 155

48 | P a g e
MESC places an emphasis on assessing literacy at the primary level so that intervention strategies can be
implemented early in life. By increasing the literacy rates at primary level, the adult illiteracy rate can be reduced
over the years. The Samoa Primary Education Literacy Levels (SPELL) Tests are conducted at Year 4 and Year 6. The
areas covered are Samoan, English and Numeracy. The initial intention behind the SPELL Tests was to use the test as
a measurement and diagnostic tool to allow literacy standards to be monitored and identify students whose
performance in the test placed them at some risk in achieving educational outcomes.
All secondary schools have been resourced with library facilities and a School Library Assistant [SLA] was recruited as
a means to improve library services and to provide library support for students and teachers in the schools. Some
primary schools have been included in this program and are currently running a mobile service [SLA mobile] to other
primary schools within the district, with support under the school fees grants scheme to purchase reading and
learning materials.
Pacific Benchmarking for Education Results [PaBER] The PaBER Programme commenced in 2012 and aims to improve literacy and numeracy levels of children in the
Pacific region by equipping policy makers in Pacific countries with the information and knowledge to drive
interventions that will have a real effect on learning results. Samoa is one of the countries, used to pilot a
benchmarking approach to test its usefulness as model to drive interventions that will have a positive impact on
learning in the region.
The PILNA test was administered in 2013, and the results for Samoa confirm that the SPELL results are not good for
Samoa.
Home School Literacy Partnership Improving students’ literacy and numeracy skills remains a priority. The Ministry commenced a programme for a
Home School Literacy Partnership program implemented in selected primary government schools. The focus is to
encourage and ensure the community’s involvement in our drive to improve literacy and numeracy in schools.
SPELL Results The results have consistently shown high percentages of at risk students at both levels. In SPELL 1 [Year 4] significant
improvement was noted for 2009 [27%] to 2010 [17%] in Samoan literacy, while some slight improvements were
noted for numeracy from 2008 [27%] to 2009 [22%] and 2010 [19%]. Significant improvements is also noted in
English literacy from 2009 [35%] to 2010 [23%].
Figure: 11 Primary Students Identified as at Risk, Year 4, (Government and Non‐Government) Results from SPELL One Test
Source: MESC Statistical Digest 2013.

49 | P a g e
Figure 12: Primary Students identified as at Risk, Yr 6, (Government and Non‐Government) Results from SPELL Two Test
Source: MESC Statistical Digest 2013.
Examination results in the SPELL tests are concerning. The quality of teaching, inadequate teaching resources and minimal support for teachers, may be causal factors. Other factors affecting scores may be the quality of assessment in terms of validity and reliability.
SPECA The Samoa Primary Education Certification Assessment [SPECA] has replaced the Year 8 curriculum‐based
examination starting in 2013. The SPECA is an aptitude test designed to determine the ability of students to learn in
their future studies. It identifies the specific area of inclination of students. It is focused on measuring competencies
and readiness in the future performance while the previous exam measured what students have achieved. SPECA
gives a better estimate of student’s abilities and provides information on student’s relative strengths and
weaknesses48. It will inform primary school graduates’ potential for secondary and further studies.
The SPELL test results indicate continuing problems with literacy in primary schools with the number of ‘at risk’
students in English increasing from 46% in 2000 to 53% in 2006. Girls are outperforming boys consistently and this is
another challenge in most countries. Senior officials believe that teacher quality and school leadership are the critical
issues in Samoa impacting on learning outcomes of students.
Financing Education
Figure 13 demonstrates total expenditure on primary and secondary education as a percentage of GDP has
decreased over the years. Similarly, total public expenditure on education as a percentage of total government
expenditure also decreased. Total public expenditure on education decreased in 2008/2009 and 2009/2010 before
picking up again in 2010/2011. This is due to a decrease in government funding to education. Expenditure on
education has never reached the 30% mark.
Figure 13: Total Expenditure on Education [Primary and Secondary] as Total of Government Expenditure, and GDP
48 Information on Samoa Primary Education Certification Assessment [SPECA]. p.1
6% 7% 5% 4% 5% 5% 5%
27% 27%19% 18% 20% 20% 19%
0%
20%
40%
2006/2007 2007/2008 2008/2009 2009/2010 2010/2011 2011/2012 2012/2013
FINANCIAL YEARS
Total Public Expenditure on Education as a Total Governemnt Expenditure, and as a Percentage of GNP/GDP, FY 2006/2007 ‐ 2012/2013
Total public expenditure on education as a percentage of GNP/GDP
Total public expenditure on education as a percentage of total government expenditure

50 | P a g e
Financing ECE
Since 1999, the GoS, through MESC, has been providing an annual per capita grant to pre‐schools registered with the
NCECES. The current allocation (2013) is approximately SAT104 per child. The provision of most of the materials and
teacher salaries remain the responsibility of the provider of ECE. Salaries are often fundraised by PTAs and
communities.
Table 40 shows the total financial commitment by the GoS to ECE in the FY 2007/08 – 2012/12. During this period,
the annual Government grant to ECE is equivalent to 7.5 percent of the total annual
Government grant to Mission, Private and Special schools. The entire annual grant is distributed between mission
and private schools, special schools and ECE centres. This is also, the Government’s allocation towards development
of ECE curriculum.
Parents are required to Pay Fees to ECE Centres. Depending On the Provider, Fees Range from SAT5 per Term To
SAT200 Per Term In 2013, With Private ECE Centres Generally Charging More.
Table 40: Public expenditure on ECE, FY 2007/08 – 2012/2013 (SAT)
Source: MESC
Financing Primary Education
The GoS highlighted its commitment to primary education by increasing its budget allocation as can be demonstrated
by Figure 13. Public expenditure on primary education has increased every year since the FY 2006/2007. Much of
the money goes to teaching services, teacher development and stationery.
Figure 13: Public Expenditure on Primary Education, FY 2006/2007 – 2012/2013 (SAT)
Source: MESC
The SSFGS started in 2010 with the Development Partners contributing 100%, and thereafter, the GoS will contribute
until it takes over the full financing of the programme. Enrolment has since increased with the various levels.
$0.00
$5,000,000.00
$10,000,000.00
$15,000,000.00
$20,000,000.00
$25,000,000.00
$30,000,000.00
$35,000,000.00
$40,000,000.00
$45,000,000.00
$50,000,000.00
2006/2007 2007/2008 2008/2009 2009/2010 2010/2011 2011/2012 2012/2013
Public Expenditure
Financial Year
Public Expenditure on Primary Education2006/2007 ‐ 2012/2013 (SAT)
Christian Education SSFGS/Primary Schools Village Stationery
FOE/NUS School Broadcast (P/Sch) SMIPBE/Maths/PS
Inclusive Education Project Assessment & Examination Services Curriculum Services
Financial Year 2007/08 2008/09 2009/10 2010/11 2011/12 2012/13 2013/14
Annual Grant 300,000.00 300,000.00 300,000.00 375,000.00 375,000.00 375,000.00 375,000.00

51 | P a g e
Financing Secondary
Public Expenditure on secondary also increased as shown by Figure 15. The main contributor to this growth was the teaching services, teacher development and stationery. Christian Education was introduced in the FY 2010/2011.
Figure 15: Public Expenditure on Secondary Education, FY 2006/2007 – 2012/2013 (SAT)
Source: MESC
Financing Special Needs
The GoS’s commitment to SNE has increased. In addition to the annual grant, the Government under the MESC
budget also allocates appropriations towards the development of special needs education.
Table 41: Public expenditure on SNE, FY 2007/08 – 2012/2013 [SAT]
Source: MESC
Financing Teacher Development and Services
Figure 16: Teacher Compensation [salaries] as a Percentage of Public Expenditure, 2007‐2013
Source: MESC Finance
0
1000000
2000000
3000000
4000000
5000000
6000000
2006/2007 2007/2008 2008/2009 2009/2010 2010/2011 2011/2012 2012/2013
Public Expenditure
Financial Years
Public Expenditure on Secondary Education, FY 2006/2007 – 2012/2013 (SAT)
Teaching Service Teacher Development School Improvement ServicesCurriculum Services Assessment & Examination Services Assets Management ServicesMaths Project FOE/NUS Avele teachers AccommodationVillage Stationery Resources for Schools SSFGS Secondary SchoolsChristian Education
17% 17%28% 30% 29% 31% 32%
9% 9%
14% 15% 15% 16% 17%
0%
20%
40%
60%
2006/2007 2007/2008 2008/2009 2009/2010 2010/2011 2011/2012 2012/2013
YEARS
Teachers compensation as a percentage of current public expenditure by level of education (primary, lower and upper secondary education) , 2007‐2013
PRIMARY SECONDARY
Financial Year 2007/08 2008/09 2009/10 2010/11 2011/12 2012/13 2013/14
Annual Grant $200,000.00 $200,000.00 $200,000.00 $250,000.00 $250,000.00 $250,000.00 $250,000.00

52 | P a g e
Funding for teacher salaries over the years have increased as shown by Figure 16. This indicates that the majority of
the Education budget goes to personnel costs, with the remaining to fund curriculum materials and teacher
development.
Financing Tertiary Education
The NUS receives an annual grant from Government and levies fees for tuition. It has an annual budget of around
SAT9 million, and increasing yearly since FY 2010/2011. The Government also sponsors students to tertiary
institutions, such as NUS and overseas universities. As an example, Table 42 details the Government expenditure on
sponsoring students to the FoE at NUS, which has increased dramatically since FY2006/07.
Table 42: Government Expenditure on NUS and sponsoring students to FoE at NUS, FY2006/07 – 2012/13 Financial Year 2006/07 2007/08 2008/09 2009/10 2010/11 2011/12 2012/13Grant from Government
$9,000,000.00 $8,000,000.00 $10,000,000.00 $9,880,000.00 $11,425,720.00 $11,586,670.00 $11,574,802.00
Expenditure on FoE (NUS) Sponsored Students
$850,000.00
$986,293.00
$2,600,000.00
$2,400,000.00
$2,400,000.00
$2,400,000.00
$,200,000.00
Source: MESC Finance
Parent Contribution to Education
The provision of primary education is a partnership between the Government and communities. MESC appoints and
pays the salaries of principals and teachers, and distributes stationery and curriculum materials to schools. In the
FY2006/07 up to FY2012/2013, the Government made provision for the purchase of consumables for secondary
schools to improve the quality of practical subjects. In the FY 2010/2011, the Governments of New Zealand and
Australia through the Government of Samoa provided the much needed financial assistance to enable primary school
students to attend school without having to worry about school fees. In the FY 2013/2014, the Government of New
Zealand contributed more funds to the School fee Grants Scheme to enable secondary students from Year 9 to 11 to
attend school without having to worry about schools fees.
The local communities (village and district) provide the school buildings, furniture and equipment, and are also
responsible for the maintenance of the school and its environment. These maintenance costs are passed on to
parents who pay maintenance fees, which can vary from SAT5 a term to SAT50 a year in the urban area. Parents also
contribute in other ways in funding their child’s education, including funding school uniform costs, transport,
lunches, building maintenance and other school requirements.
2.6.3 Remaining gaps, issues and challenge49
Quality learning requires quality teaching, therefore a highly professional teaching force, supported by effective
learning environments, remains the key to improved learning. We need to build and sustain the necessary
institutional and professional arrangements for teaches for learning to happen.
Many schools do not achieve the Minimum Service Standards relating to the quality of learning in the classroom.
There are many factors at work. Teacher quality is the major one, but factors such as the learning environment, the
effectiveness of the curriculum, the assessment policy, language policy, and the demand‐side factors of parents’
attitudes to school, and community support all play their part in constraining or facilitating good teaching and
learning.
Learning resource materials and equipment are also central to good quality higher education and TVET in particular.
If these resources are lacking in TVET, the learning shifts from an applied/authentic focus to a more theoretical
approach. Appropriate IT support and access to library facilities and resources are all key ingredients of PSET quality.
A critical constraint for all Samoan PSET providers is a lack of funds (for non‐salary expenditure). Without the
necessary funding on an ongoing basis, it is extremely difficult to keep equipment up to date.
49 Data extracted from the Samoa Education Sector Plan 2013 – 2018

53 | P a g e
The constraints affecting young people from all backgrounds enrolling and completing PSET courses are not yet fully
understood and documented. It is widely believed, however, that constraints include the following:
fee levels that preclude students from poorer families
family and student limits on mobility
perceived relevance of courses and associated weakened industry linkages
perceived low value of learning through non‐formal education
Insufficient numbers of qualified teachers and trainers at all levels, restricting what courses can be offered
Limited learning pathways from secondary to PSET, and within PSET
2.6.4 Conclusion and way forward (including post 2015)
As well as financial constraints, other factors, particularly at the secondary level might concern students or parents
perception of the relevance and quality of what he school can offer. Often there is limited access to appropriate
Maths and Science courses at secondary level, and a shortage of teachers in specialist subjects particularly in Science,
and Maths. Addressing this shortage in the medium term is crucial given these are particularly relevant subjects for
future employment.
Information and communication technologies [ICTs] not only provide new avenues for pedagogical approaches and
learning but can also change the nature of learning. However, ICTs by themselves in a classroom will not improve
learning – they need to be embedded in a quality teaching‐learning process to become effective enablers of learning.
Teachers at all levels face challenges in monitoring and evaluating students’ progress and adjusting their teaching
accordingly. They also often lack the skills needed to identify and teach learners with special needs. As well as
teachers, school directors and head teachers require further development of their leadership and management skills.
While the adequacy of teachers’ own knowledge and their teaching skills can be critical constraints, in the Samoan
context a strong constraint running in parallel is a frequent lack of commitment, of low morale, and hence low
motivation to teach to their best. Teaching for many is not their career of choice but of necessity. Many, if the
opportunity arises, leave the profession. Retaining high quality teachers in the system is a problem at both primary
and secondary levels.
2.7 SummaryAlthough the Ministry and development partners have invested heavily in In‐service for teachers, commitment of
teachers and principals in terms of leadership remains a major challenge. Shortages of secondary teachers have
developed and have become critical in some subject areas, particularly mathematics and science.
Participation in ECE remains low, with a gradual increase / decrease. Quality of ECE centres remain a concern as
many do not meet the NCECE requirements and standards. These centres also lack educational and maintenance
resources. Failure to comply with national standards has led to the closure of a number of ECE centres.
Support for early childhood education included the training of teachers funded under the Ministry of Education,
Sports and Culture (MESC) and Faculty of Education (FoE) sponsorship program. The Minimum Service Standards for
schools were approved and implemented in the schools in 2010 with the start of the Samoa School Fee Grants
Scheme jointly funded by the Governments of New Zealand and Australia. The Scheme provided access to fee free
education at primary level for all except private schools with the dual aim of achieving universal primary education
by 2015 as well as improved learning outcomes. The School Fee Grant Scheme has continued to secondary level for
Years 9 to 11 with the exception of private schools. The aim of the scheme is to make education accessible and
available to all students.

54 | P a g e
The Compulsory Education Act was passed in 1991/1992 and the legislation requires that “every child is hereby
required to have his or her name enrolled on the register of sme Government or registered school from the time he
attains the age of five years until either he attains the age of 14 years or sooner completes the work of Year 8.
However, the Act has not been fully enforced. Not all children are in school, including those with special needs.
In the primary level, the Samoa Primary Education Literacy Levels (SPELL) Tests are conducted at Year 4 and Year 6.
The areas covered are Samoan, English and Numeracy. The initial intention behind the SPELL Tests was to use the
test as a measurement and diagnostic tool to allow literacy standards to be monitored and identify students whose
performance in the test placed them at some risk in achieving educational outcomes. The SPELL Results have
consistently shown high percentages of at risk children at both levels.
In SPELL 1 [Year 4] significant improvement was noted for 2009 [27%] to 2010 [17%] in Samoan literacy, while some
slight improvements were noted for numeracy from 2008 [27%] to 2009 [22%] and 2010 [19%]. Significant
improvements is also noted in English literacy from 2009 [35%] to 2010 [23%].
In SPELL 2, the percentages of at risk children50 in Samoa has been relatively low compared to the rates for English
literacy and numeracy both of which have been very high. However, from 2009 [14%] to 2010 [16%] a small increase
in the percentage of at risk students is noted. Percentage of at risk children in numeracy however have been quite
high with 59% in 2008, 48% in 2009 and 49% in 2010 mirrored by the figures for English literacy with 59% in 2008,
56% in 2009 and 35% in 2010.
For the improvement of Post‐Secondary Education and Training (PSET), the Samoa Qualification Authority (SQA)
continued to foster strong partnership with PSET providers and its stakeholders to gain feedback towards a more
forward looking approach to PSET development.
50 Students who have been identified as having learning difficulties, and are graded at Levels 4 or 5 on the SPELL Test
55 | P a g e
CHAPTER3
ReviewofEFAStrategiesandSectorManagement
3.1 AssessmentofEFAStrategies3.1.1 Legislation Review
3.1.1.1 Compulsory Education Amendment Act
The Compulsory Education Amendment Act 1992/1993 has provision for compulsory primary education for children in Samoa for students between the ages of 5 and 14 years old. This is enforced by the Education Act 2009.
3.1.1.2 Education Act 2009 The Education Act 2009 provides the legal framework within which all education developments operate, and in
particular the enforcement of compulsory education, which will ultimately work towards achievement of the
universal primary education for all.
The Act regulates and makes provision for school education and early childhood education in Samoa and repeals the
Education Ordinance 1959. The same Act regulates Compulsory Primary Education for children in Samoa between
the ages of 5 and 14 years who have not completed Year 8. It provides the opportunity for all students to attend
school regardless of their background or economic status.
3.1.3 Policy Review
3.1.3.1 Education Sector Plan [ESP]
Education is the key to the Strategy for the Development of Samoa [SDS] and the need to improve employment
prospects and reduce scarcity of skilled labour that constrains private sector growth. The Education Sector Plan July
2013 – June 2018 fulfills the vision of Government to adopt the concept of sector wide planning. This brings together
the education sector with the forward plans of the MESC, SQA and the NUS together with arrangements for
implementing and monitoring the plans. The ESP builds on the Strategic and Corporate Plans of the three main
subsectors of education. It further strengthens the Sector Wide approach involving all stakeholders in tackling the
developmental needs of the education sector in Samoa.
3.1.3.3 Inclusive Education Policy
Inclusive education has a multifaceted nature and many areas need to come together to effect positive change to the
presence, participation, and achievement of all students vulnerable to exclusion. For students51 living with disability
the challenges they face in order to have access and achieve desirable outcomes from their educational experiences
can only be met by multi‐sectoral policies, strategies and collaboration. The Inclusive Education Policy for Students
Living with Disability (IEPSD) 2013 is situated within Samoa’s Constitution (1962), legislation, policies and strategies.
From legislation to policies and strategies the IEPSD 2013 is further situated within the context of the Strategy for the
Development of Samoa (SDS), 2012–2016 whose vision and long term development goal is “Improved Quality of Life
for All.” Within this broad national development context, a number of policies and strategies have specific relevance
to the IEPSD 2013.
Samoa’s Constitution guarantees to all people certain fundamental human rights52. Samoa has passed disability‐
specific legislation primarily in education and accessibility. The Education Act 2009 provides explicit recognition of
the rights of students with disability.
51 Lameta E. (2013) Draft Inclusive Education Policy for Students living with Disability (IEPSD). p. 3 – 4
52 For example, rights such as: Right to life (Article 5), Right to personal liberty (Article 6), Freedom from inhuman treatment (Article 7), Freedom
from forced labour (Article 8), Right to a fair trial (Article 9), Rights concerning criminal law (Article 10), Freedom of religion (Article 11, 12), Rights

56 | P a g e
The Samoa National Policy on Disability (SNDP) developed in 2009 includes the National Policy Implementation Plan
2011‐2016 which has since been incorporated into the MWCSD Implementation Framework – Community
Development Sector 2012‐2017. Analysis of the SNDP suggests that as a lead document for national planning
implementation and monitoring of provisions for people living with disability, it has a number of fundamental
weaknesses conceptually and in its implementation that requires urgent review to effect positive changes for people
living with disabilities53.
3.2 Enabling/ConstrainingFactors3.2.1 Enablers:
Education for All is everyone’s responsibility. The EFA movement has been at the forefront of developments and
improvements in education. These developments and achievements have possible because of the support and
commitment of all partners in education.
Government support: Government has been the biggest enabler for EFA in Samoa. Government commitment and
financing plays a major role in the progress made so far in the education system.
Partnership with Development partners: have also contributed to the improvement and success of EFA
implementation. Their financial support has enabled the many activities to be implemented.
The launch of the Education Act 2009 and the Education Sector Plan 2013‐2018 also contributes to the betterment
for Samoan schools. The implementation of the Act and the Plan has pushed for education for all in its various
forms. The documents are the strength of the system to ensure that education is available and is for all people of
Samoa.
3.2.2 Constraining Factors:
With every good initiative and strategy, there will always be set‐backs that challenge the completion of such
initiatives. It is a hindrance to the progress of the work. Barriers to achieving better outcomes lies with the
implementation of the programmes to the stakeholders – the children.
Although there were funds donated and given to further education programmes, there is never enough given the
scope of the education sector and the work that is required. The availability of donor funding to support
developments in education brings with it an issue as the sustainability of the programmes when donor funding
ceases.
3.3 LessonsLearned/BestPractices3.3.1 Education as a life‐long process
Education is a life‐long learning process. Education is never finished. The end of one thing is the beginning of
another. There should always be on‐going support for both teacher and students and the community. Education for
all is everyone’s responsibility. Education is from birth to death.
3.3.2 Education and changes
Changes are evident in today’s world. Education should be able to provide students, parents and the community the
opportunity to survive in a changing society. As educators, education never ends. Education is every day. It can be
in the home, the community, in town or a more formal setting. Education should not be a one person show.
regarding freedom of speech, assembly, association, movement and residence (Article 13), Rights regarding property (Article 14), Freedom from discriminatory legislation (Article 15) 53 MESC (2013) Samoa Inclusive Education Situational Analysis: Students with Disabilities 2013 page 132‐133

57 | P a g e
CHAPTER4
EmergingChallengesandGovernmentPriorities
4.1 Emergingdevelopmentchallenges54Despite government commitment, NGO support, donor assistance and the many achievements. There still remain
the challenges to be addressed beyond 2015.
4.1.1 Quality of Education
Early Childhood Education
The major challenges facing ECE include the quality of education currently provided. Access to quality Early
Childhood Education (ECE), which helps to prepare children for primary school, is a concern across the country, with
most ECE teachers untrained, and all managed by NGOs.
Children’s performance in basic education is also a concern. Many children do not acquire the basic literacy and
numeracy skills that would enable them to continue in the school system. The data from literacy and numeracy tests
in primary education paints a picture of stagnating quality or even regression. Preparing children for school through
Early Childhood Education is also a critical investment.
The inadequate supply of teaching quality is also a challenge. While we have considerable challenges in terms of
qualifications and certification, the critical challenge lies in teacher and head teacher/principal competence. There is
a large number of untrained teachers in ECE.
Primary and Secondary Education55
Many schools do not achieve the Minimum Service Standards relating to the quality of learning in the classroom.
There are many factors at work. Teacher quality is the major one, but factors such as the learning environment, the
effectiveness of the curriculum, the assessment policy, language policy, and the demand‐side factors of parents’
attitudes to school, and community support all play their part in constraining/facilitating good teaching and learning.
Many teachers in primary schools have not had adequate training (at pre–service and in‐service levels) and on‐going
professional support to ensure they have the content, pedagogical and assessment knowledge needed to implement
effective literacy and numeracy programmes. The quality of school leavers entering the Faculty of Education at NUS
to train as teachers is also a concern, with senior staff expressing serious concerns.
Teachers at all levels face challenges in monitoring and evaluating students’ progress and adjusting their teaching
accordingly. They also often lack the skills needed to identify and teach learners with special needs. As well as
teachers, school directors and head teachers require further development of their leadership and management skills.
While the adequacy of teachers’ own knowledge and their teaching skills can be critical constraints, in the Samoan
context a strong constraint running in parallel is a frequent lack of commitment, of low morale, and hence low
motivation to teach to their best. Teaching for many is not their career of choice but of necessity. Many, if the
opportunity arises, leave the profession. Retaining high quality teachers in the system is a problem at both primary
and secondary levels.
Science and mathematics subjects are a major concern in Samoa at the moment – both as a subject and teacher
demand and supply. Improving the quality of education in Samoa will require increasing numbers of qualified
teachers and instructors, which would help foster continued increases in literacy and numeracy.
54 Data and information sourced from the Samoa Education Sector Plan 2013 – 2018
55 The information for this part of the report was taken from the Samoa Education Sector Plan 2013‐2018

58 | P a g e
Post School Education and Training
Many PSET providers have insufficient organisational capacity to achieve quality standards. They are constrained too
by the inadequate knowledge and skills of many PSET lecturers and trainers, and also by a lack of budget to support
programmes adequately.
Despite significant investment in technical and vocational education and training (TVET), TVET options are limited
and are not always relevant to available employment opportunities. Lower income groups, and those in rural areas
and outer islands, tend to have much less access to skills development.
In the TVET sub‐sector, low occupational standards, irrelevant curriculum, lack of qualified instructors, limited
resources and necessary equipment, and quality assurance mechanisms contribute to the overall low quality of TVET
in Samoa. Training systems tend to operate in isolation of labour market demand and with little employer
participation.
Learning resource materials and equipment are also central to good quality higher education and TVET in particular.
If these resources are lacking in TVET, the learning shifts from an applied/authentic focus to a more theoretical
approach. Appropriate ICT support and access to library facilities and resources are all key ingredients of PSET
quality. A critical constraint for all PSET providers is a lack of funds (for non‐salary expenditure). Without the
necessary funding on an ongoing basis, it is extremely difficult to keep equipment up to date.
4.1.2 Access and Equity
Early Childhood Education
ECE development has been largely haphazard to‐date and grown to what it is being underpinned by policy and
strategic direction. For these reasons providing equitable access has not been possible. Most children do not have
the opportunity to access ECE. For these children, the constraints may be financial or geographical (no local
provision), or concern the perception of quality of local provision, or parents’ lack of knowledge of the value of a
good early childhood learning experience. .
Primary and Secondary Education
Access and equity are challenges. Many children enrolled are dropping out before completing primary school. There
is a low student school retention rate particularly at the secondary level.
Disability has been invisible for some time. But there have been work done to address disability but very slow.
Disability limits access to education, employment, recreation, health and other social services, leading to economic
and social exclusion, while persons with disability and their families face prejudice, discrimination and rejection.
Women and children with disabilities are particularly vulnerable to violence.
The constraints on achieving equity in the provision of primary and secondary schooling remain persistent. Probably
the key constraint keeping children out of school or enrolling and then dropping out is related to families’ economic
situation and the open and hidden costs of educating a child. The affordability of secondary schooling remains a
challenge to most parents.
At the primary level, it is recognized that there are still small numbers of hard‐to‐reach, vulnerable families living
very poorly in remote areas who are not sending their children to school.
Reaching all children with disabilities and enrolling them in appropriate education remains a challenge. Today’s
policy of increasingly including children with disabilities in mainstream primary and secondary schools brings
different potential constraints ‐ teachers not yet equipped with the knowledge and skills (or the professional
support) to do justice to the students with disabilities in their school.
As well as financial constraints, other factors, particularly at the secondary level might concern students or parents’
perception of the relevance and quality of what the school can offer. Often there is limited access to appropriate

59 | P a g e
Maths and Science courses at secondary level, and a shortage of teachers in specialist subjects particularly in Science,
ICT and Maths.
There is a significant equity issue inside schools too. There is growing concern about the education of boys. Boys are
over‐represented in literacy and numeracy at risk categories and in dropout rates at both primary and secondary
levels. The trend of boys outnumbering girls at secondary school has been evident since 1996 and it is still
continuing. Sixty three per cent of boys attend secondary education, compared with 78 per cent of girls. Girls also
make up the majority (59%) of enrolments in the SSLC Examination. Key factors to consider in educating boys will be
engaging them and motivating them to want to learn through the use of appropriate teaching methods and relevant
curriculum materials. It will also be important to gain the support of parents and the wider community. Often it is not
that students can’t learn, it is that they don’t want to or can’t see the point and limited pathways from secondary to
PSET may also be a factor.
Post School Education and Training
In PSET, relevance refers to the overall match between demand for, and supply of, skills. A number of recent studies
which include the National and International Employment Opportunity study, Labour Market study and the Survey of
Employers and Graduates Tracer Studies that pointed to a mismatch between demand and supply manifesting in a
critical skills shortages within Pacific Island Countries. These skill shortages impact negatively on economic and social
development, and the overall balance between demand and supply of skills is subject to short‐term cyclical macro
economic factors.
The constraints affecting young people from all backgrounds enrolling and completing PSET programmes are not yet
fully understood and documented. There are pathways and opportunities from secondary to PSET but there are
constraints with tuition fees being the main barrier. Other constraints include the following:
fee levels that preclude students from poorer families;
family and student limits on mobility;
perceived relevance of programmes and associated weakened industry linkages;
perceived low value of learning through non‐formal education;
Insufficient numbers of qualified teachers and trainers at all levels, restricting what programme can be
offered; and
Limited learning pathways from secondary to PSET, and within PSET.
4.1.3 Relevancy
Early Childhood Education
Little concrete evidence is currently available about the relevancy of the current provisions for ECE to the needs of
the students entering primary school. ECE curriculum guidelines are in place but due for review and revision. It is
not clear to what extent ECE teachers follow the present Curriculum Guidelines in the classrooms. Similarly, it is also
not known to what extent appropriate and relevant learning materials are available. The interface with current ECE
teaching and learning with the new bi‐lingual primary curriculum remains unclear.
Primary and Secondary Education
A more relevant, bilingual primary school curriculum is currently being implemented in schools. It includes
instructional materials that emphasise more active, student‐centred learning activities. This new curriculum will be
evaluated under the Education Sector Plan in terms of quality and relevance to the needs of the students. At
present, a major concern is that pre‐service teacher education at the National University of Samoa [NUS] is not fully
aligned to the new primary curriculum. A review of the secondary curriculum is underway to accommodate recent
developments in ICT and the localization of the Pacific Senior School Certificate examination.

60 | P a g e
There is also a shortage of teachers at secondary level in specialist subjects particularly in Science, ICT and Maths.
Addressing this shortage in the medium term is crucial given these are particularly relevant subjects for future
employment.
Post School Education and Training
In PSET, relevance refers to the overall match between demand for, and supply of, skills. A number of studies point
to a mismatch between demand and supply manifesting in a critical skills shortages within Pacific Island Countries.
These skill shortages impact negatively on economic and social development, and the overall balance between
demand and supply of skills is subject to short‐term cyclical macro economic factors.
In Samoa, linkages are weak between PSET programmes and skills needs of industries and professions. There is an
absence of data to inform the relevance of PSET programmes to the national needs for economic, cultural and social
development.
4.1.4 Efficiency and Effectiveness of the Samoa Education System
One of the major challenges is the issue of securing sustainable resources to underpin quality and expansion of the
education sector. Though the education sector has the high share of public expenditure, over 90% of educational
expenditure goes towards teacher salaries with little left for quality related efforts that requires specific financial
commitment.
Basic gaps include school resources, initial teacher education/training, ongoing professional development as well as
capacity development at Ministry level. In order to bring about effective and efficient education reform, there is a
dire need to rethink educational investment to address the pressing challenges.
Particular attention needs to be given to Education for Sustainable Development (ESD) to ensure that the natural
resources of the Pacific are sustainably managed in the context of natural hazards and climate change.
Efficiency and effectiveness of education could be also improved by improved sector planning, development of more
local and relevant resources, and improving educational facilities. Continuing political commitment to support quality
education has created an enabling policy framework, but increased resources to achieve equity in the access to
quality education are still needed.
4.2 NationalPolicyDirectionsAs stipulated in the SDS 2012‐2016 the key outcome is to improve focus on access to education, training and learning
outcome. The aim is to increase and broaden access to education, ranging from Early Childhood Education to Post
Secondary Training in both the formal and non‐formal institutions as well ensure the gradual integration of Inclusive
Education. The National Policy on ECE 2014 is being developed to guide and provide a clearer direction for future
developments towards ECE in Samoa.
.5657Human resource development and capacity building is a pre‐requisite to achieving national and sectoral goals as
to ensure the skills and knowledge available within the country are relevant to the requirements of each sector.
The mission of the sector plan 2012‐2016 is to promote the achievement of high quality Education and training to
meet the national socioeconomic and cultural goals. The two‐fold approach towards improving education and
learning outcomes in the medium term involves improving the quality of teaching services as well as learning
environment.
56 MOF (2012) Strategy for the Development of Samoa (2012), page 12 & 53
57 Data extracted from SDS 2012 ‐ 2016

61 | P a g e
The aim to increase and broaden access to education, ranging from Early childhood Education to Post Secondary
training in both the formal and non‐formal institutions as well as ensuring the gradual integration of Inclusive
education.
4.3 ImplicationsforfutureeducationdevelopmentEducation for All remains a key agenda for basic education. There remains an unfinished agenda. The future
direction for education needs to go beyond the current EFA goals. Key education issues such as access, learning,
equity and quality of education, teachers, and skills developments should be the focus of emphasis and future
education goals and strategies. Education should be addressed across the life‐cycle and future approaches to
education need to be underpinned by a life‐long learning process.
Consideration should be given to ensure a successful early learning as well as opportunities for post primary
education. Attention must be made to the issue of teachers in terms of pre‐service and in‐service training as well as
professional status. We need to ensure a focus on qualifications and conditions of teachers as key deliverers for the
quality of education.
It is also important in the development of curricula that it is broadened to consider beyond academic achievement
and cognitive skill. There will always be non‐cognitive competencies and skills that are important for social cohesion,
creativity and social and emotional development of the individual and society.
4.5 VisionforEducationBeyond2015The Government of Samoa’s vision for education is to transform the education sector into an efficient and relevant
mechanism for the development of the country’s human resource capital. This reflects government’s concern and
policies for the educational welfare and development of all people. In addition beings together education agencies
and institutions to ensure that education makes a positive and permanent contribution to Samoa’s national
development plans and to achieve international development goals.
4.1 The Education Sector
The vision of the Education Sector is that all people in Samoa are educated and productively engaged. The mission
of the agencies supporting the sector is to promote the achievement of high quality education and training to meet
the national, economic, social, and cultural goals of Samoa
The Education Sector Goals include:
Goal 1: Enhanced quality of education at all levels
Goal 2: Enhanced educational access and opportunities at all levels
Goal 3: Enhanced relevance of education and training at all levels
Goal 4: Improved sector coordination of planning and policy development.
Goal 5: Established sustainable and efficient management of all education resources
4.2 Future Development Frameworks
Fulfillment of the right to education is critical to human wellbeing, economic growth and sustainable development,
and it is therefore needs to be made prominent in the discussion on future development frameworks. There is a
need for rethinking education in light of emerging trends, broader socio‐economic development and challenges must
be clearly reflected in the discussion on the future of education.
4.3 Improved Literacy and Numeracy in primary schools
The official reported literacy level of Samoans is very high, but literacy tests at the primary level (SPELL Tests 1 and 2) indicate significant problems with standards being attained in these early years. At the national level, the collection of data relating to literacy forms part of the Census of Population and Housing.

62 | P a g e
The SPELL test results indicate continuing problems with literacy in primary schools with the number of ‘at risk’
students in English increasing from 46% in 2000 to 53% in 2006. There are substantially more students identified at
risk in Year 6 (SPELL 2) than in Year 4 (SPELL 1) in English and in Numeracy. Girls perform consistently better than
boys in these tests with more girls reaching the higher levels and more boys being identified as at risk in all subjects.
Students perform better in Samoan than in the other subjects.
MESC places an emphasis on assessing literacy at the primary level so that intervention strategies can be
implemented early in life. By increasing the literacy rates at primary level, the adult illiteracy rate can be reduced
over the years.
Examination results in the SPELL tests are concerning. The quality of teaching, inadequate teaching resources and
minimal support for teachers, may be causal factors. Other factors affecting scores may be the quality of assessment
in terms of validity and reliability.
4.4 PSET
The constraints affecting young people from all backgrounds enrolling and completing PSET courses are not yet fully
understood and documented. It is widely believed, however, that constraints include the following:
fee levels that preclude students from poorer families
family and student limits on mobility
perceived relevance of courses and associated weakened industry linkages
perceived low value of learning through non‐formal education
Insufficient numbers of qualified teachers and trainers at all levels, restricting what courses can be offered
Limited learning pathways from secondary to PSET, and within PSET
Strategies for tackling these constraints to access and equity include:
Increasing the number and improving the location of institutions;
Reducing user costs;
Increasing the supply of teachers;
Creating diverse pathways from schools to PSET;
Working with relevant partner organisations to ensure inclusivity at all levels of education.

63 | P a g e
CHAPTER5
ConclusionsandRecommendations
5.1 Conclusion
The Government of Samoa has made good progress towards achieving education for all. The underlying concepts in
all the EFA goals of: equity, access, quality, efficiency and sustainability also form the basis of current educational
policies and strategies.
This report presents an overview of the status of education in Samoa, and identifies issues and challenges that have
impacted Samoa’s progress towards achieving education for all.
5.2 Recommendations
The future of education systems must take into consideration:
5.2.1 Early Childhood Education Preparing young people to become lifelong learners and to be able to adapt to changing realities has to be
constructed in the early years of life
MESC to support public awareness programmes on the importance of ECE
MESC to engage in the development of the ECE policy
MESC to look at making ECE compulsory for children between 3 – 5 years old
MESC to ensure that Minimum Service Standards for ECE are developed
MESC to encourage the establishment of one ECE Centre in a village
Explore ways to fund ECE teacher salaries to ensure pay parity with primary school teachers salaries
Encourage teachers in ECE centres to enroll in higher ECE programme
5.2.2 Achieving Universal Primary Education MESC to encourage and support the collaborative partnership between School Committees, families and
schools to encourage the achievement of learners especially in numeracy and literacy
MESC to enforce the Compulsory Education Legislation and the Education Act
Education systems must equip young people with the skills required to adapt to fast changing societies and
labour markets, and ultimately to a changing world.
Learners should be trained to be innovative, be able to assimilate to change and to continue learning.
Young people need a new set of skills to be competent and constantly changing world which include critical
thinking, problem solving, collaboration, communication and technological literacy
Has to go beyond academic achievements and cognitive skills to include non‐cognitive and application of
skills and competencies, as well as education for social cohesion
MESC to ensure primary retention and completion rates improve to ensure progression into secondary level
of education
5.2.3 Life skills and Lifelong learning Improve access to TVET opportunities for primary and secondary schools
Learning is not confined to educational institutions as transmitters of knowledge. Learning outcomes can be
developed in many different ways. Learning outside school matters for learning inside schools.
Schools have the responsibility to consolidate and harness informal learning that takes place outside the
classroom, bridging the gap between the school curriculum and informal learning that is facilitated by
student‐parent or student‐student interaction

64 | P a g e
Future curricula should go beyond focusing on traditional forms of knowledge, they should encompass a
wider range of learning domains
5.2.4 Literacy MESC to support teachers to provide more assistance to students identified as at risk
Partnerships between the community and MESC to be strengthened to encourage literacy and numeracy
Learning requires rich support systems, including highly professionalized teaching profession, and sustain
the effective institutional arrangements for learning to happen
Research will continue in order to ensure that bilingual policies are evaluated and findings used to develop
better and more effective practices
Explore literacy and numeracy assessment at the secondary level
5.2.5 Gender Parity and Equality MESC to find ways to encourage boys to stay in school
MESC to conduct awareness campaigns and programmes to encourage equality of treatment between girls
and boys
Teachers to encourage students to pursue and participate in programmes which develop their strengths in
areas such as sports, arts, agriculture science and music
Creating diverse pathways from schools to PSET and within PSET;
Increase professional development opportunities for teachers
5.2.6 Quality Education Teacher marketing needs to be aggressive in‐order to attract more teachers and maintain their level of
commitment to the profession
Encourage teachers to be innovative and creative in delivering lessons
MESC to explore ways to up‐skill teachers especially in science and mathematics
Rethinking learning also means rethinking teaching. Teachers must continue to evolve from transmitters of
knowledge to enablers for learning
The central role of teachers in the learning process cannot be overstated, and the increasing importance
placed of technology in education must not overshadow the critical role of teachers
Teachers will be trained on how to develop their own curriculum materials through a research‐based
approach, and share their materials with other teachers and schools
Gaining parental and community support for improved learning and accountability
Securing adequate funding for sustaining training resource materials and equipments
Establishing high expectations in terms of expected learning outcomes, quality benchmarks and professional
standards
Improving capacity for effective teaching and quality leadership;
Undertaking research, developing policies, strengthening systems, and providing resources and processes to
support continuous improvement

65 | P a g e
REFERENCESGovernment of Samoa (2013) Country Report on the Status on the Rights of the Child in Samoa. MWCSD, Apia,
Samoa.
Government of Samoa. ECE Database. MESC, Apia, Samoa
Government of Samoa (2009) Education Act 2009. Apia, Samoa
Government of Samoa (2007) Education For All – Mid‐Decade Assessment Report Samoa 2007. MESC, Apia, Samoa.
Government of Samoa. Manumea Database. MESC, Apia, Samoa
Government of Samoa (2013) MESC Statistical Digest 2013. MESC, Apia, Samoa.
Government of Samoa (2012) MESC Statistical Digest 2012 MESC, Apia, Samoa.
Government of Samoa (2011) Bilingual Education Policy Handbook: For use in the training of teachers in the delivery of the new primary bilingual curriculum. Malifa, Samoa Government of Samoa (2012) Population and Housing Census 2011: Analytical Report. Samoa Bureau of Statistics, Apia, Samoa. Government of Samoa (2007) School Nutrition Standards. MESC, Apia, Samoa
Government of Samoa (2012) Samoa Census of Population and Housing 2011. Samoa Bureau of Statistics, Apia,
Samoa
Government of Samoa (2013) Samoa Education Sector Plan July 2013 – June 2018. MESC, Apia, Samoa.
Government of Samoa (2011) Samoa School Nutrition Standards: Resource Booklet. MoH and MESC. Apia, Samoa
Government of Samoa (2012) Strategy for the Development of Samoa 2012 – 2016. MoF, Apia, Samoa.
Government of Samoa (2008) Strategy for the Development of Samoa 2008 – 2012. MoF, Apia, Samoa.
Lameta E. (2013) Draft Inclusive Education Policy for Students Living with Disability (IEPSD). Apia, Samoa
MESC (2012) MESC Annual Report July 2011 – June 2010. Apia, Samoa
MESC (2011) MESC Annual Report July 2010 – June 2011. Apia, Samoa
MESC (2010) MESC Annual Report July 2009 – June 2010. Apia, Samoa
MESC (2009) MESC Annual Report July 2008 – June 2009. Apia, Samoa
MESC (2012) MESC Corporate Plan July 2012 – June 2015. Apia, Samoa
MESC (2012) MESC Corporate Plan July 2009 – June 2012. Apia, Samoa
MESC (2011) Corporate Plan July 2009 – June 2012. Mid‐Term Review July 2009 – December 2010.
MESC (2012) Information Paper on Samoa Primary Education Certification Assessment. Apia, Samoa
MESC (2006) MESC Strategic Policies and Plan July 2006 – June 2015. Apia, Samoa.
MESC (2005) National Curriculum Policy Framework. Apia, Samoa
MESC (2010) National Teacher Development Framework. Apia, Samoa

66 | P a g e
MESC (2013) Samoa Inclusive Education Situational Analysis: Students with Disabilities 2013
MESC (2011) Strategic Policies and Plan July 2006 – June 2015. Apia, Samoa
MESC (2011) Strategic Policies and Plan July 2006 – June 2015, Mid‐Term Review July 2006 – December 2010.
MWCSD (…) Samoa National Policy for Persons with Disabilities. Apia, Samoa
National Council for Early Childhood Education Samoa Inc. (2001) Standards for Samoa Pre‐Schools. Apia, Samoa
National Council for Early Childhood Education Samoa Inc. (2001) Ta’iala mo Aoga Amata i Samoa. Apia, Samoa
Pacific Islands Forum Secretariat (2013) 2013 Pacific Regional MDGs Tracking Report. SPC, Suva, Fiji.
Pacific Islands Forum Secretariat (2009) Report On The Review Of The Forum Basic Education Action Plan
and Associated Regional Processes. Forum Education Ministers’ Meeting. Nuku’alofa, Tonga 24‐26 March
2009
Samoa Qualifications Authority [SQA] (2012) PSET Statistical Bulletin. Apia, Samoa
UNESCO UIS (2008) International Literacy Statistics: A Review of Concepts, Methodology and Current Data.
Montreal, Canada.
UNESCO (2012) Education Beyond 2015: Rethinking Learning in a Changing World. Outcomes Document. Bangkok,
Thailand.
UNESCO (2012) Towards EFA 2015 and Beyond – Shaping a new Vision of Education. Summary Outcomes. Bangkok,
Thailand.
UNICEF Guidelines for the Asia and Pacific Education For All: Mid‐Decade Assessment: Identifying and Reaching the
Unreached. Bangkok, Thailand.
World Bank (2013) Early Childhood Development. SABER Country Report.
World Bank (2013) New Perspectives on Strengthening Government Capacity to Intervene for School Readiness in Samoa, Tonga, and Vanuatu, SABER Report