Embed Size (px)
Citation preview
ISSN 1811 - 0762
EDUCATION
Volume 15 Number 2
December 2016

EDUCATION
Manzoor AhmedAdvisory Editor
Abu Hamid LatifEditor
Volume 15 Number 2 December 2016
A half-yearly journal published by BAFED in cooperation with BRAC Institute of Educational Development
BAFEDI n s p i r i n g E x c e l l e n c e
BRAC Institute of Educational DevelopmentBRAC University (BIED, BRACU)

BANGLADESH EDUCATION JOURNALA half-yearly journal published by BAFED in cooperation with BRAC Institute
of Educational Development
Editorial Board
Advisory EditorManzoor Ahmed
Editor
Abu Hamid Latif
Members
Sekander Hayat Khan
Siddiqur Rahman
Harunur Rashid Khan
Cover Design
Abul Mansur
Manan Morshed
Publication Information
Bangladesh Education Journal is published by Bangladesh Forum for Educational Development (BAFED). Articles for publication in this journal are required to be of high standard and meet the criteria set by the editorial board. The articles are collected by BAFED or these can be sent directly to the editor. The journal follows a peer review process and is edited by a board of editors. The journal is published from Bangladesh twice a year in English Language and the ISSN of the journal is 1811-0762.
Another publication of BAFED is the Bangladesh Shikhsha Shamoiki (Bangladesh Education Periodical) published in Bangla. This is also published by following same procedures as in the case of English journal. Bangladesh Shikhsha Shamoiki follows a peer review process. The journal is published twice a year (ISSN 1991-6655).
Both the Journals are disseminated widely in print at national and international levels. They have a wide readership among those who are working in the area of education and development, both in the government and outside, as academics, researchers, policy makers, development partners and civil-society members. The contents of both Journals are posted on the website: http://www.bafed.net/Journal.php
Bangladesh Education Journal, Volume 15, Number 2, December 2016. Published by Nazmul Haq, Executive Secretary, BAFED, on behalf of Bangladesh Forum for Educational Development (BAFED), 278/3 Elephant Road (3rd Floor), Kataban, Dhaka 1205. Phone: 9668593, E-mail: [email protected], Website: www.bafed.net
Printed by Arka, 3/1, Block-F, Lalmatia, Dhaka. Phone: 9126171.
Price : in Bangladesh Tk. 100.00, Abroad US$ 5.00

Notes form the Editor
John Richards and Aidan R. Vining, professors at Simon Fraser University in Canada, write about weak performance of students and schools in primary education in Bangladesh in the lead article “Achieving Better Primary School Outcomes in a Context of Weak Education Governance.” They suggest governance measures to address the problem. Their ideas deserve serious consideration as the post-PEDP3 options are considered and in the context of the SDG2030 education targets.
An account of a special effort to improve secondary education performance in three clusters of 15 rural secondary schools with assistance from Volunteers Association for Bangladesh (VAB), a group of Bangladeshis residing in USA, is given by Dr. Jasimuz Zaman in “Rural Secondary Education: An Experiment in Quality Improvement.” The writer, a former professor of the Bangladesh University of Engineering and Technology (BUED), who leads the initiative on behalf of VAB, shows what is possible with a dose of modest funding combined with some dedication and imagination.
Public examinations are inherently discriminatory for students because they are compelled to attend schools of greatly varying quality. The fairness of public examinations and their role in improving education are matters of continuing debate. Aspects of public examinations at primary and secondary levels are presented in two articles.
Mohammad Shahidul Islam, in “Dilemma of the high-stake public examination for primary education in Bangladesh: Can decentralization help?” proposes decentralization of the primary completion examination and more emphasis on school-level formative assessment as a way of changing the high-stake character of the primary school public examination and shifting the focus to teaching-learning from examinations.
The Bangladesh Examination Development Unit (BEDU) -- led by Robiul Kabir Chowdhury, Jack Holbrook, Chowdhury Mufad Ahmed, Md. Ali Ahsan, and Ahmed Obaidus Sattar Bhuiya -- discuss some of the weaknesses in the Higher Secondary Certificate Examination in “An analysis of 2015 examination results for selected subjects of three examination Boards.” They recommend standardization of marks across subjects and different examination Boards, regular item analysis, and improvement in setting papers and marking papers.

C o n t e n t s
Notes from the Editor
Achieving Better Primary School outcomesin the context of Weak Educational
Governance: A Case Study of BangladeshJohn Richards
Aidan R. Vining09-24
Jasimuz Zaman25-44
Mohammad Shahidul Islam45-50
An Analysis of 2015 HSC Examination Results forSelected Subjects of Three Examination Boards
By the BEDU team led by:Robiul Kabir Chowdhury, Jack Holbrook, Chowdhury Mufad Ahmed,
Md. Ali Ahsan, Ahmed Obaidus Sattar Bhuiya51-66
Rural High Schools in Bangladesh: An Experiment on Quality Education
Dilemma of the High-Stake Public Examination for PrimaryEducation in Bangladesh: Can Decentralization Help?
09-25
47-52
27-45
53-68

Achieving Better Primary School Outcomes in a Context ofWeak Education Governance: A Case Study of Bangladesh
*John Richards**Aidan R. Vining
Abstract
The primary school completion rate in Bangladesh has increased dramatically since 2008, but average learning levels in the final grade (grade five) are very low. In an attempt to explain this emphasis on “quantity” over “quality”, we analyze institutional problems in the national primary school system, using a principal-two-levels-of-agent (PA) model. As precondition for realizing major improvements in school quality, the national government needs to address these PA problems. If it does so, the two essential components of reform are effective decentralization of authority, and implementation of well publicized core competency school assessments. If the government is unwilling to address PA problems, domestic philanthropists and social entrepreneurs, owners of “low fee” private schools, individuals and groups interested in madrassas, NGOs and foreign donors can attempt to “work around” the government by expanding non-government school options. There are other means to promote student and school performance. For example, these non-government actors can undertake regular large-scale in-home surveys of children’s capacity to read and do basic mathematics. Use of Pratham’s instrument (used in conduct of annual surveys in rural India) would enable cross-country school quality comparisons.
KEY WORDS – Bangladesh, primary education, school quality, core competency assessments
[ Editors’ Note: Professors Richards and Vining have characterized the pervasive education governance problems and their effects on student and school performance in Bangladesh as an issue of principal-agent interaction (between parents, on the one hand, and central education authorities and local authorities including individual institutions, on the other). They postulate solutions in terms of reforms in the public system with greater decentralization including accountability through independent assessment of student and school performance for all types of schools. They also suggest expanding options for parents and competition among education service providers through expansion of low cost non-government providers of acceptable
* Professor, School of Public Policy, Simon Fraser University, Vancouver, BC, V6B 5K3** CNABS Professor of Government and Business Relations, Beedie School of Business, Simon Fraser
University, 500 Granville Street, Vancouver, BC, V6C 1W6

10 Bangladesh Education Journal Bangladesh Education Journal 11
that low national government effectiveness is a factor, certainly not the only factor, to explain national outcomes in a wide range of social policy outcomes, in health as well as education (Richards & Vining, 2015).
Complex institutions, such as school systems, require “agents” to realize the institutional goals. Agents are groups that share relevant expertise and resources (such as financial and/or political power) that the principals lack. Thanks to their knowledge and control of resources, agents inevitably exercise considerable autonomy within institutions. Ideally, agents contribute effectively to realization of the institutional goal; they may however use their autonomy in a manner that unduly exaggerates their own benefits, and unduly hampers realization of the institutional goal. To be somewhat more specific, we consider a model with principal and at least two levels of agents (Tirole, 1986), as shown in Figure 1. Low-income parents, who lack access to high-quality private schools, are the principals: their goal is a reasonable quality education for their children. In the highly centralized Bangladesh school system, the central government and senior officials in the Ministry of Primary and Mass Education (MoPME) comprise the first-level agents. They provide national-level supervisory functions, which include distribution of public funds and certification, via the Primary Education Completion Exam (discussed below), of students who successfully complete the primary cycle.
There are important second-level agents responsible for delivery or monitoring of education services. Both individual members of parliament (MPs) and senior local government
quality. The article raises at least three sets of questions: a. How workable is this agenda given the root causes of weak education governance; b. What consequences may this have for fulfilling the right to education and the principle of basic education as a public good; and c. How best can the ideal and the pragmatic be reconciled. We hope that this article will provoke a thoughtful discussion.]
1. IntroductionThe administration of national school systems requires multiple hierarchical levels, the co-ordination of many levels of government, and a large work force of professional teachers plus administrative and support workers. Even in countries blessed with generally effective national governments, education policy is subject to significant “agency loss”. In countries with relatively weak national governance, the potential for agency loss is much more severe. In these countries, administration of schools, especially government-run schools, may become stuck in a low-quality equilibrium, a “trap”. Major improvements in quality are unlikely without some (probably external) destabilizing shock.
In this article we discuss the current educational system in Bangladesh using a principal-agent (PA) model. Whether explicitly or implicitly, this approach is widely used to analyze educational systems. The aspect of the PA model on which we focus is collusion among various kinds and levels of agents, leading to an equilibrium with less than ideal student outcomes. Many low-income countries are stuck in this situation. This reality suggests that reform requires pursuit of at least two strategies: 1) policies for government schools that, making due allowance for the state of national governance, may realize improvements, and 2) policies that “work around” poor macro-institutional governance by expanding the potential for non-government schools.
We first describe some of the principal-agent dynamics within the national education system of Bangladesh. They are sufficiently severe, we argue, to warrant describing the status quo in the government school sector as a low-equilibrium “trap”. Second, we discuss incremental reform policies in the government sector, and policies that attempt to expand non-government school options.
2. Is the Bangladesh school system caught in a low-equilibrium “trap”?The “government effectiveness” dimension of the World Bank’s (2016) governance
1indicators measures perceptions of overall quality of public service delivery. Table 1 shows the percentile rank of the effectiveness dimension for the five major South Asian countries and three other Asian countries. Bangladesh scores consistently in the bottom quarter of all countries (approximately 200) included in the World Bank calculations. This is suggestive
1 The country scores for each year and each dimension of the World Bank governance indicators are normalized as standard normal distributions. Government effectiveness in delivery of services is one of six dimensions. A country’s score on any dimension is an estimate of its governance quality relative to the world average, which is set at zero. This normalization procedure implies no change from year-to-year in average global quality of governance.
Table 1: Government Effectiveness and Gross Primary School Completion Rate,Selected South, Southeast and East Asian Countries
Government effectiveness
Country 2004 2009 2014
(percentile rank)
Bangladesh 21 23 22
Cambodia 18 19 25
China 59 58 66
India 55 56 45
Nepal 21 18 20
Pakistan 40 24 22
Sri Lanka 43 51 57
Vietnam 41 48 52
Source: World Bank (2016)

12 Bangladesh Education Journal Bangladesh Education Journal 13
2officials play a role in local school management. Teachers unions comprise another set of important second-level agents exercising considerable autonomy.
3We identify two additional second-level agents. Ebtedayee madrassas and NGO-operated nonformal schools are significant providers of primary education. Combined, their students
4represent roughly a tenth of the total primary student population. Both have little choice but to pursue government accreditation for their graduates via the PECE. However, these schools maintain autonomy over curriculum and teacher selection.
What evidence exists to justify describing the school system in terms of agents pursuing autonomous goals that potentially run counter to the realization of reasonable quality education?
Allegations of payment to local politicians and officials to obtain teaching position in government school
5There are widespread allegations that in many upazila the prerequisite for an aspiring teacher obtaining a teaching position is to provide a payment to relevant local politicians and education officials. Newspapers often write about what is called Niyog Banijjo (“employment trading”), the practice of arranging government employment in lieu of payment, a practice in which influential politicians including elected representatives allegedly engage. Evidence on the frequency and size of such payments is obviously hard to obtain. But, based on personal interviews with many education professionals, such payments are widespread throughout Bangladesh. The current level appears to be in the range of US$5,000 – US$10,000.
The damaging impact on school performance is obvious. These payments introduce a problem of adverse selection in choice of teachers. Parents presumably want teaching ability to be the major criterion for teacher selection. However, the major criterion for selection is not indicators of merit but an applicant’s ability to raise the necessary payment. In addition, the payment requirement presumably induces moral hazard in the context of teacher training. It lowers the motivation of students pursuing teacher training to devote appropriate time and effort to their studies, and of their teachers to take seriously the obligation to train them.
2 In 2007 the military-led caretaker government abolished any formal role for MPs in school management and the courts subsequently banned MPs from formal membership on school management committees. But their informal influence in school decisions persists.
3 Ebtedayee madrassas follow the government curriculum and seek accreditation, while Qwami madrassas do not, and do not receive money from the government.
4 The government-managed school sector includes students of the “newly nationalized” schools (formerly Registered Non-Government Primary Schools) that, until 2013, were private. The Directorate of Primary Education estimates the 2015 primary student population at 19,100,000. The principal school types include 14,300,000 in government-managed schools, 1,200,000 in Ebtedayee madrasas, 2,300,000 in for-profit private schools (“kindergarten”) and 600,000 in nonformal schools. The majority of students in the nonformal sector attend BRAC schools (DPE, 2015: 9).
5 Upazila are sub-national administrative units. There exist approximately 500 upazila in Bangladesh,with an average population each of 250,000.F
igu
re 1
: A
mod
el o
f P
rin
cip
al a
nd
age
nts
pri
nci
pal
s (p
aren
ts)
firs
t-le
vel
agen
ts(c
entr
al g
over
nm
ent)
seco
nd
-lev
el a
gen
ts(r
egio
nal
)

14 Bangladesh Education Journal
Bangladesh, Enrolment and Completion Rates, 2005-15
110
105
100
95
90
85
80
75
70
65
60
55
50
452005
93.7
87.2
52.1
2006
97.7
90.9
49.5
2007
98.5
91.1
49.5
2008
97.6
90.8
50
2009
103.5
93.9
54.9
2010
107.7
94.8
60.2
2011
101.5
94.9
70.3
2012
104.4
96.7
73.8
2013
108.6
97.3
78.6
2014
108.4
97.7
79.1
2015
109.2
97.94
79.6
gross enrolment rate
net
enrolment rate
gross completion rate
perc
ent
Figure 2
Note: The gross enrolment rate is the number of children, regardless of age, enrolled in grades 1 – 5 relative to the total population of children ages 6 – 10 (official primary school age range in Bangladesh). With an increase in enrolment effort the gross enrolment rate may exceed 100 percent for some period of time. The net enrolment rate is the number of children of the official primary school age (6 – 10) enrolled in grades 1 – 5 relative to the total population of children ages 6 – 10. The gross completion rate is the percentage of a cohort of pupils enrolled in the first grade of primary education in a given school year expected to complete primary education – at whatever age. The measure of completion is passing the PECE. Before 2009, completion required passing a school-based exam.
Source: DPE (2015, 122)
6 An important recent example of teacher union influence on policy is their successful lobbying to nationalize the registered non-government private schools in 2013. These schools started as private schools with an expectation of some government support. Before 2013, they provided some competition to government schools. With nationalization, this potential for improving school quality has disappeared.
Bangladesh Education Journal 15
Lax monitoring of teacher attendance in class and tolerance of private paid tutoring
Applicants are prepared to pay a sizeable amount to obtain a teaching position because the payment is, in effect, a means of sharing with politicians and officials future income that teachers expect to earn via private tutoring of their students. The prevalence of private paid tutoring is very widespread (CAMPE, 2015: 66-68). In South Asia, teacher unions support a regulatory regime of lax monitoring of teacher attendance and time spent teaching in class, which in turn facilitates teachers undertaking private paid tutoring outside of school hours
6(Kingdon et al., 2014; ASER, 2015).
The Primary Education Completion Exam
Prior to introduction in 2009 of the Primary Education Completion Exam (PECE), critics could point to numerous principal-agent problems in the administration of the public school
system (Nath & Chowdhury, 2009; Sabur & Ahmed, 2010; Asadullah & Chaudhury, 2015). However, the assessment of primary school completion in government schools was decentralized to the upazila level and was not subject to a centralized operation that appears to have created a political incentive to inflate the completion rate. While decentralization did result in some lack of grading uniformity across the country, in general the test results were considered a reasonable reflection of student learning (Islam, 2016: see pp. 45-50 of this issue).
The government claims that introduction of the PECE, a centralized test administered across Bangladesh to all students in grade five, is a means to assure uniform certification standards for primary school completion. After its introduction, over 95 percent of those sitting the test have achieved at least a basic pass. Both secondary schools and employers now use a passing PECE grade to assess primary school completion (CAMPE, 2015).
As Figure 2 shows, the Bangladesh net enrolment rate exceeded 90 percent by 2005. Relative 7to the 45 percent estimate for the year 1989, the gross primary school completion rate in
Bangladesh had increased only modestly by the 2005-08 interval (DPE, 2015: 122). The explanation for the large gap between enrolment and completion rates in the years prior to 2009 was high dropout and grade repetition rates (Nath & Chowdhury, 2009; Hossain, 2010). Beginning in 2009, the reported completion rate increased rapidly, and reached 79 percent by 2013. Based on our interviews, the only significant explanation offered to explain the post-2008 increase is introduction of the PECE. There are no major post-2008 discontinuities in other factors, such as government spending on education or
8student/teacher ratio.
There are good reasons to conclude that the 30-percentage point increase represents little if any improvement in student learning outcomes relative to pre-2009. Grading of the PECE exam is lax. The pass rate has been set at a threshold of 33 percent on student exams, which has generated an average of 97 percent of students who write the test having achieved at least a basic pass over the years 2010-14 (DPE, 2015: 85). The average pass rate range among basic school types is very small (three percentage points). A higher pass threshold of, say, 50 percent would both lower the aggregate pass rate to approximately 75 percent, and reveal substantial differences in student performance across school categories. (See Figure 3.)
7 UNESCO reports no completion rate estimates for Bangladesh in the 1990s.8 Bangladesh expenditure data compiled by UNESCO are available only for the years 2006-09 (UNESCO,
2016). Government expenditure per students as a percent of per capita GDP averaged 8.4 percent over the first three years; it declined to 7.8 percent in 2009, the first year of the PECE. The analogous statistics for share of government spending devoted to primary education were 44.5 percent for 2006-08 and 44.7 percent in 2009. The Directorate of Primary Education (2015: 107) admittedly reported a modest decline in average student/teacher ratio between years preceding introduction of the PECE (47.8 over years 2005-08) and after (45 over years 2009-15).

16 Bangladesh Education Journal Bangladesh Education Journal 17
Leaked questions are widely accessible via the internet. The government has tried to take measures to prevent such leaks and claims that this is no longer a major problem. However, a set pattern of questions are used annually, which encourages memorization of answers through coaching and tutoring. The PECE has induced a large increase in private tutoring, much of it based on rote learning and memorization of answers of expected questions. A recent large-scale survey found that 77 percent of parents with children preparing to sit the PECE engage private tutors (CAMPE, 2015: 66-68). Forty percent of these tutors are teachers of the relevant students and 15 percent are teachers from other schools. According to the survey, the average family paid Taka 3970 (approximately US$50) per student over 12
9months on items related to sitting the PECE.
Since 2006, the Directorate of Primary Education (DPE) has sponsored four large-scale surveys of student reading and mathematics performance in grades three and five, surveys conducted by a reputable external research institute (the Australian Council for Education and Research) (DPE, 2014). Unfortunately, changes in test items across rounds prevent direct comparison between the 2006/2008 rounds (carried out prior to introduction of the PECE) and the 2011/2013 rounds. In 2011 and 2013, only 25 percent of grade five students were assessed as working at grade level in reading and writing Bangla; the equivalent statistics for mathematics were 32 percent in 2011 and 25 percent in 2013.
A similar dramatic increase in primary completion rates has taken place in India over the last decade – and concerns about completion rate increases based on erosion of standards are widespread in India, as in Bangladesh (Drèze & Sen, 2013; ASER, 2015). One high profile response in India has been the civil society initiative undertaken by Pratham, an initiative intended to test reading and arithmetic competencies of primary school age cohorts across rural India via annual stratified random sampling using a simple instrument administered in
10children’s homes. Jones et al. (2014) report results from a version of the Pratham instrument adapted for use in three countries of east Africa. Their results indicate similar problems of students certified as having completed a primary education cycle with an unreasonably low average level of acquired competencies in the core subjects of reading and mathematics.
Second only to reduction of hunger, realization of universal primary school completion by 2015 ranked the highest among the UN’s Millennium Development Goals. Realizing MDG2 figured prominently among international donor priorities over the previous decade. The evidence emerging from India, Sub-Saharan Africa – and Bangladesh – is that many national governments have chosen to avoid the political conflicts attendant on tackling principal-agent problems in their respective school systems, and have chosen instead to “game” MDG2. Certifying children as having completed the primary education cycle has become a function of politically imposed target graduation rates.
Agency collusion
The advocates of MDG2 had hoped that reasonable quality “education for all” would inter-generationally eliminate the segmented equilibria long present in low-income countries: a high human capital equilibrium among strata able to purchase private education of reasonable quality for their children and a low human capital equilibrium among strata not able to do so. Santos (2011) has formalized analysis of such multiple equilibria using an intergenerational model of human capital formation in which variable school quality is a key parameter.
In his article laying out a principal/two-level-of-agents model, Tirole (1986) observed that various agents frequently collude, which reinforces their mutual commitment to maintenance of the status quo. In the case of Bangladesh, the informed judgment is that teacher unions accede to illegal payment made by prospective teachers to MPs and officials, and do not protest this practice vigorously. In exchange, teachers unions expect lax monitoring of teachers’ classroom performance and acceptance of teachers undertaking private tutoring of their students.
The motivation of the government in introducing PECE may in part have been to increase hours spent teaching without disrupting conventions about lax monitoring of teachers and private tutoring. Despite PECE’s evident weaknesses as a test of student learning outcomes, teacher unions have acquiesced in it because it has induced parents to demand additional private coaching.
In concluding this section, it is important to emphasize that agents are a necessary feature of large institutions. School systems cannot functions without professional administrators and trained teachers. Professional organizations, including teachers unions, may be valuable in establishing minimum teacher qualifications. Schools in the non-government sector may or may not offer superior quality teaching (which we discuss later), but their competition for students with government schools may provide a useful incentive to increase the quality of teaching in both the government and non-government sector.
3. What’s to be done (1)?At a tactical level, there are many “good ideas” for school reform that the government of Bangladesh can pursue. For example, Making Schools Work: New Evidence on Accountability Reforms (Bruns et al., 2011: ix) is a comprehensive World Bank survey of “the best methods for improving school effectiveness, especially through better information, devolution of authority, and stronger incentives for teachers.” However, the principal-agent problems discussed in the previous section are, in our opinion, sufficiently severe that, unless the government is willing to address them, the prospect for major improvements in school outcomes via tactical reforms is low. If the government is willing to tackle the principal-agent problems, a strategic approach to reform should contain two elements: effective decentralization of school management, and introduction of “low-stakes” core competency assessments of learning outcomes in all schools, government and non-government. Results of such assessments should be widely publicized, disaggregated by school type, by upazila, and ideally by individual schools.
9 Expenditures related to sitting the PECE include school-based coaching; private tutoring; transportation for additional tutoring; model tests; buying of guidebooks, suggestions and hand notes; registration for sitting the examination; photograph for registration and transportation to examination centre (CAMPE, 2015: 94-95).
10 See ASER (2015) for the latest annual report.

18 Bangladesh Education Journal Bangladesh Education Journal 19
Effective decentralization of school managementThe Program for International Student Assessment (PISA) is an ambitious survey of student performance in three subjects (reading, mathematics, and science) at the upper secondary level, conducted at three-year intervals by the Organization for Economic Cooperation and Development (OECD). Worldwide, the total sample of students exceeds 500,000. The 2015 round includes 70 countries: all OECD members plus many others, including several medium- and low-income countries (OECD, 2016a). In addition to surveying students, PISA surveys head masters (school principals) of the sampled schools in each country. In the present round, PISA uses the head master survey results to undertake an extensive comparative analysis of the impact of alternative school governance arrangements on student outcomes (OECD, 2016b: 210-223).
The analysis disaggregates school governance into five functions: 1) decisions on human and financial resources (hiring/firing teachers, setting salaries and school budgeting); 2) determination of curriculum; 3) exercise of student discipline (e.g., attendance); 4) student evaluation (e.g., “high stakes” testing of student outcomes; “low stakes” core competency assessments); 5) student admission. Simultaneously, PISA identifies five administrative levels for potential exercise of each function: 1) school head master; 2) teachers in their school; 3) school governing board (e.g., school management committee for a single school or for a network of local schools); 4) sub-national political authority (e.g., upazila); 5) national education ministry. For each function in each country, PISA averages the head masters’ assessments of the relative importance of each administrative level in exercising each function.
11Finally, PISA correlates these national averages with national science scores in the 2015 round.
What are the results? The strongest correlations (all negative) exist between relative weight of the national education ministry in exercise of the five functions and national science scores. For example, the correlation between head masters’ estimates of the weight of the national education ministry with respect to curriculum design and PISA-assessed science outcomes is -0.64; the analogous statistic with respect to student assessment is -0.47. (See Table 2.) In general, the relative weights of school governing boards and regional education authorities have no statistically significant impacts on national science scores. By contrast, higher weights exercised by teachers on curriculum, student discipline and assessments have a significant positive impact on science scores. Finally, the greater the national weight of head masters in exercise of any function the higher tend to be national science scores. This tendency is strongest with respect to curriculum design and student assessments.
The PISA institutional analysis is a worthy attempt to draw conclusions about best institutional practice. One qualification is obvious: the analysis bears on institutional dynamics at the upper secondary level, which may differ at the primary level. The major qualification, however, is methodological. The analysis comprises a series of bilateral relationships; it does not allow for multivariate interactions. In the case of Bangladesh, national politicians and centrally controlled officials have created serious “adverse selection” effects in the hiring of teachers, which casts doubt on the relevance to Bangladesh of empowering teachers and head masters without simultaneously reforming teacher selection.
Consistent with the PISA analysis, few independent analysts consider ideal a public school system as centralized as that of Bangladesh – a country of 170 million and over 20 million primary students. However, as UNESCO (2015: 214) acknowledges in its 2015 Global Monitoring Report, “decentralization is a highly political process.” An attempt to reform simultaneously the administration of all schools would maximize political opposition by beneficiaries of the status quo. It is probably preferable to take a long-term perspective, to start by designating several dozen upazila in different regions of the country as pilot projects. In these pilot upazila, the MoPME should benchmark present education outcomes and, after five years (the time for a cohort to pass from grade one to five), analyze the change in quality of student outcomes (hopefully large and positive) relative to change in other upazila. Thereafter, extend the exercise.
To illustrate what is entailed in effective decentralization, we sketch the hypothetical allocation of functions necessary to a school system among three levels of administration, school, upazila, and national education ministry:
• Financing of schools: Given the highly centralized tax regime in Bangladesh, the national government is the only level able to raise and distribute adequate school funding. However, transfers from Dhaka could be supplemented by inviting upazila to introduce modest tax provisions whose revenue would be directed to local government schools. The Bangladesh taxing effort is low, even by South Asian standards (Le et al., 2012). A local tax dedicated to school financing introduces an element of “tax-
11 In each round PISA emphasizes one of the three subjects. In 2015, the survey emphasizes science. Hence, the choice of national science performance in assessing the effect of national institutions on education outcomes. The principals’ estimates are not necessarily binary. Principals may indicate joint exercise of a function by more than one administrative level. The national average weight of any administrative level in exercise of any particular function is a continuous variable, ranging from 0 to 1.
Table 2: Correlations between National Weight of Administrative Level in Functionand National Science Score, PISA2015 (n=70)
Budget and human resources
Curriculum Student disciplineStudent testing and system assessment
Student admission
Head master (principal)
Teachers
School management board
Regional administrative unit
National education ministry
0.33
0.13
-0.16
-0.20
-0.40
0.26
-0.09
-0.35
0.18
-0.23
0.50
0.24
-0.07
-0.01
-0.47
0.31
0.33
-0.12
-0.07
-0.44
0.50
0.48
0.10
0.09
-0.64.
Source: OECD (2016b: 120)
20 Bangladesh Education Journal Bangladesh Education Journal 21
spending coincidence,” a concept often central to policy recommendations in the context of decentralized administration. Requiring a sub-national jurisdiction that spends public funds to raise a share of its budget by taxing residents of the jurisdiction creates a valuable incentive on local residents, in their capacity as taxpayers, to address accountability. The tax should not be in the form of a fee charged to parents; it might take the form of a modest business tax on village storekeepers, and/or a property tax on land owners.
• Curriculum design: The implication of the PISA analysis is that school-level agents should exercise considerable discretion in curriculum design and choice of textbooks. There is sensitivity about what may be taught in schools in the context of religious fundamentalism and other extremist ideologies. Guidelines and a judicious approval mechanism of learning materials and curriculum content may be applied.
• Human resources: Education research is nearly unanimous on the importance of teacher quality in explaining student outcomes (for example, see Hanushek & Woessmann, 2015). Reforming procedures for hiring/firing and promotion of teachers is necessary, but it is the most controversial dimension of decentralization to implement. It is unrealistic to envision individual school managing committees exercising this function. If upazila level officials are to hire on merit-based criteria, monitor teacher performance more closely, and suppress the conventions of under-the-table payment, this will require explicit support from the national government. While this is politically difficult to accomplish, the Rural Electrification Board is perhaps a relevant precedent: a public sector organization that has, over four decades shown an
12impressive capacity to minimize corruption in its operations.
• Certification of primary school completion: The PECE is an inefficient instrument for exercising this function. Better to return the responsibility for evaluating competencies at grade five to the upazila level. Within upazila, it may well be appropriate to allow individual schools, or networks of schools, to design their own tests. While introduction of core competency assessments at a national level is a desirable innovation (see below), such assessments should be low-stake; they should not be the basis for certifying student completion of the primary cycle.
Core competency assessmentsCore competency assessments are, in general, low stake assessments of student performance on a few core subjects. The purpose is not to evaluate individual students for the purpose of promoting them or requiring repetition, but to provide an objective instrument for assessing the performance of a school system and elements within it. The 2015 UNESCO Global Monitoring Report (2015: chapter 6) notes the increase in national student assessment surveys from 12 in 1990 to 101 countries in 2013, and that the ability to read/write the dominant regional language and perform basic mathematics is the common denominator of these assessments. The use of low-stake testing of students in core competencies at several grades in the primary/secondary school cycle has become a widely accepted practice in
13many countries over the last two decades.
To enable comparison of school types and relative performance of upazila, it is appropriate that the MoMPE organize core competency assessments on a national scale. The large-scale national student surveys in grades three and five, sponsored by the Directorate of Primary Education provide precedents.
4. What’s to be done (2)?The assumption underlying the previous discussion is that the national government acknowledge the severity of principal-agent problems and be intent on addressing them. If that is not the case for the foreseeable future, domestic philanthropists and social entrepreneurs, owners of private “low fee” private schools, imams interested in promotion of madrassas, NGOs and foreign donors can attempt to “work around” the principal-agent problems by expansion of non-government school options. The first question is, are such schools likely to improve learning outcomes relative to the status quo.
One way to answer this question is to examine PECE results by major school types. PECE is admittedly a weak basis on which to measure relative performance of school types, but it does provide comparative evidence. Figure 3 illustrates the cumulative distributions, by the four major school types, of PECE results in the large-scale CAMPE survey conducted in 2014. (Average PECE scores by school type are indicated in the legend in parentheses.) Of the 19 million Bangladesh students in primary school in 2015, 18 million (94%) attend one of the four school types illustrated. (See fn4.)
12 The Rural Electrification Board (REB) provides an interesting precedent in Bangladesh for containing the culture of boksheesh. The REB operates as a hybrid organization (Vining & Richards, 2016), with a strong central planning administration. But it also comprises approximately 70 semi-autonomous palli biddyut samitee (PBS) responsible for distribution of power and collection of revenue within their respective territories. Relative to the state-owned Power Development Board, the PBS have an impressive record of containing “system loss” (i.e., theft of power) and collecting on bills (Nathan, 2006; Ramatullah et al., 2008).
13 Volante & Earl (2012) usefully summarize the multiple dimensions in design of core competency assessments of school systems.

22 Bangladesh Education Journal Bangladesh Education Journal 23
Based on results of the 2014 CAMPE survey, the average PECE grade in government schools is 62%. Not surprisingly, the average grade in the kindergarten sector is the highest (78%) and its cumulative PECE grade distribution overwhelmingly dominates that of the other school types, especially at thresholds above 70%. The nonformal sector comprises mostly secular schools sponsored by NGOs. Over half the students in this sector attend a BRAC “no-fee” school targeting low-income villages and urban neighbourhoods. The average 2014 PECE grade of schools in this sector is 65%, about three percentage points higher than in government schools. In terms of the cumulative distribution of grades, the nonformal sector dominates the government school distribution at all thresholds except the highest. The weakest school type, in terms of average PECE grade (56%) and cumulative distribution is the madrassas.
In assessing the potential of non-government schools to “work around” weakness in the government sector, much depends on the distribution of additional non-government schools. Based on past history, equi-proportionate expansion of the various nonformal schools will probably introduce a modest improvement; expansion of madrassas will not. In recent years BRAC has launched a network of Shishu Niketan “low fee” schools, targeting families whose incomes, while low, are above the target range for no-fee BRAC nonformal schools (Nahid & Nath, 2014). The expectation is that these schools be largely self-financing. The growth of “low fee” non-government schools is a widespread response in South Asia to perceived inadequacies of government schools.
Future expansion of the nonformal sector – defining it broadly to include “low fee” schools such as those introduced by BRAC – invites a second question: does the generally superior performance of this sector relative to government schools reflect school quality or is it a function of various unspecified factors, such as higher family incomes among families of children in nonformal schools. Ashley and colleagues (Ashley et al., 2014; Ashley & Wales, 2015) have undertaken an ambitious meta-analysis of refereed studies of “low fee” private schools. Relative to government schools, they conclude such schools do on average provide better teaching and improve student outcomes, but they are unlikely to reach the “truly disadvantaged”. Wales et al. (2015: 5) have undertaken a parallel meta-analysis of philanthropic schools, including madrassas. They conclude they do reach the poor and “that students in these schools achieve learning outcomes that are better than, or at least as good, as those of state school students.” However, they emphasize relevant studies are few, and their rigour often questionable.
Based on institutional analyses of Indian schools, the principal-agent problems in India’s government school sector are similar to those we have identified in Bangladesh (Kingdon & Muzzamil, 2009; Drèze & Sen, 2013; ASER, 2015). Hence, assessment of non-government vs. government school outcomes in India is probably relevant to the case of Bangladesh. One of the most rigorous assessments, in the context of rural India, is that of French and Kingdon (2010), using the very large samples generated by Pratham for the ASER annual surveys of rural Indian schools. Overall, the range of non-government schools they analyze corresponds approximately to that in the nonformal sector in the Bangladesh context. Their sample excludes madrassas, a category of less relative importance in India than in Bangladesh. The schools they assess no doubt include relatively more “low fee” private schools than in Bangladesh, and no Indian NGO is as relatively important in primary education as is BRAC in Bangladesh. Controlling for many potentially relevant factors, French and Kingdon estimate a non-government school premium over government school outcomes on the ASER reading and mathematics assessments of about 0.2 standard deviations. The most important control factors incorporated in their analysis are fixed effects for individual households.
A complementary tactic to accompany expansion of the non-government school sector is for an independent agency to undertake regular home-based surveys of student school outcomes
100
90
80
70
60
50
40
30
20
10
080% and
above70% and
above50% and
above40% and
above
30% and above(pass)
0% andabove
7.2
40.6
4.1
0.7
37.5
84.8
49.2
20.1 65.4
83.0
97.0
72.1 92.4 99.1
99.6
99.2
95.5 100.0
100.0
100.0
100.0
98.8
97.2
89.9
Government includimg newlynationalized school; average61.7%
Nonformal school (average 65.0%)
Ebtedayee madrassas (average 56.2%)
Kindergarten private schools;average 78.2%
cum
ula
tive
Note: The estimated average grades by school type are calculated from CAMPE survey results, assuming a rectangular distribution of grades within each interval.
Figure 3
Cumulative Distribution of PECE Gradesby School Type, 2014
Source: authors’ calculations from CAMPE (2015: 106)

24 Bangladesh Education Journal
analogous to those undertaken by Pratham. Indeed, if the Bangladesh non-government school sector agreed to use the Pratham assessment instrument, it would become possible to make a realistic comparison between primary sector outcomes in the two countries.
5. ConclusionThe fundamental argument of this article is that the principal-agent problems present in the Bangladesh education system are sufficiently severe that the country belongs among the set of countries stuck in a low-equilibrium “trap”. Consequently, it is necessary to advance alternate sets of policies: 1) policies based on the assumption that the government is intent on addressing principal-agent problems; and 2) policies to encourage “working around” the status quo and enable sufficient expansion of non-government schools of acceptable quality to generate reasonable options to parents and more competition among providers of schooling. In the first case we propose two key elements to a reform strategy: effective decentralization of school management and conduct of high-profile “low stakes” assessments of core competencies in all school types. Tactically, we propose an incremental approach to reform: choice of a small set of upazila as pilots, and only if they generate respectable results to proceed to wholesale decentralization. In the second case, we propose that social entrepreneurs expand the nonformal sector and “low fee” non-government schools. A useful complement is to organize village-based surveys of core competencies among children in the relevant age cohort.
References
Asadullah, N. & Chaudhury, N. (2015). The Dissonance between Schooling and Learning: Evidence from Rural Bangladesh. Comparative Education Review, 59(3): 447-472.
ASER Centre (2015). Annual Status of Education Report (rural), 2014. New Delhi: ASER Centre, with support from Pratham.
Ashley, L., McLoughlin, C., Aslam, M., Engel, J., Rawal, S., Batley, R., Kingdon, G., Nicolai, S., & Rose, P. (2014). The role and impact of private schools in developing countries, University of Birmingham, Institute of Education University of London, Overseas Development Institute.
Ashley, L. & Wales, J. (2015). The Impact of Non-State Schools in Developing Countries: A synthesis of the evidence from two rigorous reviews, University of Birmingham, Overseas Development Institute.
Bruns, B., Filmer, D., Patrinos, H (2011). Making Schools Work: New Evidence on Accountability Reforms. World Bank.
Campaign for Popular Education (CAMPE) (2015). Whither Grade V Examination? An Assessment of Primary Education Completion Examination in Bangladesh. Education Watch, 2014.
Directorate of Primary Education, Government of Bangladesh (DPE) (2014). Bangladesh Primary Education Annual Sector Performance Report, 2014.
Directorate of Primary Education, Government of Bangladesh (DPE) (2015). Annual Primary School Census, 2015.
Drèze, J. & Sen, A. (2013). An Uncertain Glory: India and its Contradictions, London: Penguin.
French, R. & Kingdon, G. (2010) The relative effectiveness of private and government schools in Rural India: Evidence from ASER data. Working Paper 10-03. Institute of Education, University of London.
Hanushek, E. & Woessmann, L. (2015) Universal Basic Skills: What Countries Stand to Gain. OECD.
Hossain, A. (2010). Age in Grade Congruence and Progression in Basic Education in Bangladesh. Consortium for Research on Educational Access, Transitions and Equity (CREATE). University of Sussex.
Islam, S. (2016). Dilemma of the High-stake Public Examination for Primary Education in Bangladesh: Can Decentralization Help? Bangladesh Education Journal, 15(2):45-50.
Jones, S., Schipper, Y., Ruto, S. & Rajani, R. (2014). Can Your Child Read and Count? Measuring Learning Outcomes in East Africa. Journal of African Economics, 23(5): 643-672.
Kingdon, G. & Muzzamil M. (2009). A Political Economy of Education in India: The Case of Uttar Pradesh. Oxford Development Studies, 37(2): 123-144.
Kingdon, G., Little, A., Aslam, M., Rawal, S., Moe, T., Patrinos, H., Beteille, T., Banerji. R., Parton, B. & Sharma S. (2014). A rigorous review of the political economy of education systems in developing countries, Institute of Education, University of London.
Le, T., Moreno-Dodson, B., Bayraktar, N. (2012). Tax Capacity and Tax Effort: Extended Cross-Country Analysis from 1994 to 2009. Policy Research Working Paper 6252. World Bank.
Nahid, D. & Nath, S. (2014). An Early Exploration of Shishu Niketan Schools of BRAC. BRAC education working paper.
Nath, S. & Chowdhury, M. (2009). State of Primary Education in Bangladesh: Progress Made, Challenges Remain. Dhaka: Campaign for Popular Education.
Nathan Associates (2006). Integrity in Bangladesh’s Rural Electrification. prepared for USAID.
Organization for Economic Cooperation and Development (OECD) (2016a). PISA 2015 Results: Excellence and Equity in Education.
Organization for Economic Cooperation and Development (OECD) (2016b). PISA 2015 Results: Policies and Practices for Successful Schools.
Rahmatullah, B., Norris, N. & Richards, J. (2008). A New Mandate for the Rural Electrification Board: Area-Based Planning Initiatives to Relieve Power Shortages. Centre for Policy Research, Dhaka: International University of Business Agriculture and Technology.
Richards, J. & Vining, A. (2015). Universal Primary Education in Low-Income Countries: The Contributing Role of National Governance. International Journal of Educational Development, 40(1):174-182.
Richards, J. & Vining, A. (2016) Under-Five Mortality: Comparing National Levels and Changes over the Last Decade Across Low-Income Countries. Journal of Comparative Policy Analysis: Concepts and Practice, 18(4): 419-438.
Sabur, Z. & Ahmed, M. (2010). Multiple Providers and Access to Primary Education: The Case of Bangladesh. Prospects, 40: 393-415.
Santos, M. (2011). Human Capital and the Quality of Education in a Poverty Trap Model. Oxford Development Studies, 39(1): 25-47.
Tirole, J. (1986). On the Role of Collusion in Organizatons. Journal of Law, Economics and Organization, 2(2): 8756-6222.
UNESCO (2015). Global Education Monitoring Report, 2015. Paris.
UNESCO (2016). UNESCO Institute of Statistics. Montreal.
Vining, A. & Richards, J. (2016) “Indigenous economic development in Canada: Confronting principal-agent and principal-principal problems to reduce resource rent dissipation.” Resources Policy, 49: 358-367.
Volante, L. & Earl, L. (2013) Standards, Accountability and Student Assessment Systems: an International Overview, Education Canada.
Wales, J., Aslam, M., Hine, S., Tawal, S. & Wild, L. (2015). The role and impact of philanthropic and religious schools in developing countries, University of Birmingham, Institute of Education University of London, Overseas Development Institute.
Bangladesh Education Journal 25

Abstract
The paper describes the evolution of a model for quality education embracing knowledge, competence and good citizenship for the rural high schools in Bangladesh. The essence of the model is to take measures in active partnership with the schools to empower all the stakeholders – students, teachers, management committee members, parents and community leaders. A comprehensive approach is taken for students to complement their learning with co-curricular activities in language, math and science. Activities through clubs and volunteer squads develop competence and good citizenship. The teachers are trained that enables them to teach better. The schools are provided with modest resources to support teaching and learning.
A pilot scheme to test the model was carried out with fifteen schools in three Upazilas in the country. Instead of considering an overhaul of the system, the model works for gradual change over a five-year period. VAB works in close coordination with the Government education officials in the locality. The model itself reflects the aspirations expressed in the Bangladesh National Education Policy. This paper describes the premises and the approach followed in the initiative. Progress made and results achieved so far in the pilot project are reported. VAB considers the model affordable and replicable and looks for partners in extending the work in a larger number of schools in the country.
Key Words: Secondary Education in Bangladesh, Rural High Schools, Experiment in quality.
1. IntroductionVolunteers Association for Bangladesh (VAB) is a not-for-profit organization, established in 1999 by non-resident Bangladeshis (NRBs) in the USA, led by Dr. A. T. Rafiqur Rahman. Its aim is to help the poorest children in Bangladesh get quality education and skill training. It focused on rural high schools in Bangladesh and started by providing scholarship and tutoring to students from poor families and training to the teachers since 2000. It also gave support to vocational labs and provided computers to a few schools. In 2009, it undertook a study to assess the impact of its work and found a significant reduction of dropout rate because of the interventions (Gyasuddin, 2010). Drawing on its experience, VAB developed its model of rural secondary school quality improvement.
Rural High Schools in Bangladesh: An Experiment on Quality Education
*Jasimuz Zaman
* Country Director, Volunteers Association for Bangladesh; former Professor, Bangladesh University of Engineering and Technology (BUET). Acknowledgements: The author expresses his thanks and appreciation to Mr. Mati Pal, Treasurer of VAB, for kindly reviewing the article and for his help in significantly enriching the text.

28 Bangladesh Education Journal Bangladesh Education Journal 29
VAB’s approach in educational support is based on its premise that poverty is the root problem of rural life in Bangladesh. Because of extremely limited physical resources, the ever-growing population in rural Bangladesh along with the increasing pool of youth is caught in a vicious cycle of poverty, desperate and futile migration to urban areas, and potentially disruptive social unrest. VAB founders and collaborators, after intensive discussions among themselves, and drawing on their understanding of theory and practice of national development as well as their own life experience, concluded that quality high school education enriching human resources was a reliable way out of the cycle of poverty (Rahman, 2010). At the “field level”, in collaboration with a regional NGO “Prakritajan”, “Udoiankur Unnayan Sangstha” and “Ashar Alo”, VAB undertook extensive consultation with the rural schools on how to realize the objectives of VAB to enhance the life opportunities of rural youth through education. It was realized that helping individual students fail to accomplish the intended objectives because of the poor quality of education in the schools. VAB leaders worked on developing strategies for fruitful utilization of the limited resources available to VAB.
VAB is arguably the only NGO in Bangladesh which has been solely devoted to rural high school education for nearly two decades. It is, therefore, in an advantageous position to address the issues of high school education in rural Bangladesh. Following an iterative process, a five-year strategic plan was developed. A decision was made to direct VAB’s effort for quality improvement based on a recognition of the multi-dimensional nature of quality education and the need for integration of the diverse aspects. VAB’s own resources, essentially mobilized from individual NRB philanthropists and their non-Bangladeshi friends, are quite limited. VAB also believes that any development effort has to be sustainable by the resources of the beneficiaries themselves, ridding themselves from dependency. These factors prompted VAB to aim for sustainability as an objective, which is to be achieved over a defined period.
2. Development of the Quality Education ModelSimply put, quality education calls for better learning by students, better teaching by teachers, better education environment provided by schools and engagement of the community in education of its children. VAB, based on its work experience with the schools and intensive discussion on resolution or mitigation of the problems, developed an integrated set of intervention measures. Empowerment of the beneficiaries was at the core of the intervention. Many a development project fails because the beneficiaries are not allowed the possibility of building their own capabilities to carry on the development efforts. Instead, they remain in a “dependency trap”. In development economics, there are examples galore of limping foreign aided projects because the beneficiaries are kept, sometimes deliberately, devoid of capacity to carry on their own. This premise led to what we term the Empowerment Model for Quality Education with Sustainability. The interventions in the model are directed to empower the key stakeholders to carry on the exercise of quality education. In Bangladesh’s rural education there are four groups of beneficiaries, who are the main
stakeholders: the students, the teachers, the schools and the communities. The quality education interventions are designed to achieve the empowerment of the stakeholders. Elements in the interventions are designed to strengthen self-confidence, stoke the inner energy, and create a dynamism and vigor to enhance capacity-building among the stakeholders.
The model has been developed by drawing on three sources: (a) the ideas and thoughts of VAB leadership both in Bangladesh and in USA, enriched by cross-fertilization of ideas from exposure to education systems in Bangladesh and abroad, particularly USA, East Asia
1and Scandinavian countries; (b) field experience of VAB officials, mainly in Bangladesh; and (c) empirical observations by the author and his colleagues while working with high schools in rural Bangladesh since 1995.
The Empowerment Model has drawn the attention of potential contributors who saw it as an approach with a promise of attaining its goals. Chevron Bangladesh awarded a one-crore taka (about $150,000) two year project to be implemented in 14 schools in its area of operation in 2014. In 2015, Bangladesh Bank granted 10 lac taka (about $15,000) to implement the model in five schools. The award has been renewed in 2016 with the addition of five more schools. American and Efird (A & E) approved a project with a program for a five year period with a grant of 24.5 lac taka (about $35,000).
In the Global Conference at Atlanta, USA in May 10-13, 2015 organized by the Nobel Peace Laureates on Innovative Social Business Projects in Health, Technology and Education, the VAB Model won the first prize (Global Summit, 2015). VAB submitted its Empowerment Model as a solution to poor quality education in rural Bangladesh, which can be applied to any Third World country. The model’s focus on the empowerment of the stakeholders of rural education – students, teachers, schools and communities – combined with low cost, effectiveness and sustainability attracted the judges.
The model elements are briefly depicted in the diagram below (Figure 1).
1 1PISA – (Program for International Student Assessment) -- is a worldwide periodic survey by the Organization for Economic Co-operation and Development (OECD) in member and non-member nations of 15-year-old school pupils' scholastic performance on mathematics, science, and reading. It was first performed in 2000 and then repeated every three years. It is done with a view to improving education policies and outcomes. It measures problem solving and cognition in daily life. The 2012 version of the test involved 34 OECD countries and 31 partner countries, with a total of 510,000 participating students. The results of the 2015 survey t were to l be published by the end of 2016.

30 Bangladesh Education Journal Bangladesh Education Journal 31
A careful look at the elements of the model shows that they are a combination of some traditional education improvement measures and a number of innovative, relatively novel (at least in Bangladesh) measures. The innovative elements do not squarely fall under curricular measures but can be described as “co-curricular activities.” Students need to participate in better learning; the traditional way for better learning by students is through classroom education (notwithstanding nascent trends towards home learning and luminary examples like Rabindranath Thakur, Bill Gates and Steve Jobs who flourished outside of the classroom environment). Scholarship to students in poverty is a long-standing measure of ensuring that the students will attend classes. Tutoring is a complement to classroom teaching. VAB looked for new low-cost ways of students getting better learning. It is generally agreed that if somehow the child could be inspired to learn, stimulated and guided to devote his or her inner strength to educational purposes, the resulting self-motivated learning can be more powerful than classroom learning. Co-curricular activities complement teaching through self-learning. Organizing, managing and participating in students’ clubs on reading, debating, Science and Math have, for example, obvious impact on self-confidence, awakening interest and retaining knowledge (VAB, 2015)). The concept of “Volunteer Squad” in which students voluntarily, possibly led by teachers, interact with the community to mitigate some community issues, such as sanitation, garbage disposal, clean surroundings has multiple impacts (Roy, 2015). These impacts are better learning of social issues and their mitigation; team work, discipline and efficient execution; identification with the community; and on the part of the community, recognition and respect for the contribution of the school.
Teachers’ training is the traditional measure of positioning teachers for better classroom teaching through better understanding of the curriculum and improved teaching methods. Headmasters’ Seminars and Teachers’ Workshops are somewhat non-traditional measures. Headmasters’ Workshops offer an opportunity to the Headmasters, who are virtually the leaders of rural education, to discuss their experience, challenges and opportunities, to learn from one another, and most importantly, to mull over the ways and means of addressing the daunting problems. Teachers’ Workshops provide forums for exchanging ideas among fellow teachers, learn from one another, and hopefully, identify best practices of better teaching. Teachers’ support is a recognition that rural schools are woefully under-staffed and need to be provided support with teaching resources.
Provision of library books, science lab equipment and computers are traditional measures a school can adopt to improve the learning/teaching environment. A novel measure devised by VAB for the schools is the establishment of an Endowment Fund with which a school can add to the learning aids as necessary and ensure that these are maintained and used effectively. This is a direct outcome of VAB’s preoccupation with sustainability, or self-sufficiency, by the schools themselves when external assistance ceases.
The community empowerment measures are also non-traditional in the context of rural Bangladesh. The school-community interaction is not only a way of staying on top of the quality improvement measures, it also strengthens ownership by the community and the school of the improvement measures themselves. It is also hoped that such interaction would inspire the community to contribute, in cash or kind, to the improvement measures, and perhaps even draw back members of the community who migrated to urban areas or abroad.
3. Modus operandi of implementation
a. Work with rural schools within the existing education system
Political leaders, social thinkers and educationists are often disappointed with the existing education system and they talk of overhauling the whole system. Of course, for a resource-poor country like Bangladesh, that is daunting. Undeterred, however, well-intentioned NGOs and others build and operate their own schools to create a model of quality education, but the benefits stay within these institutions only, with no multiplier effect in the community. The quality of education received by the vast majority of students in the public system remains unaffected. Replication is an impossibility. Limited results are seen from a large investment. The VAB model works with the existing rural schools under the existing education system. Thus, instead of wasting time, energy and resources to bring about a “revolution”, VAB can concentrate on changes that can go a long way in the low-cost economy of Bangladesh. In addition, local initiative is regarded as the key from day 1. The community becomes the messenger and co-implementer of quality. The approach mobilizes all the stakeholders into program implementation and builds a cooperative environment among participating schools. Multi-dimensional ideas are thus generated which benefit individual schools.
Quality Education in Secondary High School- VAB Bangladesh
Student EmpowermentScholarship
Grade VI TutoringCo-curricular Program
Volunteer SquadPerformance Award
School EmpowermentScience/Vocational Lab
Computer LabLibrary
School FurniturePerformance Award : SchoolSchool Endownment Fund
Quality With Sustainability
Teacher EmpowermentTeachers SupportTeachers' Training
Headmasters' SeminarsTeachers' Workshop
Performance Award: Teacher
Community linkageEmpowerment
Parents Teacher MeetingWomen Empowerment
Societal Presence
Figure 1. Elements of the Empowerment Model for Quality Education
Source: Constructed by the writer based on VAB development concept and premises

Bangladesh Education Journal 3332 Bangladesh Education Journal
b. The cluster approach
VAB prefers to implement its model in clusters of schools, each cluster consisting of five schools in geographical proximity. The cluster approach brings an ease and economy in administering the empowerment model of VAB and brings in all the stakeholders under an umbrella - students, teachers, school management committee members, parents, particularly mothers, former students, community leaders, government officials and public representatives – engaging all in the improvement of the quality of education. The primary benefits of the cluster approach were deemed to be the following:
• To influence collective efforts among the stakeholders in a community
• To create easy access to a community as well as service providers
• To stimulate competition among the institutions
• To facilitate different events collectively and thus have wider recognition and publicity
• To reduce management and monitoring costs
• To create an enabling environment to disseminate good practices to a larger audience (thus, the rural education environment in the whole locality can be energized)
True to its original emphasis, VAB wishes to focus on the poorest and the neediest in society. The vulnerable upazilas are identified by considering the socio-economic condition and the literacy and school enrollment rates of the upazila. The information was collected from BANBEIS sources (BANBEIS, 2014). Three upazilas were selected, Shyamnagar in Satkhira in southern Bangladesh and two in northern Bangladesh, Nageswari in Kurigram and Nilphamari Sadar in Nilphamari. The cluster schools were selected by reliable local partner NGOs, Udainkur Unnayan Sangstha (USS) in Nilphamari and Ashar Alo in Satkhira. Information was collected in a format designed by VAB. After preliminary analysis of the data collected, VAB undertook discussions with the schools on terms and conditions for collaboration. Through the discussion, both the parties, VAB and the schools, reached a consensus to work together for quality education. The parties then signed a Memorandum of Understanding (MoU) with the details of work to be done.
c. Jointly formulated plan tailored to needs of each school
The programs for individual schools were developed with initiatives driven by the schools. Two activities were carried out to ensure the approach. First, a Headmasters’ Seminar with the participation of the Headmasters themselves was held at the VAB office in Dhaka to get the commitment of the schools to quality improvement. Secondly, a Teachers’ Workshop was held in each school within the cluster. The theme of the workshop was: Quality Education in Secondary High Schools with Local Initiative. The workshop included all the teachers and a few of the School Management Committee members and parents. Sometimes student representatives were also invited to participate. It may be mentioned that VAB found the inclusion of the students stimulating and beneficial to the whole discourse and the
schools generally were supportive of the move. The thrust was on developing a Quality Education Plan for the school, with engagement of the stakeholders as partners in developing the Plan. This automatically imparts a sense of responsibility on the teachers, the schools and the powers-to-be and imbues them with a sense of ownership of the Plan. A preliminary budget with shares of the cost to be borne by the individual schools and VAB and a work plan were drawn up in the workshop. Along with the plan formulation, cost-sharing itself is a powerful motivation for ownership. These, in turn, foster motivation, readiness and willingness for sustaining the improvement measures and their achievements. This was further refined on discussion with the schools leading to a formal agreement between the individual school and VAB.
4. Description of Activities in the schoolsFigure 2 below gives a summary of the activities undertaken by the schools over the five year period. VAB encouraged and whenever possible participated in the award events to draw the interest of the parents as well as the community members. Sixty-five such events took place
80
70
60
50
40
30
20
10
0
Activities in the schools 2012-2016
Nu
mb
er
of
Act
ivit
ies
Stud
ent A
war
d Ev
ents
Com
pute
r Tra
inin
g - T
each
ers
Mat
h O
lym
piad
Par
tici
pati
on
Scie
nce
Fair
Part
icip
atio
n
Subj
ect T
rain
ing
for T
each
ers
Hea
dmas
ter S
emin
ar
Teac
hers
Wor
ksho
p
Pare
nts-
Tea
cher
s M
eeti
ng
Stud
ent B
atch
es -
Com
pute
r
Club
eve
nts
Gra
de V
I Tut
orin
g
Figure 2. Quality improvement activities in schools (2012-16)
34 Bangladesh Education Journal Bangladesh Education Journal 35
showing that the events took place in most of the schools every year and 1,920 needy students were awarded scholarships. Sixty three-month-long tutoring courses benefited 2,260 Grade VI students, 65 teachers got training in Math, Science and English, 105 teachers received on-site computer training and fifteen teachers’ workshop and twenty Headmasters’ seminars took place. Sixty club events in sports, debates cultural programs and volunteering, 75 batches of students totaling 3,750 students got computer training and forty batches totaling 250 students took part in Math Olympiad. Fifty five computers were given to the schools and equipment for science labs and vocational shops were provided. The enrichment of science lab allowed participation in 20 science fairs by a number of the schools. About 4,000 books were distributed to the school libraries and steps were taken to promote reading habits of the students. Thirty two parents-teachers meetings were held in the schools with interchange of views on student attendance, regularity of studies, adolescent problems and the role of women in educating children. The significance of the large number of student empowerment activities that required the direct assistance of the teachers becomes obvious if one understands that most of these activities were absent (or were done in a nominal way) earlier and the work enumerated here were mostly done in the last three years of the project. The first two years were dedicated primarily to creating the resources, training and motivation for the program personnel. In all activities undertaken by VAB, attempts were made to include community leaders and government education officials in order to promote community ownership in quality efforts in schools.
a. Objectives of the individual school programs
The work in the three clusters was undertaken as a pilot scheme to test the efficacy of the VAB model with plans delivered in a five-year period. The primary objectives set for this pilot scheme were the following:
• Reduction of dropout
• Increase of percentage of pass in public examinations
• Better performance in public examinations (measured in grade point)
• Better performance in co-curricular activities, and
• Greater interest of community in quality education
b. How the plans were carried out
The VAB plans are process oriented requiring close cooperation with the schools in all phases of the work. A typical implementation plan is sketched below for a school over a calendar year. The plan was implemented with a spirit of partnership between the school and VAB (Table 1).
Tab
le 1
: W
ork
pla
n t
o im
ple
men
t th
e V
AB
pro
gram
wit
h a
sch
edu
le f
or i
mp
lem
enta
tion
Act
ivit
y/M
iles
ton
eT
arge
tT
imel
ine
in m
onth
(Jan
uar
y to
Dec
emb
er)
12
34
56
78
910
1112
Stu
den
t Em
pow
erm
ent A
ctiv
itie
s:S
chol
arsh
ips
for p
oor s
tude
nts
30 s
tude
nts
Clu
b ac
tivi
ties
in M
ath,
Sci
ence
, Deb
ate,
Lan
guag
e,
12 e
vent
sC
ultu
ral P
rogr
am a
nd S
port
s –
at le
ast t
wo
even
ts in
eac
h ar
eaS
cien
ce F
air a
nd M
ath
Oly
mpi
ad –
20
stud
ents
in e
ach
40 s
tude
nts
Goo
d C
itiz
ensh
ip p
rogr
am –
Com
bine
cur
ricu
lar c
onte
nt,
volu
ntee
ring
wor
k, c
lub
acti
viti
es a
nd a
ddit
iona
l res
ourc
es
All
stu
dent
s(C
onti
nuou
s w
ith
two
even
ts)
Gra
de V
I tut
orin
g3
mon
ths
Tra
in s
tude
nts
in c
ompu
ters
– 8
gro
ups
(10
stud
ents
in e
ach
grou
p)
80 s
tude
nts
Gro
up b
ased
per
form
ance
aw
ard,
5
grou
ps5
grou
ps (O
ne g
roup
in e
ach
clas
s ou
t of 4
/5 g
roup
s/cl
asse
s)T
each
er E
mp
ower
men
t Act
ivit
ies:
Tea
cher
s’ W
orks
hop
wit
h pl
anni
ng a
nd b
udge
ting
for Q
uali
ty1
even
tT
each
ers’
Tra
inin
g in
Sci
ence
, Eng
lish
and
Mat
h –
Les
son
Pla
n,
3 tr
aini
ngs
Ori
enta
tion
on
scie
nce
prac
tica
l cla
ss
T
each
ers’
Tra
inin
g on
Com
pute
r1
even
tA
rran
ge o
rien
tati
on o
n sc
ienc
e pr
acti
cal c
lass
1 ev
ent
Goo
d C
itiz
ensh
ip a
nd C
ode
of C
ondu
ct –
1
even
tT
rain
ing
and
mot
ivat
ion
for t
each
ers
S
choo
l Em
pow
erm
ent A
ctiv
itie
s:H
eadm
aste
rs’ S
emin
ar1
even
tB
ooks
for l
ibra
ryD
istr
ibut
ion
Equ
ipm
ent f
or s
cien
ce la
b/vo
cati
onal
lab
Dis
trib
utio
nC
ompu
ter l
ab im
prov
emen
t/ C
ompu
ters
for l
abD
istr
ibut
ion
Init
iate
sch
ool d
evel
opm
ent f
und/
end
owm
ent f
und
– D
istr
ibut
ion
reso
urce
bui
ldin
g fo
r sus
tain
abil
ity
Com
mu
nit
y E
mp
ower
men
t Act
ivit
ies:
Par
ent-
teac
her-
stud
ent
mee
ting
– d
utie
s an
d re
spon
sibi
liti
es,
2 ev
ents
atte
ndan
ce a
nd d
ropo
ut, e
arly
mar
riag
e, m
obil
e ph
one,
etc
.F
und
rais
ing
wit
h th
e pa
rtic
ipat
ion
of c
omm
unit
y pe
ople
(c
onti
nuou
s pr
oces
s)E
duca
tion
Fai
r – m
ulti
ple
com
peti
tion
s an
d A
war
d E
vent
1 ev
ent

c. Human and financial resources
VAB’s efforts were to facilitate in establishing self-help educational institution improvement and developing their capacities at the grass root level to meet their needs and solve problems collectively. The primary purpose was to help them become self-reliant and deal with urgent problems in the institutions. The emphasis was on strengthening the institutions in management, operation and self-help.
VAB employs a limited number of staff for implementation. VAB management personnel both at Dhaka and in New York are wholly voluntary. VAB has a team of student volunteers from the universities in Dhaka. They volunteer their services in program implementation.
The schools lacked experience in designing plans for quality improvement; most of their developmental effort being directed to improve the inadequate physical infrastructure. In this pilot scheme to demonstrate that the pursuit for quality must proceed within the existing constraints, VAB opted to bear most of the cash costs for the project. The schools, however, worked cooperatively with VAB, the teachers shouldering major responsibilities in field implementation.
d. Monitoring
VAB used reflective practices in its monitoring and evaluation. All project staff, headmasters, teachers and other participants were given a clear picture of plan objectives, implementation scheme of the activities and its monitoring and evaluation plan. All VAB staff was trained on the plan’s cause, effect, logic and result chain. VAB ensured that its staff had complete understanding of the specific objectives of the reflective practice; with monitoring and evaluation taking place appropritely to ensure realizing the goals and objectives. The staff for the plan had the primary responsibility for assuring that all activities were completed and the intended results obtained, with full cooperation of the schools as partners.
e. Evaluation
VAB provides annual report of its activities to its contributors. Some of these reports are presented on the website (www.vabonline.org). On the occasion of its fifteenth anniversary, VAB published a report that provided views of all the stakeholders of the schools (VAB, 2015). The internal evaluation of the program went on continually, as the program elements were introduced. Both qualitative and quantitative data were collected to assess the output as well as the outcome of the program.
An evaluation study was done by an independent consultant in 2015 at the end of four years of model implementation (Roy, 2015)). The consultant collected his data independently. Primary data were collected from the field using questionnaires and checklists following specific methods, such as interviews, focus group discussions (FGDs), case studies, reviewing enrolment and attendance records and examination results, etc. as deemed appropriate to fulfill the objectives of the study. Data were collected from the teachers and the students of selected secondary schools of the target upazilas of Kurigram, Nilphamari
and Satkhira districts. Besides, meeting and sharing with the members of SMC, parents, respective project officials, and concerned government education officials were also carried out to collect required information in relation to the intervention.
The results generally are consistent with the internal evaluation by VAB in 2016. The results presented below are from the independent evaluation of 2015, updated with 2016 data where appropriate. .
5. Accomplishments
a. Reduction of Dropout
The dropout in high schools shows a significant improvement since 2011, in part because of government intervention in the form of scholarships for the students (ADB, 2015). The evaluation included six of the fifteen cluster schools. The field level assessment reveals that overall dropout of students in Class VI from the cluster schools was 12% during 2011 and 4% during 2015 i.e. the rate decreased by 8 percentage points (i.e., by 67%) by the year 2015. The overall dropout of students in Class VIII from the cluster schools was found 4% during 2011 and 6% during 2015. This negative result appears to be an effect in part of the recent introduction of public examination at the end of class VIII in 2010, leading some students to leave school. The overall dropout in Class X was found to be 7% during 2011 and 2% during 2015; thus the rate decreased by 5 percentage points (i.e., by 71%) by the year 2015. The reason for dropout was primarily the dropout of girls, particularly in Class VIII and Class X. These are the two Classes at the end of which public examinations take place. This however continues to improve for the better with greater awareness in society. In some of the schools, girls’ team has been formed to dissuade parents to opt for early marriage. VAB is examining critically the dropout situation in Class VIII.
b. Increase of percentage of pass in public examinations and of grade point
The evaluation study also reveals that 91% of the girls and 96% of the boys passed the Junior Certificate Examination (JSC) in 2014. There has been progressive improvement in the results since 2012 and the pass rate always remained a two to four percentage points higher than the national average. The pass rate in SSC for the girls and boys were 84% and 87%, respectively in 2011; the rate rose to 96% and 97% in 2015. The increase was by 14% and 11%, respectively.
In addition to percentage of pass, the level of attainment of the students in terms of grades obtained also improved markedly. Data obtained from the schools show that in JSC in 2011, 25% of the girls and 54% of the boys received A grades. The numbers in 2014 were 51% and 73% respectively. Data for SSC show that in 2011, 44% of the girls and 70% of the boys received A grades, increasing to 51% of the girls and 73% of the boys received A grades in 2014. The rates for 2015 were 74% and 87%, respectively. The data demonstrates the reduction of gender gap in the quality of results, the gap decreasing from 26% difference in 2011 to only 13% in 2015 for SSC results.
36 Bangladesh Education Journal Bangladesh Education Journal 37

38 Bangladesh Education Journal Bangladesh Education Journal 39
Figures 3 and 4 give a progression of results for all students, boys and girls, in percentage of A grades for these schools for JSC and SSC. The overall percentage increases were from 39% to 67% in the case of JSC and from 55% to 78% in SSC. The slight dip in 2014 could be a reflection of the overall performance in grade nationwide.
c. Better performance in co-curricular activities
Research (Kemp et al, 1990) shows that co-curricular activities enhance the ability of the students and should be an integral part of education in the high school. Co-curricular activities and volunteering for societal needs were found not only to enhance individual capability but they also contribute to self-esteem and academic performance of students (McNeal, 2010). VAB undertook in earnest these elements of education. Prior to 2012, the co-curricular programs in the schools were carried out off and on without any definite plan. With the exception of one or two, the schools in the clusters hardly won any award at the upazila level and rarely moved to the regional level competition in co-curricular activities. The participation locally also was minimal. Table 2 below shows a dramatic increase in the participation and performance, leading to various teams bringing laurel to the schools even at the regional level. These activities create a dynamic and lively environment in the schools. In the past, the participation of girls in cricket and football were inconceivable in most of the schools. Every school now has teams for both boys and girls in sports and other activities. Apart from award level performance, there is a wider participation of students in sports and other co-curricular activities that have been deemed essential for the fruition of benefits for all students (Ibid). It may be noted that performance gradually increased taking it to a competitive level by the fourth and fifth year of program.
During the period of the VAB program, Sports Clubs, Debating Clubs and Volunteer Squads were formed in all the 15 schools. The clubs and squads are designed to be led by students with a teacher as adviser. These activities require planning, team work and ability to organize and work with large groups of people. The resulting outcome would be the development of individual capability and attainment of citizenship virtues like diligence, prudence, accountability, tolerance, compassion and other moral and ethical values. The club program is also a measure to make the quality efforts sustainable.
80
70
60
50
40
30
20
10
0
JSC Result
% G
rad
e A
Year of JSC Examination
2 0 1 1 2 0 1 2 2 0 1 3 2 0 1 4 2 0 1 5
100
80
60
40
20
0
SSC Result
% G
rad
e A
Year of SSC Examination
2 0 1 1 2 0 1 2 2 0 1 3 2 0 1 4 2 0 1 5
Figure 3. JSC and SSC Results in VAB-Assisted Schools
Table 2: Participation and Performance in Co-curricular Activities
Item Total number of Events (2012-2016) Awards won (2012-2016)
Local Upazila Regional Local Upazila Regional
Cultural Program 114 75 28 75 28 14
Debate 57 38 14 38 27 6
Cricket - Girls 48 28 18 28 17 3
Cricket - Boys 22 12 10 12 6 5
Football - Girls 48 30 24 30 18 7
Football - Boys 40 22 18 22 9 6

40 Bangladesh Education Journal Bangladesh Education Journal 41
d. Greater interest of community in quality education
Community empowerment is one of the prominent components of the program. VAB’s approach to get the schools do their job includes a two-fold push—empowering the students and empowering the community linkage. Such empowerment creates interest among the students and the community members to know what the school is planning to do and why. This increases accountability of the schools and forces transparency in operation and gives an opportunity to the schools to seek support from the community. The tools used are parents-teachers meetings, mothers’ assembly, alumni contacts and inclusion of community members in various events in the schools. The culmination of the community linkage program is an Education Fair comprising multiple interschool competitions in the final events followed by an Award Ceremony where all local dignitaries including government officials and public representatives are present. VAB programs created a positive impact on the cluster schools; other schools in the vicinity are approaching VAB with a plea to be included under the VAB umbrella. It is remarkable, particularly in the context of Bangladesh, that VAB efforts already led to the establishment of Endowment Funds in some of the schools for future activities; more contributions from the community to support school programs are also forthcoming.
6. Lessons Learned
The Government has an ambitious plan for quality education to realize the objectives of the 2030 Sustainable Development Goals (SDGs) (Ahmed and Rahman, 2015). The plan is capital intensive and will take long years for fruition. For the near future, any improvement exercise has to operate within the constraints present in the existing school system of Bangladesh. VAB aimed at quality within the existing constraints, removing them as progress was made.
To the pleasant surprise of VAB and also many critics, the experience of the last five years demonstrated that the rural schools can attain remarkable improvement of their performance within the existing constraints through appropriate planning and well-defined interventions as well as a drive for local initiative. The most encouraging lesson learned was the willingness and cooperation of the teachers to engage in the quality process. Unreserved support was obtained from the Headmasters and the Management Committee members. Profound interest was generated among the students and the community members. Within the limited facilities provided by VAB, the Headmasters and the teachers attended seminars and training arranged at the VAB Center in Dhaka. These are all positive lessons VAB learned that emboldens it to launch the model in new clusters and appeal for replication throughout the country with broader and more ambitious goals.
Another important lesson is the welcoming attitude by the schools about performance based awards for both the teachers and the students. This reduces a dilemma in operation where the VAB donors often expressed concern that teachers and students would perform only if financial incentives are provided. On the other hand, performance based incentives are looked upon favorably by most donors. In order to empower a greater number of students
through performance based award, VAB now has devised a scheme for evaluating the performance of groups of students covering both academic and co-curricular performance. The evaluation will reward the groups instead of individual students, creating competition among groups and allowing higher performance for a much larger group of students.
At one stage of development of the Bangladesh economy, a high school certificate could be a “passport” to a decent employment. The economy has progressed remarkably. A factor that was present in the past to a limited extent – bribery and corruption – has become rampant lately. This has a direct bearing on what the students and the parents can expect from the current system, and their expectations can be quite negative. In this context, while VAB has been promoting excellence in performance; work with the schools showed that it was helpful to provide counseling in career choice. Along with promotion of the vocational stream that existed in some high schools, VAB brought into focus the choices related to diverse careers as artisans, nurses, police and law enforcement officials, army personnel, medical assistants, shop assistants and middle-level managers, small business entrepreneurs , etc. Based on lessons learned, VAB is taking steps to strengthen its role to generate employable skills and assistance in making career choices so that students ponder about alternatives before moving on with the general stream at the next level of schooling or seeking government employment.
7. Challenges and Opportunities
In broadest terms, poverty is the greatest challenge for quality secondary education in rural Bangladesh. The cost of educating a young boy or girl is not only the direct educational cost, but also the cost of food, healthcare, etc. for her/him. In addition, there is the opportunity cost of taking the child out of work, outside or in the house. Limiting ourselves to the issue of education quality itself, a central challenge is that, despite the formulation of a National Education Policy, the system cries out for reform and renovation. A relatively young sovereign nation, with aspirations of extraordinary social development and high economic growth with equity, needs to have a human resource policy, especially since it is rich in this respect, with scarcity of physical resources. Education is the key to achieving proper utilization of the human resources; unfortunately, that alignment of education policy and human resource utilization policy remains weak. The low per student cost of secondary education can be seen as an advantage, and affordable quality measures can be devised if the mindset and sense of obligation to the deprived boys and girls exist. Despite daunting challenges, VAB is trying its best to utilize this cost advantage. As mentioned earlier, VAB is not “revolutionary” in its approach, it believes, changes at the margin with marginal costs can accomplish a lot.
The bigger picture aside, the political violence in 2013, 2014 and 2015 posed a significant challenge to carry out the program in a timely fashion. The schools were on the whole very cooperative to implement some of the programs on their own and by allowing flexibility for VAB for safe travel. The teachers are the integral partner for success in any program. There was unhindered cooperation from most teachers. For every program undertaken by VAB, the teachers have to perform additional duties in implementation free of charge. This puts a

42 Bangladesh Education Journal Bangladesh Education Journal 43
demand on their time and work. The dedication of the VAB staff and the selfless service of all the donors, patrons and management of VAB both in Bangladesh and USA provided the motivation and inspiration to the teachers to offer their service free of charge. Further, the ownership created through the Teachers’ Workshop has been of great help. VAB also points out the benefits, both material and psychological, that the teachers may derive with an increase of reputation earned by the school. However, all the schools suffer from the shortage of teachers that limit the capability of the schools to take up all quality activities with full vigor.
Sustainability of an education institution is in fact the end result generated through combined efforts of several initiatives. For the present project these initiatives include: empowering students, empowering teachers, empowering school and empowering community linkage. It is undeniable that the degree of difficulties in empowering teachers, and empowering community linkages are far higher than those in attaining students’ empowerment and school empowerment. These various challenges need to be met simultaneously with a balanced effort to achieve overall sustainability of the institutions.
A major constraint in implementation is the relatively short daily school hours and the shortage of effective number of class days in schools. The multiple public examinations with a lengthy schedule exacerbate the problem of the available days. The other difficulty is the engagement of both the teachers and the students at pre-school and post-school time in private coaching activities, leaving little time for engaging in co-curricular activities. This is a problem that has drawn the attention of the Government and policy makers. The awareness on quality, transparency and accountability generated through the quality drive of VAB is an effective way to overcome this problem.
One persistent problem in the rural schools is the level of regularity in attendance in the schools. This becomes more acute during the cropping seasons. Possibly the Government should give authority to the schools to adjust holidays and vacations keeping the seasonal agricultural needs in view. This could in fact have a very desirable impact on promoting dignity of labor in the country as a whole. Active participation of the rural students in certain farming activities such as harvesting, storing and transporting grains seasonally could become a part of the academic program in the school.
VAB has an open door policy regarding partnering and collaborating with donors, trusts, corporations and individual philanthropists. Currently it has relationship with USS and Ashar Alo on community linkage, Bishwa Shahitto Kendro on reading programs, Bangladesh Open Source Network (DOSN) on Math Olympiad, Freedom Foundation on Science Fair, D-net on computers and Agami Foundation on ICT. As mentioned earlier, it carries out programs for corporations like Chevron Bangladesh and A & E and Bangladesh Bank. Further, it operates education programs on behalf of three private Trusts. It is open for partnership for implementing the full quality improvement model or parts of it.
8. The Way Forward
The pilot project provided VAB with a greater insight on achieving the goals of the 2010 Education Policy (Ahmed and Rahman, 2015) of the government of Bangladesh. VAB identifies three primary objectives of education in the Education Policy. These are:
• Knowledge
• Competence
• Good Citizenship
VAB quite successfully addressed the knowledge gap in terms of examination results and to some extent, in the attainment of learning with emphasis on cognitive skills. Self-learning is also promoted through a variety of co-curricular activities – students’ clubs (both for boys and girls) in reading, debating, science studies, math studies, etc., as well as competitive activities like Math Olympiads, Science Fairs and Education Fairs. Further, VAB now has a definite program to promote computer and ICT application through its 100% computer literacy drive for the school and enhancement of English proficiency through 100% conversational English in the English classes. The club programs, participation in the community linkage activities and the volunteer squad program are effective tools in meeting the competence gap and good citizenship gap. There is still a lack of proper understanding among the teachers of the good citizenship ideas interspersed in the curriculum. The drive for getting marks in the examination overshadows the need to promote the citizenship virtues in practice. There is currently a surge of interest in character education within the school system (Ryan and Bohlin, 1999). The essence of character education is to inculcate the virtues of character which are to alarge degree synonymous with the virtues of good citizenship spelled out very clearly in Bangladesh Education Policy and also emphasized in SDG 2030 education goal (particularly Target 4.7). VAB has redesigned the program that includes curriculum content as well as materials and videos from various sources in training programs for the teachers and the club and squad members (Rizzo, 2006).
VAB now plans to launch its five year program for new clusters of schools in two phases: an Initiation Phase of two years followed by an Augmentation Phase for the last three years. The initiation phase will provide resources and training needed to launch attainment of targets in the Augmentation Phase. Based on extensive discussions with the schools of the three pilot clusters, VAB has set up the following targets for the Augmentation Phase.
• 100% computer literacy for the schools that will include all teachers and all students
• 100% of students able to communicate in English
• 100% of the students each reading at least ten books from school library
• 100% of the schools will have at least one student qualify for the National level Math Olympiad

44 Bangladesh Education Journal Bangladesh Education Journal 45
• 100% of the schools will qualify for at least two regional competitions in student co-curricular activities
• 100% of the schools will benefit from at least one lac taka (about $1,500) annually in each school from local sources for quality education
• 100% of the schools will undertake promotion of good citizenship through curricular and co-curricular activities
These programs have been defined and work plans prepared in consultation with the pilot schools and additional new cluster schools. The schools are very positive and the experience of working with the three clusters over the five year period gives VAB the confidence that the targets can be reached in five years.
9. Concluding Comments
VAB’s education model is in line with the requirement of policies and priorities of the Government of Bangladesh Education Policy, consistent with SDG 2030 education targets, and in harmony with the political and social context of Bangladesh. The model proved to be appropriate for contributing to quality of secondary education of the country. The model is responsive to the requirement of the students, the teachers and others who have direct and indirect stake to improve quality of secondary education in the country. All the elements of the model have demonstrated proven applicability and are replicable. The benefits of the model are obtained in the stipulated period of five years. The achievement of these targets will create a self-propelled momentum to continue the quality process. The success of the schools in attaining quality targets will drive the community support and sustainability will be ensured.
VAB seeks support of the Government, philanthropists, funding agencies and corporate and business enterprises to replicate its model in different parts of Bangladesh to the maximum extent possible.
References
1. ADB (2015) Completion Report (2015) Bangladesh Secondary Education Sector Development Program, Project Number 37307-013. Dhaka: Asian Development Bank.
2. Ahmed, M. and Rahman, M. (2015).“SDG4/Education 2030 and 7th Five Year Plan of Bangladesh: Aligning National and Global Objectives,” Bangladesh Education Journal, Vol. 15, No 1, 9-28.
3. BANBEIS (2014). Education Statistics of Bangladesh 2014. Dhaka: Bnagladesh Bureau of Educational Information and Statistics.
4. Global Summit on Health, Education, Technology (2015). “Finding Affordable Solution for Urgent S o c i a l a n d H u m a n P r o b l e m s , ” M a y 1 0 - 1 3 , 2 0 1 5 . A t l a n t a , G A , U S A . , http://yunuscreativelab.org/#events)
5. Gyasuddin (2010), A study on the dropout rate in VAB schools. Dhaka: Volunteers Association for Bangladesh.
6. Kemp, W. G.(1990). “Participation in Student Activities and Achievement: A Covariance Structural Analysis,” The J of Educational Research, vol. 83, Issue 5, 272-278.
7. McNeal, R. G. Jr. (2010). “High School Extracurricular Activities: Closed Structures and Stratifying Patterns of Participation,” The J of Educational Research, vol. 91, Issue 3, 183-191.
8. Rahman, A. T. R. (2010), A Decade of Supporting Education to Reduce Poverty – A Better Life for the Poor in Bangladesh Through Quality Education and Skill Training. Dhaka: Pritha.
9. Roy, A. (2015) Evaluation of the Education Project of VAB at selected Upazilas in Kurigram, Nilphamari and Satkhira Districts. Dhaka: Volunteers Association for Bangladesh.
10. Ryan, K. and Bohlin K. E. (1999). Building Character in Schools. New York:, Jossey-Bass.
11. Rizzo, M. Brown, J. (2006). Building Character through Community Service: Strategies to Implement the Missing Element in Education. Lanham, Maryland: Rowman and Littlefield.
12. VAB (2015). In the Eyes of the Stakeholders (2015), AGAPE, VAB Publication on the occasion of its Fifteen Year Celebration. Dhaka.

Abstract
The Directorate of Primary Education replaced in 2009 the primary school scholarship examination by a general nationwide Primary Education Completion Examination (PECE). PECE was introduced with the intention to measure students’ achievement of prescribed competencies, award them credentials, and thus encourage better student and school performance. This high-stake public examination seems to have failed to realize these purposes. Studies show that students’ performance in reading with comprehension and basic numeracy hovers around 30% while PECE pass rate is over 98%. Not acquiring the foundational skills seriously impacts students learning of other subjects. Ignoring this consequence, the national government has highlighted the very high pass rate in PECE as evidence of success in primary education. Decentralization of PECE, suggested in this paper, may not solve this complex learning performance issue, but it can shift the focus from pass rate at the national level to assessment of learning at the school level. Thus the government would be relieved from the pressure to deliver ever higher pass rates and could reposition itself to introduce a credible assessment for measuring student learning achievements and supporting improvement of learning in school.
Key words: Learning Assessment in Bangladesh, High Stake Public Examinations, Primary School Completion Examination.
1. A high-stake and centralized public examination Bangladesh celebrated a 98% pass rate in the recently announced results (March 2015) of the Primary Education Completion Examination (PECE), the public examination at the end of the primary cycle, which comprises five years of schooling. A nationwide public examination after completion of the primary education cycle was introduced in 2009. Until then, examinations were held in each school and students who passed these examinations could enroll in grade six, the first year of secondary education. A proportion of grade five students, normally 40 percent, sat for a competitive scholarship examination conducted externally by the local primary education authorities to select recipients of a government scholarship for students enrolled in secondary school (DPE, 2014 a).
Dilemma of the High-Stake Public Examination for PrimaryEducation in Bangladesh: Can Decentralization Help?
*Mohammad Shahidul Islam
* Senior Education Advisor, USAID, Dhaka, Bangladesh E-mail: [email protected]
The author's views expressed in this publication do not necessarily reflect the views of the United States Agency for International Development (USAID) or the United States Government.

48 Bangladesh Education Journal
The rationale for the PECE was three-fold: first, to ascertain primary students’ achievement in competencies prescribed in the national primary education curriculum; second, to judge the performance of primary schools and their teachers; and third, to award a credential of completion of primary education to students, many of whom do not continue in formal education and may opt for non-formal education, for skill training or for the world of work. Furthermore, scoring well in the scholarship examination had become, allegedly, too important. It had become a matter of prestige and reputation for the school. The 40 percent who took the scholarship examination attracted the attention of the school and teachers at the cost allegedly of neglecting other students (CAMPE, 2008).
How well have the intended purposes been served by the high-stake public examination? A huge state machinery is involved in administering the PECE – for 2.7 million fifth graders annually. The exam comprises a single set of questions used throughout the country. The 98% pass rate brought a big smile on the faces of the state officials responsible for conducting this highly centralized national examination (Kingdon et al 2014).
2. The dilemma of a much-hyped and centralized public examinationPrior to 2009, examinations in primary school were a decentralized, school-level and low-key affair in Bangladesh. Passing in the annual examination in each grade and finally after the completion of grade 5 was considered a reasonably good measure of student learning for school and education authorities as well as for students and parents. Unlike some countries, where entry to secondary education was restricted, in Bangladesh all students carrying a certificate of completion of grade five from his or her primary school were eligible for admission to grade six in secondary school. The introduction of PECE turned the system into an extremely centralized, politically sensitive, high-profile issue. It appears that officials at the central level do not dare any longer to accept a result that is not close to 100% pass rate.
What does the “98%” pass rate signify about primary education in Bangladesh in 2015, beyond the obvious: 2.6 million children are certified to enroll in secondary school (DPE, 2015)? Have these 2.6 million children learnt what they are supposed to learn by the end of the primary cycle?
In 2013, at the urging of the external donors providing funding support to primary education, the Directorate of Primary Education conducted a national assessment of student learning in Bangla (the first language for most students) and math on a nationwide sample of grades three and five students. It showed that only 26% of children at grade five could read their textbook with comprehension (DPE, 2014b). Children demonstrated a similar low level of learning in mathematics. Even this score may be an over-estimate of comprehension. Some have argued that the tests for the sample assessment were pitched at too low a level of performance (DPE, 2012).
There appears to be a reluctance on the part of senior officials to face up to the question of school quality. Informed observers suggest that PECE has encouraged teachers to concentrate on students memorizing and recalling textbook content, as opposed to learning
to read and perform basic mathematics. Teachers, especially in grades four and five, drill textbook content into students through an intensive routine. In contrast, the national assessments undertaken by DPE test skills and competencies indicated in the curriculum, rather than recall of the textbook content (CAMPE, 2014).
The emphasis on a public examination that would show a high pass rate arose in part from the Education for All (EFA) movement in the 1990s, which convinced the political establishment that showing a good record of progress in primary education was important. EFA failed to place adequate emphasis on quality.
In the 1970s and the 1980s, primary and secondary schools often partnered with neighboring schools to minimize the cost of setting and printing question papers for annual school examinations in all grades. Some schools procured question papers from reasonably reliable publishing companies, which developed and printed question papers on a large scale, maintained confidentiality, and supplied these to schools at a reasonable price. Later on, the
1upazila level Primary Education Teachers’ Association began to produce terminal and annual examination papers, which were sold to schools and became a source of funds for the Association.
In the 1990s, this independent decentralized system of examinations in primary schools attracted the attention of primary education officials. Over time they moved away from it in favor of a centralized system that, since 2009, has become PECE. The politicians and senior administrators did not think through the possible consequences of this decision for student learning and performance. Nor did they consider the fact that most countries either don’t have or are moving away from a centralized public examination at the primary education stage.
In explaining the 98% pass rate there are other factors that need mention. The Campaign for Popular Education (CAMPE) is a civil society forum engaged in education. In its Education Watch (2014) report, CAMPE reviewed news, opinion and editorials on PECE from several leading national dailies. A major problem in administering PECE was found to be “question paper leakage”. Leaked questions were disseminated just days before the exams and to ensure maximum reach they were disseminated by Facebook, emails, and text messaging! The papers also reported incidents of teachers writing on students’ answer scripts and “false examinees” (PECE graduates of previous years) taking the exam on behalf of others. The quality and credibility of PECE have become seriously compromised as a result, and educationists have expressed their concern that PECE has prompted children to “learning to cheat” instead of learning to read and write with comprehension (CAMPE, 2014). The education authorities claim that these lapses have been brought under control.
Education Policy 2010 had recommended extension of the primary stage to grade eight, which presumably would become part of the universal and compulsory primary education
Bangladesh Education Journal 49
1 Upazila are sub-national administrative units. There exist approximately 500 upazila in Bangladesh, with an average population each of 300,000

50 Bangladesh Education Journal Bangladesh Education Journal 51
cycle (Ministry of Education, 2010). The Government has decided in 2016 to shift the responsibility of supervising education up to grade eight to the Ministry of Primary and Mass Education, though a complete plan for implementation of this decision and what it means in respect of academic, administrative and financial arrangements have still to be worked out. The question now has arisen whether the public examination for primary education completion should be held after grade eight instead of grade five. This has been discussed at the policy-making level of the government and it has been decided that for the time being the present PECE at the end of grade five will continue along with a public examination after grade eight (Junior Secondary Certificate Examination), which was introduced in 2010. If and when the primary education completion exam is shifted to grade eight, the arguments and suggestions presented in this article remain valid.
3. How can decentralization help?Can decentralization of the PECE system contribute to students’ learning gain instead of just preparing them as good test takers? What form would decentralization take? Our answer is essentially going back to the system that existed before PECE was introduced, with some necessary modification. Decentralization alone will not solve the whole array of problems around student learning. But, it can shift the focus from pass rate on a national league table to performance of students in each school. Government administrators (in the national ministry, line directorates, field offices, district and sub-district administration) would be relieved from the pressure they currently face for delivering successively higher pass rates to be presented ceremonially to the Prime Minister by the Minister for Primary and Mass Education.
In over four decades since the birth of Bangladesh, the democratically elected governments never took any significant steps toward decentralization of governance, including governance and management of education. A first formal step for decentralization of power, promotion of upazila elected assemblies, was taken by an authoritarian (military) government in the 1980s. The democratically elected government that returned in the 1990s remained indifferent to strengthening local government bodies. The basic reason is that members of parliament saw elected local government representatives as their rivals in exercising power and distributing patronage. It took another cycle of authoritarian government, under the military backed caretaker government in 2007 and 2008, for the Upazila system to be reinstated with the provision for an elected upazila Chairman. Again, in 2009, the newly elected democratic government brought various changes in local government laws, rules and regulations, but these did little to promote an effective decentralized system of public service provision, including primary education.
An argument against decentralization is the lack of planning and management competencies at the local level. But perhaps the way to overcome this constraint is to build those capacities by actually practicing decentralized planning and management. As in other service sectors, education officials working at the district and upazila levels may not possess the knowledge and skills required for plan formulation, implementation, monitoring and evaluation.
Decentralization of PECE could be a trust and capacity building opportunity. Lessons learned can be replicated and adapted both horizontally and vertically to broaden the scope of decentralization by initiating to decentralize some systems and service provisions.
Why decentralization of PECE and decentralization to which level? PECE is a public system task, but unlike many other public activities PECE is self-financing. Since parents pay fees for their children writing the exam, PECE decentralization will not require any financial support from the central government. Upazila are the fourth administrative tier in the government of Bangladesh (GOB) structure (below the central, division, and district administration) and is close to communities where schools function. Upazilas are a miniature version of the GoB structure and people are familiar with their role. The Ministry of Primary and Mass Education (MoPME) has field offices at the upazila level. Upazila Education Offices (UEO) and upazila Resource Centers (URC) are two important parts of MoPME’s upazila level structure. The UEO has the overall management responsibility at the upazila level, while URC provides various training to primary school teachers to build their capacities. Upazila being an effective tier for decentralization with representation of various central agencies and given the history of its role in school management, it is the appropriate level for taking on the expanded tasks implicit in decentralization.
4. Implementing PECE decentralization
Bangladesh has been making concerted efforts towards achieving the goal of Education For All (EFA) and the Millennium Development Goal 2, which called for universal primary education by 2015. This is the international context for the improvement of learning outcomes for children in Bangladesh. A credible assessment of student learning is important from this perspective (USAID, 2004). PECE decentralization would help, if the GOB can build confidence among various interest groups and government functionaries that it expects upazilas to expand their capacity. Decentralization of planning and management of primary education was one of the major strategies proposed for the achievement of EFA. It is also a key action area in the Third Primary Education Development Program (PEDP 3 for the period 2011-17.) But, as noted, a great constraint in promoting decentralization is seen to be the lack of necessary competencies at the local level, which has stymied a determined and systematic effort.
As mentioned earlier, public officials at the central level do not need to create a separate funding provision for decentralized PECE administration. Existing rules and regulations can sufficiently cover PECE administered jointly by UEO and URC, working closely at the upazila level. The URC can focus more on technical aspects of PECE and the UEO can be more instrumental in administering the test and other logistics. For instance, URCs can provide training on ‘examination system and learning assessment’ for the primary school teachers; the UEO will help the primary education stakeholders at the upazila level address the strategic planning required for administering PECE at the local level. The selection of scholarship recipients can still be done on the basis of a quota for each upazila based on its student population, taking into account the result of the Upazila level examination.

52 Bangladesh Education Journal
Decentralization of PECE can be undertaken initially on a trial basis in a limited number of upazilas. The pilot upazilas could include a mix of high and low performing upazilas, urban and rural combinations, and upazilas that differ based on socio-economic and learning status t. Provided it is undertaken carefully, this trial can lay the foundation for future decentralization of the entire primary education system in Bangladesh. The reform needs to be slowly and carefully planned, engaging all primary education stakeholders at both the local and central levels.
References:
1. Ahmed, M. (2015). “Primary Education: Learners or Just Test-Takers?” The Daily Star, August 19, 2015. http://www.thedailystar.net/op-ed/primary-education-learners-or-just-test-takers-128776
2. CAMPE (2014). Whiter Grade V Examination? An assessment of primary education completion examination in Bangladesh. Education Watch 2014, Dhaka: Campaign For Popular Education.
3. CAMPE (2008) State of Primary Education in Bangladesh. Progress Made, Challenges Remained. Education Watch 2008, Dhaka: Campaign For Popular Education
4. DPE (2012). Bangladesh Primary Education Annual Sector Performance Report 2012, Dhaka: Directorate of Primary Education
5. DPE (2014a). Bangladesh Primary Education Annual Sector Performance Report 2012, Dhaka: Directorate of Primary Education.
6. DPE (2014b). Primary Education Completion Examination 2014, Dhaka: Directorate of Primary Education.
7. Kingdon, G., Little, A., Aslam, M., Rawal, S., Moe, T., Patrinos, H., Beteille, T., Banerji. R., Parton, B. & Sharma S. (2014). A rigorous review of the political economy of education systems in developing countries, Institute of Education, University of London.
8. Ministry of Education (2010). National Education Policy (2010). Dhaka: Ministry of Education. The Government of the People’s Republic of Bangladesh.
9. USAID (2004). Time to Learn: Teachers’ and Students’ use of time in government primary schools in Bangladesh (2004). Basic Education Policy Support, USAID, Washington DC: June 2004
Abstract
The results from the 2015 Higher Secondary Certificate (HSC) examinations give some indication of how the new Creative Questions (CQ) and the accompanying modified Multiple Choice Questions (MCQ) are being treated across the various Boards of Intermediate and Secondary Education (BISE). This analysis is based on data on 8 HSC subjects on which tests were conducted by three BISEs. It reveals the discrepancies in test results for different subjects within and among Boards which raise questions about validity and reliability of the tests. It is recommended that, at the least, grade point (GP) and grade point average (GPA) should be calculated on the basis of standardised scores rather than raw scores. Continuing evaluation and analysis of the tests are needed; particularly, regular item analysis of questions in order to improve validity and reliability of tests.
Key Words. Secondary Education Public Examinations, Standardisation, Multiple Choice Questions, Creative Questions, Bangladesh Secondary Education.
1. BackgroundExaminations in Bangladesh at the higher secondary certificate (HSC) level are conducted by 8 examination boards (BISE). Each board covers the same range of subjects, but currently sets its own question papers. In most subjects there are two papers or parts – one described as Creative Questions (CQ) for which each question has 4 sub-parts leading to a maximum of 10 marks. There is a choice with more questions than students need to answer. Marks are awarded to the 4 sub-parts based on a hierarchical model derived from Bloom’s taxonomy of learning domains designed to encourage higher order learning of analysis, evaluation and application of knowledge, rather than only knowing and recalling facts. The CQ papers are marked by examiners who are expected to follow a marking scheme created by the question setters. The other paper is a collection of multiple choice questions (MCQ), also based on the same hierarchical model as for the CQ paper, but seeking to have a wider content coverage. The MCQ papers are marked by machine, the Optical Marking Reader (OMR).
An Analysis of 2015 HSC Examination Results forSelected Subjects of Three Examination Boards
By the BEDU team led by:Robiul Kabir Chowdhury, Jack Holbrook, Chowdhury Mufad Ahmed,
*Md. Ali Ahsan, Ahmed Obaidus Sattar Bhuiya
* In addition to the above named, the Bangladesh Examination Development Unit (BEDU) team contributing to the study included: Shamima Akhter, Lipika Rani Saha, Ranjit Kuma Sarkar, Salma Akter, Md. Khalid Hossain,, Muhammad Saiful Islam, Muhammad Aslam Khaled, Md. Shamsul Huda, and Mohammad Nasir Uddin.

54 Bangladesh Education Journal Bangladesh Education Journal 55
The marks obtained in each paper are combined (proportionately for a total of 100 for a particular subject). This is then converted to grades based on the following formula: A+ = > 80 marks; A = 70-79; A- = 60-69; B = 50-59; C = 40-49; D = 33-39; F = <33 These are recorded as grade points (GP) with A+ =5 and so on, and F=0. Each Board follows the same formula and declares for each student a combined result as a grade point average (GPA).
BEDU, the Bangladesh Examinations Development Unit, as part of its job of improving the examination system and engaging in needed research, has undertaken this analysis. The main purpose of this study is to examine the validity and reliability of the examinations, recognising that examinees’ marks for each subject are indicated in terms of a grade point (GP) based on raw scores for each paper without taking account of variability of papers for different subjects set by the various BISE and the reliability of marking by the examiners appointed by each BISE (Ministry of Education, n.d.)
2. Study QuestionsThe report is in three parts which deal with: (a) comparison of scores of the CQ and MCQ papers, (b) effect of applying a standardisation formula on scores, and (c) comparison of percentages of high GPA for selected subjects in three Boards (NFER, n. d.).This study, therefore, addresses the following research questions:
i. How suitable is the marking of question papers undertaken by examiners compared to marks obtained by a computerised optical marking record (OMR) across the various BISEs?
ii. Are the results at HSC level, by each BISE, equivalent? If not, is it possible to ensure equivalency of results from all BISEs?
iii. Can meaningful grade point and grade point averages be established to ensure an equivalent standard of examination results from all BISEs?
3. Comparison of CQ and MCQ Scores
This section compares:
• Mark distributions for a selection of HSC subject papers from three BISEs
• Mean scores per subject based on marks awarded for CQ and MCQ papers, and
• Practical examination marks.
Discussion of FindingsMarks obtained by students vary greatly with distinct troughs and peaks for CQ papers. The peaks are seen at the point of boundaries for grade point, such as a score of 80 for GP5 or letter grade A. However, marks for MCQ papers are distributed more evenly. MCQ items are machine marked; there is no examiner influence in this case. It can be reasonably argued that machine marking is more objective and, therefore, has eliminated peaks at the grade point boundaries.
Comparison of CQ and MCQ results
The difference can be clearly seen in graphical representation (Figure 1). The graph for CQ and MCQ marks distribution for Sociology papers set by Barisal BISE illustrates the point.
Figu
re 1
. B
aris
al B
oar
d H
SC 2
015
So
cio
logy
co
de
117
1st
pap
erC
Q/M
CQ 10
0
400
300
200
100 0
100
400
300
200
100 0
Frequency
Frequency
0_
11
70
_1
17
00
10
10
20
20
30
30
40
40
His
togr
amH
isto
gram
Mea
n =
24.
43St
d. D
ve =
5.1
1N
= 5
,412
Mea
n =
36.
66St
d. D
ve =
10.
533
N =
5,7
18

56 Bangladesh Education Journal Bangladesh Education Journal 57
The difference in CQ and MCQ marks distribution points to undue and damaging examiner interference that appears to ignore the marking scheme. The effect is somewhat mitigated when the CQ marks and MCQ marks are combined (since there is no peaks and troughs in MCQ marks) to arrive at a total that is converted to grades.
There is a wide range of mean scores across Boards for the same subject, as well as across subjects for both CQ and MCQ papers.
The following table shows the range of CQ mean scores per subject across Boards (expressed as a percentage), plus the range of mean scores across subjects and across Boards.
The table shows that there is a wide discrepancy for most subjects for mean scores within each Board and between different Boards for the same subject. In some cases the mean percentage score is quite high indicating an easy paper (leading to poor discrimination between the very able and not so able examinees).
It also points to poor validity of the question papers in maintaining a meaningful and uniform standard of results and in setting suitable questions, based on the CQ model (as indicated by the low standard deviation of mark distribution). It also suggests poor reliability of the marking, raising marks for some candidates while penalising others.
Comparison of Mean Scores
Table 2 considers the mean percentage scores per Board per subject for the MCQ papers, expressed in percentages of maximum possible mark.
Subject Code Subject Barisal (B)
Mean % Mean % Mean % Mean Scores
Comilla (C) Sylhet (S) Range of
117 Sociology I 61.1 46.4 55.7 46.4 – 61.1
C B
118 Sociology II 68.7 52.7 58.6 52.7 – 68.7
C B
123 Psychology I 69.9 64.2 41.5 41.5 – 69.9
S B
124 Psychology II 64.5 60.3 34.8 34.8 – 64.5
S B
176 Chemistry I 57.0 51.7 60.2 51.7 – 60.2
C S
177 Chemistry II 55.5 53.9 55.8 53.9 – 55.8
C S
178 Biology I 54.7 52.8 64.0 52.8 – 64.0
C S
179 Biology II 62.4 52.5 65.9 52.5 - 65.9
C S
253 Accounting I 48.2 50.4 48.6 48.2 – 50.4
B C
254 Accounting II 62.7 47.6 50.9 47.6 – 62.7
C B
265 Maths I 66.9 59.7 51.5 51.7 – 66.9
S B
266 Maths II 68.9 54.9 58.3 54.9 – 68.9
C B
269 Civics I 60.3 49.5 59.3 49.5 – 60.3
C B
270 Civics II 51.3 50.3 54.9 50.3 – 54.9
C S
304 History I 58.1 49.5 55.2 49.5 – 58.1
C B
305 History 2 63.0 53.0 53.4 53.0 – 63.0
C B
Range 48.2 – 68.9 47.6 – 59.7 48.6 – 65.9
(subject) (253 266) (254 265) (253 179)
Table 1: Range of mean scores for CQ papers of 8 subjects in three BISEs
Subject Subject Barisal (B) Code Mean % Mean % Mean % Mean Scores
Comilla (C) Sylhet (S) Range of
117 Sociology I 61.1 49.2 51.4 49.2 - 61.1C B
118 Sociology II 65.8 51.8 47.8 47.8 - 65.8S B
176 Chemistry I 74.9 62.9 52.9 52.9 – 74.9S B
177 Chemistry II 73.6 63.5 56.5 56.5 – 73.6S B
178 Biology I 66.2 66.0 56.7 56.7 – 66.2S B
179 Biology II 72.3 63.3 58.8 58.8 – 72.3S B
253 Accounting I 71.1 50.6 55.9 55.9 – 71.1S B
254 Accounting II 70.5 51.7 47.7 47.7 – 80.6S B
269 Civics I 58.9 58.3 59.6 58.3 59.6C S
270 Civics II 66.2 71.1 74.3 66.2 - 74.3B S
304 History I 71.2 64.5 66.4 64.5 – 71.2C B
305 History II 59.1 53.3 56.2 53.3 – 59.1C B
Range 58.9 – 74.9 49.2 – 71.1 47.7 – 74.3269 176 117 270 254 270
Table 2: Range of mean scores for MCQ papers of 8 subjects in three BISEs

58 Bangladesh Education Journal Bangladesh Education Journal 59
Table 2 illustrates, similar to CQ papers, that there is also wide discrepancy between mean scores per Board for the same subject and between subjects. The results again point to poor validity of the test items in maintaining a meaningful standard, based on the model intended, as indicated by the low standard deviation for scores..
A comparison of means for CQ and MCQ papers may show the level of difficulty of the two types of questions. However, results show no general pattern across subjects and Boards. .
A more detailed comparison of MCQ and CQ scores means is shown in Table 3.
The MCQ mean score is often higher than the CQ score, as seen in Table 3. The MCQ mean score is excessively high for some subjects in some Boards (This is in contrast with the SSC results where the MCQ mean score is more often lower than the CQ mean score, not shown in this paper.) Especially high mean scores suggest the MCQ papers may be poorly set and not following a suitable assessment model.
It is necessary to undertake item analysis for each paper to have a better understanding of validity and reliability across subjects and across Boards. This is a task to which BEDU needs to give attention and develop its capacity for this purpose.
Practical examination Scores
Practical examinations are conducted for certain subjects as part of the public examination, where applicable. The practical examination scores all cluster around the maximum possible mark. The practical examination results, therefore, are totally unreliable as a measure of learning achievement. All the practical mark does is to boost the mean overall score for each student taking that subject, irrespective of the Board. The mean scores are shown in Table 4.
The mean scores of all practical examinations are exceptionally high, having a very low standard deviation. There is virtually no discrimination seen among examinees. It denotes that teachers are seemingly more interested in the examination results than in educating their students in meaningful ways.The practical scores boosting the overall scores give an undue advantage to the students having practical subjects, especially, the science stream students.
4. Standardization of examination results
One of the objectives of the study is to ascertain whether the results at HSC level from the different BISEs maintain a comparable standard across Boards and subjects. This study, conducted by BEDU, uses relevant data from Barisal, Comilla and Sylhet Boards.
Table 3: Comparison of the range of mean scores for CQ and MCQ papers
Subject Code SubjectRange of
CQ Mean ScoresRange of
MCQ Mean scores
117
118
123
124
176
177
178
179
253
254
265
266
269
270
304
305
Sociology I
Sociology II
Psychology I
Psychology II
Chemistry I
Chemistry II
Biology I
Biology II
Accounting I
Accounting II
Maths I
Maths II
Civics I
Civics II
History I
History 2
46.4 – 61.1 C B
52.7 – 68.7 C B
41.5 – 69.9 S B
34.8 – 64.5 S B
51.7 – 60.2 C S
53.9 – 55.8 C S
52.8 – 64.0 C S
52.5 - 65.9 C S
48.2 – 50.4 B C
47.6 – 62.7 C B
51.7 – 66.9 S B
54.9 – 68.9 C B
49.5 – 60.3 C B
50.3 – 54.9 C S
49.5 – 58.1 C B
53.0 – 63.0 C B
49.2 -61.1 C B
47.8 - 65.8 S B
NA
NA
52.9 – 74.9 S B
56.5 – 73.6 S B
56.7 – 66.2 S B
58.8 – 72.3 S B
55.9 – 71.1 S B
47.7 – 80.6 S B
NA
NA
58.3 – 59.6 C S
66.2 – 74.3 B S
64.5 – 71.2 C B
53.3 – 59.1 C B
Note: NA – No MCQ tests used.
Table 4: Mean scores for practical examinations in 8 papers for 3 BISEs.
Subject CodeBarisal Mean (%)
Examination Board
Comilla Mean (%) Sylhet Mean (%)
123
124
176
177
178
179
265
266
24.74 (99.0 %)
24.74 (99.0 %)
23.75 (95.0 %)
23.79 (95.2 %)
24.12 (96.5 %)
24.12 (96.5 %)
24.40 (97.6 %)
24.41 (97.6 %)
24.59 (98.4 %)
24.61 (98.4 %)
23.77 (95.1 %)
23.99 (96.0 %)
24.02 (96.1 %)
24.17 (96.7 %)
24.17 (96.7 %)
24.31 (97.2 %)
23.33 (93.3 %)
23.73 (94.9 %)
22.82 (91.3 %)
23.02 (92.1 %)
22.92 (91.7 %)
23.13 (92.5 %)
23.25 (93.0 %)
23.31 (93.2 %)

It is noteworthy that the results at HSC level are published on the basis of the raw score overlooking the nature and pattern of the scores of the respective subjects. This leads to non-comparable results across boards, subjects and years. The average marks obtained in the subjects of the Science stream having the advantage of practical marks are higher than that of Commerce and Humanities subjects. As a consequence, fewer numbers of students from the latter streams obtain GPA 5 compared to the science students. The commerce and humanities students are thus placed at a disadvantaged position when their performance is assessed for higher education admission, job markets and other purposes (NFER, nd.)
This section focuses on publishing the results which would be comparable across boards, years and subjects. For this purpose, two steps were necessary:
• Collecting raw scores from HSC examination subjects in order to use these to create standardised scores.
• Comparing raw scores and standardized scores for selected subjects from three Boards.
The research question for this section, therefore, is: Are the results at HSC level of different BISEs of an equivalent standard? If not, is it possible to establish comparable examination results from all BISEs?
Methodology
• HSC examination results for 2015 were obtained from three BISEs.
• The results were analysed to determine the distribution of examinees’ marks in the different subject papers.
• The distribution of marks from total raw score, adding CQ and MCQ scores, and the distribution of marks from standardized scores were derived.
• The distribution of marks based on raw scores and standardised scores were checked against a normal distribution curve, which is predicted to represent the expected mark distribution for the large numbers taking each examination.
• The resulting graphs were analysed in order to derive answers to the research question posed.
Discussion of Findings -- Comparison of raw score and standardized score
Graphs of raw score and standardized score of Barisal in Chemistry (Figure 2.1) show an almost normal distribution in contrast to what was seen above (Figure 1) for Sociology in the same Board. This suggests a difference in scores and marking pattern for science and other subjects. There may also be differences in standard and criteria in constructing questions.
60 Bangladesh Education Journal Bangladesh Education Journal 61
250
200
150
100
50
040
Freq
uenc
y
60 80 100
t_176
Histogram
Mean = 72.7Std.Dev. = 9.68N = 5,344
250
200
150
100
50
0
40
Freq
uenc
y
60 80 100
Tscore 176
Histogram
Mean = 65.96Std.Dev. = 10.04N = 5,344
ndFigure 2.1: Barisal Board HSC 2015 Chemistry Code 177 2 paper.
Note the graphs for the standardized scores are similar in appearance to those from the unstandardized (raw) scores. This is not so for all subjects and all Boards, which suggests problems in the quality of setting questions and marking standard.
The percentages of GP A+ across boards are different for different subjects and for different Boards as determined from the raw scores (not shown). On the other hand, the percentage of GP A+ across subjects and Boards are likely to be similar for standardized score (approximately about 10%). (Figure -2.2 for Chemistry paper, Barisal)
Figure 2.2: A+ mark distribution based on raw scores and standardised scores
40
30
20
10
0
gp 176A+ A- B C DA
Per
cen
t
gp 176
26.38
35.54
29.30
0.786
7.953
0.037
40
30
20
10
0
gp 176A+ A- B C DA F
Per
cen
t
Tgp 176
gp 176
10.35
25.06
37.69
4.061
22.47
0.299 0.075
A+ (26.38%)Chemistry Paper 1, Barisal Raw Scores A+ (10.36%) Chemistry Paper 1, BarisalStandardised Scores

In some cases, the total raw score graphs show peaks rather than a smooth distribution of marks. The peaks occur from marking irregularities by examiners, which are not fully eliminated when marks from the CQ and MCQ papers are combined.
When both the graphs of raw and standardized scores do not follow a normal distribution, this indicates weaknesses in setting the question paper and perhaps marking the papers by examiners.
Figure 2.3 showing practical examination results peaking at the point of maximum score indicates faulty and rather useless testing and grading.
62 Bangladesh Education Journal Bangladesh Education Journal 63
5. Making Grade Point Averages (GPA) equivalent across BoardsThis section explores whether grade points and grade point averages for different Boards can be equivalent.
Methodology
• HSC examination results for 2015 were obtained from different BISEs.
• The results were analysed to determine the distribution of GP for student scores in different subject papers. Graphs (histograms) were plotted for the percentages of GP (Grade Point) students attained in each examination paper for total raw score and for standardized score.
Figure 2.3: Chemistry, Code 176, Practical Test Scores, Barisal Board
p_17615 20 25
Fre
quen
cy
10
Histogram
3,000
2,000
1,000
0
Mean = 23.74Std. Dev. = 1.752N = 5,344
• The distribution of GP based on raw scores and standardized score are compared.
• The distribution of GPs were checked against a normal distribution, predicted to represent the expected GP distribution for the large student numbers taking each examination.
Findings
Table 5 shows the combined raw scores for CQ and MCQ papers per subject across boards, plus the range of mean scores by subject and by Board.
Table 5: Combined CQ and MCQ raw score means and their range
SubjectCode
Examination Board
Barisal (B)Mean %
Comilla (C)Mean %
Sylhet (S)Mean %
Range ofMean Scores
117
118
176
177
178
179
253
254
269
270
304
305
Range of mean scores
across subjects
46.9
51.4
66.4
67.6
67.0
66.6
49.4
48.1
53.1
58.6
55.5
53.1
46.9 – 67.6
(117 177)
59.8
66.1
72.7
71.6
68.4
73.5
56.3
64.8
59.7
57.3
63.4
61.5
56.3 – 73.5
(253 179)
53.5
54.4
65.3
65.0
67.5
69.1
51.1
49.3
59.4
63.0
59.7
54.5
49.3 – 69.1 (254 179)
46.9 – 59.8
C B
51.4 – 66.1
C B
65.3 – 72.7
S B
65.0 - 71.6
S B
67.0 – 68.4
C B
66.6 – 73.5
C B
49.4 – 56.3
C B
48.1 – 64.8
C B
53.1 – 59.7
C B
57.3 – 63.0
B S
55.5- 63.4
C B
53.1- 61.5
C B
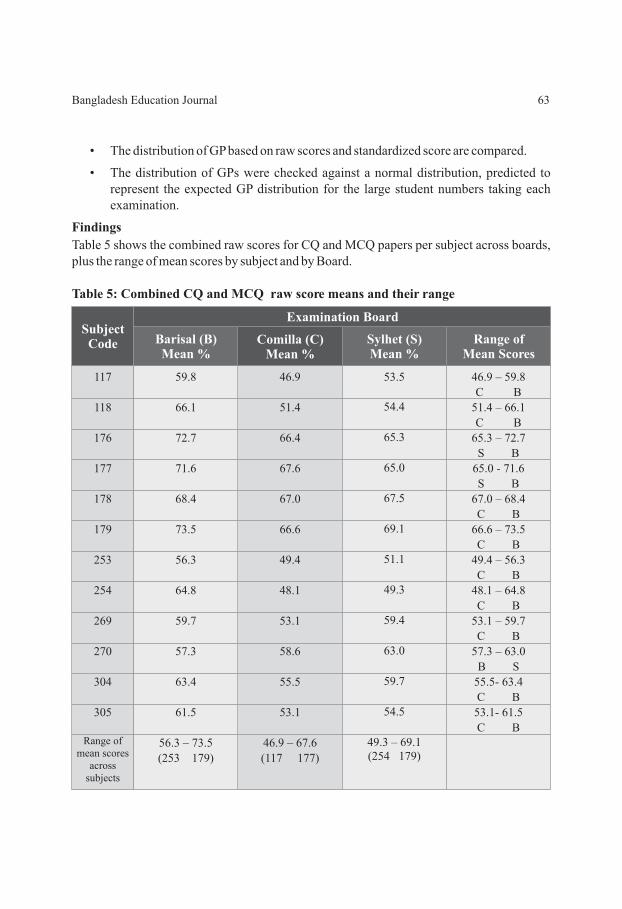

Table 5 shows:
1. There is a wide discrepancy between mean scores based on raw student marks for different Boards for the same subject in many cases.
2. There is a wide discrepancy between mean scores based on raw marks per subject for the same board in many cases.
3. The lower mean scores were for humanities (e.g., Sociology, 1st paper). while science mean scores were higher (e.g., Biology 2nd paper); the mean of all science subjects are higher than for other streams.
4. Mean scores for the Comilla Board were lower on average, while mean scores for Barisal Board were higher, showing another variability of mean student marls across Boards.
The results point to poor validity of the question papers in terms of maintaining a meaningful and uniform standard in setting suitable questions.
Table 6 shows the standardized scores per subject across Boards, plus the range of mean scores by subjects and by Boards.Table 6 illustrates the effect of standardization of scores. The results based on standardised marks point out that through standardization the variation of mean scores across the subjects and across the Boards can be minimised.
The findings presented in Table 7 show the percentage of A+ distribution for raw GP and standardized GP per subject across Boards. (Also see Figure 2.2 above.)
Analysis of Table 7 data indicates that on applying standardization, the percentage of A+ is similar and comes close to 10% for each subject across each Board. It also shows:
1. For raw scores, there is a very high discrepancy in the percentage of A+ within the same subject across Boards.
2. For raw scores, there is a very high discrepancy in the percentage of A+ within the same Board across subjects.
3. The percentage of A+ tends to be lower for humanities subjects but much higher for science subjects.
Discussion - Comparison of raw score and standardized score distribution
The results highlight a lack of common standards among the Examination Boards arising from setting questions and marking papers at different standards by each Board. Applying standardisation to raw scores and calculating and publishing results based on standardization of scores can contribute to establishing common standards in results across academic streams and Boards. It is important to note that the benchmark of 10% for A+ was an assumption made by BEDU and was not derived from any psychometric analysis of measurement. It was chosen to represent a meaningful standard, which could be used to equate grade points across Boards, based on a normal distribution assumption. In practice, however, exactly 10% was not
64 Bangladesh Education Journal Bangladesh Education Journal 65
Table 6: Mean standardised scores for subjects across Boards and their range.
SubjectCode
Examination Board
BarisalMean %
ComillaMean %
SylhetMean %
Range ofMean Scores
117
118
176
177
178
179
253
254
269
63.8
62.9
65.0
64.0
65.0
64.0
61.5
60.0
63.0
64.0
67.0
66.0
66.0
64.0
64.0
60.0
60.0
65.8
64.0
65.0
64.0
62.5
65.0
63.5
58.0
59.0
64.0
63.8 – 64.0
C B/S
62.9 – 67.0
C B
64.0 – 66.0
S B
62.5 – 66.0
S B
64.0 – 65.0
B C/S
63.5 – 64.0
S B/C
58.0 – 61.5
S C
59.0 –60.0
S B/C
63.0 – 65.8
C B
270
304
305
Range of mean scores across
subjects
61.9
58.0
62.1
50.0 – 68.9
63.0
59.0
65.0
59.0 – 67.3
63.0
59.7
64.0
56.0 – 68.0
61.9 – 63.0
C B/S
58.0 – 59.7
C S
62.1 – 65.0
C B
always possible to achieve. As the 10% benchmark was arbitrary, the selected A+ percentage could be modified to relate to other grade point average cut-off still approximating a normal distribution. The A+ % thus represents a selected standard, but once chosen it needs to be applied across Boards and across examination years without changing it frequently. Thus, comparison could be made per subject, across different cohorts of examinees and over time. One important criterion of judging the quality of the examination would be approximation of results to a normal distribution.

6. ConclusionsThe analysis of findings regarding the research questions above leads to several conclusions. Parallels can be seen in these conclusions to other developing countries in the region which are also addressing similar issues (Hill, 2013).
i. Marking by examiners of CQ papers clearly shows subjectivity which puts reliability of the tests under question. Whether and how the marking scheme is being followed
66 Bangladesh Education Journal Bangladesh Education Journal 67
Table 7: Percentage of A+ marks for Boards based on raw and standardised scores
SubjectCode Barisal
raw
A+ % A+ % A+ %
Barisalstandard
Comillaraw
Comillastandard
Sylhetraw
Sylhetstandard
Range(Board to Board)
117
118
123
124
176
177
178
4.8
8.6
56.0
36.9
26.4
25.4
14.0
9.9
11.2
11.4
10.6
10.4
10.0
10.50
0.3
0.9
33.1
28.2
14.4
21.2
18.4
9.8
11.3
9.8
10.0
10.4
10.8
11.2
1.3
0.7
2.3
2.6
12.2
13.9
18.5
10.0
10.5
9.9
11.5
10.5
11.0
11.9
0.3–4.8 (raw)
9.8–10.0 (standard)
0.7-8.6 (raw)
10.5–11.3(standard)
2.3–56.0 (raw)
9.8–11.4(standard)
2.6–36.9 (raw)
10.0–11.5(standard)
12.2–26.4 (raw)
10.4-10.5(standard)
13.9 –25.4 (raw)
10.0–11.0(standard)
14.0–18.5 (raw)
10.5-11.9(standard)
179
253
254
269
270
304
305
Range (sub.to sub.)
29.4
2.9
17.8
3.0
3.8
12.1
3.2
3.0-56.0
(raw)
10.1
8.3
9.8
10.8
9.7
9.7
9.0
8.3-11.4(standard)
17.2
2.5
2.1
1.4
5.3
6.9
1.5
0.3-33.1
(raw)
9.9
9.4
10.4
10.1
10.1
10.3
9.9
9.4-11.3(standard)
21.9
4.8
3.9
3.5
9.6
10.3
1.5
0.7-21.9
(raw)
11.6
11.9
10.4
9.5
9.9
9.6
9.7
9.5-11.9(standard)
17.2-29.4(raw)
9.9-11.6(standard)
2.5–4.8 (raw)
8.3 –11.9(standard)
2.1–17.8 (raw)
9.8–10.4(standard)
1.4 – 3.5 (raw)
9.5 – 10.8(standard)
3.8 – 9.9 (raw)
9.6 –10.0(standard)
6.9 -12.1(raw)
9.6 -10.3(standard)
1.5 -3,2(raw)
9.0-9.9(standard)
by examiners and how it is understood by examiners need to be given attention and assessed.
ii. Marking by machine (OMR) is superior in terms of reliability. However, the validity of MCQ papers in respect of measuring competence and discriminating student performance need measures to ensure appropriate content and quality of the test items.
iii. There is no inherent superiority of CQ over MCQ or vice versa; they serve different test objectives. Greater reliability in marking and possibility of covering a broader range of content exist with MCQ; whereas, higher order learning domain may be more easily tested with CQ. However, all this depends on ensuring the quality of question setting of both kinds and minimising subjectivity in marking CQ papers.
iv. Marking of practical examination is seriously flawed and does not add nay value to measurement of student learning. In fact, it distorts results by giving undue advantage to students of the science stream.
v. Rigorous individual item analysis is necessary to pass definitive judgement on validity and reliability of tests or improve their effectiveness as measurement tools.
vi. A method of standardization is needed to establish equivalence of marks across subjects and Boards and over time. Without standardization students are rewarded or penalized depending on subjects for which they take the test, and the Board that gives the test, rather than on the basis of students’ real performance.
vii. By means of standardization it is possible to establish meaningful grade point distributions which can be similar across subjects and across Boards. By such means, the very able students are not penalized, which is the case if the percentage of examinees obtaining the grade point A+ is allowed to become excessive.
7. Recommendations
The following recommendations are offered on the basis of the findings and conclusions.
i. Standardised marks should be used for calculating grade points and grade points averages to determine student results. A further logical step would be to have common question papers for all boards and establishing and following common standards and process for setting questions and marking tests.
ii. Given the comparative advantages of both CQ and MCQ, it would be reasonable to give equal weight in tests to both, with due attention to maintaining quality in setting and marking questions. Recently, a decision has been taken to reduce the proportion of MCQ items and increase CQ items in SSC and HSC examinations, because of dissatisfaction expressed about the quality of MCQ items.
iii. Preparation of test items (both CQ and MCQ) for large scale public examination is a highly technical job; the necessary capacity has to be built jointly by the examination

68 Bangladesh Education Journal
boards, a large repository of questions of both MCQ and CQ type have to be built up for all subjects, and regular item analysis should be undertaken to maintain and improve quality, validity and reliability of questions.
iv. Options should be considered for dysfunctional practical parts of the examinations, such as, describing processes of experiments in writing or gradually introducing computer-based simulation of experiments.
v. Apart from attending to logistical and procedural issues of public examinations and ensuring security and confidentiality of tests, greater attention should be given to reducing pressure and burden on students, by reducing total duration of tests, length of each test, and the possibility of what can be taken out of the domain of public examinations and shifted to school-based evaluation.
References
Ministry of Education, Education Board Computer Center (n. d.). http://www.educationboard.gov.bd/computer/
NFER (n.d). “What do test scores mean – Standardised Scores and Percentile Ranks.” National Foundation for Educational Research in England and Wales, Centre for Assessment. https://www.nfer.ac.uk/research/
Hill, P. (2013). Examination Systems. Asia Pacific Secondary Education System Review Series 1. Bagkok: UNESCO Asia and Pacific Regional Bureau of Education.

BAFED I n s p i r i n g E x c e l l e n c e
BRAC Institute of Educational DevelopmentBRAC University (BIED, BRACU)