Embed Size (px)
Citation preview


Edexcel GCSE Geography A Geographical Foundations
Teacher Guide Second Edition Alison Barraclough Cameron Dunn Wayne Eaves David Flint Lindsay Frost Andy Palmer Martin Parham Michael Witherick Phil Wood Nigel Yates

Published by Pearson Education Limited, a company incorporated in England and Wales, having its registered office at Edinburgh Gate, Harlow, Essex, CM20 2JE. Registered company number: 872828 Edexcel is a registered trade mark of Edexcel Limited Text © Alison Barraclough, Cameron Dunn, Wayne Eaves, David Flint, Lindsay Frost, Andy Palmer, Martin Parham, Michael Witherick, Phil Wood and Nigel Yates 2009, 2013 First published 2009 This edition published 2013 British Library Cataloguing in Publication Data A catalogue record for this book is available from the British Library ISBN 978 1 44690 628 6 Copyright notice All rights reserved. The material in this publication is copyright. Pupil sheets may be freely photocopied for classroom use in the purchasing institution. However, this material is copyright and under no circumstances may copies be offered for sale. If you wish to use the material in any way other than that specified you must apply in writing to the publishers. Designed by Pantek Arts Ltd, Maidstone, Kent Illustrated by Oxford Designers and Illustrators Picture research by Louise Edgeworth Acknowledgements The publisher would like to thank the following for their kind permission to reproduce their photographs: (Key: b-bottom; c-centre; l-left; r-right; t-top) Alamy Images: Neil McAllister 25, Robert Harding Picture Library Ltd 24, UK Stock Images Ltd 117; iStockphoto: Petrea Alexandru 169; Science Photo Library Ltd: NASA 136; TopFoto: © Ullstein Bild 16 All other images © Pearson Education In some instances we have been unable to trace the owners of copyright material, and we would appreciate any information that would enable us to do so. We are grateful to the following for permission to reproduce copyright material: p.16 from Arctic Monitoring and Assessment Programme Secretariat (AMAP); p. 25 from www.worldmapper.org, © Copyright SASI Group (University of Sheffield) and Mark Newman (University of Michigan); p. 17 Mercator Map with area comparison of China and Greenland. Courtesy of ODTmaps.com, PO Box 134, Amherst MA 01004 USA; (413-549-1293; Fax: 413-549-3503; E-mail: [email protected] ; WEB: www.ODTmaps.com); p. 19 Courtesy of Derrick Beckner and the Penn State University Libraries; p. 20 reproduced with permission from Dr. David Etheridge (CSIRO); p. 20 from the Proviser website: data originating from HM Land Registry records is reproduced with the permission of HM Land Registry under delegated authority from the Controller of HMSO; Tables p.20-21 from http://www.devon.gov.uk/sidmouthbaselineprofile.pdf, reproduced with permission from Devon County Council, Devon Primary Care Trust and Crown copyright material with permission under the terms of the Open Government Licence; Tables p. 38 adapted from Sunday Times/Times Online, 1/3/2009, reproduced with permission from Philip Beresford; p. 35 from http://www.dft.gov.uk/about/howthedftworks/sda/secsusdevactplan07/susdevactionplan07?page=2, Crown copyright material is reproduced with permission under the terms of the Open Government Licence; p. 48 adapted from ‘Map of the location of Swanage Bay and Durlston Bay in Dorset’, Ordnance Survey, copyright © www.collinsbartholomew.com Ltd, reproduced with kind permission of HarperCollins Publishers; p. 78 “Three figures showing the formation of an ox-bow lake”, copyright © Rob Chambers; page 79 “Map of Blandford's flood management scheme” adapted from Edexcel GCSE Geography, paper 1312/4H (Figure 1a) June 2006 copyright © Edexcel Limited; p. 95 adapted from “Diagram of convection currents in the mantle” U.S. Geological Survey; p. 132 adapted from “Access to Safe Water” http://www.worldbank.org/depweb/english/modules/environm/water/index03.html, data copyright © The World Bank; Table p. 154 from Distribution of international and foreign students in tertiary education, by country of origin (2005), http://dx.doi.org/10.1787/068417017111 , Education at a Glance 2007: OECD Indicators, OECD 2007, www.oecd.org/edu/eag2007, reproduced with permission from OECD; p Table p. 213 based on IDMC data, reproduced with permission; Tables p. 227 from Association of Leading Visitor Attractions (Alva), reproduced with permission.

In some instances we have been unable to trace the owners of copyright material, and we would appreciate any information that would enable us to do so. Websites The websites used in this book were correct and up to date at the time of publication. It is essential for tutors to preview each website before using it in class so as to ensure that the URL is still accurate, relevant and appropriate. We suggest that tutors bookmark useful websites and consider enabling students to access them through the school/college intranet. Disclaimer This Edexcel publication offers high-quality support for the delivery of Edexcel qualifications. Edexcel endorsement does not mean that this material is essential to achieve any Edexcel qualification, nor does it mean that this is the only suitable material available to support any Edexcel qualification. No endorsed material will be used verbatim in setting any Edexcel examination/assessment and any resource lists produced by Edexcel shall include this and other appropriate texts. Copies of official specifications for all Edexcel qualifications may be found on the Edexcel website - www.edexcel.com

Contents Introduction: Edexcel GCSE Geography A 6 About this Teacher Guide 8 About Examzone and ResultsPlus 10 Unit 1: Geographical skills and challenges Chapter 1: Geographical skills Skills planning matrix 12 Scheme of work 14 Extension activities 16 Answers 23 Case study extension activity 26 Chapter checklist and revision summary 27 Chapter 2: Challenges for the planet Teacher notes 31 Scheme of work 39 Extension activities 41 Answers 43 Case study extension activity 45 Chapter checklist and revision summary 46 Unit 2: The natural environment Chapter 3: Coastal landscapes Teacher notes 49 Scheme of work 57 Extension activities 59 Answers 61 Case study extension activity 63 Chapter checklist and revision summary 64 Chapter 4: River landscapes Teacher notes 67 Scheme of work 75 Extension activities 77 Answers 79 Case study extension activity 81 Chapter checklist and revision summary 82 Chapter 5: Tectonic landscapes Teacher notes 85 Scheme of work 93 Extension activities 94 Answers 96 Case study extension activity 98 Chapter checklist and revision summary 99 Chapter 6: A wasteful world Teacher notes 102 Scheme of work 110 Extension activities 112 Answers 114 Case study extension activity 116 Chapter checklist and revision summary 117

Chapter 7: A watery world Teacher notes 120 Scheme of work 128 Extension activities 130 Answers 132 Case study extension activity 134 Chapter checklist and revision summary 135 Unit 3: The human environment Chapter 8: Economic change Teacher notes 138 Scheme of work 146 Extension activities 148 Answers 150 Case study extension activity 152 Chapter checklist and revision summary 153 Chapter 9: Settlement change Teacher notes 156 Scheme of work 164 Extension activities 166 Answers 168 Case study extension activity 170 Chapter checklist and revision summary 171 Chapter 10: Population change Teacher notes 174 Scheme of work 182 Extension activities 184 Answers 186 Case study extension activity 188 Chapter checklist and revision summary 189 Chapter 11: A moving world Teacher notes 192 Scheme of work 200 Extension activities 202 Answers 206 Case study extension activity 209 Chapter checklist and revision summary 210 Chapter 12: A tourist’s world Teacher notes 213 Scheme of work 221 Extension activities 223 Answers 227 Case study extension activity 230 Chapter checklist and revision summary 231 Unit 4: Investigating geography Chapter 13: Your fieldwork investigation Teacher notes 234 Scheme of work 239 Extension activities 240 Answers 246

© Pearson Education Ltd 2013 Edexcel GCSE Geography A Geographical Foundations 6
Introduction: Edexcel GCSE Geography A Welcome to this new edition of the Edexcel GCSE Geography A Teacher Guide, which has been updated for the revised 2012 specification 2GA01, for first certification 2014. The new Edexcel GCSE in Geography A has four units. This allows for a flexible teaching approach, where students can study a unit and then move on to the next part of the course. Core topics cover key elements of both the physical and human world plus skills that are considered to be essential. The optional topics allow students to study areas of geography in more depth, focusing on contemporary issues from both physical and human environments. The fieldwork element of this course is found in the controlled assessment unit. This provides a more structured approach to internal assessment. The fieldwork tasks must be chosen from the list of tasks provided by Edexcel, but centres can put them in the context of their local area. Unit 1 is divided into two sections, both of which are compulsory material. The first covers cartographic skills, graphical skills, and geographical enquiry, and ICT and GIS skills whilst the second part examines student understanding of issues that have arisen from climate change and sustainable development. Unit 2 and 3 both contain two sections. Students complete all three topics in the first section: Coastal Landscapes, River Landscapes and Tectonic Landscapes in Unit 2 and Economic Change, Settlement Change and Population Change in Unit 3. Students then have a choice of two topics in the second section of each Unit: either A Wasteful World or A Watery World in Unit 2 and either A Moving World or A Tourist’s World in Unit 3. Planning the course The following planner is for a two year course and covers the whole specification, assuming two hours of teaching per week. Please note that a choice is to be made between the two options in section B of Unit 2 and in section B of Unit 3. In this linear specification, all exams are taken at the end of the course. Unit 4 controlled assessment is submitted at the end of year 11. This planner puts controlled assessment in the summer term of year 10 but it can be completed at any time. This planner also covers the specification in the order it is presented but you can teach the topics in any order you wish. For example, your choice of Unit 4 controlled assessment task might mean it makes more sense to cover Unit 3 first. It is clearly better to conduct the fieldwork data gathering exercise when students have covered the appropriate area of the specification. If teaching time is divided between two teachers than there may be more flexibility in the delivery of Unit 1 and Unit 2 which could be taught in tandem rather than consecutively. With the move to linear, review and consolidation of all topics will be very important and sessions for this have been incorporated into the scheme. Term/week Content Autumn term, Year 10 Weeks 1-5 Introductory week (week 1): Geographical skills and challenges
Unit 1 Geographical skills and challenges: Section B –– 7.1 The causes, effects and responses to climate change
Weeks 6-8 Unit 1 Geographical skills and challenges: Section B –– 7.2 Sustainable development for the planet
Half term Week 9 Unit 1 Geographical skills and challenges: Section B
–– 7.2 Sustainable development for the planet Week 10 Consolidation and Assessment Topic 7.2
Consolidation and Assessment Topic 7.1 Weeks 11-15 Unit 2 The Natural Environment: Section A
–– Topic 1 Coastal Landscapes Christmas break

© Pearson Education Ltd 2013 Edexcel GCSE Geography A Geographical Foundations 7
Spring term Week 1 Unit 2 The Natural Environment: Section A
–– Topic 1 Coastal Landscapes Weeks 2-6 Unit 2 The Natural Environment: Section A
–– Topic 2 River Landscapes Half-term Week 7 Unit 2 The Natural Environment: Section A
–– Topic 2 River Landscapes Week 8 Consolidation and Assessment week:
• Review River Landscapes topic • Review Coastal Landscapes topic
Weeks 9-11 Unit 2 The Natural Environment: Section A –– Topic 3 Tectonic Landscapes
Easter break Summer term Weeks 1-3 Unit 2 The Natural Environment: Section A
–– Topic 3 Tectonic Landscapes Weeks 4-6 Unit 2 The Natural Environment: Section B
–– Topic 4 A Wasteful World or –– Topic 5 A Watery World
Half-term Weeks 7-13 Unit 4 Investigating Geography End of year 10 Autumn term, Year 11 Weeks 1-3 Unit 2 The Natural Environment: Section B
–– Topic 4 A Wasteful World or –– Topic 5 A Watery World
Week 4 Consolidation and Assessment week: • Review A Wasteful World or A Watery World topic • Review Tectonic Landscapes topic
Weeks 5-8 Unit 3 The Human Environment: Section A –– Topic 1 Economic Change
Half-term Weeks 9-10 Unit 3 The Human Environment: Section A
–– Topic 1 Economic Change Weeks 11-15 Unit 3 The Human Environment: Section A
–– Topic 2 Settlement Change Christmas break Spring term Week 1 Unit 3 The Human Environment: Section A
–– Topic 2 Settlement Change Weeks 2-6 Unit 3 The Human Environment: Section A
–– Topic 3 Population Change Half-term Week 7 Unit 3 The Human Environment: Section A
–– Topic 3 Population Change Weeks 8-12 Unit 3 The Human Environment: Section B
–– Topic 4 A Moving World or –– Topic 5 A Tourist’s World
Easter break Summer term Week 1 Unit 3 The Human Environment: Section B
–– Topic 4 A Moving World or –– Topic 5 A Tourist’s World
Weeks 2-5 Revision Half-term followed by examinations

© Pearson Education Ltd 2013 Edexcel GCSE Geography A Geographical Foundations 8
About this Teacher Guide This Teacher Guide shows you how the resources in the Edexcel GCSE Geography A suite fit together, and gives guidance on how to plan for and implement the specification.
Student Book Teacher Guide and CD-ROM Planning the course structure
• Pages 6 and 7 provide an introduction to the specification and give guidance on how you might create a yearly plan.
• The Scheme of work for each chapter can be combined to make a complete and detailed yearly plan.
Planning each lesson
Teacher notes for all chapters provide a breakdown of each chapter into teachable sessions (based on approximately 2.5 teaching hours a week). Each session includes: • Starter and plenary ideas to engage your students with the
subject matter – these will include video, interactives, visual stimuli or class activities.
• Key teaching points – the knowledge and understanding that students are required to develop.
• A list of skills covered – the key geographical skills that students are required to develop. These are categorised as basic, graphical, cartographical, enquiry, decision-making, ICT and examination.
• A suggested homework exercise – this might be something from the Student Book or a supplementary activity from the Teacher Guide.
• A list of key terms – the geographical terminology that students should show evidence of in the examinations.
• All Student Book (SB), Teacher Guide (TG) and Active Teach (AT) resources are referenced next to each part of the session so that you know what you need to use and when.
The final session for each chapter is revision. The resources listed here can be used to create revision lessons to consolidate what has been learnt at the end of the chapter, or can be used during structured revision lessons prior to the examinations. The scheme of work includes revision as a structured element of the teaching timetable.
Introducing the course
Pages 4 and 5 of the Student Book can be used to explain how the course is structured, and to engage your students with the course content. Similarly, at the start of each new Unit, it is useful to use the unit introductions (Unit 1: pages 10 and 11, Unit 2: 54 and 55, Unit 3: 144 and 145, and Unit 4: pages 232 and 233).
Introducing the Student Book features
Pages 6 and 7 of the Student Book provide an overview of the features.
Objectives These provide a clear overview of what the student will learn in the section of the topic. Objectives increase in difficulty.
The objectives are included in the teaching points within the Teacher notes.
Skills • Skills builder exercises provide skills practice to develop students’ geographical skills and understanding.
• All Student Book Skills builder exercises are leveled. Levels – Foundation or Higher (F and H) – are given in the Teacher notes and Answers.
• A Skills planning matrix is provided on pages 12 to 15. Here, the required skills are cross referenced with the Student Book and Teacher Guide resources so that you can see exactly where each skill is practised. If you are integrating Unit 1 skills delivery through the teaching of Unit 2 and 3 content, then you can easily see where you will need to supplement skills coverage, and where to find material on these specific skills.
Key terms All key terms are highlighted in bold within the Student Book pages. All definitions are included within the glossary on page 263.
All key terms are referenced within the Teacher notes within the session that they will first be taught.

© Pearson Education Ltd 2013 Edexcel GCSE Geography A Geographical Foundations 9
Activities These provide extra support to
ensure understanding of course content.
• All Student Book activities are levelled. Levels – Foundation or Higher (F and H), Support or Stretch (Su and St) – are given in the Teacher notes and Answers.
• Case study extension activities provide practice of using specific case studies to illustrate key geographical issues. These are all Stretch level activities and should be used with only high level students. Some of the ideas presented within these activities take students beyond the Specification and Student Book content.
• Stretch and support extension activities provide extra practice and are differentiated as either Stretch or Support level.
Revision features Quick notes and case study quick notes pull out key information in examples and case studies for quick revision reference. A guide to the end-of-chapter and end-of book Examzone pages is given on page 8 of the Student Book. For each chapter there is: • A chapter overview: outlining
the key issue • A You should know checklist of
the key concepts and facts that students should know
• A key terms matching exercise to ensure students can understand apply important geographical terminology
• A ResultsPlus Maximise your marks exercise (see page 11).
• Chapter checklists – printable versions of the Student Book You should know checklists
• Revision Summaries – these provide quick revision practice for each chapter divided into sub-topics and organised into ‘recall’, ‘explain’ and ‘apply’.
Assessment features ResultsPlus margin features and the end-of-chapter Examzone pages combine expert advice and guidance to show students how to achieve better results. They unpick exam questions, outline how answers should be structured and give guidance on how answers are marked (see next page). The ResultsPlus Maximise your marks questions are levelled either Foundation or Higher.
• ResultsPlus margin features – Exam question report and Build better answers – are referenced in the relevant session within the Teacher notes. Levels for each question are also provided at Foundation or Higher level.
Controlled assessment
Chapter 13 is dedicated to the controlled assessment and provides advice and guidance for each of the assessment criteria.
Answers Answers are provided for the majority of the Student Book Activities, Skills builders and the Teacher Guide Stretch and support extension activities. Others require teacher-led class discussions.

© Pearson Education Ltd 2013 Edexcel GCSE Geography A Geographical Foundations 10
Examzone A dedicated suite of revision resources for complete exam success. We’ve broken down the six stages of revision to ensure that you are prepared every step of the way.
• Zone in: How to get into the perfect ‘zone’ for your revision. • Planning zone: Tips and advice on how to effectively plan your revision. • Know zone: All the facts you need to know and exam-style practice at the end of
every chapter. • Don’t panic zone: Last-minute revision tips for just before the exam. • Exam zone: Some exam-style questions for you to try, an explanation of the
assessment objectives, plus a chance to see what a real exam paper might look like. • Zone out: What do you do after your exam? This section contains information on how
to get your results and answers to frequently asked questions on what to do next.

© Pearson Education Ltd 2013 Edexcel GCSE Geography A Geographical Foundations 11
ResultsPlus These features are based on the actual marks that students have achieved in past exams. They are combined with expert advice and guidance from examiners to show you how to achieve better results. The following ResultsPlus features should be used for self- and peer-assessment. It is worth spending time discussing how to create an answer to these questions: Exam question report: These show previous exam questions with details about how well students answered them. • Red shows the number of students who scored low marks (less than 35% of the total marks) • Orange shows the number of students who did okay (scoring between 35% and 70% of the total marks) • Green shows the number of students who did well (scoring over 70% of the total marks). They explain how students could have achieved the top marks so that you can make sure that you answer these questions correctly in future. Build better answers: These give you an opportunity to answer some exam-style questions. They contain tips for what a basic, good and excellent answer will contain. Maximise your marks: These are featured in the Know Zone pages at the end of each chapter. They include an exam-style question with a student answer, examiner comments and an improved answer so that you can see how to build a better response. This ResultsPlus feature should be discussed in pairs or as a class so that students learn the technique by which examiners mark answers and can see how an answer can be improved. The Student Book also includes the following features that should be used to highlight where students must pay attention and not make easily avoided mistakes: Top tip: These provide examiner advice and guidance to help improve your results. Watch out! These warn you about common mistakes and misconceptions that examiners frequently see students make. Make sure that you don’t repeat them!

© Pearson Education Ltd 2013 Edexcel GCSE Geography A Geographical Foundations 12
Skills planning matrix Skills planning matrix
In this matrix (CS) refers to Case study extension activities and EA refer to Extension activities Chapter 1 2 3 4 5 6 7 8 9 10 11 12 13 Basic skills Labelling and annotating diagrams, maps, graphs and sketches
P12 1.1. 1(a) (i) 1.1.1(b) 1.6.1 (d)
p59 3.1.1 3.2.3 (a-b) 3.2.4 (a-c)
4.1.1 (a-b) 4.1.3 4.1.4 4.1.4. 4.2.2 4.2.5 (a-b)
5.1.1 5.1.2 (a-c) 5.2.3 (a-c)
6.1.1 (a-c) 6.2.3 6.2.str1
7.1.1 (a-c) 7.1.2 7.2.2 (a-b) 7.2.str1 (a-b)
8.2 (CS) 8.1.3 (a-c) 8.2.1 (a-b)
9.1.2 (a-b)
10.1.3
11.3 (case study) 11.2.1 (a-b) 11.3.1 (a-c)
12.3.1
Drawing field sketches and interpreting and annotating them
P13 1. 1.2 (b)
EA 2 1 (a-b) 9.1.3 (a) P241
Using and interpreting aerial, oblique and satellite photographs
P13 1. 1.2 (a) 1.7.1 (a-c) 1.7.2 (a-c)
3. 1. 7 (a) p74 P75
P96 P128 7.1 (case study)
P224
Writing coherently, showing the importance of good literacy skills in expressing geographical points
P14 1.1.2 (c) 1.2.4 (c-d) 1.5.2 (b-c) 1.5.3 (b)
p57 P79 P80
p92 P93 5.2.6 5.2.8 (a-b)
P116 6.1.3
P155 7.2.str4
(CS) 8.1.6 (b) 8.2.2 (a-b) 8.2.3 (a-c) 8.2.4 (a-c) 8.2.5 (a-b)
P217 9.1.3 (c) 9.1.4 (a-c) 9.1.5 (a-c) 9.1.7 (a) 9.2.4 9.2.5 9.2.6
P188 10.1.4 (b) 10.2.5 (a-b)
11.2.4 11.2.5 11.3.4 11.4.7 (a-c)
12.1.6 12.2.3 12.2.4 12.3.6
2. Cartographic skills recognise and describe distributions and patterns of both human and physical features
P14 P15 1.1 (CS) 1.2 (CS) 1.2. 1 (a-c) 1. 2. 2 (a-b) 1.2.3 1.2.4 (a-b)
P35 P89 P92 P94 P96
P116 P131 P134 P135
EA 2 2 a P165 9.2.1 (a)
P179 10.1.1
P197 11.1.9
P247
2.2 Sketch maps draw, label, annotate, understand and interpret sketch maps
P15 1.3.1 (a-c) 1.3.3 (a-c) 1.3.4 (a-b) 1.4.11
pp59 pp61
12.4.3
2.3 Ordnance survey maps recognise symbols (using a key), four-and six-figure grid references, and straight line and winding distances
P16 1.4.1 (a-c) 1.4.2 (a-c) 1.4.6 (a-b) 1.4.10
P67 9.1.1 (e)
demonstrate an understanding of direction, using an eight-point compass
P18 1.4.3 (a-c)
demonstrate understanding of the construction of cross-sections
P 19 1.4.5 (a-d)
complete and annotate cross-sections, indicating height and degree of slope and simple contour patterns
P19 1.4.7 1.4.8. (a-c)
recognise and describe patterns of vegetation, land use and communications
P19/20 1.4.4 (a-c)
describe and identify the site, situation and shape of settlements
P20 1.4.9 (a-c)
9.1.1 (a-c)
recognise and describe distributions and patterns of both human and physical features
P20 1.4.10
9.1.1(d)
infer human activity from map evidence including tourism
P21 1.4.2 (a-c)
P158
use maps in association with photographs, sketches and written directions
P.21 1.7.1 (a-b)

© Pearson Education Ltd 2013 Edexcel GCSE Geography A Geographical Foundations 13
Skills planning matrix Skills planning matrix
Chapter 1 2 3 4 5 6 7 8 9 10 11 12 13 3 Graphical Skills construct and complete a variety of graphs, charts and maps
P22 1.5.1 (a) 1.5.2 (a)
2.2.5 (a-c) 2.1 (CS) 2.2 (CS)
P107 P129 P133
P148 P151 P153 CS EA EA 1; 2b 8.1.2(b) 8.2 (CS)
P164 P182 10.1.4 (a) 10.2.1 (d)
11.4.1 (c) 11.3 (CS)
12.2.1 (a-b)
P244/5/6
interpret a variety of graphs including those located on maps and topological diagrams
P22 1.5.3 (a) 1.5.4 (b) 1.5.5 (a-b)
P30 P33 P36 P42 P46 2.1.1 (a-e) 2.1.2 (a-b)
P107 P111 P115
P126 P128 P133 P138
P148 P153 EA 1 5 a 8.1.5 (a)
P164 P182 P191
P217 12.2.1 (c)
P244/5/6
4. Geographical Enquiry Skills identify, analyse and evaluate geographical questions, hypotheses and issues
P22/23 10.2.1 (a-c) P238
establish appropriate sequences of investigation and follow appropriate enquiry approaches
P23 1.6.3 (b)
P238/9
extract and interpret information from a range of sources including field observations, maps, drawings, photographs, diagrams and tables and secondary sources
P24 P32
P79 P93 P99 P101
P107 P115
P129 P133 P134
P151 P153 EA 1 4a 8.2.2 (a)
9.1.7 (b) P182 P191
P197 P238 P244/5/6
describe, analyse and interpret evidence P24 P79 P96 P99
P107 P115
P129 P133 P134
P151 P153
P170 P174
P191
draw and justify conclusions from evidence P24 p43 10.2.3 (a-b) P249 evaluate methods of data collection, presentation and analysis of evidence
P24 10.2.1 (e)
P249/50
5. ICT skills collect and annotate photographs and satellite images
1.6.1 (a-c) P239
use databases such as census and population data
P25 1.6.2 (a-b)
10.2.2 (a)
use the internet, e.g. to investigate case studies of volcanic eruptions, floods
P25 1.2.4 (c, e)
p37 p43 2.1.3 (b-c) 2.2.2 (a-c) 2.2.5
p63 5.4 (CS)
8.4 (CS)
9.2.7 9.2.8
P201 11.4 (CS) 11.2 6 11.3.5
12.1.7 12.3.7
extract information from video and television programmes
P26
carry out data presentation and analysis techniques
1.6.3 (a-c)
use spreadsheets and data-handling software P26 research and present investigative work P26
1.6.3 (b) 11.4.6 (a/b)
12.4.6 12.4.7
6. GIS capture and represent geographical information in systems such as Aegis
P27 1.7.1 (a) 1.7.5
P239
use web mapping sites such as Google Earth and Multimap
P27 1.3.1 (c) 1.3.3 (d) 1.4.12 (a-c) 1.7.1 (a) 1.7.2 (a-c) 1.7.3 1.7.4 (a-d) 1.7.5
P239
Scheme of work
Unit 1 Section A
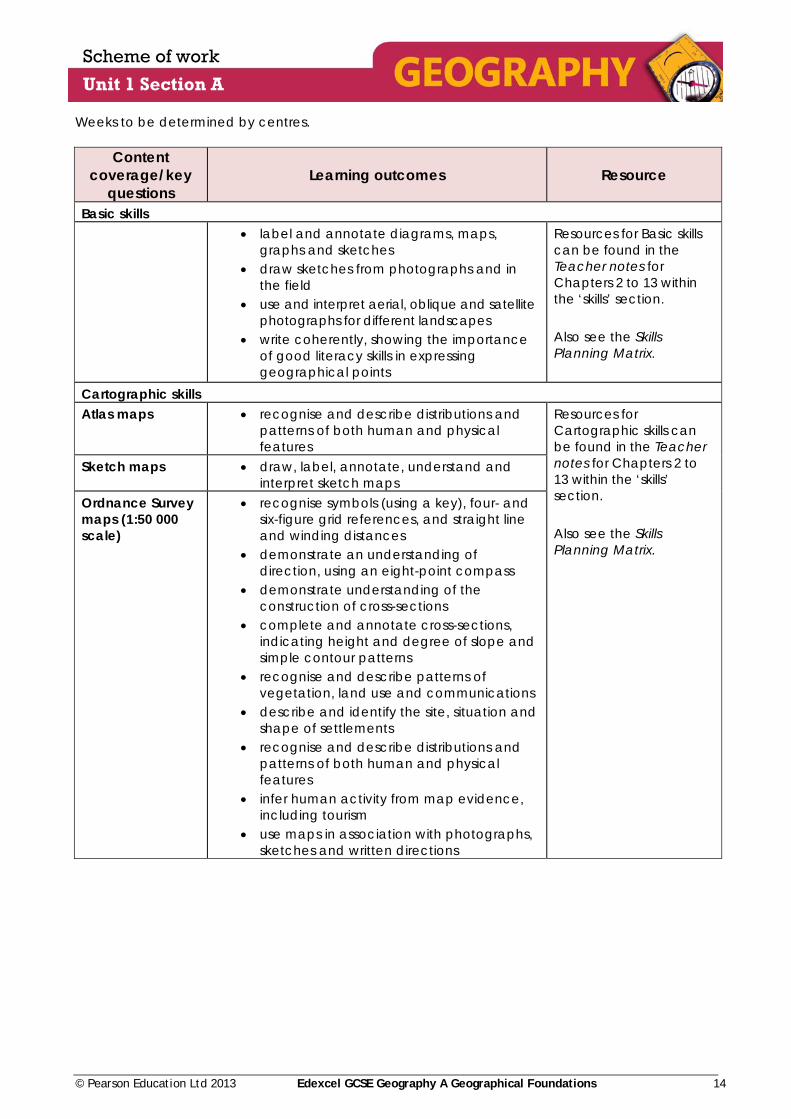
© Pearson Education Ltd 2013 Edexcel GCSE Geography A Geographical Foundations 14
Weeks to be determined by centres.
Content coverage/key
questions Learning outcomes Resource
Basic skills • label and annotate diagrams, maps,
graphs and sketches • draw sketches from photographs and in
the field • use and interpret aerial, oblique and satellite
photographs for different landscapes • write coherently, showing the importance
of good literacy skills in expressing geographical points
Resources for Basic skills can be found in the Teacher notes for Chapters 2 to 13 within the ‘skills’ section. Also see the Skills Planning Matrix.
Cartographic skills Atlas maps • recognise and describe distributions and
patterns of both human and physical features
Resources for Cartographic skills can be found in the Teacher notes for Chapters 2 to 13 within the ‘skills’ section. Also see the Skills Planning Matrix.
Sketch maps • draw, label, annotate, understand and interpret sketch maps
Ordnance Survey maps (1:50 000 scale)
• recognise symbols (using a key), four- and six-figure grid references, and straight line and winding distances
• demonstrate an understanding of direction, using an eight-point compass
• demonstrate understanding of the construction of cross-sections
• complete and annotate cross-sections, indicating height and degree of slope and simple contour patterns
• recognise and describe patterns of vegetation, land use and communications
• describe and identify the site, situation and shape of settlements
• recognise and describe distributions and patterns of both human and physical features
• infer human activity from map evidence, including tourism
• use maps in association with photographs, sketches and written directions

Scheme of work
Unit 1 Section A
© Pearson Education Ltd 2013 Edexcel GCSE Geography A Geographical Foundations 15
Graphical skills • construct and complete a variety of
graphs, charts and maps • interpret a variety of graphs, including
those located on maps and topological diagrams
Resources for Graphical skills can be found in the Teacher notes for Chapters 2 to 13 within the ‘skills’ section. Also see the Skills Planning Matrix.
Geographical enquiry skills • identify, analyse and evaluate geographical
questions, hypotheses and issues • establish appropriate sequences of
investigation and follow appropriate enquiry approaches
• extract and interpret information from a range of sources including field observations, maps, drawings, photographs, diagrams and tables and secondary sources
• describe, analyse and interpret evidence • draw and justify conclusions from evidence • evaluate methods of data collection,
presentation and analysis of evidence
Resources for Geographical enquiry skills can be found in the Teacher notes for Chapters 2 to 13 within the ‘skills’ section. Also see the Skills Planning Matrix.
ICT skills • collect and annotate photographs and
satellite images • use databases such as census and
population data • use the internet, e.g. to investigate case
studies of volcanic eruptions, floods • extract information from video and
television programmes • carry out data presentation and analysis
techniques • use spreadsheets and data-handling
software • research and present investigative work
Resources for ICT skills can be found in the Teacher notes for Chapters 2 to 13 within the ‘skills’ section. Also see the Skills Planning Matrix.
Geographical Information System (GIS) skills • capture and represent geographical
information in systems such as Aegis • use web mapping sites such as Google
Earth and Multimap.
Resources for Geographical Information System (GIS) skills can be found in the Teacher notes for Chapters 2 to 13 within the ‘skills’ section. Also see the Skills Planning Matrix.

Extension activities
Unit 1 Section A
© Pearson Education Ltd 2013 Edexcel GCSE Geography A Geographical Foundations 16
Chapter 1: Geographical skills Extension activity 1: Basic skills Support
1) Look at the figures above. (a) Fill in Box 1 with an annotation to:
(i) Describe the trend in the amount of ice melt in the last 25 years. (ii) Explain the trend (using your knowledge about climate change).
(b) Fill in Box 2 with a label to describe the changes in ice cover between 1990 and 2002. Use the 200 metres contour to help you add detail.
Stretch 2) Look at the photo below. (a) Using the boxes, complete the annotations so
that they explain why the location appears to be in a shanty town in a low-income country.
(b) Now draw a sketch from the photo, emphasising the key features by the use of annotations.
(c) The paragraph below is a student’s answer to the question ‘Describe the urban landscape shown in the photo.’ Make suggestions about how this answer could be improved. It is very poor with lots of bad buildings that are close to the river and with a lot of waste. There are loads of people about that suggest that it is full of unemployment. In the background there are higher buildings in the centre of the city.
Box 1
Box 2
No evidence of aerials or . . . Background buildings . . .
Urban decay obvious, with . . .
A great deal of waste . . .
Structures made of . . .
Extension activities
Unit 1 Section A
© Pearson Education Ltd 2013 Edexcel GCSE Geography A Geographical Foundations 17
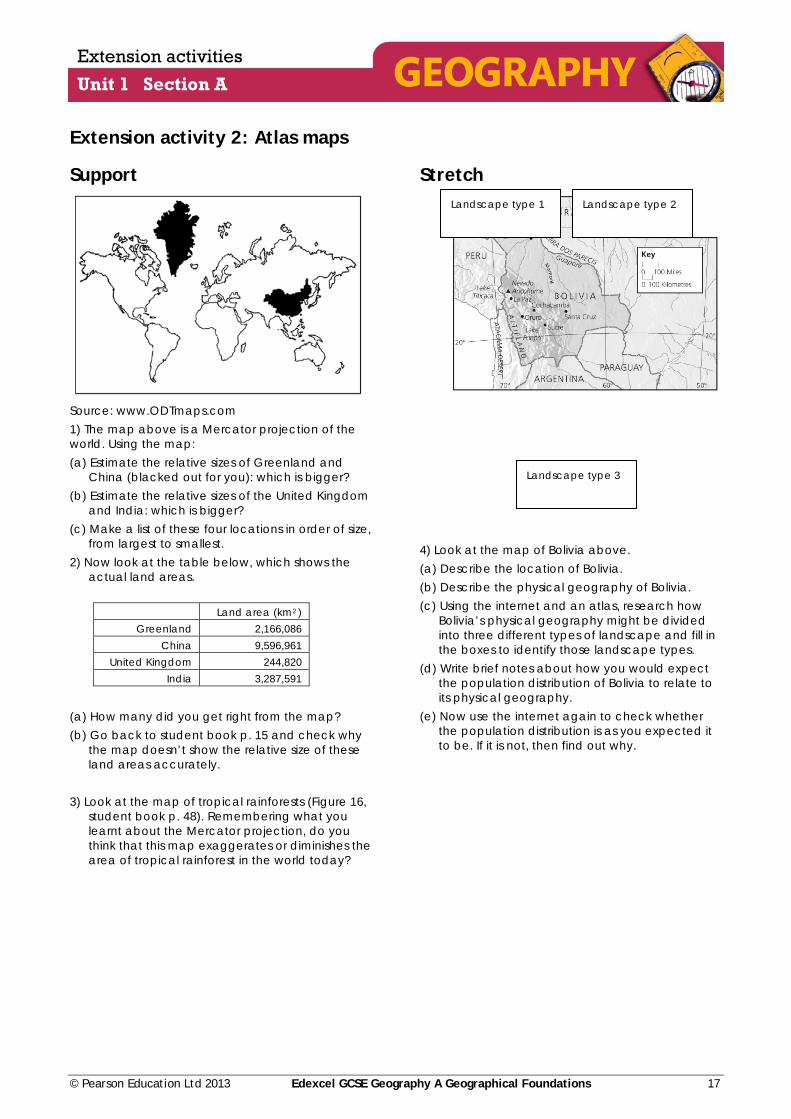
Extension activity 2: Atlas maps Support
Source: www.ODTmaps.com 1) The map above is a Mercator projection of the world. Using the map: (a) Estimate the relative sizes of Greenland and
China (blacked out for you): which is bigger? (b) Estimate the relative sizes of the United Kingdom
and India: which is bigger? (c) Make a list of these four locations in order of size,
from largest to smallest. 2) Now look at the table below, which shows the
actual land areas.
Land area (km2 ) Greenland 2,166,086
China 9,596,961 United Kingdom 244,820
India 3,287,591
(a) How many did you get right from the map? (b) Go back to student book p. 15 and check why
the map doesn’t show the relative size of these land areas accurately.
3) Look at the map of tropical rainforests (Figure 16,
student book p. 48). Remembering what you learnt about the Mercator projection, do you think that this map exaggerates or diminishes the area of tropical rainforest in the world today?
Stretch 4) Look at the map of Bolivia above. (a) Describe the location of Bolivia. (b) Describe the physical geography of Bolivia. (c) Using the internet and an atlas, research how
Bolivia’s physical geography might be divided into three different types of landscape and fill in the boxes to identify those landscape types.
(d) Write brief notes about how you would expect the population distribution of Bolivia to relate to its physical geography.
(e) Now use the internet again to check whether the population distribution is as you expected it to be. If it is not, then find out why.
Landscape type 1 Landscape type 2
Landscape type 3

Extension activities
Unit 1 Section A
© Pearson Education Ltd 2013 Edexcel GCSE Geography A Geographical Foundations 18
Extension activity 3: Sketch maps Support 1)(a) Draw a map showing your route to and from
school. Mark on it the key features that would allow the route to be followed, both to and from your home. Include a rough scale.
(b) Now, on your map, mark the places where it would be useful to have a photograph or sketch to show locations in more detail.
(c) Using Google Earth or your own resources, add these photographs or sketches to your map.
2) Take another look at Figure 12 (student book p. 40).
(a) Draw a sketch map to show the growth of Las Vegas between 1972 and 2000. You should devise a key to show: • Las Vegas as it was in 1972. • Growth since 1972.
Stretch 3)(a) Using the map extract (Figure 6, student book
p. 17), draw a sketch map of the route by car from Budleigh Salterton to Sidmouth.
(b) Annotate your sketch map with details of key points that a driver should pay attention to.
(c) Mark rough distances and times on the map, assuming the driver travels at an average speed of 45 km/h.
(d) By using the OS website, http://getamap.ordnancesurvey.co.uk/getamap/frames.htm, add written notes to your sketch map about how to find the hospitals in both towns.
4)(a) Draw a quick sketch map of Newton Poppleford (0789 and 0889) to show: • The nature of its site • Its shape.
(b) Annotate your sketch map to describe its site and shape.

Extension activities
Unit 1 Section A
© Pearson Education Ltd 2013 Edexcel GCSE Geography A Geographical Foundations 19
Extension activity 4: Ordnance Survey maps Support 1) Look at Figure 6 (student book p. 17) and identify
the features found at the following locations: (a) 066849 (b) 065895 (c) 055900. 2) If you landed by parachute at the following
locations what would your immediate surroundings be like? Describe them in one sentence.
(a) 106863 (b) 066863 (c) 125895. 3) You are out in a dinghy at 110830. Give the
compass point direction of the following points; (a) The IRB station at Sidmouth (128872) (b) Otterton Ledge (077817) (c) Smallstones Point (097848). 4) Describe the following: (a) The land use in grid square 1087. (b) The relief in grid square 1087. (c) The relationship between the relief and the land
use in grid square 1087. 5) You are walking due east, cross country, from
080890 to 100890. (a) How far do you walk? (b) How many roads and tracks do you have to
cross? (c) What obstacle do you have to negotiate, after
walking about 750 metres? (d) At what height does your journey start and at
what height does it finish? 6)(a) Match the symbols opposite to the definitions
below 1. An area of coniferous wood 2. A footpath/right of way 3. A bridge 4. A railway line 5. A post office 6. A chapel/church 7. A church with a spire 8. A school 9. A public house 10. A small (unadopted) road 11. A deciduous wood 12. A church with a tower
(b)Find each of these symbols on the OS map on
page 17 of your student book.
Stretch 6) In the box below draw a sketch section across
the River Otter valley from 080890 to 100890. (Do not worry about getting this exactly right, but try to show the differences in relief.)
7) Annotate your sketch section to show: (a) The position of the river (b) A concave slope (c) A hill-top (d) The two minor roads. 8) Describe the differences between Newton
Poppleford and Tipton St John in terms of: (a) Site (b) Situation, (Budleigh Salterton and Sidmouth). (c) Shape. 9) Using the OS map extract only (figure 6, student
book p. 17), identify four coastal features that you would see travelling along the coast from Budleigh Salterton to Sidmouth.
10) Draw a sketch map to show the location of these features along the coast.
11) Now, using Google Earth, check whether you have correctly identified these features and answer the following questions:
(a) What colour are the cliffs at Sidmouth? (b) What material is found on Ladram Bay beach? (c) What coastal feature – not found on the map –
is located in Ladram Bay?

Extension activities
Unit 1 Section A
© Pearson Education Ltd 2013 Edexcel GCSE Geography A Geographical Foundations 20
Extension activity 5: Graphical skills Support 1) Look at the table below, which shows the
predicted percentage change in agricultural output, as a result of climate change, between 2000 and 2080.
Global region % change
2000–2080 Africa –17
Latin America –13 Middle East & North Africa –9
Asia –7 HICs +7
Draw a graph showing this data.
2. Now look at the data below, showing the percentage contribution of various human activities to the emission of greenhouse gases.
Activity % contribution
Agriculture 13 Fossil fuel, mining and distribution 11
Land use and biomass burning 10 Waste & waste water 4
Energy supply 21 Transport 14
Residential/commercial buildings 10
(a) Draw a pie chart to display this data. (b) State two categories that are likely to be much
more significant in HICs. (c) Justify your answer to (b). Stretch 3) Look at the figure below, which shows methane
concentrations (in parts per billion – ppb) in the atmosphere.
© David Etheridge (CISRO) ‘Comparison of atmospheric methane concentrations in air from Antarctic and Greenland ice cores.’
(a) Describe the changes in methane emissions
shown. (b) Using Figure 3 (student book p. 32), identify
possible causes for the trend that you have described in (a).
4) Look at the data below, showing the percentage of the population in specific age groups for Sidmouth (Devon) and for Devon as a whole.
Age group Sidmouth Devon 0–4 3 5 5–9 4 6 10–15 5 7 16–24 7 10 25–44 17 25 45–64 26 27 65–74 16 10 75 and over 22 10
(a) Draw up either a graph or a pie chart to display
these two groups of data to allow comparison. (b) Identify the main contrasts between the
population structure of Sidmouth and that of the Devon population as a whole.
5) Look at the figure below, which shows changes in Sidmouth house prices in recent years. (Average prices for each year are shown at its midpoint.)
Data originating from HM Land Registry records is reproduced with the permission of HM Land Registry under delegated authority from the Controller of HMSO.
(a) Calculate the change in average prices between 2001 and 2007.
(b) Describe the trend in house prices over the period shown.

Extension activities
Unit 1 Section A
© Pearson Education Ltd 2013 Edexcel GCSE Geography A Geographical Foundations 21
Extension activity 6: ICT skills Support 1)(a) Use the internet to collect information about
the loss of ice from the Greenland ice-sheet (see Extension activity 1).
(b) Download satellite images of the Greenland ice sheet from http://earthobservatory.nasa.gov/Search/index.php?a=greenland&g=0 .
(c) Download photographs about ice loss from the sites above or by using the internet to research images of ice loss in Greenland.
(d) Add your photographs to your satellite images and annotate them, using text boxes to explain the links between the photographs and the satellite images.
2) Look at the census information for your local area by using http://neighbourhood.statistics.gov.uk Type in your local area and try to find out:
(a) The percentage of the population who state their religion as Hindu
(b) The percentage of the population who own their properties outright.
Stretch 3) Look at the following data, which is about the
employment structure of Sidmouth, compared with the whole of England.
Employment type Sidmouth England Agriculture, hunting, forestry 2.9 1.5 Fishing 0.1 0.0 Mining and quarrying 0.1 0.2 Manufacturing 6.9 14.8 Electricity/gas/water supplies 0.7 0.7 Construction 9.6 6.8 Wholesale and retail trade 17.1 16.9 Hotels and catering 12.1 4.7 Transport, storage and communication
5.2 7.1
Financial services 2.4 4.8 Real estate, renting and business activities
10.8 13.2
Public admin. and defence 5.2 5.7 Education 7.4 7.7 Health and social work 12.5 10.7 Other 7.0 5.2
(a) Identify three ways of showing the information to
allow an effective comparison of the Sidmouth and England data.
(b) Using the internet, establish a research programme to investigate why Sidmouth’s employment structure is different from that of England.
(c) Extract information from the photograph below
that helps to explain the differences in the employment structures of Sidmouth and England.
Sidmouth

Extension activities
Unit 1 Section A
© Pearson Education Ltd 2013 Edexcel GCSE Geography A Geographical Foundations 22
Extension activity 7: GIS skills Support
1) Access an image of Sidmouth and its surrounding area, using Google Earth.
(a) You are advising friends where to stay within a few minutes of Sidmouth – identify three possible hotels or guest houses.
(b) Your friends need directions to a cliff-top campsite at Ladram Bay. Using Google Earth and the OS site www.ordanancesurvey.co.uk produce an annotated map to show the location of the campsite and the best route to reach it from the A375.
2) Look at the photograph below. Using Google Earth and www.ordanancesurvey.co.uk
(a) Identify the settlement shown. (b) Give a grid reference for the location at which
the photograph was taken. (c) Annotate the photograph to identify two of the
buildings shown.
Stretch
3) Use Google Earth to describe the pattern of land use in grid square 0883 (Figure 6, student book p. 17).
4) Use Google Earth to capture separate images of Budleigh Salterton and Sidmouth. Then annotate each of the images to show the location of:
(a) the hospital (b) a church with a spire (c) a museum (d) the Tourist Information Centre. 5) Using www.imd.communities.gov.uk, download
and capture maps of the multiple deprivation data for both Sidmouth and Budleigh Salterton. Then, for each settlement, produce an annotated Google image with the data.

Answers
Unit 1 Section A
© Pearson Education Ltd 2013 Edexcel GCSE Geography A Geographical Foundations 23
Chapter 1: Answers Extension activities 1. Basic skills Support 1)(a) (i) The trend is rising from about 4.5 to just over 5 of ice melt. It has risen and fallen quite sharply over the period with a two year cycle. (ii) Increased greenhouse gas emissions by man is the most obvious cause of rising temperatures and thus increased ice melt. (b) Ice melt in 1992 was largely in the south of Greenland. By 2002 the north was also affected with areas in both north-east and south-west showing melting above the 2000m contour Stretch 2) (a) Structures made of cheap recovered materials suggesting poor housing conditions. No evidence of aerials, satellite dishes, electricity or telephone cables suggesting low incomes and a lack of connectedness. This is also a sign of poverty Background buildings are flats/office buildings that are typically located near the centre of LIC cities Urban decay obvious with the amount of waste material and poor quality of the built environment as well as the high density of the buildings A great deal of waste is visible which suggests a weak urban infrastructure and poverty (b) Sketches should show the main features of the photograph and use the annotations on the photograph to explain the same features. Sketches should concentrate on those aspects of the landscape that make the point. (c) Signs of poverty include the poor quality of the buildings built from corrugated metal, their high density, lack of a communications infrastructure and the amount of visible waste, which probably pollutes the river. The flats/offices in the background suggest this shanty town is close to the city centre 2. Atlas maps Support 1) and 2) This exercise is about the distortion to size that this type of (Mercator) projection gives. In the example given the distortion is exacerbated by the fact that Antarctica has been left off the map completely and thus the equator runs across the map about 2/3rds of the way down. The Northern Hemisphere dominates and the map is ‘centred’ on Europe – a Eurocentric view. It can be compared with many other projections including ‘upside-down’ views of the world 3) It diminishes it for the same reasons as discussed before – the rainforest is largely equatorial. For example the Amazon rainforest is about 5.5 million km2 which makes it 2.5 times the size of Greenland and 22 times the size of the UK. It doesn’t appear so on the map.
Stretch 4) (a) Bolivia is a landlocked country between about 70o and 55o West and 10o to 25o South. It has borders with Brazil, Paraguay, Chile and Peru. (b) High mountains (Andes), a high plateau area (the Altiplano), an interior plain. (c) Type 1 – The eastern interior plain – a rainforest region with many rivers (including headwaters of the Amazon system). Type 2 – The Andean chain divided into two mountainous areas separated by the Altiplano. There is permanent ice on the highest peaks, some of which are volcanic. Type 3 – The Altiplano is a high plateau: over 3,000 metres. It is very dry with few rivers but many salt lakes as well as Lake Titicaca, all that is left of a once enormous Andean lake. (d) Many students are used to relating population density to altitude with density declining with height. It is worth reminding them that Bolivia is located close to the equator. (e) The interior rainforest region is very lightly populated as are the highest mountain areas. The Altiplano is where the vast majority of Bolivians live with densities highest around the major cities of La Paz and Cochabamba. 3. Sketch maps Support 1) (a, b and c) Check that each student’s map is fit for purpose. You could do this by getting them to work in pairs to evaluate each other’s instructions. 2) Check that the key devised is suitable and that it has been used effectively to clearly show the growth of Las Vegas between 1972 and 2000. Stretch 3) (a to d) Check that sketch is accurate, contains key points, the timings and distances are correct and that the directions to the hospital are right. 4) (a and b) Check the sketch accurately shows the nature of the site and its shape, compare with SB p. 17. Confirm annotations match the sketch. 4. Ordnance Survey maps Support 1) (a) church with tower (b) a main road (c) a triangulation point 2) (a) on the beach/under the cliff 2km west of Sidmouth (b) in the parkland of Bicton College of Agriculture (c) in open ground surrounded by the suburban housing of Sidmouth 3) (a) 24o (b) 247o (c) 322o 4) (a) Mixed, some patches of coniferous woodland to both east and west – otherwise open ground. One narrow road and some tracks and footpaths. (b) Generally steep slopes of a north-south trending river valley rising from about 110 metres to over 190 metres. Gradients are around 1 in 10 (80 metres up for about 800 metres along). (c) The very steep slopes in the north-west corner are occupied by woodland but elsewhere there is a mixture of open ground and woodland. The open-
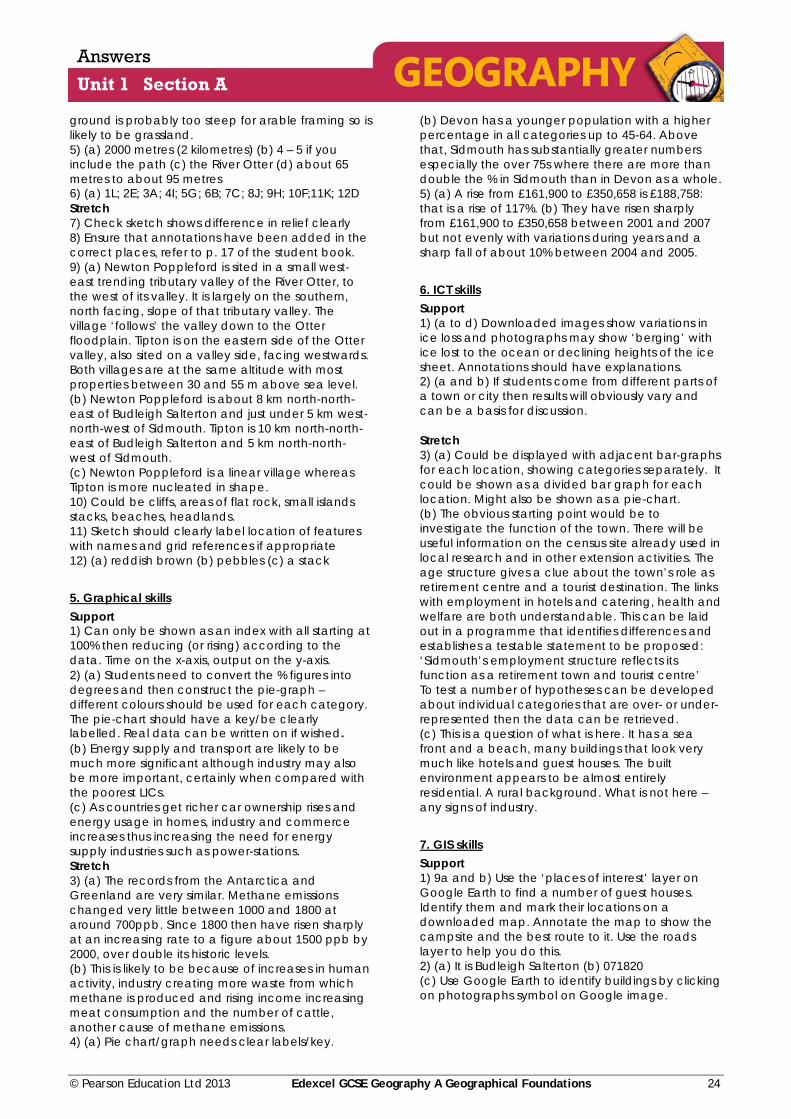
Answers
Unit 1 Section A
© Pearson Education Ltd 2013 Edexcel GCSE Geography A Geographical Foundations 24
ground is probably too steep for arable framing so is likely to be grassland. 5) (a) 2000 metres (2 kilometres) (b) 4 – 5 if you include the path (c) the River Otter (d) about 65 metres to about 95 metres 6) (a) 1L; 2E; 3A; 4I; 5G; 6B; 7C; 8J; 9H; 10F;11K; 12D Stretch 7) Check sketch shows difference in relief clearly 8) Ensure that annotations have been added in the correct places, refer to p. 17 of the student book. 9) (a) Newton Poppleford is sited in a small west-east trending tributary valley of the River Otter, to the west of its valley. It is largely on the southern, north facing, slope of that tributary valley. The village ‘follows’ the valley down to the Otter floodplain. Tipton is on the eastern side of the Otter valley, also sited on a valley side, facing westwards. Both villages are at the same altitude with most properties between 30 and 55 m above sea level. (b) Newton Poppleford is about 8 km north-north-east of Budleigh Salterton and just under 5 km west-north-west of Sidmouth. Tipton is 10 km north-north-east of Budleigh Salterton and 5 km north-north-west of Sidmouth. (c) Newton Poppleford is a linear village whereas Tipton is more nucleated in shape. 10) Could be cliffs, areas of flat rock, small islands stacks, beaches, headlands. 11) Sketch should clearly label location of features with names and grid references if appropriate 12) (a) reddish brown (b) pebbles (c) a stack 5. Graphical skills Support 1) Can only be shown as an index with all starting at 100% then reducing (or rising) according to the data. Time on the x-axis, output on the y-axis. 2) (a) Students need to convert the % figures into degrees and then construct the pie-graph – different colours should be used for each category. The pie-chart should have a key/be clearly labelled. Real data can be written on if wished. (b) Energy supply and transport are likely to be much more significant although industry may also be more important, certainly when compared with the poorest LICs. (c) As countries get richer car ownership rises and energy usage in homes, industry and commerce increases thus increasing the need for energy supply industries such as power-stations. Stretch 3) (a) The records from the Antarctica and Greenland are very similar. Methane emissions changed very little between 1000 and 1800 at around 700ppb. Since 1800 then have risen sharply at an increasing rate to a figure about 1500 ppb by 2000, over double its historic levels. (b) This is likely to be because of increases in human activity, industry creating more waste from which methane is produced and rising income increasing meat consumption and the number of cattle, another cause of methane emissions. 4) (a) Pie chart/graph needs clear labels/key.
(b) Devon has a younger population with a higher percentage in all categories up to 45-64. Above that, Sidmouth has substantially greater numbers especially the over 75s where there are more than double the % in Sidmouth than in Devon as a whole. 5) (a) A rise from £161,900 to £350,658 is £188,758: that is a rise of 117%. (b) They have risen sharply from £161,900 to £350,658 between 2001 and 2007 but not evenly with variations during years and a sharp fall of about 10% between 2004 and 2005. 6. ICT skills Support 1) (a to d) Downloaded images show variations in ice loss and photographs may show ‘berging’ with ice lost to the ocean or declining heights of the ice sheet. Annotations should have explanations. 2) (a and b) If students come from different parts of a town or city then results will obviously vary and can be a basis for discussion. Stretch 3) (a) Could be displayed with adjacent bar-graphs for each location, showing categories separately. It could be shown as a divided bar graph for each location. Might also be shown as a pie-chart. (b) The obvious starting point would be to investigate the function of the town. There will be useful information on the census site already used in local research and in other extension activities. The age structure gives a clue about the town’s role as retirement centre and a tourist destination. The links with employment in hotels and catering, health and welfare are both understandable. This can be laid out in a programme that identifies differences and establishes a testable statement to be proposed: ‘Sidmouth’s employment structure reflects its function as a retirement town and tourist centre’ To test a number of hypotheses can be developed about individual categories that are over- or under- represented then the data can be retrieved. (c) This is a question of what is here. It has a sea front and a beach, many buildings that look very much like hotels and guest houses. The built environment appears to be almost entirely residential. A rural background. What is not here – any signs of industry. 7. GIS skills Support 1) 9a and b) Use the ‘places of interest’ layer on Google Earth to find a number of guest houses. Identify them and mark their locations on a downloaded map. Annotate the map to show the campsite and the best route to it. Use the roads layer to help you do this. 2) (a) It is Budleigh Salterton (b) 071820 (c) Use Google Earth to identify buildings by clicking on photographs symbol on Google image.

Answers
Unit 1 Section A
© Pearson Education Ltd 2013 Edexcel GCSE Geography A Geographical Foundations 25
Stretch 3) This is mostly arable land. Many fields show signs of planting with straight lines aad tractor furrows. However the odd pattern in some fields and what appear to be bales turn out, on closer inspection, to be pig-pens – the pigs are visible! Some of the fields are under grass. There are two small patches of mixed woodland. To the south-east the cliff top is visible. Students might find the 3D effect useful when reading the landscape. 4) Use the appropriate layers to find the information. 5) Click on the map – south-west – or select it from the ‘search by region facility’. Select east Devon, this will generate a map of the area. Click on the map on Sidmouth and navigate to locate Budleigh Salterton. Use the ‘zoom in’ facility to generate maps of the town divided into different ‘super output areas’. The darker the colour the more deprived the areas are. The information is also contained in the tables located below the maps.