Embed Size (px)
Citation preview

Strictly Private and Confidential
Edelweiss Financial Services Limited
Annual Investor Presentation – May 2014

Focused on Long Term Value Creation
Quality Businesses
Corporate Overview
Driving Non Linear Growth
2
Contents

Focused on Long Term Value Creation
Quality Businesses
Corporate Overview
Driving Non Linear Growth
3
Contents

Another Year of Non-Linear Growth
(INR cr) FY12 FY13 FY14
PAT 128 178 220
PAT Ex-Insurance 141 226 272
Balance Sheet Size* 12,986 14,224 16,043
*EOP numbers
23%
YoY Growth
20%
13%
4
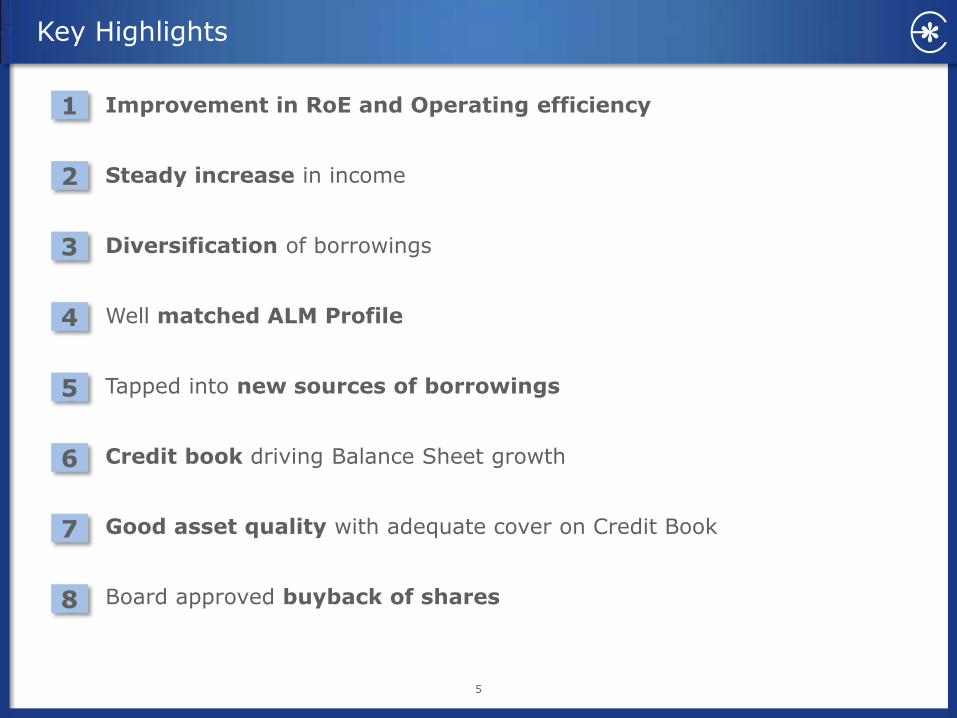
Key Highlights
5
Improvement in RoE and Operating efficiency
Steady increase in income
Diversification of borrowings
Well matched ALM Profile
Tapped into new sources of borrowings
Credit book driving Balance Sheet growth
Good asset quality with adequate cover on Credit Book
Board approved buyback of shares
1
2
3
4
5
6
7
8

Improvement in RoE and Operating Efficiency
72%
67%
64%
FY12 FY13 FY14
Reducing Cost to Income Ratio
(Ex-Insurance )
7.0%
11.3% 12.3%
FY12 FY13 FY14
Improved Tangible RoE (Ex-Insurance )
1
6 Cost to Income Ratio = Opex/(Revenue – Interest Cost)

Steady Increase in Net Fund Based Income
7
(INR cr)
FY12 FY13 FY14
Net Fund Based Income 509 699 883
As % of Total Assets 3.9% 4.9% 5.5%
2
Notes: Net Fund Based Income = Fund Based Revenue – Financing Costs

Stronger Balance Sheet: Diversified Sources of Borrowings
8
Debt Market
Bank
ASB
Retail
Others
FY11 FY14
Number of lenders have increased manifold
50%
26%
14%
5%
34%
15%
13%
3%
Total Borrowings
INR 7,858 cr INR 12,948 cr
35%
5%
3

9
% o
f A
ssets
an
d L
iab
ilit
ies
Positive ALM ALCO manages and monitors ALM, Interest Rate Risk and Liquidity
13%
38%
48%
62%
79%
100%
13%
36%
46%
59%
76%
100%
ASB 0-3 Mnth 3-6 Mnth 6-12 Mnth 1-3 years 3+ years
Assets Liabilities
March’14 - INR 16,043 cr
Notes: ASB – Asset Specific Borrowing
Stronger Balance Sheet: Well Matched ALM Profile 4

Stronger Balance Sheet: Successfully Tapped Into New Sources of Borrowings & Improved Long Term Rating
10
• Added Tier II capital of INR 77 Cr in form of preference shares to boost networth
Preference Shares
• Issued INR 500 cr of Retail Bonds to strengthen Balance Sheet and reduce dependence on short term borrowing
• Issue was subscribed 2X within 2 days
Retail Bond Issue
• Securitized INR 150 Cr of Mortgage and SME lending portfolio
Securitization
• Long Term rating notched up to AA Rating
Improvement
• NHB re-finance sanctioned NHB
Re-Finance
5
11
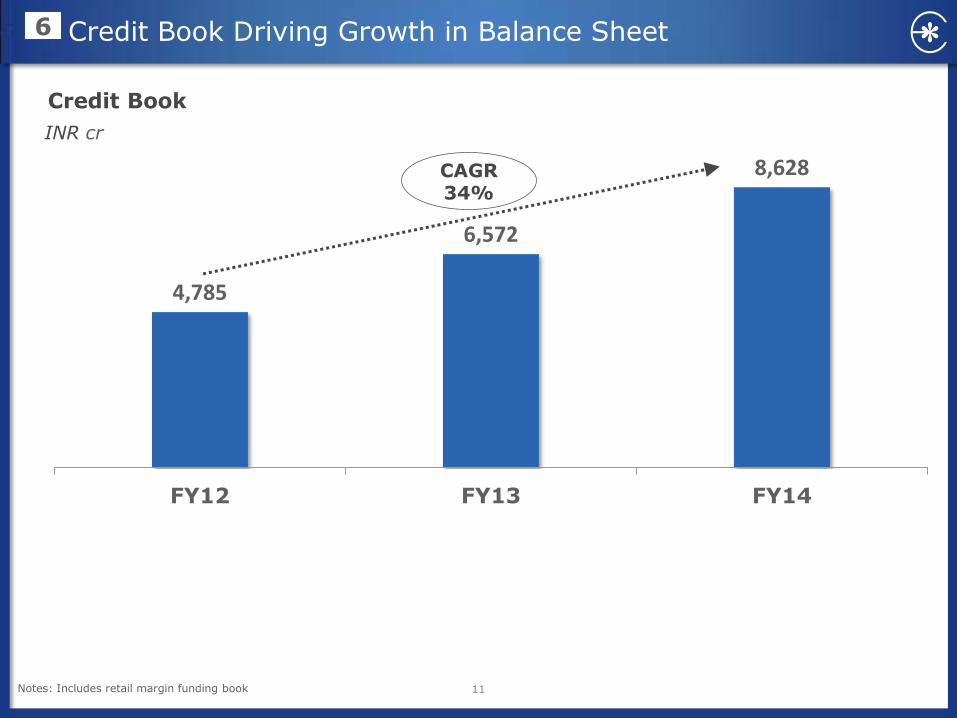
Credit Book Driving Growth in Balance Sheet
4,785
6,572
8,628
FY12 FY13 FY14
CAGR 34%
INR cr
6
Credit Book
Notes: Includes retail margin funding book

Good asset quality and cover on Credit book 7
12
(INR cr) FY12 FY13 FY14
Asset Quality
Total Loans1 4,785 6,572 8,628
Gross GNPLs 23 28 82
Net NPLs 7 7 21
Gross GNPLs 0.47% 0.43% 0.95%
Net NPLs 0.14% 0.11% 0.25%
Total Provision Held2 26 37 82
Total Provision Cover2 116% 131% 100%
Collateral Cover
Collateral Cover in Corporate Loans 2.6x 2.4x 2.6x
LTV% in Retail Finance ~55% ~56% ~55%
Notes: Numbers are Management Estimates 1 Includes retail margin funding book 2 Total Provision includes General Loan Loss Provision on Standard Assets

13
Board has approved buyback of shares which commenced on 5th May 2014
Price not exceeding INR 45/share
Current Market Price (NSE) ~INR 37.3 / share as on 16th May 2014
Continued Investor Distribution through Dividends and Buyback
60% 60%
65%
70%
FY11 FY12 FY13 FY14
Dividend payout %
Consistent dividend payout history
Approved buyback of INR 135 Cr
8

Focused on Long Term Value Creation
Quality Businesses
Corporate Overview
Driving Non Linear Growth
14
Contents
To be a respected Financial Services firm with a portfolio of high quality growth businesses
Our Strategy is:
15

Diversification led to a De-risked Model…
16
Life
Insurance
Small Ticket
Housing
loans
1996 - 2000
Corporate
Loans & Asset
Mgmt.
Housing Finance
Investment
Banking
Institutional
Equities
& Treasury
HNI Broking
SME
Finance
Precious Metals &
Debt Capital
Markets
Retail Capital
Markets
2005 - 2008 2008 - 2014
Retail Businesses
Wholesale Businesses

…Resulting in a More Stable Revenue Pool
17
Credit 15%
Financial Markets &
Asset Management
44%
Treasury 34%
Commodities 7%
FY08
Credit 44%
Financial Markets &
Asset Management
21%
Treasury 15%
Commodities 14%
Insurance 6%
FY14
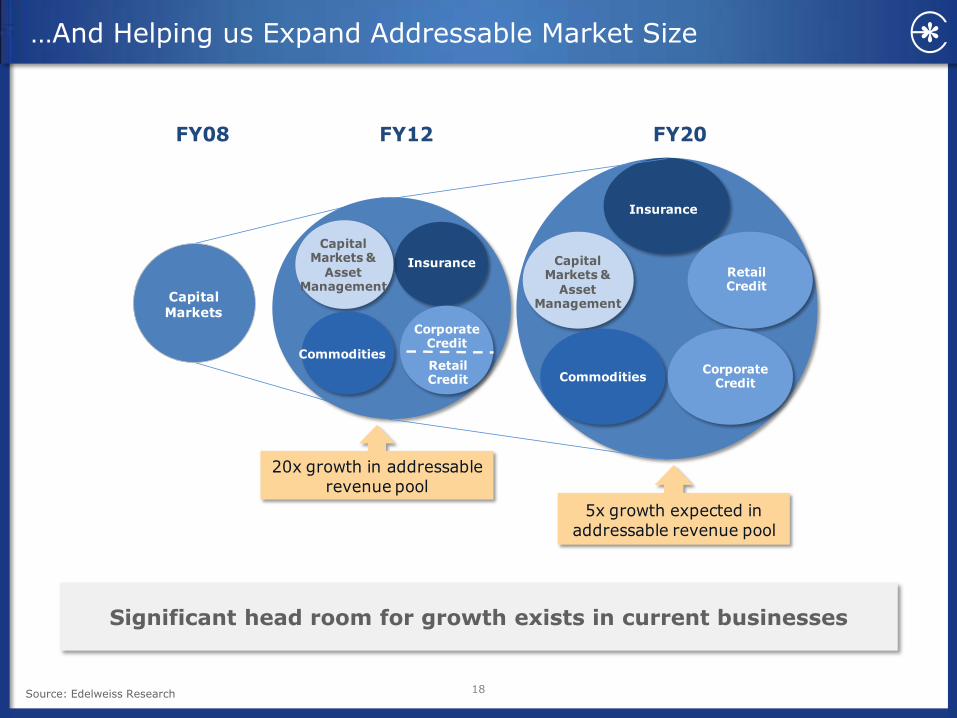
…And Helping us Expand Addressable Market Size
18 Source: Edelweiss Research
CapitalMarkets
FY08 FY12 FY20
Commodities
Capital Markets &
Asset Management
Insurance
CorporateCredit
RetailCredit
Capital Markets &
Asset Management
Insurance
Retail Credit
Corporate Credit
Commodities
20x growth in addressable revenue pool
5x growth expected in addressable revenue pool
Significant head room for growth exists in current businesses

19
Our Value Proposition is: Long Term Value Creation
Profitability
Scalability
Sustainability
Management Quality
Governance Long term Value Creation
Our long term value drivers
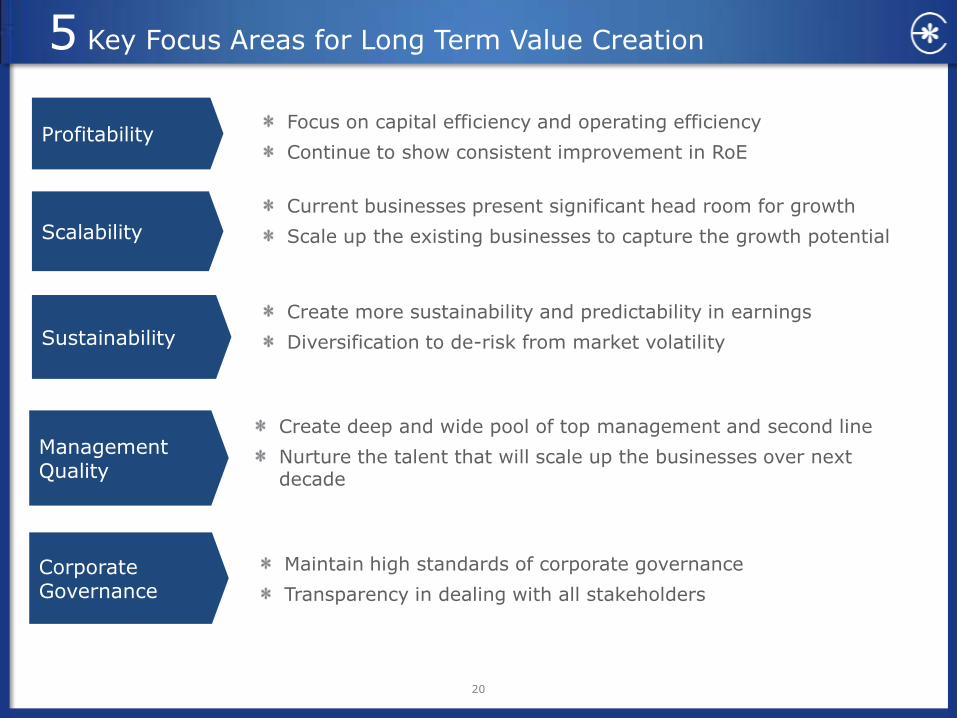
5 Key Focus Areas for Long Term Value Creation
20
Focus on capital efficiency and operating efficiency
Continue to show consistent improvement in RoE Profitability
Create more sustainability and predictability in earnings
Diversification to de-risk from market volatility Sustainability
Current businesses present significant head room for growth
Scale up the existing businesses to capture the growth potential Scalability
Create deep and wide pool of top management and second line
Nurture the talent that will scale up the businesses over next decade
Management Quality
Maintain high standards of corporate governance
Transparency in dealing with all stakeholders
Corporate Governance

Focused on Long Term Value Creation
Quality Businesses
Corporate Overview
Driving Non Linear Growth
21
Contents

22
Edelweiss Operating Structure – 5 Business Groups
Balance Sheet Management
Unit
• Liquidity management
• Capital preservation with optimum returns
Financial Markets
• Corporate Finance Advisory
• Broking & Wealth Management
Strong franchise
across product spectrum
Commodities
• Agri Commodities
• Precious Metals
• Agri Services
• Credit & Distribution
Bringing efficiency to commodities
Asset Management Credit
Corporate Collateral Based
Lending & Advisory
Retail Housing Finance
SME Finance Rural Finance
Customer centric credit
solutions
Life Insurance
• JV with Tokio Marine
• Proprietary need based selling approach
New age player with no legacy
issues
• Asset Reconstruction
• Mutual Funds
• Offshore Funds
• Alternative Asset Management
Differentiated offerings and top quartile performance

Business Groups – FY14 Financial Snapshot
23
(INR cr) Revenue Profit Before
Tax
Tangible Networth1
Total Capital
Employed1
Pre-tax RoE
Pre-tax RoA
Credit 1,112 291 1,200 7,905 24% 3.7%
Financial Markets 464 30 211 1,362 14% 2.2%
Asset Management 60 15 243 719 6% 2.1%
Commodities 412 86 362 1,344 24% 6.4%
Balance Sheet Management Unit 344 41 253 2,981 16% 1.4%
Corporate & Unallocated2 -42 189 1,095 N/A N/A
Total - Ex Insurance 2,392 420 2,458 15,406 17% 2.7%
Insurance 164 -69 637 637 N/A N/A
Total 2,556 351 3,095 16,043 11% 2.2%
Notes: Numbers are Management Estimates 1 Does not include Goodwill and shares owned by employee trust 2 Investments in office building, Strategic Investments and Advance tax paid

24
CREDIT

Credit Opportunity in India
25
Source: Edelweiss Research, RBI
Bank and NBFC Credit INR’000 cr
Low penetration of Mortgage in India
Huge market for credit exists
Market has been growing at 15% p.a. even in tough market conditions
NBFCs have been growing faster than Banks in recent past
Quality risk management systems are a must before scaling up of books
Edelweiss has been investing in credit systems and gradually scaling up the books
1,885 2,318
2,729 3,196
3,878
4,531
5,164
211 279 318 381 496 620 744
2007 2008 2009 2010 2011 2012 2013
Banks NBFCs
8% 15%
32% 44% 45%
54%
76% 84%
Mort
gages a
s %
of G
DP

Collateralized Lending
Debt Capital Markets
Real Estate Finance
Construction Finance
26
Present across Retail, SME and Corporate Segments
Secured SME Finance
Unsecured SME Finance
Client Segments
Product Suite
Housing Finance
Loan against Property
Small Ticket Housing Loans
Rural Finance
Public Issue Finance
Corporate
SME
Retail

27
Strengths & Key Parameters
Key Parameters
Book Size (INR cr)
FY12 FY13 FY14
Corporate Loans
3,626 4,437 5,815
Retail Finance 776 1,627 2,089
Business Strengths
• Ability to understand client needs and structure products to suit their needs
• Strong client relations
Client Centric Solutions
• Three tier risk management approach – Business risk team supplemented by Global risk team & Global Risk Committee
• Robust underwriting and credit appraisal processes
Proactive Risk
Management
• NPAs in check even in tough market conditions
• Comfortable asset cover
Good Asset Quality

28

Commodities Opportunity in India
29
67 95
136
185
269 292
2008 2009 2010 2011 2012 2013
Bullion
Bullion Imports INR’000 cr
India is a large producer and importer/exporter of Agri Commodities
Commodities is an unorganized business with huge scope of bringing efficiencies
Farmers and Agri value chain can benefit greatly from entry of organized players
Agri imports and exports have been growing at more than 24% CAGR
INR’000 cr Agri Exports1 & Imports2 in India
64 68 68
89
149
184
20 26 46 43
61
83
2008 2009 2010 2011 2012 2013
Exports Imports
1. Agri Exports includes tea, coffee, rice, wheat, cotton, tobacco, fruits and vegetables, oil meals, agriculture and allied products & sugar 2. Agri imports includes edible oil, pulses, sugar, cashew nuts and cereals & cereal preparations Source: Edelweiss Research, RBI, FMC

30
Strengths
Wide spread network
• Network of intermediaries, presence in sourcing locations, mandi access, working with key warehousing service providers
• Diverse sourcing capabilities with a wide reach across domestic and international locations
Strong Risk Management
Practices
• Focus on operational risk management
• Price risk minimized through hedging
• Business risk team supported by Global Risk team overseen by Global Risk Committee
Robust Backend
• Significant investment in technology
• Robust back-office and mid-office to handle multiple types of contracts and commodities across geographies

31
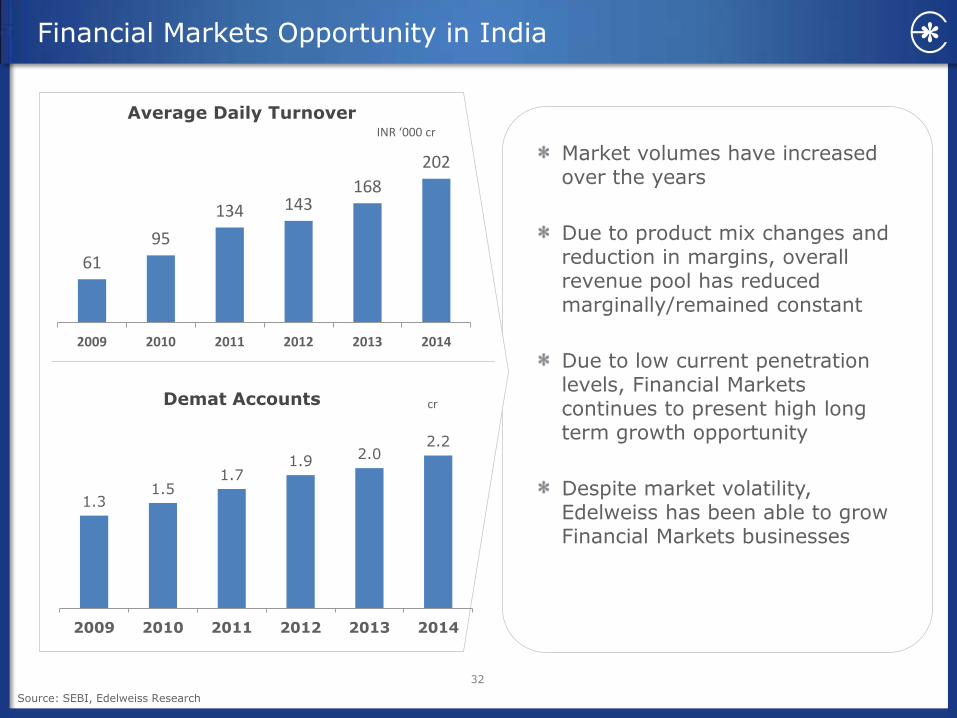
Financial Markets Opportunity in India
32
Market volumes have increased over the years
Due to product mix changes and reduction in margins, overall revenue pool has reduced marginally/remained constant
Due to low current penetration levels, Financial Markets continues to present high long term growth opportunity
Despite market volatility, Edelweiss has been able to grow Financial Markets businesses
Average Daily Turnover
61
95
134 143 168
202
2009 2010 2011 2012 2013 2014
INR ‘000 cr
Demat Accounts
1.3 1.5
1.7 1.9 2.0
2.2
2009 2010 2011 2012 2013 2014
cr
Source: SEBI, Edelweiss Research

Product Suite to Cater to All Client Segments
33
Institutional Equities
Corporate Finance Advisory
Prime Broking
Custody
Insurance Advisory
Wealth Management
HNI Broking
Financial Markets
Retail Broking
Financial Planning
Financial Product Distribution
Client Segments
Corporates Institutions
HNIs
Retail

34
Strengths & Key Parameters
Business Strengths
• Deep understanding of client needs
• Strong client relations built and maintained over the years
Client Centric Approach
• Known for differentiated product offerings across Broking & other platforms
• Pioneers in India in Algo Trading, Derivatives , Structured Products etc
Cutting Edge Products
• Best in class execution platforms with strong technology backend
• Established a cost efficient structure
Execution Efficiencies
Key Parameters
FY12 FY13 FY14
IB deals* 40 46 61
Retail Capital Market clients (lac)
3.8 4.1 4.3
Wealth AUAs (INR cr)
3,000 3,200 4,800
* Includes DCM deals

35
ASSET MANAGEMENT

Asset Management Opportunity in India
36
Recent sluggishness in Asset Management Business due to poor equity market returns and changes in operating environment
Overall long term potential continues to be very high due to
Low penetration of asset management in India
Expected increase in investment surplus of individuals
Edelweiss has focused on differentiating itself through its unique product offerings and top quartile fund performance
Mutual Funds AUM
419
615 597 588
701
825
2009 2010 2011 2012 2013 2014
INR ‘000 cr
Source: AMFI, Press searches; Karvy Wealth Report
India Individual Wealth
7,308 8,650
9,226
10,986
FY10 FY11 FY12 FY13
INR ‘000 Cr
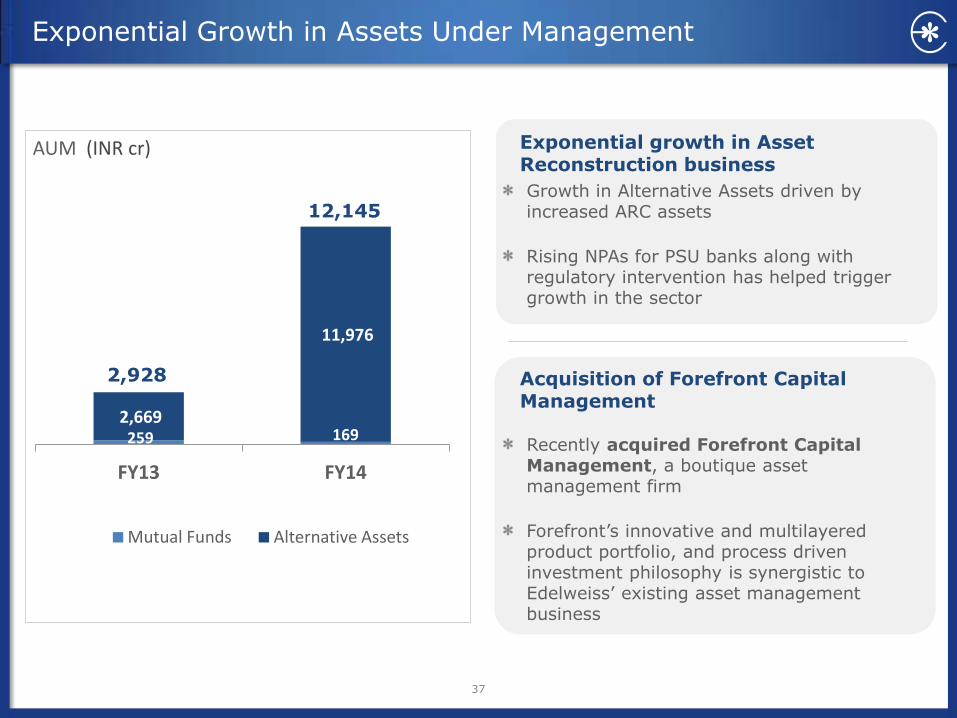
Exponential Growth in Assets Under Management
Growth in Alternative Assets driven by increased ARC assets
Rising NPAs for PSU banks along with regulatory intervention has helped trigger growth in the sector
Recently acquired Forefront Capital Management, a boutique asset management firm
Forefront’s innovative and multilayered product portfolio, and process driven investment philosophy is synergistic to Edelweiss’ existing asset management business
Exponential growth in Asset Reconstruction business
Acquisition of Forefront Capital Management
259 169 2,669
11,976
FY13 FY14
Mutual Funds Alternative Assets
AUM (INR cr)
2,928
12,145
37

38
Strengths
• Fund performance consistently ranked in top quartile
• Leading Asset Reconstruction Company in the country
Top Quartile Fund
Performance
• Known for differentiated product offerings across MF and Alternative Assets
• ARC to help unlock productive assets and assist Banks
Differentiated offerings
• Robust and lean execution platforms with strong technology backend
Cost-Efficient

39
LIFE INSURANCE

40
Life Insurance Opportunity in India
4
11 12 11 12
18
India Japan S Korea UK Hongkong Taiwan
Low Penetration*
-
400
800
1,200
1,600
FY02 FY08 FY09 FY10 FY11 FY12 FY13 FY14
Rapid Premium Growth INR bn
18% CAGR
Life
Insu
ran
ce N
ew B
usi
nes
s p
rem
ium
Li
fe in
sura
nce
pre
miu
ms
as %
of
GD
P
* Insurance penetration is measured as ratio of premium (USD) to GDP (USD) Source: Edelweiss Research, Swiss Re, IRDA
Life Insurance in India is a sizable
opportunity space in financial services
~16% of household savings flow into life insurance, second only to banking
Life Insurance sector going through major shifts due to regulatory changes
Current shifts present unique discontinuities and opportunity for a new player to enter Life Insurance
Edelweiss tied up with one of the biggest Insurers worldwide – Tokio Marine to offer Life Insurance in India

41
Strengths & Key Parameters
Business Strengths
• “Need Based Sales” approach
• Comprehensive product portfolio – across 6 needs and product platforms
• Top decile performance for all ULIP schemes since inception
Customer Focused Approach
• Branch productivity of vintage1 branches ahead of private sector average
• Agent productivity close to that of leading private sector leaders
Productive Sales Force
• Core team in place both at Head office and at Regional sales offices
• One of the few new age2 non Bank led Insurance firms to have a Bancassurance tie-up
Built on a Strong
Foundation
Key Parameters
(INR cr) FY12 FY13 FY14
Total Income 53 101 169
Premium Income
11 55 111
Investment Income
42 46 58
Policies issued 6,600 23,000 33,000
Branches 29 45 58
PFAs 825 3,401 7,255
Employees 659 1,275 1,400
Individual Products
7 15 18
Notes: 1. At least 2 years old 2. Started after 2005

42
BALANCE SHEET MANAGEMENT UNIT

Balance Sheet Management Unit continues to be a function of:
Capital requirement of businesses
Opportunities in the markets
Liquidity management needs; Maintain a liquidity
cushion of ~ INR 500 crs
Treasury and BMU assets ~19% of effective Balance Sheet size
Focus on:
Balance sheet management
Liquidity management
Capital preservation with optimum returns
43
BMU Assets INR 2,982 cr
821
213 1,948
Bonds and others FDs Gsecs
Balance Sheet Management Unit

Focused on Long Term Value Creation
Quality Businesses
Corporate Overview
Driving Non Linear Growth
44
Contents

45
Growing Business Presence
India Global Presence
Strong ~497,000 clients/accounts base across businesses Over 262,000 Depository Participant Accounts 216 offices in 118 cities including six international offices Touch points include over 5,700 Authorised Persons and Sub-brokers across India
46
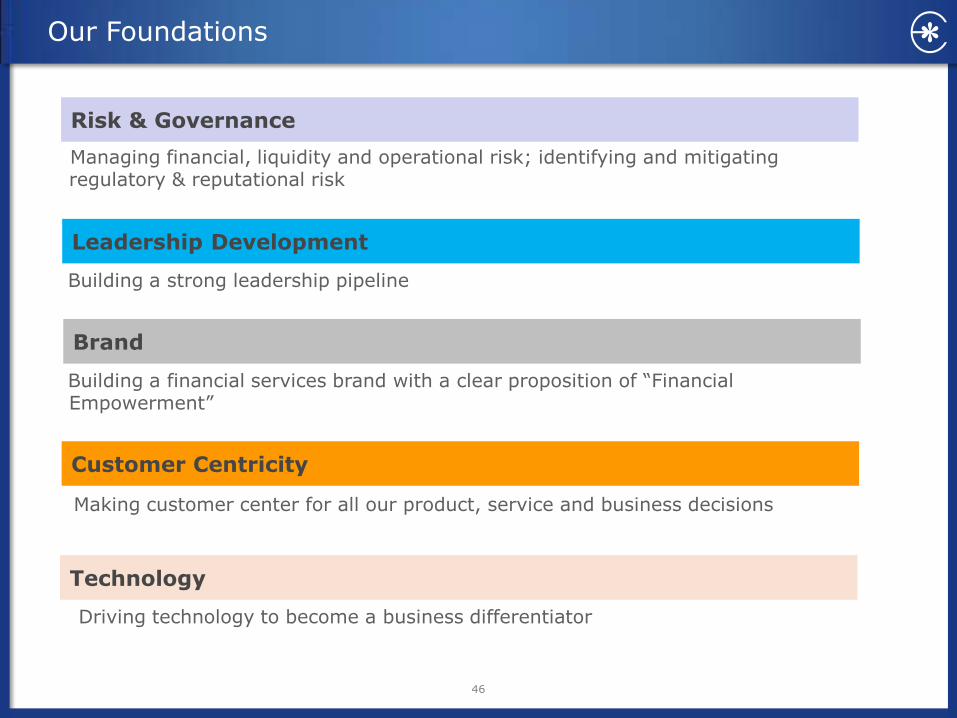
Managing financial, liquidity and operational risk; identifying and mitigating regulatory & reputational risk
Our Foundations
Risk & Governance
Building a strong leadership pipeline
Leadership Development
Building a financial services brand with a clear proposition of “Financial Empowerment”
Brand
Making customer center for all our product, service and business decisions
Customer Centricity
Driving technology to become a business differentiator
Technology

Risk Governance Framework
Business Risk The Primary Risk Team
Group Risk Second Line of Defense
Global Risk Committee Apex Risk Body
Global Risk Group
• Consolidated Risk Overview
• Adequate Risk Controls
• Policy Formation
• Risk directory
• Consists of senior management personnel including CEO and COO
• Risk Strategy
• Periodic risk review
47
• Defined risk metrics
• Day to Day Risk Monitoring
• Policy Enforcement
Oversight by Board Risk Committee
Investment Committees & Credit Committees to approve exposure levels

Awards: Best Managed & Best Corporate Governance Company
Capital Finance International, London, UK Corporate Governance Awards, 2013
48

Corporate Social Responsibility - EdelGive Foundation
49
Current portfolio of 18 non - profit organisations
Committed ` 226 mn till date
Over 8,000 hours of pro-bono support
Focus on Education, Livelihoods and Womens’ Rights
Impacted over 1,60,000 lives
Philanthropic initiative to drive sustainable social change
EdelGive has supported Indian athletes MC MaryKom, P V Sindhu and Pooja Ghatkar by funding through Olympic Gold Quest Movement
Over 3,500 Edelweiss employees touched via volunteering or
financial contribution

50
Name Percent
1 Carlyle 8.8%
2 Govt. of Singapore 8.1%
3 BIH SA 5.7%
4 Greater Pacific Capital 5.1%
5 SAIF Advisors 3.3%
6 Fidelity 2.1%
7 Amansa Investments 1.5%
8 GKFF Ventures (Argonaut)
1.5%
9 Sequoia Capital 1.0%
(#) Holding of known affiliates have been clubbed together for the purpose of this information
Foreign Institutions &
Companies 39%
Promoters, Employees &
Employee Trusts 49%
Non Institutions (Incl. Corporates and Individuals)
12%
Shareholding Pattern
Top Institutional Shareholders above 1%#
As on Mar 31, 2014
Stable Institutional Ownership

51
Independent Directors with Complementary Skills
INDEPENDENT / NON-EXECUTIVE DIRECTORS
Mr. Narendra Jhaveri Independent Director
Has occupied important positions in National Council of Applied Economic Research (NCAER), RBI & ICICI Ltd
Mr. P N Venkatachalam Independent Director Banking sector expert and Former Member of the Interim Pension Fund Regulatory Authority of India, Former MD, State Bank of India
Mr. Berjis Desai Independent Director
Reputed and respected legal practioner. Managing Partner J. Sagar & Associates
Mr. Sanjiv Misra Independent Director
Worked with Goldman Sachs, Citigroup. Is the President of Phoenix Advisers Pte. Ltd, a boutique advisory firm
Mr. K Chinniah Independent Director
Served as Global Head - Portfolio, Strategy & Risk Group with GIC Special Invst. (Pvt. Equity arm of the Govt. of Singapore Invst Corp ("GIC“)
Mr. Sunil Mitra Independent Director
Broad experience in economic policy making. Former Finance Secretary of Govt. of India
Mr. Navtej S. Nandra Independent Director President of E*TRADE Financial Corporation. Prior to this he served as Head of International for Morgan Stanley Investment Management
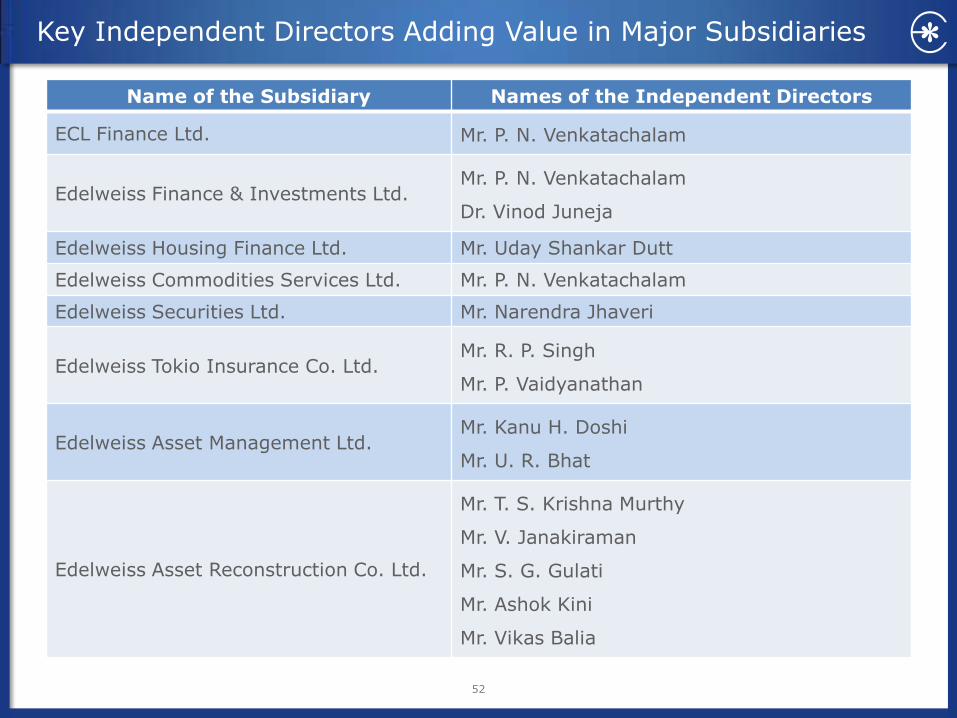
Key Independent Directors Adding Value in Major Subsidiaries
Name of the Subsidiary Names of the Independent Directors
ECL Finance Ltd. Mr. P. N. Venkatachalam
Edelweiss Finance & Investments Ltd. Mr. P. N. Venkatachalam
Dr. Vinod Juneja
Edelweiss Housing Finance Ltd. Mr. Uday Shankar Dutt
Edelweiss Commodities Services Ltd. Mr. P. N. Venkatachalam
Edelweiss Securities Ltd. Mr. Narendra Jhaveri
Edelweiss Tokio Insurance Co. Ltd. Mr. R. P. Singh
Mr. P. Vaidyanathan
Edelweiss Asset Management Ltd. Mr. Kanu H. Doshi
Mr. U. R. Bhat
Edelweiss Asset Reconstruction Co. Ltd.
Mr. T. S. Krishna Murthy
Mr. V. Janakiraman
Mr. S. G. Gulati
Mr. Ashok Kini
Mr. Vikas Balia
52

This presentation and the discussion may contain certain words or phrases that are forward - looking statements, based on current expectations of the management of Edelweiss Financial Services Ltd. or any of its subsidiaries and associate companies (“Edelweiss”). Actual results may vary significantly from the forward-looking statements contained in this presentations due to various risks and uncertainties. These risks and uncertainties include the effect of economic and political conditions in India and outside India, volatility in interest rates and in the securities market, new regulations and Government policies that may impact the businesses of Edelweiss as well as the ability to implement its strategy. The information contained herein is as of the date referenced and Edelweiss does not undertake any obligation to update these statements. Edelweiss has obtained all market data and other information from sources believed to be reliable or are its internal estimates, although its accuracy or completeness can not be guaranteed. The presentation relating to financial performance of various businesses of Edelweiss herein is based on Management estimates. This presentation is for information purposes only and does not constitute an offer or recommendation to buy or sell any securities of Edelweiss. This presentation also does not constitute an offer or recommendation to buy or sell any financial products offered by Edelweiss. Any action taken by you on the basis of the information contained herein is your responsibility alone and Edelweiss or its directors or employees will not be liable in any manner for the consequences of such action taken by you. Edelweiss and/or its directors and/or its employees may have interests or positions, financial or otherwise, in the securities mentioned in this presentation. For more information, please visit www.edelweissfin.com or drop us an e-mail on [email protected]
53
Safe Harbor