Embed Size (px)
Citation preview

Edelweiss Research is also available on www.edelresearch.com, Bloomberg EDEL <GO>, Thomson First Call, Reuters and Factset.
Edelweiss Securities Limited
Larsen & Toubro’s (L&T) Q1FY17 net income missed Street’s and our estimates primarily as transition to Ind-AS required much higher-than-expected provisioning. Business outlook indicates a slow and steady improvement with orders rising 14% YoY and international revenue, once again, surprising us on the upside. We perceive a few challenges: (a) weak revenue prospects for realty business in interim; (b) domestic execution up mere ~5% YoY; and (c) NWC/sales at 23.5%. We trim FY17/18E EPS ~20% each building in the Ind-AS impact. We maintain ‘BUY’ with revised TP of INR 1650 (INR1750 earlier) valuing L&T core E&C at 25x, in line with S&P BSE Cap goods index. Interim results appear good on what probably may be a new goal post We agree with management that L&T’s Q1FY17 net income at INR 219 bn, up 9% YoY,
is impressive, given the sluggish capital formation growth in the economy. Order wins
at INR 250 bn(ex-services), up 14%, are in line with the annual run-rate set by
management. 50 bps margin expansion helped EBITDA rise 15% YoY.
Our challenge is the timelines for full disclosures on transition to Ind-AS Post adoption of Ind-AS, Q1FY17 net income was impacted by INR1.65bn (same as last
year) due to Expected Credit Loss (ECL) on receivables beyond 3 months. Also, the first
balance sheet under Ind-AS may not be immediately available. Based on management
commentary that provisions do not have quarterly volatility and other IND AS charges,
we revise down FY17/18E EPS to INR46/INR62.
Guidance maintained; bid pipeline healthy at INR4.2tn Management maintained 12-15% sales & 15% order intake guidance led by healthy bid
pipeline of INR4.25tn (INR3.1tn from India) and strong execution in export businesses.
NWC/sales remained at Q4 level despite a good intake, indicating that a sustained
inflection in revenue is still a few quarters away.
Outlook and valuations: A good medium-term play; maintain ‘BUY’ Post realignment of EPS in Ind-AS, we realign our TP to INR 1,650. We continue using
SOTP. We assign P/E to 25x, in line with S&P-BSE cap good index for core E&C business
(v/s 19x standalone estimate). With EPS CAGR (FY16-18E) estimate of 30%+ in core E&C
, valuations appear reasonable v/s position in cycle. We maintain ‘BUY/SO’.
RESULT UPDATE
LARSEN & TOUBRO Transition to Ind-AS could be a long-term positive
EDELWEISS 4D RATINGS
Absolute Rating BUY
Rating Relative to Sector Outperform
Risk Rating Relative to Sector Medium
Sector Relative to Market Overweight
MARKET DATA (R: LART.BO, B: LT IN)
CMP : INR 1559
Target Price : INR 1650
52-week range (INR) : 1,844 / 1,016
Share in issue (mn) : 932.0
M cap (INR bn/USD mn) : 1,453/ 21,688
Avg. Daily Vol.BSE/NSE(‘000) : 2,290.8
SHARE HOLDING PATTERN (%)
Current Q3FY16 Q2FY16
Promoters *
- - -
MF's, FI's & BK’s 38.7 38.3 38.4
FII's 16.6 16.2 16.4
Others 44.7 45.5 45.2
* Promoters pledged shares (% of share in issue)
: NIL
PRICE PERFORMANCE (%)
Stock Nifty EW
Construction Index
1 month 7.0 6.6 6.9
3 months 25.2 10.4 17.8
12 months (10.3) 3.9 (12.0)
Manish Saxena +91 22 6620 3105
[email protected] Amit Mahawar +91 22 4040 7451
Swarnim Maheshwari +91 22 4040 7418
India Equity Research| Engineering and Capital Goods
July 29, 2016
Financials (Consolidated) (INR bn)
Year to March Q1FY17 Q1FY16 % change Q4FY16 % change FY16 FY17E FY18E
Net rev. 218.7 200.5 9.1 331.6 (34.0) 1,026 1,142 1,321
EBITDA 19.1 16.4 16.1 48.6 (60.8) 123 114 138
Adjusted profit 6.1 4.2 45.5 24.1 (74.7) 47 42 58
Diluted EPS (INR) 6.6 4.5 45.5 25.9 (74.7) 50.9 45.5 61.9
Diluted P/E (x) 30.6 34.2 25.1
EV/EBITDA (x) 19.3 21.7 18.3
ROAE (%) 10.7 8.8 11.0

Engineering and Capital Goods
2 Edelweiss Securities Limited
Con-call highlights:
FY17 guidance (consol) maintained: Revenue: 12-15% growth, Order intake: 15%
growth , Margins: 50bps improvement (ex-services business).
Ordering pipeline: Total ordering pipeline for next 9 months stands at INR4.25tn. 25%
of order prospects are from international projects and balance from the domestic
market.
Large jobs drive strong order intake: Telangana barrage (water segment) order
received in Q1FY17 apart from Saudi Aramco are some of the large projects awarded in
Q1FY17 which drove 15% growth in order intake.
IND-AS : P&L impacted by INR1.65bn mainly due to Expected Credit loss (ECL) in
Q1FY17 apart from provisioning for performance link reward. A large part of ECL
expense of INR10bn has been adjusted against opening reserves of March 15 B/S.
Power segment: Power segment sales up 60% YoY led by Bangladesh, Chhabra etc.,
large project execution.
Hydrocarbon segment: Large order inflow in Q1 adds significantly to FY18E revenue
growth visibility. L&T has completely exited old jobs in HC segment and is now expects
improving margin profile for this segment.
HC, Hydrocarbon & MMH will see rationalization in manpower. The company continues
to add manpower in infra division which has sustained reasonable growth, especially in
international jobs.
Development projects (IND AS): Nabha Power, Kattupali port & Hyderabad metro
included. However, in PAT profits/losses from road projects are also included. In capital
employed, Equity-Accumulated losses of IDPL have been also recorded. Loss of road
revenues from the development project segment was compensated by Hyderabad
Metro revenue (Under IND-AS, whatever execution is done by outside party gets
recognised as revenue).
Real estate business: Revenues are expected to be a bit weak in near term till the time
the company gets permission for IInd phase of Powai, Parel projects. Bengaluru project
is expected to contribute in sometime. Realty revenues were INR4bn during Q1FY17.
Other business: Margins have declined due to inventory write down (INR1bn) in the
shipbuilding business and lower revenues in the realty business. There have been cost
overruns in certain ship contracts which are under arbitration.
Working capital: Working capital under IND-AS is at similar levels to those of March 16
which was 23.5% as % of sales. No real improvement seen as such.
Other key highlights:
SGA has risen sharply due to NPAs in fin services and on doubtful debts & expected
credit loss.
Salary cost for technology services has been included in staff cost versus other
expenses earlier.
Excise duty was NR1.5bn during Q1FY16.
Kuwait, Saudi still continue to award many projects . But ordering from Oman & UAE
has reduced. The company is not facing any working capital related challenges in Saudi
Arabia unlike Korean engineering majors.

Larsen & Toubro
3 Edelweiss Securities Limited
Table 2: Key segmental performance
Table 2: Edelweiss bottoms-up order intake assumptions
Source: Company, Industry,Edelweiss research
Segments
Q1FY17 Q1FY16 % change
Revenues
Infra 90,700 83,100 9.1
Power 17,200 10,800 59.3
Heavy Engineering 6,500 6,200 4.8
Electrical Automation 9,300 9,600 (3.1)
Hydrocarbons 21,300 21,200 0.5
IT & services 23,500 20,500 14.6
Financial Services 20,907 17,817 17.3
Development projects 11,500 9,900 16.2
Others 16,200 19,400 (16.5)
Total 217,107 198,517 9.4
EBITDA margins
Infra 9.2 8.9
Power 5.8 1.2
Heavy Engineering 14.9 8.9
Electrical Automation 7.8 5.8
Hydrocarbons 2.0 2.3
IT & services 21.9 18.4
Financial Services 13.3 11.7
Development projects 9.8 5.9
Others (2.5) 11.9
Total 9.3 9.0
Consolidated
(INR bn) FY14 FY15 FY16 FY17E FY18E
Process (MMH) 29 62 41 49 58
Power 28 155 27 97 155
BoP/Gas/EPC etc 28 75 27 28 52
BTG 0 80 0 69 103
Hydrocarbons 97 108 95 150 174
India 32 40 45 50 54
Exports 65 68 50 100 120
Infrastructure 762 854 849 804 863
T&D- Middle East 61 64 51 50 55
T&D- India 67 126 133 143 140
Factories & Buildings (Residential) 109 134 90 60 65
Factories & Buildings (Commercial/IT
park/ Industrials)
154 171 154 175 184
Transportation/Urban Infra (India) 107 120 150 120 130
Transportation/Urban Infra (Middle 104 120 75 56 68
Roads (Including ME) 70 55 110 100 108
Water 91 64 86 99 114
Developmental Projects - - - - -
Defence & shipbuilding 30 45 25 110 140
Others 92 120 113 90 90
TOTAL 1,037 1,345 1,149 1,299 1,481
% change 16.0 29.7 (14.5) 13.0 14.1

Engineering and Capital Goods
4 Edelweiss Securities Limited
Table 3: SOTP valuation
Source: Company, Edelweiss research
Valuation
methodologyMultiple
L&T's
stake (%)
Value
(INR mn)
Per share
(INR)Remark
L&T Core Engineering
business
PE 25 100 1,221,643 1,314 In l ine with S&P BSE Cap Goods Index
adjusted for June Quarter earnings
L&T MHI (BTG JVs) DCF - 51 62,960 35 DCF basis
L&T Infotech & technology
services
PER 85% 122,340 132 Assuming value in l ine with Current market
Cap adjusted for minority stake
L&T Finance Holdings 67% 98,352 106 Assuming value in l ine with Current market
Cap adjusted for minority stake
L&T Develoment Projects P/BV 1.2 80% 62,000 67 Equity Invested til l FY16
Hyderabad Metro DCF 100 (6,375) (3) Remains to be seen if Telangana state
would like to take a controlling stake in the
project
Total 1,567,295 1,650
Financial snapshot: Consol (INR mn)
Year to March Q1FY17 Q1FY16 % change Q4FY16 % change FY16 FY17E FY18E
Total revenues (net) 218,738 200,482 9.1 331,570 (34.0) 1,026,317 1,142,351 1,321,144
Direct cost 136,532 127,095 7.4 244,355 (44.1) 749,463 778,612 910,205
Staff cost 34,200 31,494 8.6 22,421 52.5 92,048 124,850 144,477
Other operating expenses 28,955 25,482 13.6 16,203 78.7 61,378 124,741 128,170
Total expenditure 199,687 184,072 8.5 282,979 (29.4) 902,890 1,028,203 1,182,852
EBITDA 19,051 16,411 16.1 48,592 (60.8) 123,427 114,148 138,292
Depreciation 4,648 4,658 (0.2) 8,203 (43.3) 27,560 29,297 30,479
EBIT 14,403 11,752 22.6 40,389 (64.3) 95,867 84,852 107,813
Interest 3,375 3,893 (13.3) 7,737 (56.4) 30,412 15,685 16,663
Other income 3,024 2,833 6.8 2,182 38.6 11,830 10,426 10,974
Add: Exceptional items 0 0 485 3,581 0 0
PBT 14,052 10,692 31.4 35,319 (60.2) 80,866 79,593 102,124
Tax 5,488 4,282 28.2 9,537 (42.5) 25,487 26,266 33,701
Less: Minority Interest 732 258 1,230 4,450 3,466 4,448
Add: Share in profits of assoc. (1,736) (1,963) (15) (25) (7,500) (6,375)
Reported Profit 6,097 4,189 45.5 24,537 (75.2) 50,905 42,361 57,601
Adjusted net profit 6,097 4,189 45.5 24,051 (74.7) 47,324 42,361 57,601
Equity capital (FV: INR 2) 1,245 1,245 1,245 1,245 1,246 1,247
# of shares (mn) 930 930 930 930 930 930
Adjusted EPS (INR) 6.6 4.5 45.5 25.9 (74.7) 50.9 45.5 61.9
As % of net revenues 0.0 0.0 0.0 2.0 3.0 4.0
Direct cost 62.4 63.4 73.7 73.0 68.2 68.9
Employee cost 15.6 15.7 6.8 9.0 10.9 10.9
Other operating expenses 13.2 12.7 4.9 6.0 10.9 9.7
EBITDA 8.7 8.2 14.7 12.0 10.0 10.5
Adjsuted net profit 2.8 2.1 7.3 4.6 3.7 4.4
Tax rate 39.1 40.1 27.0 31.5 33.0 33.0

Larsen & Toubro
5 Edelweiss Securities Limited
Company Description
Larsen & Toubro (L&T), headquartered in Mumbai, is a technology-driven engineering and
construction organization, and one of the largest companies in India's private sector. It has
additional interests in manufacturing, services, and information technology. A strong
customer-focused approach and the constant quest for top-class quality has enabled the
company attain and sustain leadership in its major lines of businesses over seven decades.
L&T has an international presence, with a global spread of offices. A thrust on international
business over the past few years has seen overseas earnings growing to 18% of total
revenues. With factories and offices located around the country, further supplemented by a
wide marketing and distribution network, L&T's image and equity extend to virtually every
district of India. Investment Theme
Diversified business dominance imparts unique flexibility: L&T has a dominant position and
market share in most operating verticals, be it oil & gas, process projects, roads, bridges, or
industrial structures. This imparts flexibility to cherry-pick projects across a wide range of
projects and thus helps optimize overall business profitability.
New segments: Potent growth Catalysts: L&T will have to garner INR100-150bn new orders
annually over FY17-18E to cover lost ground owing to tepid Middle East market and weak
F&B segment. We believe, the much needed succor will come from defense, transportation
and power T&D sectors in the domestic market, which are anticipated to gain palpable
momentum in light of the government’s ‘Make in India’ focus.
Strong OB and domestic execution pick up to drive earnings from FY18 (+20% core earnings).
Diversified presence across key verticals has helped L&T sustain healthy order book traction
over past three years of investment slowdown. Though this elongates its execution cycle, it
also imparts good revenue visibility over the next few years. L&T could see a substantial
scale up in execution as these factors reverse going ahead.
Key Risks
Perceived risk of a slowdown in Middle East capex due to sharp drop in global oil prices
can severely impact L&T’s order intake and revenue accruals.
Further delay in recovery of the domestic investment cycle.
Continued deterioration in working capital requirement.

6 Edelweiss Securities Limited
Engineering and Capital Goods
Financial Statements (Consolidated)
Key assumptions
Year to March FY15 FY16E FY17E FY18E
Macros
GDP(Y-o-Y %) 7.2 7.4 7.9 8.3
Inflation (Avg) 5.9 4.8 5.0 5.2
Repo rate (exit rate) 7.5 6.8 6.0 6.0
USD/INR (Avg) 61.2 65.0 67.5 67.0
Key financial assumptions
Order inflow growth vertical wise (%)
A) Process 73.1 (33.6) 20.0 20.0
B) Oil & Gas 11.7 (11.9) 55.0 2.0
C) Power 463.0 (86.4) 400.0 45.0
D) Infra 12.1 (0.7) (8.0) 10.0
E) Others 40.0 (20.0) 55.0 13.0
Excise duty as a % of sales 0.9 1.0 0.9 1.3
Total no. of employees (SA) 46,392 47,784 51,129 54,708
Empl. cost per head (INR mn) 0.89 0.94 0.99 1.04
Depriciation as a % of FA 8.5 7.8 7.4 7.4
Net borrowings (INR mn) 8,408 13,086 6,000 4,500
Tax rate (%) 24.3 20.6 26.0 27.0
Capex (INR mn) 9,012 6,434 10,100 5,100
Customer adv. (as a % of OI) 7.3 8.6 10.0 10.0
Income statement (INR mn)
Year to March FY15 FY16 FY17E FY18E
Income from operations 920,046 1,026,317 1,142,351 1,321,144
Direct costs 672,937 749,463 778,612 910,205
Employee costs 79,222 92,048 124,850 144,477
Other expenses 54,531 61,378 124,741 128,170
Total operating expenses 806,690 902,890 1,028,203 1,182,852
EBITDA 113,356 123,427 114,148 138,292
Depreciation & amortisation 26,225 27,560 29,297 30,479
EBIT 87,131 95,867 84,852 107,813
Interest expenses 28,507 30,412 15,685 16,663
Other income 10,072 11,830 10,426 10,974
Add: Exceptional items 3,477 3,581 - -
Profit before tax 72,172 80,866 79,593 102,124
Provision for tax 22,836 25,487 26,266 33,701
Less: Minority interests 1,710 4,450 3,466 4,448
Add: Share in profits of assoc. 21 (25) (7,500) (6,375)
Reported Profit 47,648 50,905 42,361 57,601
Less: Exceptional Items 3,477 3,581 - -
Adjusted profit 44,171 47,324 42,361 57,601
Basic sh. outstanding (mn) 930 930 930 930
Adjusted Basic EPS 47.5 50.9 45.6 62.0
No. of Dil. Sh. outstand. (mn) 930 930 930 930
Adjusted Diluted EPS 47.5 50.9 45.6 62.0
Adjusted Cash EPS 71.3 80.6 77.1 94.8
Dividend per share (DPS) 13.9 18.3 15.3 16.1
Dividend Payout Ratio (%) 31.6 40.1 42.1 32.5
2% -2% 10%
Common size metrics- as % of net revenues
Year to March FY15 FY16 FY17E FY18E
Direct cost 73.1 73.0 68.2 68.9
Employee expenses 8.6 9.0 10.9 10.9
S G &A expenses 5.9 6.0 10.9 9.7
Operating expenses 87.7 88.0 90.0 89.5
Depreciation & amortization 2.9 2.7 2.6 2.3
Interest expenditure 3.1 3.0 1.4 1.3
EBITDA margins 12.3 12.0 10.0 10.5
EBIT margins 9.5 9.3 7.4 8.2
Net Profit margins 5.0 5.0 4.0 4.7
Growth metrics (%)
Year to March FY15 FY16 FY17E FY18E
Revenues 8.1 11.6 11.3 15.7
EBITDA 5.6 8.9 (7.5) 21.2
PBT (3.6) 12.0 (1.6) 28.3
Adjusted Profit (2.9) 7.1 (10.5) 36.0
EPS (2.8) 7.1 (10.5) 36.0
7 Edelweiss Securities Limited
Larsen & Toubro
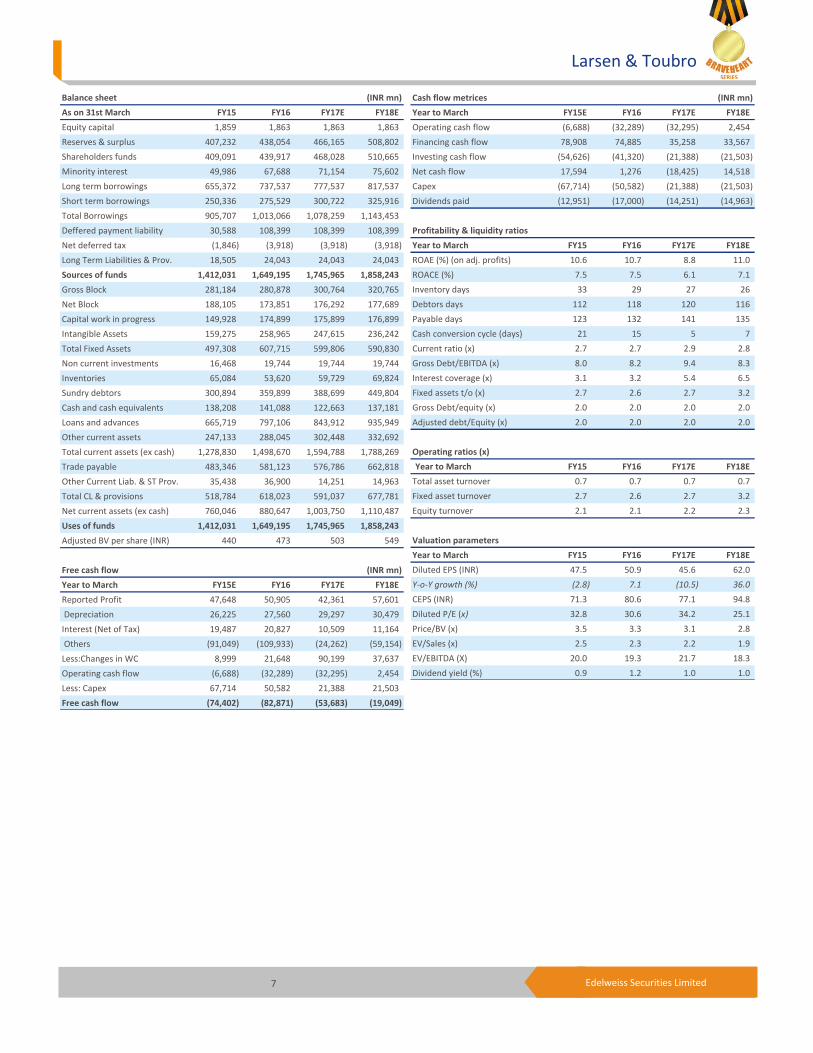
Balance sheet (INR mn)
As on 31st March FY15 FY16 FY17E FY18E
Equity capital 1,859 1,863 1,863 1,863
Reserves & surplus 407,232 438,054 466,165 508,802
Shareholders funds 409,091 439,917 468,028 510,665
Minority interest 49,986 67,688 71,154 75,602
Long term borrowings 655,372 737,537 777,537 817,537
Short term borrowings 250,336 275,529 300,722 325,916
Total Borrowings 905,707 1,013,066 1,078,259 1,143,453
Deffered payment liability 30,588 108,399 108,399 108,399
Net deferred tax (1,846) (3,918) (3,918) (3,918)
Long Term Liabilities & Prov. 18,505 24,043 24,043 24,043
Sources of funds 1,412,031 1,649,195 1,745,965 1,858,243
Gross Block 281,184 280,878 300,764 320,765
Net Block 188,105 173,851 176,292 177,689
Capital work in progress 149,928 174,899 175,899 176,899
Intangible Assets 159,275 258,965 247,615 236,242
Total Fixed Assets 497,308 607,715 599,806 590,830
Non current investments 16,468 19,744 19,744 19,744
Inventories 65,084 53,620 59,729 69,824
Sundry debtors 300,894 359,899 388,699 449,804
Cash and cash equivalents 138,208 141,088 122,663 137,181
Loans and advances 665,719 797,106 843,912 935,949
Other current assets 247,133 288,045 302,448 332,692
Total current assets (ex cash) 1,278,830 1,498,670 1,594,788 1,788,269
Trade payable 483,346 581,123 576,786 662,818
Other Current Liab. & ST Prov. 35,438 36,900 14,251 14,963
Total CL & provisions 518,784 618,023 591,037 677,781
Net current assets (ex cash) 760,046 880,647 1,003,750 1,110,487
Uses of funds 1,412,031 1,649,195 1,745,965 1,858,243
Adjusted BV per share (INR) 440 473 503 549
Contingent liabilities
Free cash flow (INR mn)
Year to March FY15E FY16 FY17E FY18E
Reported Profit 47,648 50,905 42,361 57,601
Depreciation 26,225 27,560 29,297 30,479
Interest (Net of Tax) 19,487 20,827 10,509 11,164
Others (91,049) (109,933) (24,262) (59,154)
Less:Changes in WC 8,999 21,648 90,199 37,637
Operating cash flow (6,688) (32,289) (32,295) 2,454
Less: Capex 67,714 50,582 21,388 21,503
Free cash flow (74,402) (82,871) (53,683) (19,049)
Cash flow metrices (INR mn)
Year to March FY15E FY16 FY17E FY18E
Operating cash flow (6,688) (32,289) (32,295) 2,454
Financing cash flow 78,908 74,885 35,258 33,567
Investing cash flow (54,626) (41,320) (21,388) (21,503)
Net cash flow 17,594 1,276 (18,425) 14,518
Capex (67,714) (50,582) (21,388) (21,503)
Dividends paid (12,951) (17,000) (14,251) (14,963)
Profitability & liquidity ratios
Year to March FY15 FY16 FY17E FY18E
ROAE (%) (on adj. profits) 10.6 10.7 8.8 11.0
ROACE (%) 7.5 7.5 6.1 7.1
Inventory days 33 29 27 26
Debtors days 112 118 120 116
Payable days 123 132 141 135
Cash conversion cycle (days) 21 15 5 7
Current ratio (x) 2.7 2.7 2.9 2.8
Gross Debt/EBITDA (x) 8.0 8.2 9.4 8.3
Interest coverage (x) 3.1 3.2 5.4 6.5
Fixed assets t/o (x) 2.7 2.6 2.7 3.2
Gross Debt/equity (x) 2.0 2.0 2.0 2.0
Adjusted debt/Equity (x) 2.0 2.0 2.0 2.0
Operating ratios (x)
Year to March FY15 FY16 FY17E FY18E
Total asset turnover 0.7 0.7 0.7 0.7
Fixed asset turnover 2.7 2.6 2.7 3.2
Equity turnover 2.1 2.1 2.2 2.3
Valuation parameters
Year to March FY15 FY16 FY17E FY18E
Diluted EPS (INR) 47.5 50.9 45.6 62.0
Y-o-Y growth (%) (2.8) 7.1 (10.5) 36.0
CEPS (INR) 71.3 80.6 77.1 94.8
Diluted P/E (x) 32.8 30.6 34.2 25.1
Price/BV (x) 3.5 3.3 3.1 2.8
EV/Sales (x) 2.5 2.3 2.2 1.9
EV/EBITDA (X) 20.0 19.3 21.7 18.3
Dividend yield (%) 0.9 1.2 1.0 1.0

8 Edelweiss Securities Limited
Engineering and Capital Goods
Insider Trades
Reporting Data Acquired / Seller B/S Qty Traded
No Data Available
*in last one year
Bulk Deals Data Acquired / Seller B/S Qty Traded Price
No Data Available
*in last one year
Holding – Top10 Perc. Holding Perc. Holding
Life insurance corp 15.71 L&t employ welfare f 12.31
Unit trust of india 8.15 Hdfc asset managemen 2.23
General insurance co 1.84 Prudential icici ass 1.54
Gic private limited 1.48 Icici prudential lif 1.34
Reliance capital tru 1.24 Blackrock 1.05
*in last one year
Additional Data
Directors Data AM Naik Group Executive Chairman MR. D. K. SEN Whole-time Director & Sr. Executive Vice President (Infra)
S N Subrahmanyan Deputy Managing Director & President Shailendra Roy Whole Time Director & Senior Executive Vice President
MR. SUSHOBHAN SARKER Nominee Director - LIC MRS. SUNITA SHARMA Nominee Director - LIC
MR. M. V. SATISH Whole Time Director & Sr. EVP R Shankar Raman Whole-time Director & Chief Financial Officer
V K Magapu Whole Time Director AK Jain Nominee Director
M M Chitale Non Executive Director S N Talwar Non Executive Director
S Rajgopal Non Executive Director Subodh Bhargava Non Executive Director
Auditors - Sharp Tannan & Co.
*as per last annual report
9 Edelweiss Securities Limited
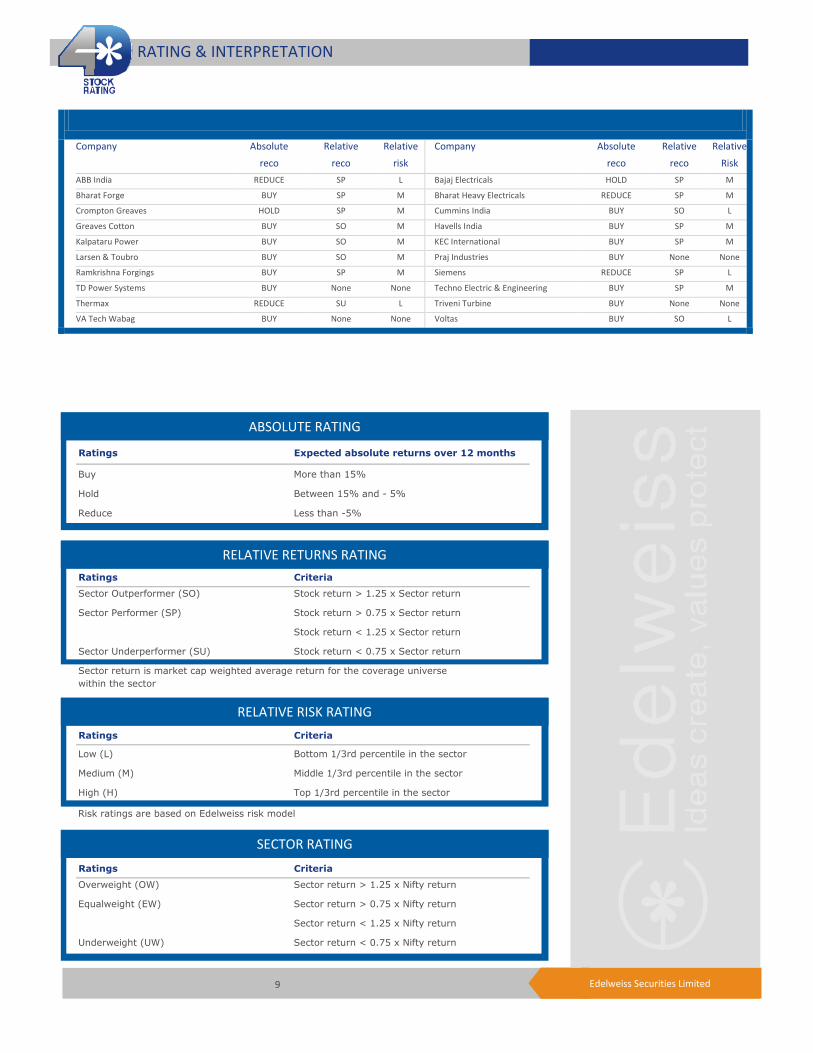
Company Absolute
reco
Relative
reco
Relative
risk
Company Absolute
reco
Relative
reco
Relative
Risk
ABB India REDUCE SP L Bajaj Electricals HOLD SP M
Bharat Forge BUY SP M Bharat Heavy Electricals REDUCE SP M
Crompton Greaves HOLD SP M Cummins India BUY SO L
Greaves Cotton BUY SO M Havells India BUY SP M
Kalpataru Power BUY SO M KEC International BUY SP M
Larsen & Toubro BUY SO M Praj Industries BUY None None
Ramkrishna Forgings BUY SP M Siemens REDUCE SP L
TD Power Systems BUY None None Techno Electric & Engineering BUY SP M
Thermax REDUCE SU L Triveni Turbine BUY None None
VA Tech Wabag BUY None None Voltas BUY SO L
RATING & INTERPRETATION
ABSOLUTE RATING
Ratings Expected absolute returns over 12 months
Buy More than 15%
Hold Between 15% and - 5%
Reduce Less than -5%
RELATIVE RETURNS RATING
Ratings Criteria
Sector Outperformer (SO) Stock return > 1.25 x Sector return
Sector Performer (SP) Stock return > 0.75 x Sector return
Stock return < 1.25 x Sector return
Sector Underperformer (SU) Stock return < 0.75 x Sector return
Sector return is market cap weighted average return for the coverage universe
within the sector
RELATIVE RISK RATING
Ratings Criteria
Low (L) Bottom 1/3rd percentile in the sector
Medium (M) Middle 1/3rd percentile in the sector
High (H) Top 1/3rd percentile in the sector
Risk ratings are based on Edelweiss risk model
SECTOR RATING
Ratings Criteria
Overweight (OW) Sector return > 1.25 x Nifty return
Equalweight (EW) Sector return > 0.75 x Nifty return
Sector return < 1.25 x Nifty return
Underweight (UW) Sector return < 0.75 x Nifty return
10 Edelweiss Securities Limited
Engineering and Capital Goods
Edelweiss Securities Limited, Edelweiss House, off C.S.T. Road, Kalina, Mumbai – 400 098.
Board: (91-22) 4009 4400, Email: [email protected]
Manoj Bahety
Deputy Head Research
Coverage group(s) of stocks by primary analyst(s): Engineering and Capital Goods
ABB India, Bharat Heavy Electricals, Bharat Forge, Bajaj Electricals, Crompton Greaves, Greaves Cotton, Havells India, KEC International, Cummins India, Kalpataru Power, Larsen & Toubro, Praj Industries, Ramkrishna Forgings, Siemens, TD Power Systems, Techno Electric & Engineering, Thermax, Triveni Turbine, VA Tech Wabag, Voltas
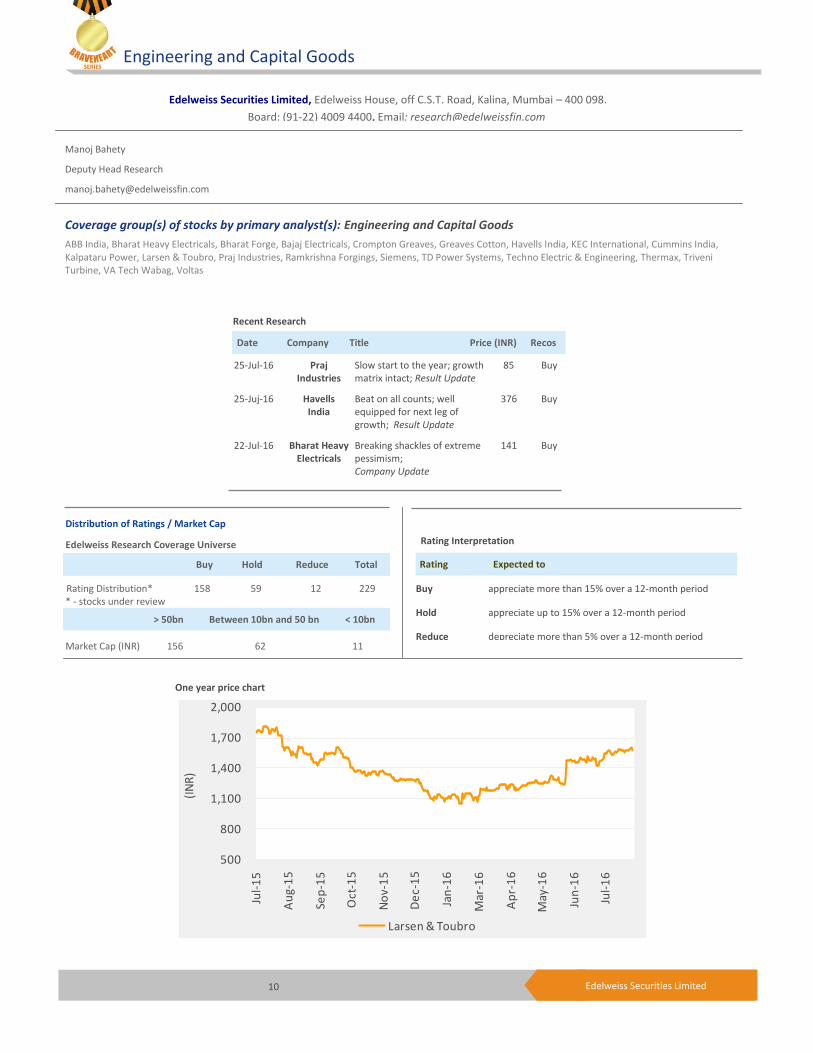
Distribution of Ratings / Market Cap
Edelweiss Research Coverage Universe
Rating Distribution* 158 59 12 229 * - stocks under review
Market Cap (INR) 156 62 11
Date Company Title Price (INR) Recos
Recent Research
25-Jul-16 Praj Industries
Slow start to the year; growth matrix intact; Result Update
85 Buy
25-Juj-16 Havells India
Beat on all counts; well equipped for next leg of growth; Result Update
376 Buy
22-Jul-16 Bharat Heavy Electricals
Breaking shackles of extreme pessimism; Company Update
141 Buy
> 50bn Between 10bn and 50 bn < 10bn
Buy Hold Reduce Total
Rating Interpretation
Buy appreciate more than 15% over a 12-month period
Hold appreciate up to 15% over a 12-month period
Reduce depreciate more than 5% over a 12-month period
Rating Expected to
-
149
297
446
594
743
Jan
-14
Feb
-14
Mar
-14
Ap
r-1
4
May
-14
Jun
-14
Jul-
14
Au
g-1
4
Sep
-14
Oct
-14
No
v-1
4
De
c-1
4
(IN
R)
One year price chart
500
800
1,100
1,400
1,700
2,000
Jul-
15
Au
g-1
5
Sep
-15
Oct
-15
No
v-1
5
De
c-1
5
Jan
-16
Mar
-16
Ap
r-1
6
May
-16
Jun
-16
Jul-
16
(IN
R)
Larsen & Toubro
11 Edelweiss Securities Limited
Larsen & Toubro
DISCLAIMER
Edelweiss Securities Limited (“ESL” or “Research Entity”) is regulated by the Securities and Exchange Board of India (“SEBI”) and is licensed to carry on the business of broking, depository services and related activities. The business of ESL and its Associates (list available on www.edelweissfin.com) are organized around five broad business groups – Credit including Housing and SME Finance, Commodities, Financial Markets, Asset Management and Life Insurance.
This Report has been prepared by Edelweiss Securities Limited in the capacity of a Research Analyst having SEBI Registration No.INH200000121 and distributed as per SEBI (Research Analysts) Regulations 2014. This report does not constitute an offer or solicitation for the purchase or sale of any financial instrument or as an official confirmation of any transaction. Securities as defined in clause (h) of section 2 of the Securities Contracts (Regulation) Act, 1956 includes Financial Instruments and Currency Derivatives. The information contained herein is from publicly available data or other sources believed to be reliable. This report is provided for assistance only and is not intended to be and must not alone be taken as the basis for an investment decision. The user assumes the entire risk of any use made of this information. Each recipient of this report should make such investigation as it deems necessary to arrive at an independent evaluation of an investment in Securities referred to in this document (including the merits and risks involved), and should consult his own advisors to determine the merits and risks of such investment. The investment discussed or views expressed may not be suitable for all investors.
This information is strictly confidential and is being furnished to you solely for your information. This information should not be reproduced or redistributed or passed on directly or indirectly in any form to any other person or published, copied, in whole or in part, for any purpose. This report is not directed or intended for distribution to, or use by, any person or entity who is a citizen or resident of or located in any locality, state, country or other jurisdiction, where such distribution, publication, availability or use would be contrary to law, regulation or which would subject ESL and associates / group companies to any registration or licensing requirements within such jurisdiction. The distribution of this report in certain jurisdictions may be restricted by law, and persons in whose possession this report comes, should observe, any such restrictions. The information given in this report is as of the date of this report and there can be no assurance that future results or events will be consistent with this information. This information is subject to change without any prior notice. ESL reserves the right to make modifications and alterations to this statement as may be required from time to time. ESL or any of its associates / group companies shall not be in any way responsible for any loss or damage that may arise to any person from any inadvertent error in the information contained in this report. ESL is committed to providing independent and transparent recommendation to its clients. Neither ESL nor any of its associates, group companies, directors, employees, agents or representatives shall be liable for any damages whether direct, indirect, special or consequential including loss of revenue or lost profits that may arise from or in connection with the use of the information. Our proprietary trading and investment businesses may make investment decisions that are inconsistent with the recommendations expressed herein. Past performance is not necessarily a guide to future performance .The disclosures of interest statements incorporated in this report are provided solely to enhance the transparency and should not be treated as endorsement of the views expressed in the report. The information provided in these reports remains, unless otherwise stated, the copyright of ESL. All layout, design, original artwork, concepts and other Intellectual Properties, remains the property and copyright of ESL and may not be used in any form or for any purpose whatsoever by any party without the express written permission of the copyright holders.
ESL shall not be liable for any delay or any other interruption which may occur in presenting the data due to any reason including network (Internet) reasons or snags in the system, break down of the system or any other equipment, server breakdown, maintenance shutdown, breakdown of communication services or inability of the ESL to present the data. In no event shall ESL be liable for any damages, including without limitation direct or indirect, special, incidental, or consequential damages, losses or expenses arising in connection with the data presented by the ESL through this report.
We offer our research services to clients as well as our prospects. Though this report is disseminated to all the customers simultaneously, not all customers may receive this report at the same time. We will not treat recipients as customers by virtue of their receiving this report.
ESL and its associates, officer, directors, and employees, research analyst (including relatives) worldwide may: (a) from time to time, have long or short positions in, and buy or sell the Securities, mentioned herein or (b) be engaged in any other transaction involving such Securities and earn brokerage or other compensation or act as a market maker in the financial instruments of the subject company/company(ies) discussed herein or act as advisor or lender/borrower to such company(ies) or have other potential/material conflict of interest with respect to any recommendation and related information and opinions at the time of publication of research report or at the time of public appearance. ESL may have proprietary long/short position in the above mentioned scrip(s) and therefore should be considered as interested. The views provided herein are general in nature and do not consider risk appetite or investment objective of any particular investor; readers are requested to take independent professional advice before investing. This should not be construed as invitation or solicitation to do business with ESL.
12 Edelweiss Securities Limited
Engineering and Capital Goods
ESL or its associates may have received compensation from the subject company in the past 12 months. ESL or its associates may have managed or co-managed public offering of securities for the subject company in the past 12 months. ESL or its associates may have received compensation for investment banking or merchant banking or brokerage services from the subject company in the past 12 months. ESL or its associates may have received any compensation for products or services other than investment banking or merchant banking or brokerage services from the subject company in the past 12 months. ESL or its associates have not received any compensation or other benefits from the Subject Company or third party in connection with the research report. Research analyst or his/her relative or ESL’s associates may have financial interest in the subject company. ESL and/or its Group Companies, their Directors, affiliates and/or employees may have interests/ positions, financial or otherwise in the Securities/Currencies and other investment products mentioned in this report. ESL, its associates, research analyst and his/her relative may have other potential/material conflict of interest with respect to any recommendation and related information and opinions at the time of publication of research report or at the time of public appearance.
Participants in foreign exchange transactions may incur risks arising from several factors, including the following: ( i) exchange rates can be volatile and are subject to large fluctuations; ( ii) the value of currencies may be affected by numerous market factors, including world and national economic, political and regulatory events, events in equity and debt markets and changes in interest rates; and (iii) currencies may be subject to devaluation or government imposed exchange controls which could affect the value of the currency. Investors in securities such as ADRs and Currency Derivatives, whose values are affected by the currency of an underlying security, effectively assume currency risk.
Research analyst has served as an officer, director or employee of subject Company: No
ESL has financial interest in the subject companies: No
ESL’s Associates may have actual / beneficial ownership of 1% or more securities of the subject company at the end of the month immediately preceding the date of publication of research report.
Research analyst or his/her relative has actual/beneficial ownership of 1% or more securities of the subject company at the end of the month immediately preceding the date of publication of research report: No
ESL has actual/beneficial ownership of 1% or more securities of the subject company at the end of the month immediately preceding the date of publication of research report: No
Subject company may have been client during twelve months preceding the date of distribution of the research report.
There were no instances of non-compliance by ESL on any matter related to the capital markets, resulting in significant and material disciplinary action during the last three years except that ESL had submitted an offer of settlement with Securities and Exchange commission, USA (SEC) and the same has been accepted by SEC without admitting or denying the findings in relation to their charges of non registration as a broker dealer.
A graph of daily closing prices of the securities is also available at www.nseindia.com
Analyst Certification:
The analyst for this report certifies that all of the views expressed in this report accurately reflect his or her personal views about the subject company or companies and its or their securities, and no part of his or her compensation was, is or will be, directly or indirectly related to specific recommendations or views expressed in this report.
Additional Disclaimers
Disclaimer for U.S. Persons
This research report is a product of Edelweiss Securities Limited, which is the employer of the research analyst(s) who has prepared the research report. The research analyst(s) preparing the research report is/are resident outside the United States (U.S.) and are not associated persons of any U.S. regulated broker-dealer and therefore the analyst(s) is/are not subject to supervision by a U.S. broker-dealer, and is/are not required to satisfy the regulatory licensing requirements of FINRA or required to otherwise comply with U.S. rules or regulations regarding, among other things, communications with a subject company, public appearances and trading securities held by a research analyst account.
This report is intended for distribution by Edelweiss Securities Limited only to "Major Institutional Investors" as defined by Rule 15a-6(b)(4) of the U.S. Securities and Exchange Act, 1934 (the Exchange Act) and interpretations thereof by U.S. Securities and Exchange Commission (SEC) in reliance on Rule 15a 6(a)(2). If the recipient of this report is not a Major Institutional Investor as specified above, then it should not act upon this report and return the same to the sender. Further, this report may not be copied, duplicated and/or transmitted onward to any U.S. person, which is not the Major Institutional Investor.

13 Edelweiss Securities Limited
Larsen & Toubro
Access the entire repository of Edelweiss Research on www.edelresearch.com
In reliance on the exemption from registration provided by Rule 15a-6 of the Exchange Act and interpretations thereof by the SEC in order to conduct certain business with Major Institutional Investors, Edelweiss Securities Limited has entered into an agreement with a U.S. registered broker-dealer, Edelweiss Financial Services Inc. ("EFSI"). Transactions in securities discussed in this research report should be effected through Edelweiss Financial Services Inc. Disclaimer for U.K. Persons
The contents of this research report have not been approved by an authorised person within the meaning of the Financial Services and Markets Act 2000 ("FSMA"). In the United Kingdom, this research report is being distributed only to and is directed only at (a) persons who have professional experience in matters relating to investments falling within Article 19(5) of the FSMA (Financial Promotion) Order 2005 (the “Order”); (b) persons falling within Article 49(2)(a) to (d) of the Order (including high net worth companies and unincorporated associations); and (c) any other persons to whom it may otherwise lawfully be communicated (all such persons together being referred to as “relevant persons”). This research report must not be acted on or relied on by persons who are not relevant persons. Any investment or investment activity to which this research report relates is available only to relevant persons and will be engaged in only with relevant persons. Any person who is not a relevant person should not act or rely on this research report or any of its contents. This research report must not be distributed, published, reproduced or disclosed (in whole or in part) by recipients to any other person. Disclaimer for Canadian Persons
This research report is a product of Edelweiss Securities Limited ("ESL"), which is the employer of the research analysts who have prepared the research report. The research analysts preparing the research report are resident outside the Canada and are not associated persons of any Canadian registered adviser and/or dealer and, therefore, the analysts are not subject to supervision by a Canadian registered adviser and/or dealer, and are not required to satisfy the regulatory licensing requirements of the Ontario Securities Commission, other Canadian provincial securities regulators, the Investment Industry Regulatory Organization of Canada and are not required to otherwise comply with Canadian rules or regulations regarding, among other things, the research analysts' business or relationship with a subject company or trading of securities by a research analyst. This report is intended for distribution by ESL only to "Permitted Clients" (as defined in National Instrument 31-103 ("NI 31-103")) who are resident in the Province of Ontario, Canada (an "Ontario Permitted Client"). If the recipient of this report is not an Ontario Permitted Client, as specified above, then the recipient should not act upon this report and should return the report to the sender. Further, this report may not be copied, duplicated and/or transmitted onward to any Canadian person. ESL is relying on an exemption from the adviser and/or dealer registration requirements under NI 31-103 available to certain international advisers and/or dealers. Please be advised that (i) ESL is not registered in the Province of Ontario to trade in securities nor is it registered in the Province of Ontario to provide advice with respect to securities; (ii) ESL's head office or principal place of business is located in India; (iii) all or substantially all of ESL's assets may be situated outside of Canada; (iv) there may be difficulty enforcing legal rights against ESL because of the above; and (v) the name and address of the ESL's agent for service of process in the Province of Ontario is: Bamac Services Inc., 181 Bay Street, Suite 2100, Toronto, Ontario M5J 2T3 Canada. Disclaimer for Singapore Persons
In Singapore, this report is being distributed by Edelweiss Investment Advisors Private Limited ("EIAPL") (Co. Reg. No. 201016306H) which is a holder of a capital markets services license and an exempt financial adviser in Singapore and (ii) solely to persons who qualify as "institutional investors" or "accredited investors" as defined in section 4A(1) of the Securities and Futures Act, Chapter 289 of Singapore ("the SFA"). Pursuant to regulations 33, 34, 35 and 36 of the Financial Advisers Regulations ("FAR"), sections 25, 27 and 36 of the Financial Advisers Act, Chapter 110 of Singapore shall not apply to EIAPL when providing any financial advisory services to an accredited investor (as defined in regulation 36 of the FAR. Persons in Singapore should contact EIAPL in respect of any matter arising from, or in connection with this publication/communication. This report is not suitable for private investors.
Copyright 2009 Edelweiss Research (Edelweiss Securities Ltd). All rights reserved