Embed Size (px)
Citation preview

8/6/2019 Ector County ISD - Nimitz Junior High School - 2010 Texas School Survey of Drug and Alcohol Use
http://slidepdf.com/reader/full/ector-county-isd-nimitz-junior-high-school-2010-texas-school-survey-of 1/49
Ector County ISD - Nimitz Junior High
SPRING 2010
Table T-1: How recently, if ever, have you used ..
Past
Month
School
Year
Ever
Used
Never
Used
Any tobacco product?
All 6.5% 13.1% 29.2% 70.8%
Cigarettes?All 6.2% 12.1% 25.5% 74.5%
Smokeless tobacco?
All 2.1% 3.8% 10.9% 89.1%
Table T-2: How often do you normally use ..
Never
Used
Every
Day
Several
Times a
Week
Several
Times a
Month
About
Once a
Month
About
Once a
Year
Less than
Once a
Year
Any tobacco product?
All 75.2% 0.2% 0.5% 3.3% 5.0% 7.6% 8.1%
Cigarettes?
All 77.2% 0.2% 0.5% 2.6% 5.1% 6.1% 8.2%
Smokeless tobacco?
All 91.5% 0.0% 0.0% 1.2% 1.2% 2.8% 3.3%
Table T-3: Average age of first use of:
All
Cigarettes
11.3Smokeless
tobacco
12.5
Any Tobacco
11.3
©Copyright 2010, Texas A&M University
All rights reserved.
Secondary Report-Page 1 of 49
8/6/2019 Ector County ISD - Nimitz Junior High School - 2010 Texas School Survey of Drug and Alcohol Use
http://slidepdf.com/reader/full/ector-county-isd-nimitz-junior-high-school-2010-texas-school-survey-of 2/49
Ector County ISD - Nimitz Junior High
SPRING 2010
Table T-4: If you wanted some, how difficult would it be to get...
Never
Heard Of Impossible
Very
Difficult
Somewhat
Difficult
Somewhat
Easy Very Easy
Any tobacco product?
All 14.4% 20.4% 8.3% 14.6% 17.4% 24.9%
Cigarettes?
All 15.8% 21.4% 9.4% 15.5% 14.8% 23.1%Smokeless Tobacco?
All 26.9% 26.3% 11.7% 12.4% 10.6% 12.3%
Table T-5: About how many of your close friends...
None A Few Some Most ALL
Use any tobacco product?
All 52.8% 29.5% 12.4% 5.3% 0.0%
Smoke cigarettes?
All 57.0% 28.7% 10.5% 3.8% 0.0%Use a smokeless tobacco product?
All 74.4% 16.8% 5.8% 3.0% 0.0%
Table T-6: How do your parents feel about kids your age using tobacco?
Strongly
Disapprove
Mildly
Disapprove Neither
Mildly
Approve
Strongly
Approve Don't know
All 82.2% 6.6% 3.9% 0.5% 0.0% 6.9%
Table T-7: How dangerous do you think it is for kids your age to use tobacco?
Very
Dangerous
Somewhat
Dangerous
Not very
Dangerous
Not at All
Dangerous Do Not Know
All 56.9% 26.6% 9.2% 1.7% 5.6%
©Copyright 2010, Texas A&M University
All rights reserved.
Secondary Report-Page 2 of 49

8/6/2019 Ector County ISD - Nimitz Junior High School - 2010 Texas School Survey of Drug and Alcohol Use
http://slidepdf.com/reader/full/ector-county-isd-nimitz-junior-high-school-2010-texas-school-survey-of 3/49
Ector County ISD - Nimitz Junior High
SPRING 2010
Table A-1: How recently, if ever, have you used...
Past
Month
School
Year
Ever
Used
Never
Used
Any alcohol product?
All 25.5% 37.7% 64.2% 35.8%
Beer?
All 19.7% 30.7% 55.0% 45.0%Wine coolers?
All 13.7% 23.7% 45.5% 54.5%
Wine?
All 10.5% 20.0% 41.4% 58.6%
Liquor?
All 12.5% 20.7% 41.2% 58.8%
Table A-2: How often do you normally use...
Never
Used
Every
Day
Several
Times a
Week
Several
Times a
Month
About
Once a
Month
About
Once a
Year
Less than
Once a
Year
Any alcohol product?
All 43.5% 1.0% 3.9% 14.3% 15.6% 9.8% 12.0%
Beer?
All 49.3% 0.8% 3.4% 12.8% 13.3% 9.7% 10.8%
Wine coolers?
All 60.0% 0.8% 1.8% 7.1% 11.5% 10.2% 8.5%
Wine?
All 63.8% 0.0% 2.4% 4.9% 12.6% 8.8% 7.5%
Liquor?
All 60.1% 0.2% 3.0% 9.6% 8.1% 10.3% 8.6%
Table A-3: When you drink the following alcoholic beverages, how many drinks doyou usually have at one time, on average?
Never Ever Used 5 or More 1 to 4 Less than 1
Beer
All 42.9% 57.1% 15.2% 24.8% 17.0%
Wine Coolers
All 57.6% 42.4% 7.4% 26.4% 8.6%
Wine
All 56.6% 43.4% 4.1% 25.0% 14.2%
Liquor
All 55.3% 44.7% 10.3% 21.8% 12.5%
©Copyright 2010, Texas A&M University
All rights reserved.
Secondary Report-Page 3 of 49

8/6/2019 Ector County ISD - Nimitz Junior High School - 2010 Texas School Survey of Drug and Alcohol Use
http://slidepdf.com/reader/full/ector-county-isd-nimitz-junior-high-school-2010-texas-school-survey-of 4/49
Ector County ISD - Nimitz Junior High
SPRING 2010
Table A-4: During the past 30 days, on how many days have you had five or moredrinks of alcohol at one time?
Never/None 1 day 2 days 3 to 5 days 6 to 9 days
10 or
more days
Alcohol
All 80.2% 7.0% 3.2% 4.5% 3.1% 2.0%
Table A-5: Average age of first use of:
All
Beer
11.4
Wine Coolers
11.6
Wine
11.7
Liquor12.3
Any Alcohol
11.2
Table A-6: If you wanted some, how difficult would it be to get...
Never
Heard Of Impossible
Very
Difficult
Somewhat
Difficult
Somewhat
Easy Very Easy
Beer?
All 10.7% 13.1% 7.2% 13.7% 20.8% 34.5%
Wine coolers?
All 19.4% 18.1% 9.8% 14.7% 18.0% 20.0%
Wine?
All 13.1% 22.4% 9.5% 14.3% 17.2% 23.5%
Liquor?
All 13.0% 21.9% 11.1% 14.4% 16.2% 23.3%
Any alcohol product?
All 9.8% 10.8% 6.6% 13.7% 19.1% 40.1%
©Copyright 2010, Texas A&M University
All rights reserved.
Secondary Report-Page 4 of 49

8/6/2019 Ector County ISD - Nimitz Junior High School - 2010 Texas School Survey of Drug and Alcohol Use
http://slidepdf.com/reader/full/ector-county-isd-nimitz-junior-high-school-2010-texas-school-survey-of 5/49
Ector County ISD - Nimitz Junior High
SPRING 2010
Table A-7: Since school began in the fall, on how many days (if any) have you...
None 1-3 Times 4-9 Times 10+ Times
Attended class while drunk on alcohol?
All 90.7% 8.6% 0.2% 0.5%
Gotten into trouble with teachers because of your drinking?
All 98.8% 1.2% 0.0% 0.0%
Table A-8: School year use of alcohol by absences and conduct problems:
Average days absent due to
illness or other reasons
Alcohol Users: 4.8
Alcohol Non-use 4.1
Average days conduct problems
reported
Alcohol Users: 2.0
Alcohol Non-use 0.9
Table A-9: During the past twelve months, how many times have you...
None 1-3 Times 4-9 Times 10+ Times
Driven a car when you've had a good bit to drink?
All 93.2% 6.8% 0.0% 0.0%
Gotten into trouble with the police because of drinking?
All 96.3% 3.2% 0.5% 0.0%
©Copyright 2010, Texas A&M University
All rights reserved.
Secondary Report-Page 5 of 49
8/6/2019 Ector County ISD - Nimitz Junior High School - 2010 Texas School Survey of Drug and Alcohol Use
http://slidepdf.com/reader/full/ector-county-isd-nimitz-junior-high-school-2010-texas-school-survey-of 6/49
Ector County ISD - Nimitz Junior High
SPRING 2010
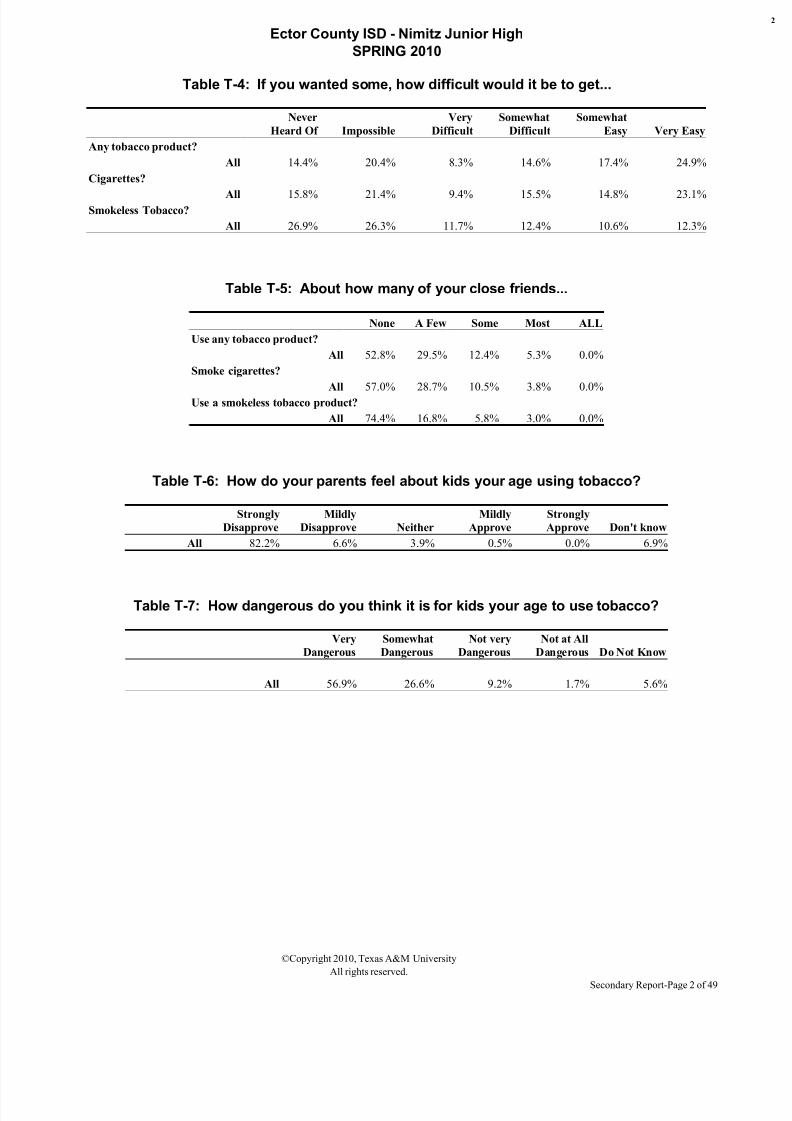
Table A-10: About how many of your close friends use...
None A Few Some Most ALL
Any alcohol product?
All 31.8% 29.4% 19.4% 13.0% 6.4%
Beer?
All 34.9% 33.4% 15.1% 10.6% 6.0%
Wine coolers?
All 53.3% 23.5% 11.3% 9.0% 2.9%
Wine?
All 59.9% 22.0% 11.8% 4.8% 1.5%
Liquor?
All 46.0% 25.8% 14.3% 8.0% 5.9%
Table A-11: During the past twelve months, how many times have you...
None 1-3 Times 4-9 Times 10+ Times
Had difficulties of any kind with your friends because of your drinking?All 94.8% 4.6% 0.5% 0.0%
Been criticized by someone you were dating because of drinking?
All 95.9% 4.1% 0.0% 0.0%
Table A-12: Thinking of parties you attended this school year, how often wasalcohol used?
Never Seldom
Half
the Time
Most
of the Time Always Don't know
Didn't
attend
All 48.5% 12.7% 9.2% 10.3% 8.9% 1.5% 8.8%
©Copyright 2010, Texas A&M University
All rights reserved.
Secondary Report-Page 6 of 49

8/6/2019 Ector County ISD - Nimitz Junior High School - 2010 Texas School Survey of Drug and Alcohol Use
http://slidepdf.com/reader/full/ector-county-isd-nimitz-junior-high-school-2010-texas-school-survey-of 7/49
Ector County ISD - Nimitz Junior High
SPRING 2010
Table A-13: How often, if ever, do you get alcoholic beverages from..
Do Not Drink Never Seldom
Most of
the Time Always
At home?
All 45.9% 20.8% 23.6% 8.1% 1.7%
From friends?
All 46.2% 21.5% 16.3% 14.0% 2.0%From a store?
All 48.7% 42.9% 5.9% 1.4% 1.0%
At parties?
All 43.1% 16.0% 14.2% 18.0% 8.7%
Other source?
All 45.5% 19.7% 17.6% 11.1% 6.2%
Table A-14: How do your parents feel about kids your age drinking alcohol?
Strongly
Disapprove
Mildly
Disapprove Neither
Mildly
Approve
Strongly
Approve Don't know
All 65.4% 15.0% 8.7% 3.3% 0.0% 7.6%
Table A-15: How dangerous do you think it is for kids your age to use alcohol?
Very
Dangerous
Somewhat
Dangerous
Not very
Dangerous
Not at All
Dangerous Do Not Know
All 48.3% 28.4% 14.5% 4.4% 4.5%
©Copyright 2010, Texas A&M University
All rights reserved.
Secondary Report-Page 7 of 49

8/6/2019 Ector County ISD - Nimitz Junior High School - 2010 Texas School Survey of Drug and Alcohol Use
http://slidepdf.com/reader/full/ector-county-isd-nimitz-junior-high-school-2010-texas-school-survey-of 8/49
Ector County ISD - Nimitz Junior High
SPRING 2010
Table D-1: How recently, if ever, have you used...
Past
Month
School
Year
Ever
Used
Never
Used
Marijuana?
All 10.4% 14.2% 23.2% 76.8%
Cocaine?
All 1.0% 2.0% 3.9% 96.1%Crack?
All 1.0% 1.6% 2.8% 97.2%
Hallucinogens?
All 1.5% 1.8% 3.3% 96.7%
Uppers?
All 1.2% 2.8% 3.7% 96.3%
Downers?
All 2.6% 3.1% 4.1% 95.9%
Rohypnol?
All 0.8% 1.3% 2.3% 97.7%
Steroids?
All 0.4% 1.0% 1.5% 98.5%
Ecstasy?
All 0.5% 1.0% 5.5% 94.5%
Heroin?
All 0.0% 1.5% 1.7% 98.3%
©Copyright 2010, Texas A&M University
All rights reserved.
Secondary Report-Page 8 of 49
8/6/2019 Ector County ISD - Nimitz Junior High School - 2010 Texas School Survey of Drug and Alcohol Use
http://slidepdf.com/reader/full/ector-county-isd-nimitz-junior-high-school-2010-texas-school-survey-of 9/49
Ector County ISD - Nimitz Junior High
SPRING 2010
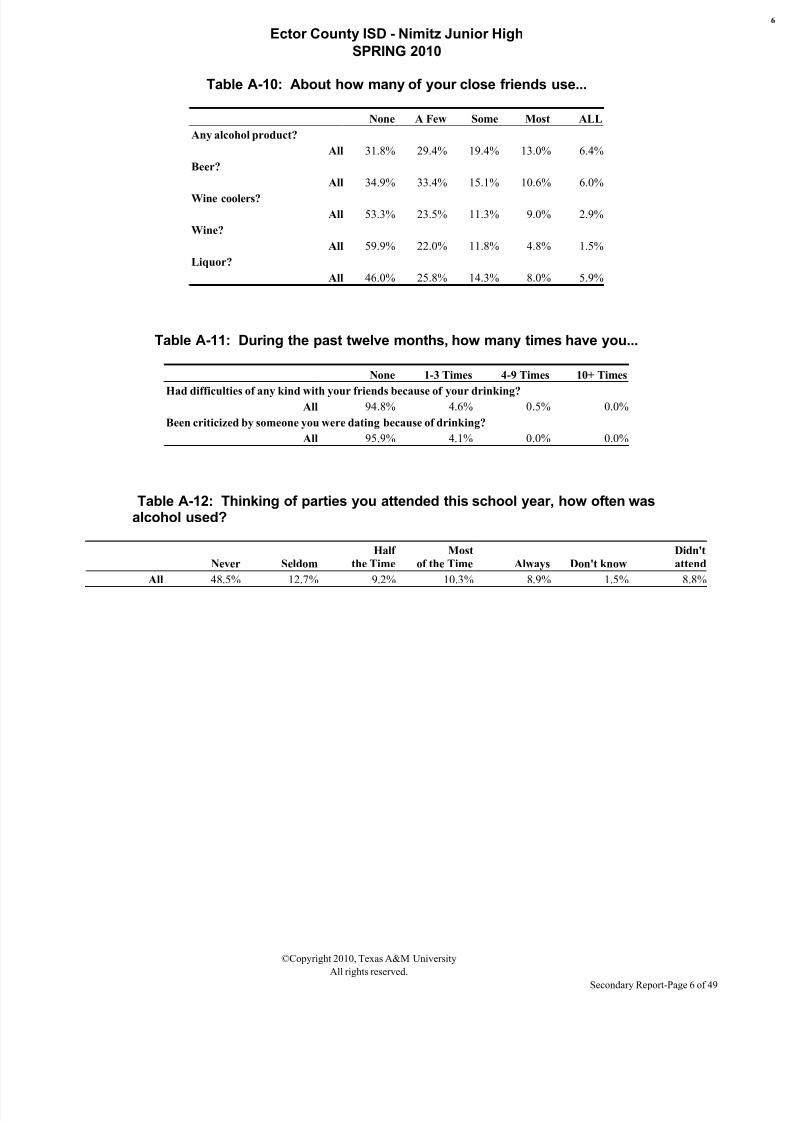
Table D-2: How often do you normally use...
Never
Used
Every
Day
Several
Times a
Week
Several
Times a
Month
About
Once a
Month
About
Once a
Year
Less than
Once a
Year
Marijuana?
All 77.6% 2.3% 3.4% 3.0% 6.1% 4.2% 3.4%
Cocaine?All 96.2% 0.0% 0.5% 0.0% 1.0% 0.5% 1.7%
Crack?
All 96.9% 0.0% 0.0% 0.0% 1.5% 0.2% 1.3%
Hallucinogens?
All 97.2% 0.0% 0.0% 0.0% 1.6% 0.5% 0.8%
Uppers?
All 96.6% 0.3% 0.5% 0.0% 2.2% 0.0% 0.5%
Downers?
All 95.8% 0.0% 0.5% 0.0% 2.6% 0.5% 0.5%
Rohypnol?
All 98.7% 0.0% 0.0% 0.5% 0.0% 0.0% 0.8%
Steroids?
All 99.0% 0.0% 0.0% 0.0% 0.0% 0.5% 0.5%
Ecstasy?
All 94.1% 0.0% 0.0% 0.5% 0.2% 1.5% 3.6%
Heroin?
All 98.2% 0.0% 0.0% 0.0% 0.2% 0.5% 1.1%
Table D-3: Average age of first use of:
All
Marijuana
12.2Cocaine
13.3
Crack
*
Hallucinogens
13.7
Uppers
13.1
Downers
13.4
Rohypnol
*Steroids
*
Ecstasy
14.0
Heroin
13.2
©Copyright 2010, Texas A&M University
All rights reserved.
Secondary Report-Page 9 of 49
8/6/2019 Ector County ISD - Nimitz Junior High School - 2010 Texas School Survey of Drug and Alcohol Use
http://slidepdf.com/reader/full/ector-county-isd-nimitz-junior-high-school-2010-texas-school-survey-of 10/49
Ector County ISD - Nimitz Junior High
SPRING 2010
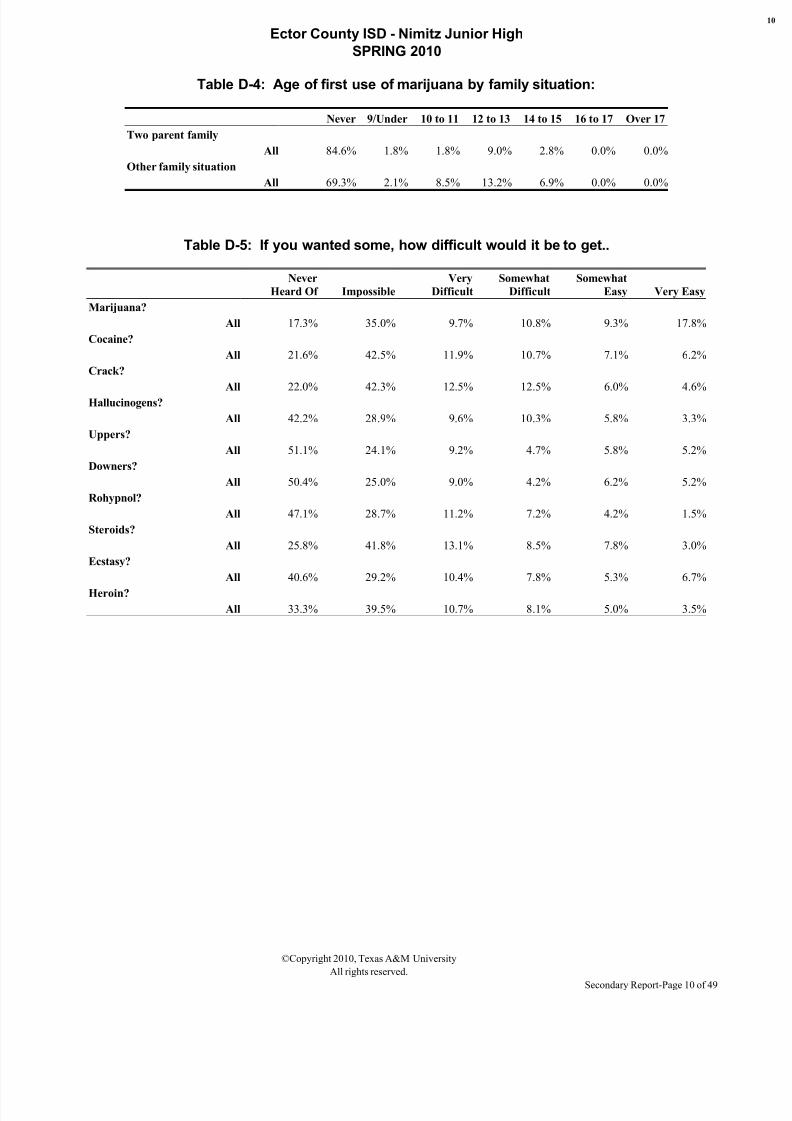
Table D-4: Age of first use of marijuana by family situation:
Never 9/Under 10 to 11 12 to 13 14 to 15 16 to 17 Over 17
Two parent family
All 84.6% 1.8% 1.8% 9.0% 2.8% 0.0% 0.0%
Other family situation
All 69.3% 2.1% 8.5% 13.2% 6.9% 0.0% 0.0%
Table D-5: If you wanted some, how difficult would it be to get..
Never
Heard Of Impossible
Very
Difficult
Somewhat
Difficult
Somewhat
Easy Very Easy
Marijuana?
All 17.3% 35.0% 9.7% 10.8% 9.3% 17.8%
Cocaine?
All 21.6% 42.5% 11.9% 10.7% 7.1% 6.2%
Crack?
All 22.0% 42.3% 12.5% 12.5% 6.0% 4.6%Hallucinogens?
All 42.2% 28.9% 9.6% 10.3% 5.8% 3.3%
Uppers?
All 51.1% 24.1% 9.2% 4.7% 5.8% 5.2%
Downers?
All 50.4% 25.0% 9.0% 4.2% 6.2% 5.2%
Rohypnol?
All 47.1% 28.7% 11.2% 7.2% 4.2% 1.5%
Steroids?
All 25.8% 41.8% 13.1% 8.5% 7.8% 3.0%
Ecstasy?
All 40.6% 29.2% 10.4% 7.8% 5.3% 6.7%
Heroin?
All 33.3% 39.5% 10.7% 8.1% 5.0% 3.5%
©Copyright 2010, Texas A&M University
All rights reserved.
Secondary Report-Page 10 of 49

8/6/2019 Ector County ISD - Nimitz Junior High School - 2010 Texas School Survey of Drug and Alcohol Use
http://slidepdf.com/reader/full/ector-county-isd-nimitz-junior-high-school-2010-texas-school-survey-of 11/49
Ector County ISD - Nimitz Junior High
SPRING 2010
Table D-6: Since school began in the fall, on how many days (if any) have you..
None 1-3 Times 4-9 Times 10+ Times
Attended class while high from marijuana use?
All 88.8% 7.3% 1.3% 2.6%
Attended class while high from use of some other drug?
All 94.0% 4.6% 1.2% 0.2%
Gotten into trouble with teachers because of your drug use?
All 98.8% 1.2% 0.0% 0.0%
Table D-7: School year use of marijuana by absences and conduct problems:
Average days absent due to
illness or other reasons
Marijuana Users: 4.3
Marijuana Non-use 4.4
Average days conduct problems
reported
Marijuana Users: 2.6
Marijuana Non-use 1.1
Table D-8: During the past twelve months, how many times have you..
None 1-3 Times 4-9 Times 10+ Times
Driven a car when you've felt high from drugs?
All 94.8% 3.4% 1.7% 0.0%
Gotten into trouble with the police because of drug use?All 97.3% 2.7% 0.0% 0.0%
©Copyright 2010, Texas A&M University
All rights reserved.
Secondary Report-Page 11 of 49

8/6/2019 Ector County ISD - Nimitz Junior High School - 2010 Texas School Survey of Drug and Alcohol Use
http://slidepdf.com/reader/full/ector-county-isd-nimitz-junior-high-school-2010-texas-school-survey-of 12/49
Ector County ISD - Nimitz Junior High
SPRING 2010
Table D-9: About how many of your close friends use marijuana?
None A Few Some Most ALL
All 54.0% 20.6% 9.7% 10.9% 4.8%
Table D-10: During the past twelve months, how many times have you..
None 1-3 Times 4-9 Times 10+ Times
Had difficulties of any kind with your friends because of your drug use?
All 95.1% 3.8% 1.1% 0.0%
Been criticized by someone you were dating because of drug use?
All 94.6% 4.9% 0.5% 0.0%
Table D-11: Thinking of parties you attended this school year, how often were
marijuana and/or other drugs used?
Never Seldom
Half
the Time
Most
of the Time Always Don't know
Didn't
attend
All 62.5% 8.3% 7.8% 5.9% 4.3% 1.9% 9.3%
Table D-12: How often, if ever, do you smoke marijuana in..
CATEGORY Never Seldom
Half
the Time
Most of
the Time Always Don't know
Joints? All 78.4% 9.1% 4.3% 5.9% 1.7% 0.5%
Blunts? All 81.8% 4.9% 3.5% 4.6% 4.6% 0.5%
Bongs or water pipes? All 85.0% 6.8% 3.3% 1.5% 2.9% 0.5%
Pipes? All 82.3% 6.7% 4.4% 3.2% 2.9% 0.5%
Some other way? All 85.9% 5.1% 2.7% 3.6% 0.9% 1.9%
©Copyright 2010, Texas A&M University
All rights reserved.
Secondary Report-Page 12 of 49
8/6/2019 Ector County ISD - Nimitz Junior High School - 2010 Texas School Survey of Drug and Alcohol Use
http://slidepdf.com/reader/full/ector-county-isd-nimitz-junior-high-school-2010-texas-school-survey-of 13/49
Ector County ISD - Nimitz Junior High
SPRING 2010
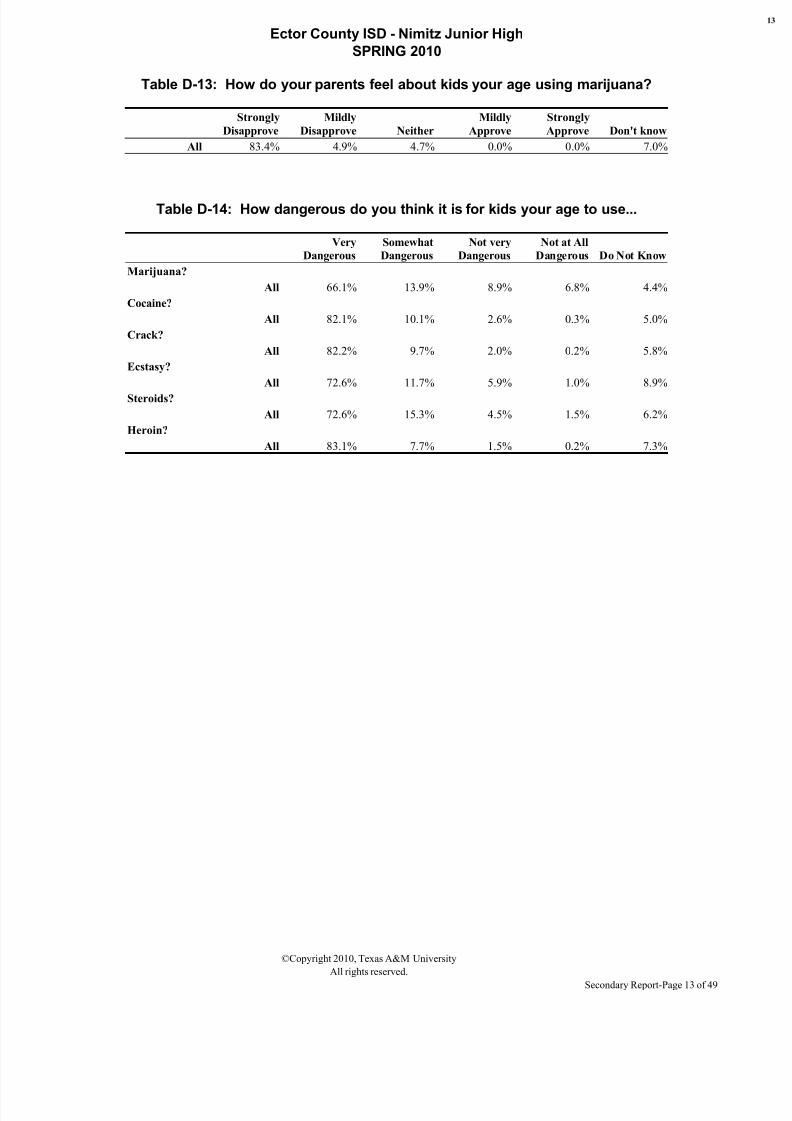
Table D-13: How do your parents feel about kids your age using marijuana?
Strongly
Disapprove
Mildly
Disapprove Neither
Mildly
Approve
Strongly
Approve Don't know
All 83.4% 4.9% 4.7% 0.0% 0.0% 7.0%
Table D-14: How dangerous do you think it is for kids your age to use...
Very
Dangerous
Somewhat
Dangerous
Not very
Dangerous
Not at All
Dangerous Do Not Know
Marijuana?
All 66.1% 13.9% 8.9% 6.8% 4.4%
Cocaine?
All 82.1% 10.1% 2.6% 0.3% 5.0%
Crack?
All 82.2% 9.7% 2.0% 0.2% 5.8%
Ecstasy?
All 72.6% 11.7% 5.9% 1.0% 8.9%
Steroids?
All 72.6% 15.3% 4.5% 1.5% 6.2%
Heroin?
All 83.1% 7.7% 1.5% 0.2% 7.3%
©Copyright 2010, Texas A&M University
All rights reserved.
Secondary Report-Page 13 of 49

8/6/2019 Ector County ISD - Nimitz Junior High School - 2010 Texas School Survey of Drug and Alcohol Use
http://slidepdf.com/reader/full/ector-county-isd-nimitz-junior-high-school-2010-texas-school-survey-of 14/49
Ector County ISD - Nimitz Junior High
SPRING 2010
Table D-15: How recently, if ever, have you taken...
Past
Month
School
Year
Ever
Used
Never
Used
Methamphetamine?
All 1.2% 1.9% 4.7% 95.3%
Table D-16: How recently, if ever, have you taken the following PRESCRIPTION DRUGS...
Past
Month
School
Year
Ever
Used
Never
Used
Codeine?
All 5.6% 12.4% 16.1% 83.9%
Oxycontin, Percodan or Percocet?
All 0.8% 2.3% 5.2% 94.8%
Vicodin, Lortab or Lorcet?
All 1.3% 3.5% 5.2% 94.8%
Valium or Diazepam?
All 0.7% 2.3% 2.8% 97.2%
Xanax or Alprazolam?
All 1.2% 3.1% 4.7% 95.3%
Table D-17: How recently, if ever, have you taken the following OVER-THE COUNTER drugs...
Past
Month
School
Year
Ever
Used
Never
Used
DXM, Triple C?
All 0.5% 2.8% 7.0% 93.0%
©Copyright 2010, Texas A&M University
All rights reserved.
Secondary Report-Page 14 of 49

8/6/2019 Ector County ISD - Nimitz Junior High School - 2010 Texas School Survey of Drug and Alcohol Use
http://slidepdf.com/reader/full/ector-county-isd-nimitz-junior-high-school-2010-texas-school-survey-of 15/49
Ector County ISD - Nimitz Junior High
SPRING 2010
Table I-1: How recently, if ever, have you used...
Past
Month
School
Year
Ever
Used
Never
Used
Spray paint?
All 1.9% 3.1% 6.2% 93.8%
Whiteout,correction fld?
All 2.6% 5.0% 11.8% 88.2%Computer dusting sprays?
All 1.3% 3.2% 5.5% 94.5%
Helium,butane,propane,whippets,freon?
All 3.4% 5.2% 12.4% 87.6%
Glue?
All 0.5% 1.7% 3.7% 96.3%
Toluene,paint thinner,other solvents?
All 0.5% 1.3% 2.4% 97.6%
Gasoline,octane booster,carburetor cleaner?
All 1.8% 2.6% 4.7% 95.3%
Other aerosols/sprays?
All 2.8% 3.7% 5.6% 94.4%
Any inhalant?
All 10.2% 12.6% 23.5% 76.5%
Table I-2: How often do you normally use inhalants?
Never
Used
Every
Day
Several
Times a
Week
Several
Times a
Month
About
Once a
Month
About
Once a
Year
Less than
Once a
Year
All 92.2% 0.0% 0.7% 1.5% 1.5% 1.4% 2.7%
I-3: Number of different kinds of inhalants used
None One Two to Three Four Plus
All 76.7% 10.3% 8.1% 4.9%
©Copyright 2010, Texas A&M University
All rights reserved.
Secondary Report-Page 15 of 49

8/6/2019 Ector County ISD - Nimitz Junior High School - 2010 Texas School Survey of Drug and Alcohol Use
http://slidepdf.com/reader/full/ector-county-isd-nimitz-junior-high-school-2010-texas-school-survey-of 16/49
Ector County ISD - Nimitz Junior High
SPRING 2010
Table I-4: Average age of first use of:
All
Inhalants
12.0
Table I-5: Since school began in the fall, on how many days (if any) have youattended class while high from inhalant use?
None 1-3 Times 4-9 Times 10+ Times
All 97.2% 2.4% 0.5% 0.0%
Table I-6: School year use of inhalants by absences and conduct problems:
Average days absent due toillness or other reasons
Inhalants Users: 4.5
Inhalants Non-use 4.3
Average days conduct problems
reported
Inhalants Users: 3.2
Inhalants Non-use 1.1
©Copyright 2010, Texas A&M University
All rights reserved.
Secondary Report-Page 16 of 49

8/6/2019 Ector County ISD - Nimitz Junior High School - 2010 Texas School Survey of Drug and Alcohol Use
http://slidepdf.com/reader/full/ector-county-isd-nimitz-junior-high-school-2010-texas-school-survey-of 17/49
Ector County ISD - Nimitz Junior High
SPRING 2010
Table I-7: About how many of your close friends use inhalants?
None A Few Some Most ALL
All 75.8% 17.4% 5.1% 1.7% 0.0%
Table I-8: How dangerous do you think it is for kids your age to use inhalants?
Very
Dangerous
Somewhat
Dangerous
Not very
Dangerous
Not at All
Dangerous Do Not Know
All 70.4% 17.6% 4.2% 2.5% 5.2%
Table I-9: If you wanted some, how difficult would it be to get..
NeverHeard Of Impossible VeryDifficult SomewhatDifficult SomewhatEasy Very Easy
Inhalants?
All 21.8% 22.7% 7.5% 10.1% 10.7% 27.2%
©Copyright 2010, Texas A&M University
All rights reserved.
Secondary Report-Page 17 of 49

8/6/2019 Ector County ISD - Nimitz Junior High School - 2010 Texas School Survey of Drug and Alcohol Use
http://slidepdf.com/reader/full/ector-county-isd-nimitz-junior-high-school-2010-texas-school-survey-of 18/49
Ector County ISD - Nimitz Junior High
SPRING 2010
Table X-1: Since school began in the fall, have you gotten any informationon drugs or alcohol from the following sources?
CATEGORY Yes
A school health class All 46.0%
An assembly program All 44.3%
Guidance counselor All 21.6%
Science class All 28.4%
Social studies class All 10.8%
Student group session All 14.5%
An invited school guest All 34.9%
Another source at school All 40.0%
Any school source All 61.1%
Table X-2: If you had a drug or alcohol problem and needed help, who would you go to?
CATEGORY Yes
Counselor/program in-school All 30.7%Another adult in school All 28.9%
Counselor/program outside-school All 36.8%
Your parents All 59.6%
A medical doctor All 38.1%
Your friends All 65.6%
Another adult All 57.9%
Table X-3: Since school began in the fall, have you sought help, other thanfrom family or friends, for problems in any way connected with your use of
alcohol, marijuana, or other drugs?
CATEGORY Yes
Seek Help All 8.9%
©Copyright 2010, Texas A&M University
All rights reserved.
Secondary Report-Page 18 of 49
8/6/2019 Ector County ISD - Nimitz Junior High School - 2010 Texas School Survey of Drug and Alcohol Use
http://slidepdf.com/reader/full/ector-county-isd-nimitz-junior-high-school-2010-texas-school-survey-of 19/49
Ector County ISD - Nimitz Junior High
SPRING 2010
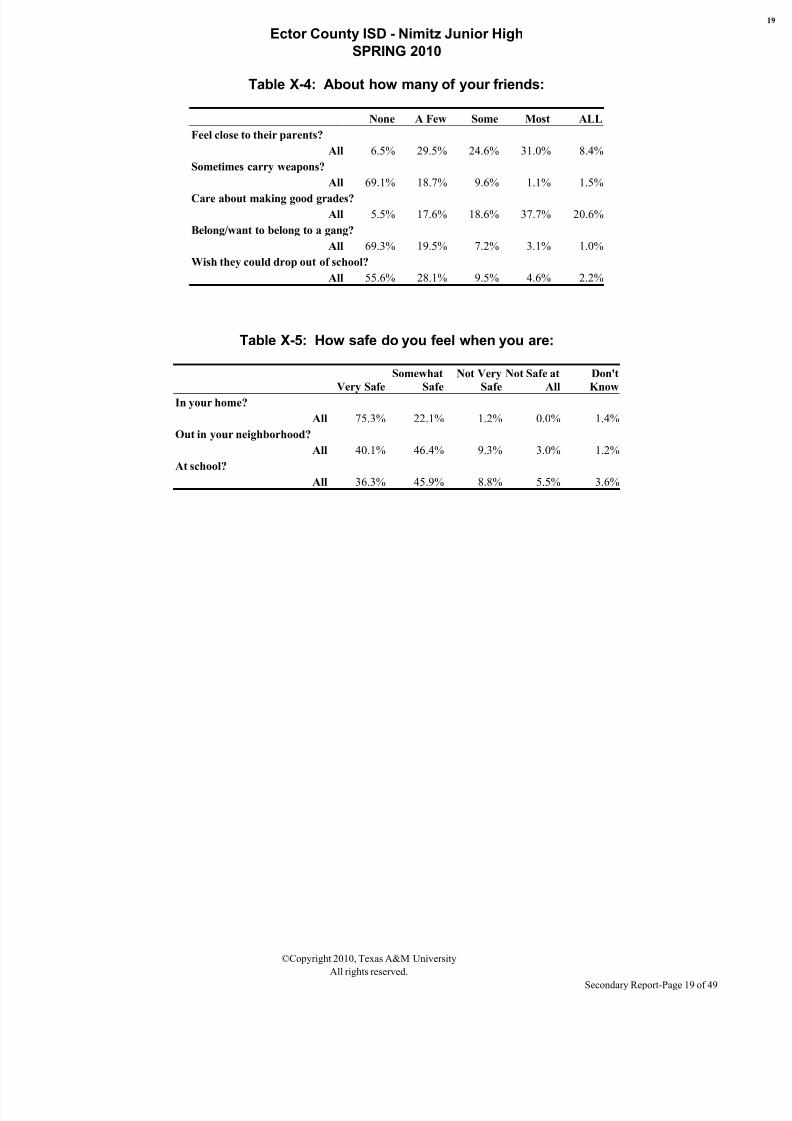
Table X-4: About how many of your friends:
None A Few Some Most ALL
Feel close to their parents?
All 6.5% 29.5% 24.6% 31.0% 8.4%
Sometimes carry weapons?
All 69.1% 18.7% 9.6% 1.1% 1.5%
Care about making good grades?
All 5.5% 17.6% 18.6% 37.7% 20.6%
Belong/want to belong to a gang?
All 69.3% 19.5% 7.2% 3.1% 1.0%
Wish they could drop out of school?
All 55.6% 28.1% 9.5% 4.6% 2.2%
Table X-5: How safe do you feel when you are:
Very Safe
Somewhat
Safe
Not Very
Safe
Not Safe at
All
Don't
KnowIn your home?
All 75.3% 22.1% 1.2% 0.0% 1.4%
Out in your neighborhood?
All 40.1% 46.4% 9.3% 3.0% 1.2%
At school?
All 36.3% 45.9% 8.8% 5.5% 3.6%
©Copyright 2010, Texas A&M University
All rights reserved.
Secondary Report-Page 19 of 49

8/6/2019 Ector County ISD - Nimitz Junior High School - 2010 Texas School Survey of Drug and Alcohol Use
http://slidepdf.com/reader/full/ector-county-isd-nimitz-junior-high-school-2010-texas-school-survey-of 20/49
Ector County ISD - Nimitz Junior High
SPRING 2010
Table B1: Prevalence and recency of use of selected substances by gradeAll students
Past
Month
School
Year
Ever
Used
Never
Used
Tobacco
All 6.5% 13.1% 29.2% 70.8%
AlcoholAll 25.5% 37.7% 64.2% 35.8%
Inhalants
All 10.2% 12.6% 23.5% 76.5%
Any Illicit Drug
All 11.9% 16.1% 25.6% 74.4%
Marijuana & Other Illicit Drug
All 10.4% 14.2% 23.2% 76.8%
Marijuana Only
All 3.4% 5.0% 11.0% 89.0%
Cocaine or Crack
All 1.0% 2.0% 4.4% 95.6%
Cocaine
All 1.0% 2.0% 3.9% 96.1%
Crack
All 1.0% 1.6% 2.8% 97.2%
Hallucinogens
All 1.5% 1.8% 3.3% 96.7%
Uppers
All 1.2% 2.8% 3.7% 96.3%
Downers
All 2.6% 3.1% 4.1% 95.9%
Rohypnol
All 0.8% 1.3% 2.3% 97.7%
Steroids
All 0.4% 1.0% 1.5% 98.5%
Ecstasy
All 0.5% 1.0% 5.5% 94.5%
Heroin
All 0.0% 1.5% 1.7% 98.3%
©Copyright 2010, Texas A&M University
All rights reserved.
Secondary Report-Page 20 of 49

8/6/2019 Ector County ISD - Nimitz Junior High School - 2010 Texas School Survey of Drug and Alcohol Use
http://slidepdf.com/reader/full/ector-county-isd-nimitz-junior-high-school-2010-texas-school-survey-of 21/49
Ector County ISD - Nimitz Junior High
SPRING 2010
Table B2: Prevalence and recency of use of selected substances by gradeMale students
Past
Month
School
Year
Ever
Used
Never
Used
Tobacco
All 7.5% 13.8% 32.6% 67.4%
AlcoholAll 27.3% 41.7% 64.8% 35.2%
Inhalants
All 11.4% 15.8% 25.6% 74.4%
Any Illicit Drug
All 15.3% 18.8% 30.6% 69.4%
Marijuana & Other Illicit Drug
All 12.2% 14.9% 28.2% 71.8%
Marijuana Only
All 5.0% 5.5% 16.2% 83.8%
Cocaine or Crack
All 1.1% 2.3% 4.9% 95.1%
Cocaine
All 1.1% 2.3% 4.9% 95.1%
Crack
All 1.2% 2.3% 3.5% 96.5%
Hallucinogens
All 2.3% 2.3% 4.4% 95.6%
Uppers
All 1.0% 2.1% 3.1% 96.9%
Downers
All 4.5% 4.5% 5.6% 94.4%
Rohypnol
All 1.2% 2.4% 3.6% 96.4%
Steroids
All 1.0% 2.2% 3.4% 96.6%
Ecstasy
All 1.2% 2.3% 6.8% 93.2%
Heroin
All 0.0% 3.3% 3.9% 96.1%
©Copyright 2010, Texas A&M University
All rights reserved.
Secondary Report-Page 21 of 49

8/6/2019 Ector County ISD - Nimitz Junior High School - 2010 Texas School Survey of Drug and Alcohol Use
http://slidepdf.com/reader/full/ector-county-isd-nimitz-junior-high-school-2010-texas-school-survey-of 22/49
Ector County ISD - Nimitz Junior High
SPRING 2010
Table B3: Prevalence and recency of use of selected substances by gradeFemale students
Past
Month
School
Year
Ever
Used
Never
Used
Tobacco
All 5.7% 12.6% 26.6% 73.4%
AlcoholAll 24.1% 34.5% 63.8% 36.2%
Inhalants
All 9.2% 10.0% 21.8% 78.2%
Any Illicit Drug
All 9.2% 13.9% 21.6% 78.4%
Marijuana & Other Illicit Drug
All 8.9% 13.7% 19.2% 80.8%
Marijuana Only
All 2.1% 4.5% 6.9% 93.1%
Cocaine or Crack
All 0.9% 1.9% 3.9% 96.1%
Cocaine
All 0.9% 1.9% 3.1% 96.9%
Crack
All 0.9% 0.9% 2.2% 97.8%
Hallucinogens
All 0.9% 1.4% 2.3% 97.7%
Uppers
All 1.4% 3.3% 4.2% 95.8%
Downers
All 1.0% 1.9% 2.9% 97.1%
Rohypnol
All 0.4% 0.4% 1.3% 98.7%
Steroids
All 0.0% 0.0% 0.0% 100.0%
Ecstasy
All 0.0% 0.0% 4.5% 95.5%
Heroin
All 0.0% 0.0% 0.0% 100.0%
©Copyright 2010, Texas A&M University
All rights reserved.
Secondary Report-Page 22 of 49

8/6/2019 Ector County ISD - Nimitz Junior High School - 2010 Texas School Survey of Drug and Alcohol Use
http://slidepdf.com/reader/full/ector-county-isd-nimitz-junior-high-school-2010-texas-school-survey-of 23/49
Ector County ISD - Nimitz Junior High
SPRING 2010
Table B4: Prevalence and recency of use of selected substances by gradeWhite students
Past
Month
School
Year
Ever
Used
Never
Used
Tobacco
All 7.0% 12.2% 27.6% 72.4%
AlcoholAll 21.9% 33.4% 51.4% 48.6%
Inhalants
All 6.1% 8.0% 21.0% 79.0%
Any Illicit Drug
All 7.9% 13.5% 17.2% 82.8%
Marijuana & Other Illicit Drug
All 6.6% 11.2% 15.7% 84.3%
Marijuana Only
All 1.1% 1.1% 2.9% 97.1%
Cocaine or Crack
All 0.0% 1.4% 3.2% 96.8%
Cocaine
All 0.0% 1.4% 3.2% 96.8%
Crack
All 0.0% 0.0% 0.7% 99.3%
Hallucinogens
All 0.0% 0.0% 3.9% 96.1%
Uppers
All 1.4% 4.2% 5.4% 94.6%
Downers
All 2.8% 4.2% 5.4% 94.6%
Rohypnol
All 0.0% 0.0% 2.1% 97.9%
Steroids
All 0.0% 0.0% 0.0% 100.0%
Ecstasy
All 0.0% 0.0% 4.0% 96.0%
Heroin
All 0.0% 1.2% 1.2% 98.8%
©Copyright 2010, Texas A&M University
All rights reserved.
Secondary Report-Page 23 of 49

8/6/2019 Ector County ISD - Nimitz Junior High School - 2010 Texas School Survey of Drug and Alcohol Use
http://slidepdf.com/reader/full/ector-county-isd-nimitz-junior-high-school-2010-texas-school-survey-of 24/49
Ector County ISD - Nimitz Junior High
SPRING 2010
Table B5: Prevalence and recency of use of selected substances by gradeBlack students
Past
Month
School
Year
Ever
Used
Never
Used
Tobacco
All 7.1% 7.1% 54.7% 45.3%
AlcoholAll 34.4% 34.4% 78.9% 21.1%
Inhalants
All 9.7% 16.3% 31.7% 68.3%
Any Illicit Drug
All 32.2% 32.2% 54.2% 45.8%
Marijuana & Other Illicit Drug
All 25.6% 25.6% 54.2% 45.8%
Marijuana Only
All 12.3% 12.3% 22.0% 78.0%
Cocaine or Crack
All 0.0% 6.6% 6.6% 93.4%
Cocaine
All 0.0% 6.6% 6.6% 93.4%
Crack
All 0.0% 6.6% 6.6% 93.4%
Hallucinogens
All 13.2% 13.2% 13.2% 86.8%
Uppers
All 0.0% 6.6% 13.2% 86.8%
Downers
All 7.3% 7.3% 14.7% 85.3%
Rohypnol
All 7.1% 7.1% 7.1% 92.9%
Steroids
All 0.0% 6.6% 6.6% 93.4%
Ecstasy
All 6.6% 13.2% 25.6% 74.4%
Heroin
All 0.0% 13.2% 13.2% 86.8%
©Copyright 2010, Texas A&M University
All rights reserved.
Secondary Report-Page 24 of 49
8/6/2019 Ector County ISD - Nimitz Junior High School - 2010 Texas School Survey of Drug and Alcohol Use
http://slidepdf.com/reader/full/ector-county-isd-nimitz-junior-high-school-2010-texas-school-survey-of 25/49
Ector County ISD - Nimitz Junior High
SPRING 2010
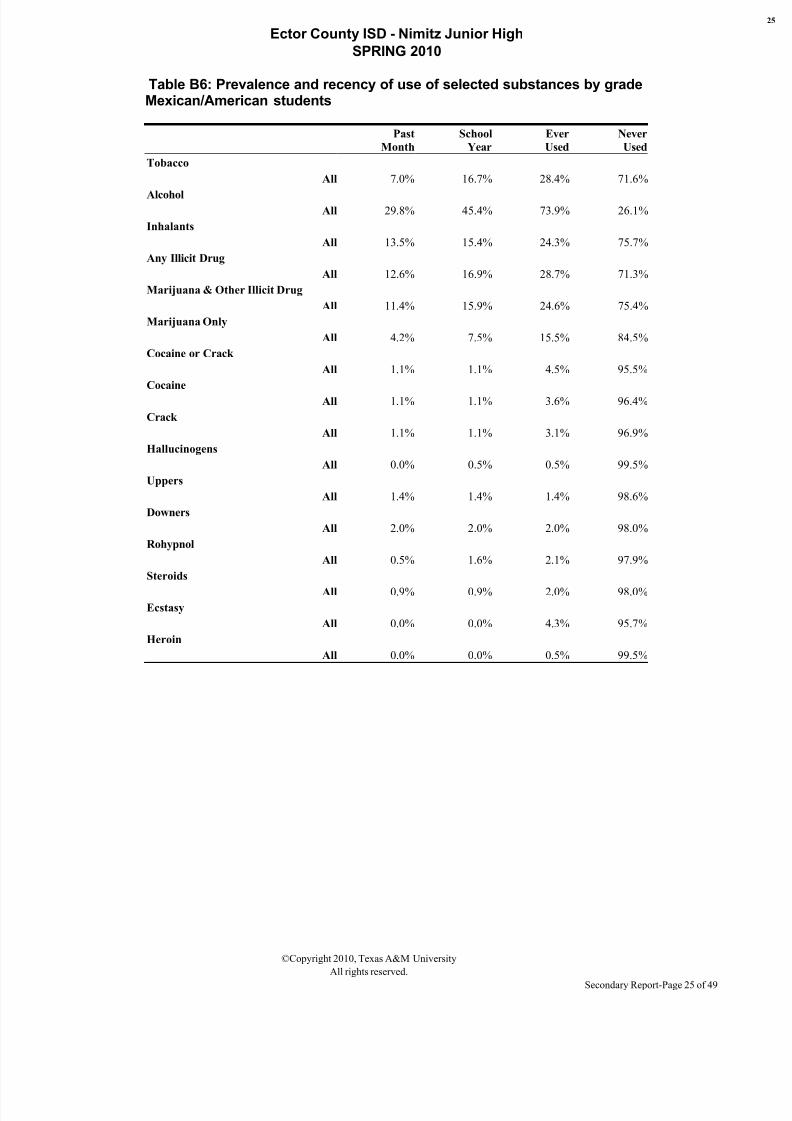
Table B6: Prevalence and recency of use of selected substances by gradeMexican/American students
Past
Month
School
Year
Ever
Used
Never
Used
Tobacco
All 7.0% 16.7% 28.4% 71.6%
AlcoholAll 29.8% 45.4% 73.9% 26.1%
Inhalants
All 13.5% 15.4% 24.3% 75.7%
Any Illicit Drug
All 12.6% 16.9% 28.7% 71.3%
Marijuana & Other Illicit Drug
All 11.4% 15.9% 24.6% 75.4%
Marijuana Only
All 4.2% 7.5% 15.5% 84.5%
Cocaine or Crack
All 1.1% 1.1% 4.5% 95.5%
Cocaine
All 1.1% 1.1% 3.6% 96.4%
Crack
All 1.1% 1.1% 3.1% 96.9%
Hallucinogens
All 0.0% 0.5% 0.5% 99.5%
Uppers
All 1.4% 1.4% 1.4% 98.6%
Downers
All 2.0% 2.0% 2.0% 98.0%
Rohypnol
All 0.5% 1.6% 2.1% 97.9%
Steroids
All 0.9% 0.9% 2.0% 98.0%
Ecstasy
All 0.0% 0.0% 4.3% 95.7%
Heroin
All 0.0% 0.0% 0.5% 99.5%
©Copyright 2010, Texas A&M University
All rights reserved.
Secondary Report-Page 25 of 49

8/6/2019 Ector County ISD - Nimitz Junior High School - 2010 Texas School Survey of Drug and Alcohol Use
http://slidepdf.com/reader/full/ector-county-isd-nimitz-junior-high-school-2010-texas-school-survey-of 26/49
Ector County ISD - Nimitz Junior High
SPRING 2010
Table B7: Prevalence and recency of use of selected substances by gradeStudents reporting A grades
Past
Month
School
Year
Ever
Used
Never
Used
Tobacco
All 4.0% 8.1% 14.0% 86.0%
AlcoholAll 15.9% 22.6% 47.5% 52.5%
Inhalants
All 4.7% 5.6% 16.9% 83.1%
Any Illicit Drug
All 4.0% 6.0% 9.0% 91.0%
Marijuana & Other Illicit Drug
All 4.0% 6.0% 9.0% 91.0%
Marijuana Only
All 0.0% 2.0% 2.9% 97.1%
Cocaine or Crack
All 0.0% 0.0% 0.0% 100.0%
Cocaine
All 0.0% 0.0% 0.0% 100.0%
Crack
All 0.0% 0.0% 0.0% 100.0%
Hallucinogens
All 0.0% 0.0% 0.0% 100.0%
Uppers
All 0.0% 4.1% 4.1% 95.9%
Downers
All 2.1% 4.1% 4.1% 95.9%
Rohypnol
All 0.0% 0.0% 0.0% 100.0%
Steroids
All 0.0% 0.0% 0.0% 100.0%
Ecstasy
All 0.0% 0.0% 0.0% 100.0%
Heroin
All 0.0% 0.0% 0.0% 100.0%
©Copyright 2010, Texas A&M University
All rights reserved.
Secondary Report-Page 26 of 49

8/6/2019 Ector County ISD - Nimitz Junior High School - 2010 Texas School Survey of Drug and Alcohol Use
http://slidepdf.com/reader/full/ector-county-isd-nimitz-junior-high-school-2010-texas-school-survey-of 27/49
Ector County ISD - Nimitz Junior High
SPRING 2010
Table B8: Prevalence and recency of use of selected substances by gradeStudents reporting grades lower than A
Past
Month
School
Year
Ever
Used
Never
Used
Tobacco
All 6.8% 14.4% 33.6% 66.4%
AlcoholAll 28.5% 42.2% 69.7% 30.3%
Inhalants
All 12.2% 15.1% 25.5% 74.5%
Any Illicit Drug
All 13.5% 18.4% 30.3% 69.7%
Marijuana & Other Illicit Drug
All 11.5% 16.0% 27.2% 72.8%
Marijuana Only
All 4.6% 6.0% 14.0% 86.0%
Cocaine or Crack
All 1.4% 2.8% 5.9% 94.1%
Cocaine
All 1.4% 2.8% 5.3% 94.7%
Crack
All 1.4% 2.1% 3.8% 96.2%
Hallucinogens
All 2.1% 2.4% 4.4% 95.6%
Uppers
All 1.0% 1.7% 3.0% 97.0%
Downers
All 2.2% 2.2% 3.5% 96.5%
Rohypnol
All 1.0% 1.7% 3.1% 96.9%
Steroids
All 0.6% 1.3% 2.0% 98.0%
Ecstasy
All 0.7% 1.4% 6.8% 93.2%
Heroin
All 0.0% 2.0% 2.3% 97.7%
©Copyright 2010, Texas A&M University
All rights reserved.
Secondary Report-Page 27 of 49

8/6/2019 Ector County ISD - Nimitz Junior High School - 2010 Texas School Survey of Drug and Alcohol Use
http://slidepdf.com/reader/full/ector-county-isd-nimitz-junior-high-school-2010-texas-school-survey-of 28/49
Ector County ISD - Nimitz Junior High
SPRING 2010
Table B9: Prevalence and recency of use of selected substances by gradeStudents living with two parents
Past
Month
School
Year
Ever
Used
Never
Used
Tobacco
All 3.6% 9.5% 19.5% 80.5%
AlcoholAll 21.8% 32.2% 58.8% 41.2%
Inhalants
All 10.5% 11.9% 23.2% 76.8%
Any Illicit Drug
All 8.8% 11.9% 17.9% 82.1%
Marijuana & Other Illicit Drug
All 7.2% 9.5% 15.3% 84.7%
Marijuana Only
All 1.2% 2.5% 6.9% 93.1%
Cocaine or Crack
All 1.9% 2.8% 4.6% 95.4%
Cocaine
All 1.9% 2.8% 3.8% 96.2%
Crack
All 1.9% 1.9% 3.7% 96.3%
Hallucinogens
All 0.9% 1.4% 1.4% 98.6%
Uppers
All 1.0% 1.9% 1.9% 98.1%
Downers
All 1.9% 2.8% 2.8% 97.2%
Rohypnol
All 0.0% 0.9% 1.4% 98.6%
Steroids
All 0.0% 0.0% 0.0% 100.0%
Ecstasy
All 0.0% 0.0% 2.8% 97.2%
Heroin
All 0.0% 0.8% 0.8% 99.2%
©Copyright 2010, Texas A&M University
All rights reserved.
Secondary Report-Page 28 of 49

8/6/2019 Ector County ISD - Nimitz Junior High School - 2010 Texas School Survey of Drug and Alcohol Use
http://slidepdf.com/reader/full/ector-county-isd-nimitz-junior-high-school-2010-texas-school-survey-of 29/49
Ector County ISD - Nimitz Junior High
SPRING 2010
Table B10: Prevalence and recency of use of selected substances by gradeStudents not living with two parents
Past
Month
School
Year
Ever
Used
Never
Used
Tobacco
All 9.9% 17.5% 41.1% 58.9%
AlcoholAll 30.1% 44.5% 70.9% 29.1%
Inhalants
All 9.7% 13.4% 23.8% 76.2%
Any Illicit Drug
All 15.6% 21.2% 35.0% 65.0%
Marijuana & Other Illicit Drug
All 14.3% 19.9% 32.6% 67.4%
Marijuana Only
All 6.0% 7.9% 16.1% 83.9%
Cocaine or Crack
All 0.0% 1.1% 4.1% 95.9%
Cocaine
All 0.0% 1.1% 4.1% 95.9%
Crack
All 0.0% 1.1% 1.7% 98.3%
Hallucinogens
All 2.3% 2.3% 5.5% 94.5%
Uppers
All 1.5% 3.7% 5.8% 94.2%
Downers
All 3.4% 3.4% 5.6% 94.4%
Rohypnol
All 1.7% 1.7% 3.4% 96.6%
Steroids
All 1.0% 2.2% 3.3% 96.7%
Ecstasy
All 1.1% 2.3% 8.9% 91.1%
Heroin
All 0.0% 2.3% 2.9% 97.1%
©Copyright 2010, Texas A&M University
All rights reserved.
Secondary Report-Page 29 of 49

8/6/2019 Ector County ISD - Nimitz Junior High School - 2010 Texas School Survey of Drug and Alcohol Use
http://slidepdf.com/reader/full/ector-county-isd-nimitz-junior-high-school-2010-texas-school-survey-of 30/49
Ector County ISD - Nimitz Junior High
SPRING 2010
Table B11: Prevalence and recency of use of selected substances by gradeStudents would seek help from adults for substance abuse problems
Past
Month
School
Year
Ever
Used
Never
Used
Tobacco
All 5.3% 9.9% 23.3% 76.7%
AlcoholAll 21.9% 34.0% 59.3% 40.7%
Inhalants
All 8.1% 10.0% 19.4% 80.6%
Any Illicit Drug
All 11.2% 14.6% 22.1% 77.9%
Marijuana & Other Illicit Drug
All 9.0% 11.9% 19.4% 80.6%
Marijuana Only
All 2.5% 3.7% 8.7% 91.3%
Cocaine or Crack
All 1.3% 2.7% 3.6% 96.4%
Cocaine
All 1.3% 2.7% 3.6% 96.4%
Crack
All 1.4% 2.0% 2.4% 97.6%
Hallucinogens
All 2.0% 2.0% 3.4% 96.6%
Uppers
All 1.3% 2.6% 2.6% 97.4%
Downers
All 3.4% 3.4% 3.4% 96.6%
Rohypnol
All 1.0% 1.0% 2.0% 98.0%
Steroids
All 0.0% 0.7% 0.7% 99.3%
Ecstasy
All 0.7% 1.4% 5.1% 94.9%
Heroin
All 0.0% 2.0% 2.3% 97.7%
©Copyright 2010, Texas A&M University
All rights reserved.
Secondary Report-Page 30 of 49

8/6/2019 Ector County ISD - Nimitz Junior High School - 2010 Texas School Survey of Drug and Alcohol Use
http://slidepdf.com/reader/full/ector-county-isd-nimitz-junior-high-school-2010-texas-school-survey-of 31/49

8/6/2019 Ector County ISD - Nimitz Junior High School - 2010 Texas School Survey of Drug and Alcohol Use
http://slidepdf.com/reader/full/ector-county-isd-nimitz-junior-high-school-2010-texas-school-survey-of 32/49
Ector County ISD - Nimitz Junior High
SPRING 2010
Table B13: Prevalence and recency of use of selected substances by gradeStudents living in town three years or less
Past
Month
School
Year
Ever
Used
Never
Used
Tobacco
All 5.5% 15.2% 33.9% 66.1%
AlcoholAll 26.6% 34.9% 65.8% 34.2%
Inhalants
All 7.8% 12.6% 21.3% 78.7%
Any Illicit Drug
All 11.4% 16.0% 26.9% 73.1%
Marijuana & Other Illicit Drug
All 10.4% 14.0% 24.1% 75.9%
Marijuana Only
All 3.8% 5.5% 12.9% 87.1%
Cocaine or Crack
All 0.0% 0.0% 1.9% 98.1%
Cocaine
All 0.0% 0.0% 1.9% 98.1%
Crack
All 0.0% 0.0% 1.9% 98.1%
Hallucinogens
All 1.3% 1.3% 3.9% 96.1%
Uppers
All 0.0% 0.0% 1.3% 98.7%
Downers
All 1.3% 1.3% 2.7% 97.3%
Rohypnol
All 1.3% 2.6% 4.5% 95.5%
Steroids
All 1.1% 2.5% 2.5% 97.5%
Ecstasy
All 0.0% 1.3% 6.5% 93.5%
Heroin
All 0.0% 2.4% 3.1% 96.9%
©Copyright 2010, Texas A&M University
All rights reserved.
Secondary Report-Page 32 of 49

8/6/2019 Ector County ISD - Nimitz Junior High School - 2010 Texas School Survey of Drug and Alcohol Use
http://slidepdf.com/reader/full/ector-county-isd-nimitz-junior-high-school-2010-texas-school-survey-of 33/49
Ector County ISD - Nimitz Junior High
SPRING 2010
Table B14: Prevalence and recency of use of selected substances by gradeStudents living in town more than three years
Past
Month
School
Year
Ever
Used
Never
Used
Tobacco
All 7.4% 12.2% 27.3% 72.7%
AlcoholAll 25.4% 40.8% 64.8% 35.2%
Inhalants
All 12.2% 13.0% 25.8% 74.2%
Any Illicit Drug
All 12.8% 16.8% 25.8% 74.2%
Marijuana & Other Illicit Drug
All 10.9% 15.0% 23.6% 76.4%
Marijuana Only
All 3.2% 4.8% 10.3% 89.7%
Cocaine or Crack
All 1.8% 3.6% 6.3% 93.7%
Cocaine
All 1.8% 3.6% 5.5% 94.5%
Crack
All 1.8% 2.7% 3.5% 96.5%
Hallucinogens
All 1.8% 2.2% 3.0% 97.0%
Uppers
All 2.1% 4.8% 5.6% 94.4%
Downers
All 3.5% 4.4% 5.2% 94.8%
Rohypnol
All 0.4% 0.4% 0.8% 99.2%
Steroids
All 0.0% 0.0% 0.9% 99.1%
Ecstasy
All 0.9% 0.9% 5.1% 94.9%
Heroin
All 0.0% 0.9% 0.9% 99.1%
©Copyright 2010, Texas A&M University
All rights reserved.
Secondary Report-Page 33 of 49

8/6/2019 Ector County ISD - Nimitz Junior High School - 2010 Texas School Survey of Drug and Alcohol Use
http://slidepdf.com/reader/full/ector-county-isd-nimitz-junior-high-school-2010-texas-school-survey-of 34/49
Ector County ISD - Nimitz Junior High
Spring 2010
The FREQ Procedure
GENDER
q1 Frequency Percent
Female 159 55.63
Male 127 44.37
GRADE
q2 Frequency Percent
Grade 7 91 31.96
Grade 8 98 34.27
Grade 9 97 33.77
LIVE WITH BOTH
PARENTS
q3 Frequency Percent
No 129 45.14
Yes 157 54.86
AGE
q4 Frequency Percent
12 34 12.04
13 91 31.87
14 103 36.13
15 49 16.97
16 9 2.98
ETHNICITY
q5 Frequency Percent
African/American 21 7.65
Asian/American 8 2.87
Mexican/American 137 48.75
Native/American 3 0.91
Other 4 1.58
White 107 38.24
Frequency Missing = 5.5634788453
ON AVERAGE WHAT
GRADES DO YOU GET
q6 Frequency Percent
Mostly A's 72 25.42
Mostly B's 143 50.58
Mostly C's 47 16.72
Mostly D's 14 4.88
Mostly F's 7 2.41
Frequency Missing = 3.3079048415
LENGTH OF TIME IN
THIS DISTRICT
q7 Frequency Percent
<1 year 52 18.77
2-3 years 61 21.92
>4 years 165 59.31
Frequency Missing = 8.4075863515
DO YOU HAVE A
JOB
q8 Frequency Percent
No 258 91.90
Yes 23 8.10
Frequency Missing = 4.7282380957
DO YOU GET ANALLOWANCE
q9 Frequency Percent
No 181 64.54
Yes 100 35.46
Frequency Missing = 5.3905072636
EITHER PARENT COLLEGE
GRADUATE
q10 Frequency Percent
Don't Know 63 22.35No 97 34.28
Yes 123 43.36
Frequency Missing = 2.6456356736
QUALIFY FOR
FREE/REDUCED PRICE
LUNCH
q11 Frequency Percen
Don't Know 74 26.1
No 139 49.05
Yes 70 24.83
Frequency Missing = 3.30790484
PARTICIPATE IN
SCHOOL ATHLETICS
q12a Frequency Percent
No 111 41.60
Yes 156 58.40
Frequency Missing = 18.4236547
PARTICIPATE IN
SCHOOL
BAND/ORCHESTRA
q12b Frequency Percent
No 152 57.40
Yes 113 42.60
Frequency Missing = 20.8963188
PARTICIPATE INSCHOOL CHOIR
q12c Frequency Percent
No 191 77.97
Yes 54 22.03
Frequency Missing = 41.0159554
PARTICIPATE IN
DRAMA/SPEECH/ART
CLUBS
q12d Frequency Percent
No 210 84.97
Yes 37 15.03
Frequency Missing = 39.422650
The frequencies have been weighted so that the analysis reflects
the distribution of students by grade level in the district
©Copyright 2010, Texas A&M University
All rights reserved.
Page 34 of 49

8/6/2019 Ector County ISD - Nimitz Junior High School - 2010 Texas School Survey of Drug and Alcohol Use
http://slidepdf.com/reader/full/ector-county-isd-nimitz-junior-high-school-2010-texas-school-survey-of 35/49
Ector County ISD - Nimitz Junior High
Spring 2010
PARTICIPATE IN DRILL
TEAM/CHEERLEADING
q12e Frequency Percent
No 237 98.00
Yes 5 2.00
Frequency Missing = 44.150888695
PARTICIPATE IN
STUDENT
GOVERNMENT
q12f Frequency Percent
No 236 96.78
Yes 8 3.22
Frequency Missing = 42.439729687
PARTICIPATE IN SCHOOL
NEWSPAPER/YEARBOOK
q12g Frequency Percent
No 241 97.78
Yes 5 2.22
Frequency Missing = 39.131824846
PARTICIPATE IN
ACADEMIC
CLUBS/SOCIETIES
q12h Frequency Percent
No 185 74.10
Yes 65 25.90
Frequency Missing = 36.118186756
PARTICIPATE IN
ACADEMIC
COMPETITION
GROUPS
q12i Frequency Percent
No 223 87.92
Yes 31 12.08
Frequency Missing = 32.320984328
PARTICIPATE IN
SCHOOL SERVICE
CLUBS
q12j Frequency Percent
No 241 97.25
Yes 7 2.75
Frequency Missing = 37.906522427
PARTICIPATE IN
OTHER SCHOOL
CLUBS OR GROUPS
q12k Frequency Percent
No 226 90.71
Yes 23 9.29
Frequency Missing = 36.777014926
PARTICIPATE IN
ATHLETIC TEAMS
OUTSIDE OF SCHOOL
q12l Frequency Percent
No 154 60.07
Yes 102 39.93
Frequency Missing = 29.576112738
PARTICIPATE IN
OTHER CLUBS OR
GROUPS OUTSIDE OF
SCHOOL
q12m Frequency Percent
No 194 76.18
Yes 61 23.82
Frequency Missing = 31.463684325
DO YOU FEEL SAFE IN YOUR
HOME
q13a Frequency Percent
Very Safe 214 75.33
Somewhat Safe 63 22.07
Not Very Safe 3 1.17
Don't Know 4 1.43
Frequency Missing = 2.08260242
DO YOU FEEL SAFE IN YOU
NEIGHBORHOO
q13b Frequency Perce
Very Safe 114 40.
Somewhat Safe 132 46.
Not Very Safe 26 9.
Not Safe At All 9 3.
Don't Know 4 1.
Frequency Missing = 2.08260242
DO YOU FEEL SAFE A
SCHOO
q13c Frequency Perce
Very Safe 103 36.
Somewhat Safe 130 45.
Not Very Safe 25 8.
Not Safe At All 16 5.
Don't Know 10 3.
Frequency Missing = 2.64563567
FRIENDS FEELING
CLOSE TO THEIR
PARENTS
q14a Frequency Percent
None 18 6.47
A Few 82 29.52
Some 69 24.64
Most 86 30.96
All 23 8.40
Frequency Missing = 7.17884293
HOW MANY FRIENDS
CARRY WEAPONS
q14b Frequency Percent
None 194 69.12
A Few 52 18.66Some 27 9.62
Most 3 1.15
All 4 1.45
The frequencies have been weighted so that the analysis reflects
the distribution of students by grade level in the district
©Copyright 2010, Texas A&M University
All rights reserved.
Page 35 of 49

8/6/2019 Ector County ISD - Nimitz Junior High School - 2010 Texas School Survey of Drug and Alcohol Use
http://slidepdf.com/reader/full/ector-county-isd-nimitz-junior-high-school-2010-texas-school-survey-of 36/49
Ector County ISD - Nimitz Junior High
Spring 2010
Frequency Missing = 5.9535405151
HOW MANY FRIENDS
CARE ABOUT GOOD
GRADES
q14c Frequency Percent
None 15 5.54
A Few 48 17.57
Some 51 18.60
Most 104 37.70
All 57 20.60
Frequency Missing = 11.149016944
HOW MANY FRIENDS
BELONG TO A GANG
q14d Frequency Percent
None 193 69.27
A Few 54 19.46
Some 20 7.19
Most 9 3.05
All 3 1.02
Frequency Missing = 7.6460812674
FRIENDS WISHING TO
DROP OUT OF
SCHOOL
q14e Frequency Percent
None 155 55.59A Few 78 28.11
Some 26 9.49
Most 13 4.61
All 6 2.21
Frequency Missing = 7.2780788508
PARENTS ATTEND
PTA/SCHOOL OPEN
HOUSES
q15 Frequency PercentNo 149 56.93
Yes 113 43.07
Frequency Missing = 24.384077307
RECENT INHALANT USE - SPRAY
PAINT
Q16A Frequency Percent
Never Heard/Used 266 93.83
In Your Lifetime 9 3.07
Since School Began 3 1.17
In the Past Month 5 1.94
Frequency Missing = 2.6456356736
RECENT INHALANT USE -
WHITEOUT, CORRECTION FLUID,
MAGIC MARKERS
Q16B Frequency Percent
Never Heard/Used 248 88.18
In Your Lifetime 19 6.84
Since School Began 7 2.35
In the Past Month 7 2.62
Frequency Missing = 4.5332072608
RECENT INHALANT USE -
COMPUTER DUSTING SPRAYS
Q16C Frequency Percent
Never Heard/Used 263 94.47
In Your Lifetime 7 2.37
Since School Began 5 1.90
In the Past Month 4 1.26
Frequency Missing = 7.2780788508
RECENT INHALANT USE - HELIUM,
BUTANE, PROPANE, WHIPPETS,
REFRIGERANTS/FREON
Q16D Frequency Percent
Never Heard/Used 248 87.62
In Your Lifetime 20 7.20
Since School Began 5 1.74
In the Past Month 10 3.43
Frequency Missing = 2.6456356736
RECENT INHALANT USE - GL
Q16E Frequency Per
Never Heard/Used 271 9
In Your Lifetime 6
Since School Began 3
In the Past Month 1
Frequency Missing = 5.09624051
RECENT INHALANT U
TOLUENE, PAINT THINN
OTHER SOLVE
Q16F Frequency Per
Never Heard/Used 273 9
In Your Lifetime 3
Since School Began 2
In the Past Month 1
Frequency Missing = 6.51657376
RECENT INHALANT U
GASOLINE, OCTANE BOOST
CARBURETOR CLEAN
Q16G Frequency Per
Never Heard/Used 269 9
In Your Lifetime 6
Since School Began 2
In the Past Month 5
Frequency Missing = 4.06596892
RECENT INHALANT USE - OTH
AEROSOLS/SPRA
Q16H Frequency Per
Never Heard/Used 265 9
In Your Lifetime 5
Since School Began 3
In the Past Month 8
Frequency Missing = 5.19547642
The frequencies have been weighted so that the analysis reflects
the distribution of students by grade level in the district
©Copyright 2010, Texas A&M University
All rights reserved.
Page 36 of 49

8/6/2019 Ector County ISD - Nimitz Junior High School - 2010 Texas School Survey of Drug and Alcohol Use
http://slidepdf.com/reader/full/ector-county-isd-nimitz-junior-high-school-2010-texas-school-survey-of 37/49
Ector County ISD - Nimitz Junior High
Spring 2010
RECENT CIGARETTE USE
Q17A Frequency Percent
Never Heard/Used 209 74.49
In Your Lifetime 38 13.40
Since School Began 16 5.87
In the Past Month 17 6.25
Frequency Missing = 5.9535405151
RECENT SMOKELESS TOBACCO
USE
Q17B Frequency Percent
Never Heard/Used 248 89.12
In Your Lifetime 20 7.08
Since School Began 5 1.70
In the Past Month 6 2.11
Frequency Missing = 7.741876186
RECENT BEER USE
Q17C Frequency Percent
Never Heard/Used 125 44.96
In Your Lifetime 68 24.36
Since School Began 31 10.97
In the Past Month 55 19.71
Frequency Missing = 7.8411121023
RECENT WINE COOLER USE
Q17D Frequency Percent
Never Heard/Used 151 54.54
In Your Lifetime 60 21.73
Since School Began 28 10.08
In the Past Month 38 13.65
Frequency Missing = 9.7286836895
RECENT WINE USE
Q17E Frequency PercentNever Heard/Used 163 58.61
In Your Lifetime 59 21.37
Since School Began 27 9.56
In the Past Month 29 10.45
Frequency Missing = 8.3083504352
RECENT LIQUOR USE
Q17F Frequency Percent
Never Heard/Used 164 58.80
In Your Lifetime 57 20.54
Since School Began 23 8.15In the Past Month 35 12.51
Frequency Missing = 6.3215429317
RECENT INHALANT USE
Q17G Frequency Percent
Never Heard/Used 245 89.75
In Your Lifetime 14 5.16
Since School Began 3 0.93
In the Past Month 11 4.15
Frequency Missing = 12.860175952
RECENT MARIJUANA USE
Q18A Frequency Percent
Never Heard/Used 214 76.80
In Your Lifetime 25 8.96
Since School Began 11 3.84
In the Past Month 29 10.40
Frequency Missing = 7.7453171837
RECENT COCAINE USE
Q18B Frequency Percent
Never Heard/Used 267 96.08
In Your Lifetime 5 1.87
Since School Began 3 1.02
In the Past Month 3 1.02
Frequency Missing = 8.4075863515
RECENT CRACK
Q18C Frequency Per
Never Heard/Used 266 9
In Your Lifetime 3
Since School Began 1
In the Past Month 3
Frequency Missing = 12.2785244
RECENT HALLUCINOGEN
Q18E Frequency Per
Never Heard/Used 267 9
In Your Lifetime 4
Since School Began 1
In the Past Month 4
Frequency Missing = 9.63288877
RECENT UPPER
Q18F Frequency Per
Never Heard/Used 265 9
In Your Lifetime 3
Since School Began 4
In the Past Month 3
Frequency Missing = 11.0532220
RECENT DOWNER Q18G Frequency Per
Never Heard/Used 259 9
In Your Lifetime 3
Since School Began 1
In the Past Month 7
Frequency Missing = 16.4437292
RECENT ROHYPNOL
Q18H Frequency Per
Never Heard/Used 266 9In Your Lifetime 3
Since School Began 1
In the Past Month 2
Frequency Missing = 13.6988576
The frequencies have been weighted so that the analysis reflects
the distribution of students by grade level in the district
©Copyright 2010, Texas A&M University
All rights reserved.
Page 37 of 49
8/6/2019 Ector County ISD - Nimitz Junior High School - 2010 Texas School Survey of Drug and Alcohol Use
http://slidepdf.com/reader/full/ector-county-isd-nimitz-junior-high-school-2010-texas-school-survey-of 38/49
Ector County ISD - Nimitz Junior High
Spring 2010
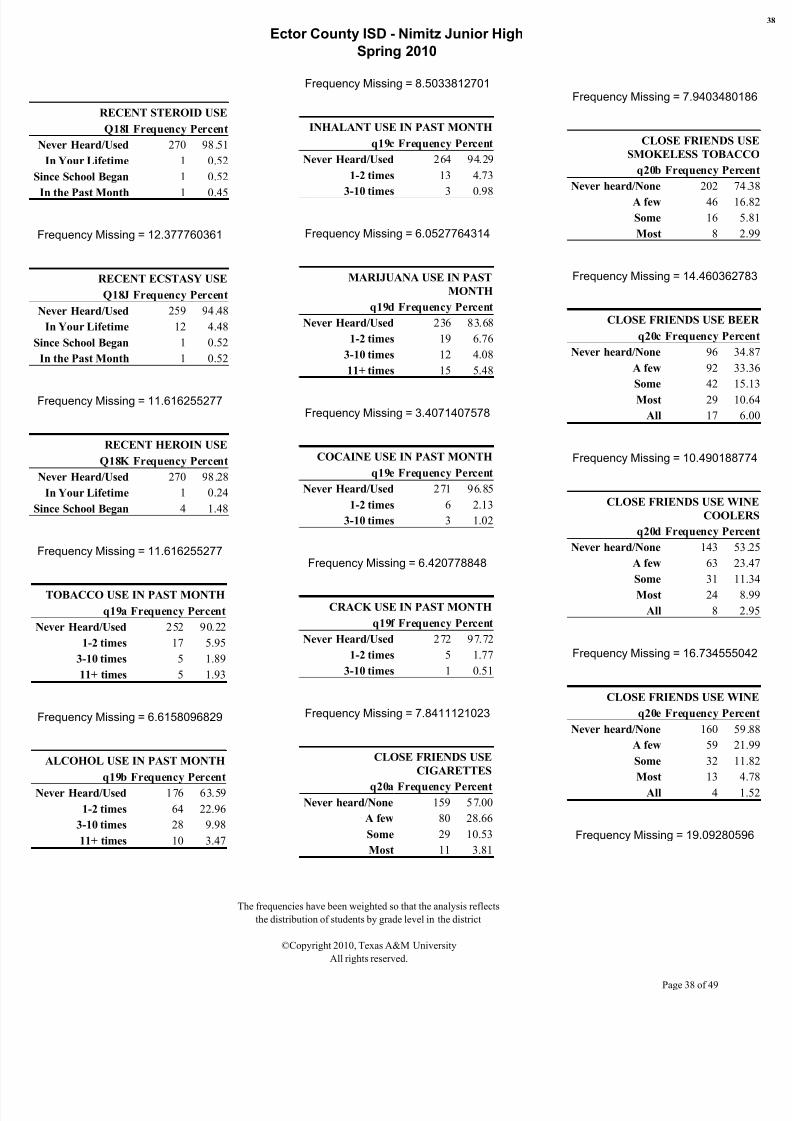
RECENT STEROID USE
Q18I Frequency Percent
Never Heard/Used 270 98.51
In Your Lifetime 1 0.52
Since School Began 1 0.52
In the Past Month 1 0.45
Frequency Missing = 12.377760361
RECENT ECSTASY USE
Q18J Frequency Percent
Never Heard/Used 259 94.48
In Your Lifetime 12 4.48
Since School Began 1 0.52
In the Past Month 1 0.52
Frequency Missing = 11.616255277
RECENT HEROIN USE
Q18K Frequency Percent
Never Heard/Used 270 98.28
In Your Lifetime 1 0.24
Since School Began 4 1.48
Frequency Missing = 11.616255277
TOBACCO USE IN PAST MONTH
q19a Frequency Percent
Never Heard/Used 252 90.22
1-2 times 17 5.95
3-10 times 5 1.89
11+ times 5 1.93
Frequency Missing = 6.6158096829
ALCOHOL USE IN PAST MONTH
q19b Frequency Percent
Never Heard/Used 176 63.59
1-2 times 64 22.96
3-10 times 28 9.98
11+ times 10 3.47
Frequency Missing = 8.5033812701
INHALANT USE IN PAST MONTH
q19c Frequency Percent
Never Heard/Used 264 94.29
1-2 times 13 4.73
3-10 times 3 0.98
Frequency Missing = 6.0527764314
MARIJUANA USE IN PAST
MONTH
q19d Frequency Percent
Never Heard/Used 236 83.68
1-2 times 19 6.76
3-10 times 12 4.08
11+ times 15 5.48
Frequency Missing = 3.4071407578
COCAINE USE IN PAST MONTH
q19e Frequency Percent
Never Heard/Used 271 96.85
1-2 times 6 2.13
3-10 times 3 1.02
Frequency Missing = 6.420778848
CRACK USE IN PAST MONTH
q19f Frequency Percent
Never Heard/Used 272 97.72
1-2 times 5 1.77
3-10 times 1 0.51
Frequency Missing = 7.8411121023
CLOSE FRIENDS USE
CIGARETTES
q20a Frequency PercentNever heard/None 159 57.00
A few 80 28.66
Some 29 10.53
Most 11 3.81
Frequency Missing = 7.94034801
CLOSE FRIENDS U
SMOKELESS TOBAC
q20b Frequency Perc
Never heard/None 202 74
A few 46 16
Some 16
Most 8 2
Frequency Missing = 14.4603627
CLOSE FRIENDS USE BE
q20c Frequency Perc
Never heard/None 96 34
A few 92 33
Some 42 1
Most 29 10
All 17 6
Frequency Missing = 10.4901887
CLOSE FRIENDS USE WI
COOLE
q20d Frequency Perc
Never heard/None 143 53
A few 63 23
Some 31 1
Most 24
All 8 2
Frequency Missing = 16.7345550
CLOSE FRIENDS USE WI
q20e Frequency Perc
Never heard/None 160 59
A few 59 2
Some 32 1
Most 13 4
All 4
Frequency Missing = 19.092805
The frequencies have been weighted so that the analysis reflects
the distribution of students by grade level in the district
©Copyright 2010, Texas A&M University
All rights reserved.
Page 38 of 49
8/6/2019 Ector County ISD - Nimitz Junior High School - 2010 Texas School Survey of Drug and Alcohol Use
http://slidepdf.com/reader/full/ector-county-isd-nimitz-junior-high-school-2010-texas-school-survey-of 39/49
Ector County ISD - Nimitz Junior High
Spring 2010
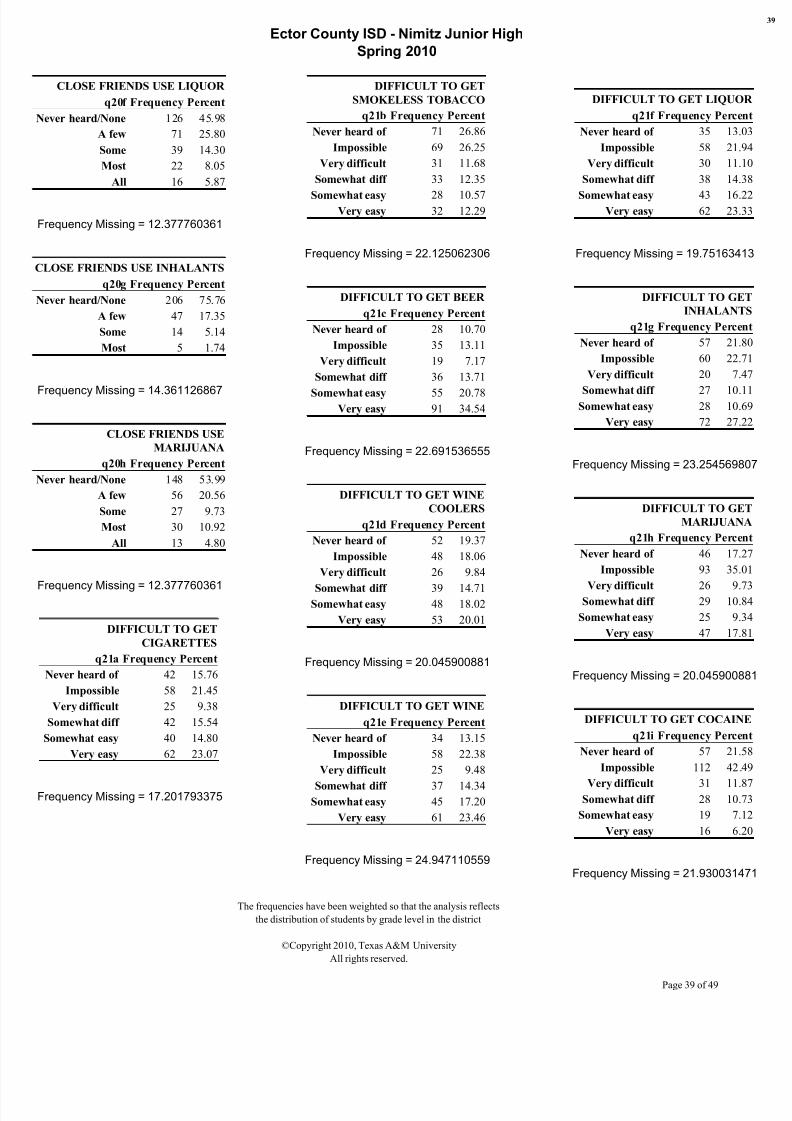
CLOSE FRIENDS USE LIQUOR
q20f Frequency Percent
Never heard/None 126 45.98
A few 71 25.80
Some 39 14.30
Most 22 8.05
All 16 5.87
Frequency Missing = 12.377760361
CLOSE FRIENDS USE INHALANTS
q20g Frequency Percent
Never heard/None 206 75.76
A few 47 17.35
Some 14 5.14
Most 5 1.74
Frequency Missing = 14.361126867
CLOSE FRIENDS USE
MARIJUANA
q20h Frequency Percent
Never heard/None 148 53.99
A few 56 20.56
Some 27 9.73
Most 30 10.92
All 13 4.80
Frequency Missing = 12.377760361
DIFFICULT TO GET
CIGARETTES
q21a Frequency Percent
Never heard of 42 15.76
Impossible 58 21.45
Very difficult 25 9.38
Somewhat diff 42 15.54
Somewhat easy 40 14.80
Very easy 62 23.07
Frequency Missing = 17.201793375
DIFFICULT TO GET
SMOKELESS TOBACCO
q21b Frequency Percent
Never heard of 71 26.86
Impossible 69 26.25
Very difficult 31 11.68
Somewhat diff 33 12.35
Somewhat easy 28 10.57Very easy 32 12.29
Frequency Missing = 22.125062306
DIFFICULT TO GET BEER
q21c Frequency Percent
Never heard of 28 10.70
Impossible 35 13.11
Very difficult 19 7.17
Somewhat diff 36 13.71
Somewhat easy 55 20.78Very easy 91 34.54
Frequency Missing = 22.691536555
DIFFICULT TO GET WINE
COOLERS
q21d Frequency Percent
Never heard of 52 19.37
Impossible 48 18.06
Very difficult 26 9.84
Somewhat diff 39 14.71Somewhat easy 48 18.02
Very easy 53 20.01
Frequency Missing = 20.045900881
DIFFICULT TO GET WINE
q21e Frequency Percent
Never heard of 34 13.15
Impossible 58 22.38
Very difficult 25 9.48
Somewhat diff 37 14.34Somewhat easy 45 17.20
Very easy 61 23.46
Frequency Missing = 24.947110559
DIFFICULT TO GET LIQUO
q21f Frequency Perce
Never heard of 35 13.
Impossible 58 21.
Very difficult 30 11.
Somewhat diff 38 14.
Somewhat easy 43 16.Very easy 62 23.
Frequency Missing = 19.751634
DIFFICULT TO GE
INHALANT
q21g Frequency Perce
Never heard of 57 21.
Impossible 60 22.
Very difficult 20 7.
Somewhat diff 27 10.Somewhat easy 28 10.
Very easy 72 27.
Frequency Missing = 23.2545698
DIFFICULT TO GE
MARIJUAN
q21h Frequency Perce
Never heard of 46 17.
Impossible 93 35.
Very difficult 26 9.Somewhat diff 29 10.
Somewhat easy 25 9.
Very easy 47 17.
Frequency Missing = 20.0459008
DIFFICULT TO GET COCAIN
q21i Frequency Perce
Never heard of 57 21.
Impossible 112 42.
Very difficult 31 11.Somewhat diff 28 10.
Somewhat easy 19 7.
Very easy 16 6.
Frequency Missing = 21.9300314
The frequencies have been weighted so that the analysis reflects
the distribution of students by grade level in the district
©Copyright 2010, Texas A&M University
All rights reserved.
Page 39 of 49
8/6/2019 Ector County ISD - Nimitz Junior High School - 2010 Texas School Survey of Drug and Alcohol Use
http://slidepdf.com/reader/full/ector-county-isd-nimitz-junior-high-school-2010-texas-school-survey-of 40/49
Ector County ISD - Nimitz Junior High
Spring 2010
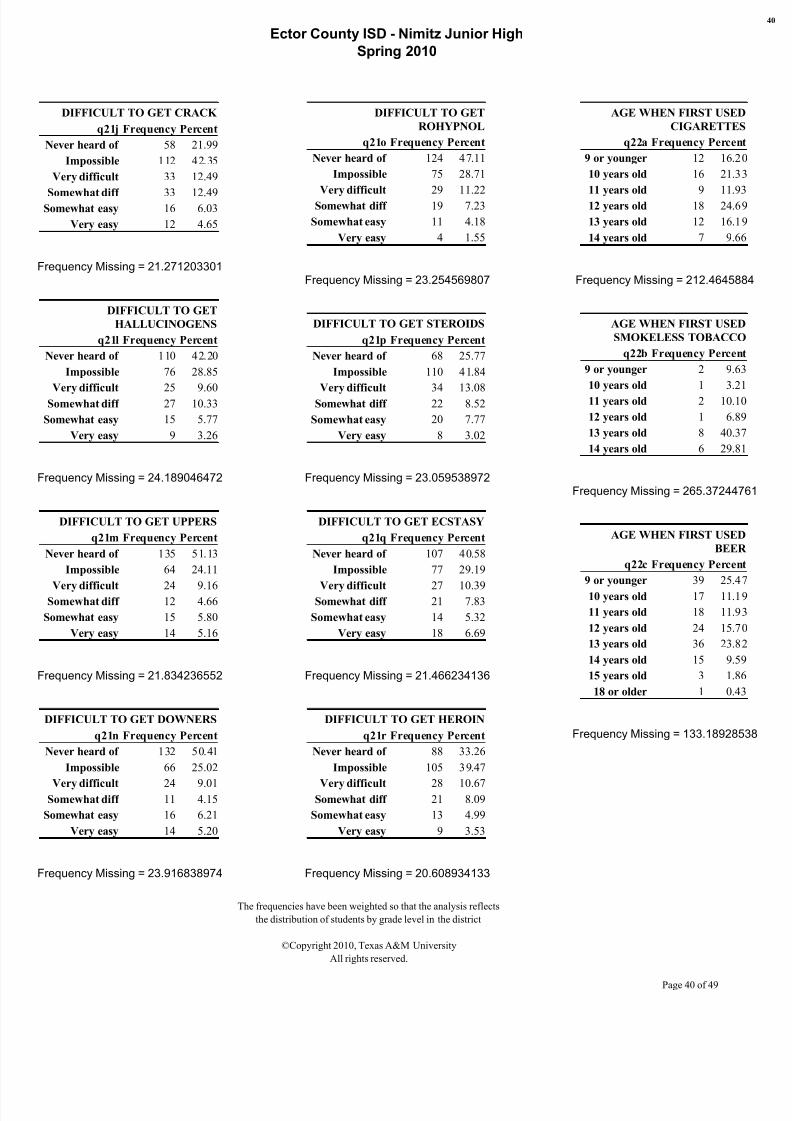
DIFFICULT TO GET CRACK
q21j Frequency Percent
Never heard of 58 21.99
Impossible 112 42.35
Very difficult 33 12.49
Somewhat diff 33 12.49Somewhat easy 16 6.03
Very easy 12 4.65
Frequency Missing = 21.271203301
DIFFICULT TO GET
HALLUCINOGENS
q21l Frequency Percent
Never heard of 110 42.20
Impossible 76 28.85
Very difficult 25 9.60Somewhat diff 27 10.33
Somewhat easy 15 5.77
Very easy 9 3.26
Frequency Missing = 24.189046472
DIFFICULT TO GET UPPERS
q21m Frequency Percent
Never heard of 135 51.13
Impossible 64 24.11
Very difficult 24 9.16Somewhat diff 12 4.66
Somewhat easy 15 5.80
Very easy 14 5.16
Frequency Missing = 21.834236552
DIFFICULT TO GET DOWNERS
q21n Frequency Percent
Never heard of 132 50.41
Impossible 66 25.02
Very difficult 24 9.01Somewhat diff 11 4.15
Somewhat easy 16 6.21
Very easy 14 5.20
Frequency Missing = 23.916838974
DIFFICULT TO GET
ROHYPNOL
q21o Frequency Percent
Never heard of 124 47.11
Impossible 75 28.71
Very difficult 29 11.22
Somewhat diff 19 7.23
Somewhat easy 11 4.18
Very easy 4 1.55
Frequency Missing = 23.254569807
DIFFICULT TO GET STEROIDS
q21p Frequency Percent
Never heard of 68 25.77
Impossible 110 41.84
Very difficult 34 13.08Somewhat diff 22 8.52
Somewhat easy 20 7.77
Very easy 8 3.02
Frequency Missing = 23.059538972
DIFFICULT TO GET ECSTASY
q21q Frequency Percent
Never heard of 107 40.58
Impossible 77 29.19
Very difficult 27 10.39Somewhat diff 21 7.83
Somewhat easy 14 5.32
Very easy 18 6.69
Frequency Missing = 21.466234136
DIFFICULT TO GET HEROIN
q21r Frequency Percent
Never heard of 88 33.26
Impossible 105 39.47
Very difficult 28 10.67Somewhat diff 21 8.09
Somewhat easy 13 4.99
Very easy 9 3.53
Frequency Missing = 20.608934133
AGE WHEN FIRST USED
CIGARETTE
q22a Frequency Percen
9 or younger 12 16.2
10 years old 16 21.3
11 years old 9 11.9
12 years old 18 24.6
13 years old 12 16.1
14 years old 7 9.6
Frequency Missing = 212.46458
AGE WHEN FIRST USED
SMOKELESS TOBACCO
q22b Frequency Percen
9 or younger 2 9.6
10 years old 1 3.2
11 years old 2 10.1
12 years old 1 6.8
13 years old 8 40.3
14 years old 6 29.8
Frequency Missing = 265.372447
AGE WHEN FIRST USED
BEER
q22c Frequency Percen
9 or younger 39 25.4
10 years old 17 11.1
11 years old 18 11.9
12 years old 24 15.7
13 years old 36 23.8
14 years old 15 9.5
15 years old 3 1.8
18 or older 1 0.4
Frequency Missing = 133.189285
The frequencies have been weighted so that the analysis reflects
the distribution of students by grade level in the district
©Copyright 2010, Texas A&M University
All rights reserved.
Page 40 of 49

8/6/2019 Ector County ISD - Nimitz Junior High School - 2010 Texas School Survey of Drug and Alcohol Use
http://slidepdf.com/reader/full/ector-county-isd-nimitz-junior-high-school-2010-texas-school-survey-of 41/49
Ector County ISD - Nimitz Junior High
Spring 2010
AGE WHEN FIRST USED
WINE COOLERS
q22d Frequency Percent
9 or younger 24 19.91
10 years old 10 8.38
11 years old 17 14.23
12 years old 24 19.92
13 years old 34 28.5414 years old 8 6.64
15 years old 3 2.38
Frequency Missing = 166.44818737
AGE WHEN FIRST USED
WINE
q22e Frequency Percent
9 or younger 19 15.88
10 years old 11 9.44
11 years old 21 18.2312 years old 20 17.03
13 years old 34 28.99
14 years old 9 7.99
15 years old 3 2.43
Frequency Missing = 168.89879221
AGE WHEN FIRST USED
LIQUOR
q22f Frequency Percent
9 or younger 7 6.2510 years old 11 9.36
11 years old 10 8.89
12 years old 24 20.16
13 years old 42 35.71
14 years old 17 14.81
15 years old 4 3.61
16 years old 1 1.20
Frequency Missing = 167.94913829
AGE WHEN FIRST USED
INHALANTS
q22g Frequency Percent
9 or younger 3 10.74
10 years old 4 13.36
11 years old 4 15.30
12 years old 5 15.65
13 years old 8 26.0314 years old 3 9.12
15 years old 3 9.80
Frequency Missing = 257.00553877
AGE WHEN FIRST USED
MARIJUANA
q22h Frequency Percent
9 or younger 5 8.70
10 years old 8 12.80
11 years old 5 8.8612 years old 11 17.72
13 years old 19 31.17
14 years old 10 15.99
15 years old 3 4.76
Frequency Missing = 226.26612302
AGE WHEN FIRST USED
COCAINE
q22i Frequency Percent
11 years old 1 10.7712 years old 1 11.55
13 years old 3 21.51
14 years old 5 44.61
15 years old 1 11.55
Frequency Missing = 273.7028573
AGE WHEN FIRST USED
CRACK
q22j Frequency Percent
12 years old 2 42.3014 years old 1 28.85
15 years old 1 28.85
Frequency Missing = 281.07673107
AGE WHEN FIRST USED
HALLUCINOGENS
q22l Frequency Percen
12 years old 1 12.00
13 years old 2 20.39
14 years old 5 53.71
15 years old 1 13.91
Frequency Missing = 275.785459
AGE WHEN FIRST USED
UPPERS
q22m Frequency Percen
12 years old 2 18.48
13 years old 5 53.71
14 years old 3 27.81
Frequency Missing = 275.785459
AGE WHEN FIRST USED
DOWNERS
q22n Frequency Percen
12 years old 1 10.97
13 years old 4 38.15
14 years old 6 50.87
Frequency Missing = 274.83236
AGE WHEN FIRST USED
ROHYPNOL
q22o Frequency Percen
12 years old 1 28.85
13 years old 1 13.45
14 years old 3 57.70
Frequency Missing = 281.076731
AGE WHEN FIRST USED
STEROIDSq22p Frequency Percen
12 years old 1 30.14
13 years old 1 34.93
14 years old 1 34.93
The frequencies have been weighted so that the analysis reflects
the distribution of students by grade level in the district
©Copyright 2010, Texas A&M University
All rights reserved.
Page 41 of 49

8/6/2019 Ector County ISD - Nimitz Junior High School - 2010 Texas School Survey of Drug and Alcohol Use
http://slidepdf.com/reader/full/ector-county-isd-nimitz-junior-high-school-2010-texas-school-survey-of 42/49
Ector County ISD - Nimitz Junior High
Spring 2010
Frequency Missing = 281.93403107
AGE WHEN FIRST USED
ECSTASY
q22q Frequency Percent
11 years old 1 3.72
13 years old 5 25.49
14 years old 8 46.82
15 years old 3 15.97
16 years old 1 7.99
Frequency Missing = 268.21655512
AGE WHEN FIRST USED
HEROIN
q22r Frequency Percent
10 years old 1 11.86
11 years old 1 25.43
13 years old 1 11.86
15 years old 3 50.86
Frequency Missing = 280.4144619
HOW OFTEN NORMALLY USE
CIGARETTES
q23a Frequency Percent
Every day 1 0.24
Several times/wk 1 0.51
Several times/mo 7 2.60
About once/month 14 5.14
About once/year 17 6.10
< once/year 23 8.22
Never used 213 77.18
Frequency Missing = 10.022950441
HOW OFTEN NORMALLY USE
SMOKELESS TOBACCO
q23b Frequency Percent
Several times/mo 3 1.19
About once/month 3 1.16
About once/year 8 2.80
< once/year 9 3.31
Never used 254 91.53
Frequency Missing = 8.7976480213
HOW OFTEN NORMALLY USE
BEER
q23c Frequency Percent
Every day 2 0.77
Several times/wk 9 3.41
Several times/mo 35 12.76
About once/month 36 13.28
About once/year 26 9.66
< once/year 29 10.85
Never used 134 49.27
Frequency Missing = 14.188155285
HOW OFTEN NORMALLY USE
WINE COOLERS
q23d Frequency Percent
Every day 2 0.78
Several times/wk 5 1.76
Several times/mo 19 7.15
About once/month 31 11.55
About once/year 27 10.21
< once/year 23 8.52
Never used 161 60.04
Frequency Missing = 17.591855045
HOW OFTEN NORMALLY USE
WINE
q23e Frequency Percent
Several times/wk 6 2.36
Several times/mo 13 4.91
About once/month 33 12.58
About once/year 23 8.79
< once/year 20 7.52
Never used 166 63.84
Frequency Missing = 25.90020548
HOW OFTEN NORMALLY U
LIQU
q23f Frequency Per
Every day 1
Several times/wk 8
Several times/mo 26
About once/month 22
About once/year 28 1< once/year 23
Never used 162 6
Frequency Missing = 15.9764909
HOW OFTEN NORMALLY U
INHALAN
q23g Frequency Per
Several times/wk 2
Several times/mo 4
About once/month 4 About once/year 4
< once/year 7
Never used 252 9
Frequency Missing = 13.0586477
HOW OFTEN NORMALLY U
MARIJUA
q23h Frequency Per
Every day 6
Several times/wk 9 Several times/mo 8
About once/month 17
About once/year 11
< once/year 9
Never used 213 7
Frequency Missing = 11.4432836
The frequencies have been weighted so that the analysis reflects
the distribution of students by grade level in the district
©Copyright 2010, Texas A&M University
All rights reserved.
Page 42 of 49
8/6/2019 Ector County ISD - Nimitz Junior High School - 2010 Texas School Survey of Drug and Alcohol Use
http://slidepdf.com/reader/full/ector-county-isd-nimitz-junior-high-school-2010-texas-school-survey-of 43/49
Ector County ISD - Nimitz Junior High
Spring 2010
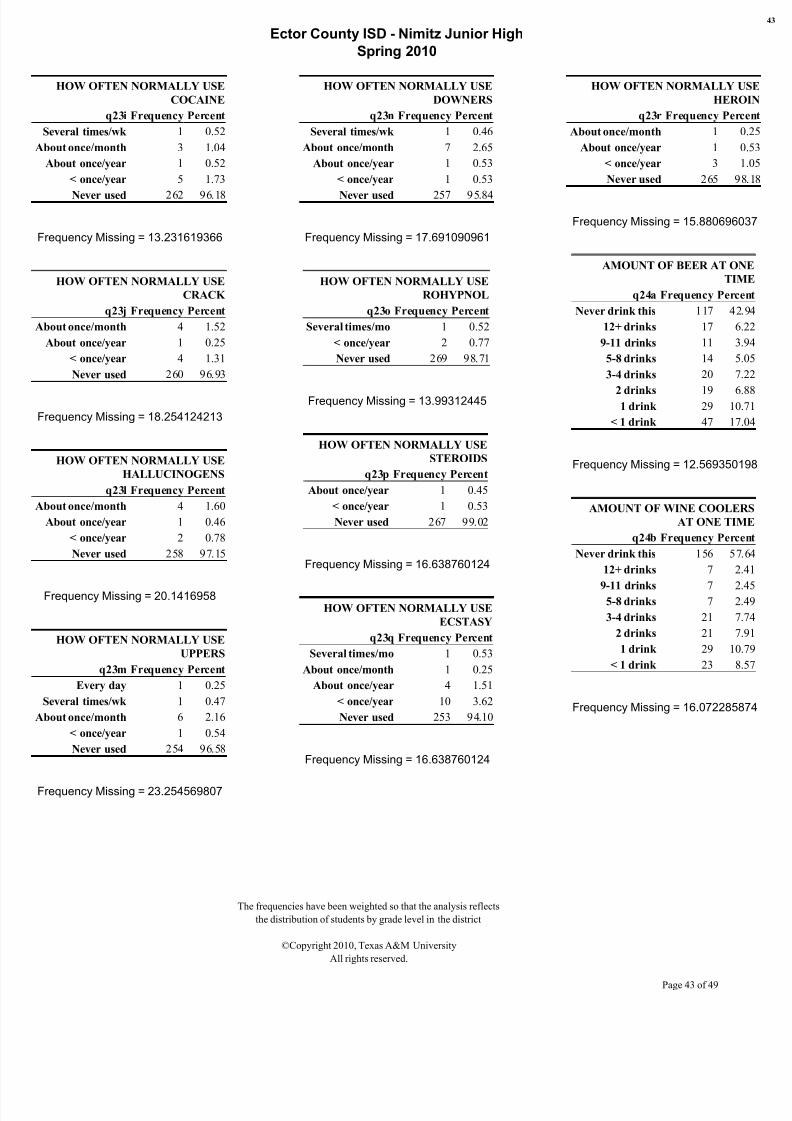
HOW OFTEN NORMALLY USE
COCAINE
q23i Frequency Percent
Several times/wk 1 0.52
About once/month 3 1.04
About once/year 1 0.52
< once/year 5 1.73
Never used 262 96.18
Frequency Missing = 13.231619366
HOW OFTEN NORMALLY USE
CRACK
q23j Frequency Percent
About once/month 4 1.52
About once/year 1 0.25
< once/year 4 1.31
Never used 260 96.93
Frequency Missing = 18.254124213
HOW OFTEN NORMALLY USE
HALLUCINOGENS
q23l Frequency Percent
About once/month 4 1.60
About once/year 1 0.46
< once/year 2 0.78
Never used 258 97.15
Frequency Missing = 20.1416958
HOW OFTEN NORMALLY USE
UPPERS
q23m Frequency Percent
Every day 1 0.25
Several times/wk 1 0.47
About once/month 6 2.16
< once/year 1 0.54
Never used 254 96.58
Frequency Missing = 23.254569807
HOW OFTEN NORMALLY USE
DOWNERS
q23n Frequency Percent
Several times/wk 1 0.46
About once/month 7 2.65
About once/year 1 0.53
< once/year 1 0.53
Never used 257 95.84
Frequency Missing = 17.691090961
HOW OFTEN NORMALLY USE
ROHYPNOL
q23o Frequency Percent
Several times/mo 1 0.52
< once/year 2 0.77
Never used 269 98.71
Frequency Missing = 13.99312445
HOW OFTEN NORMALLY USE
STEROIDS
q23p Frequency Percent
About once/year 1 0.45
< once/year 1 0.53
Never used 267 99.02
Frequency Missing = 16.638760124
HOW OFTEN NORMALLY USE
ECSTASY
q23q Frequency Percent
Several times/mo 1 0.53
About once/month 1 0.25
About once/year 4 1.51
< once/year 10 3.62
Never used 253 94.10
Frequency Missing = 16.638760124
HOW OFTEN NORMALLY U
HERO
q23r Frequency Per
About once/month 1
About once/year 1
< once/year 3
Never used 265 9
Frequency Missing = 15.8806960
AMOUNT OF BEER AT ON
TIM
q24a Frequency Perc
Never drink this 117 42
12+ drinks 17 6
9-11 drinks 11 3
5-8 drinks 14 5
3-4 drinks 20 7
2 drinks 19 61 drink 29 10
< 1 drink 47 17
Frequency Missing = 12.5693501
AMOUNT OF WINE COOLE
AT ONE TIM
q24b Frequency Perc
Never drink this 156 57
12+ drinks 7 2
9-11 drinks 7 25-8 drinks 7 2
3-4 drinks 21 7
2 drinks 21 7
1 drink 29 10
< 1 drink 23 8
Frequency Missing = 16.0722858
The frequencies have been weighted so that the analysis reflects
the distribution of students by grade level in the district
©Copyright 2010, Texas A&M University
All rights reserved.
Page 43 of 49

8/6/2019 Ector County ISD - Nimitz Junior High School - 2010 Texas School Survey of Drug and Alcohol Use
http://slidepdf.com/reader/full/ector-county-isd-nimitz-junior-high-school-2010-texas-school-survey-of 44/49
Ector County ISD - Nimitz Junior High
Spring 2010
AMOUNT OF WINE AT ONE
TIME
q24c Frequency Percent
Never drink this 154 56.64
12+ drinks 4 1.43
9-11 drinks 3 1.22
5-8 drinks 4 1.50
3-4 drinks 11 4.082 drinks 24 8.70
1 drink 33 12.21
< 1 drink 39 14.23
Frequency Missing = 14.456921785
AMOUNT OF LIQUOR AT ONE
TIME
q24d Frequency Percent
Never drink this 148 55.34
12+ drinks 11 4.149-11 drinks 5 2.02
5-8 drinks 11 4.15
3-4 drinks 17 6.24
2 drinks 21 7.80
1 drink 21 7.76
< 1 drink 33 12.55
Frequency Missing = 19.380190716
HOW MANY 5+ DRINKS IN PAST
30 DAYSq25 Frequency Percent
Never 5+ at time 107 39.11
None 112 41.13
1 day 19 7.03
2 days 9 3.23
3 to 5 days 12 4.47
6 to 9 days 8 3.05
10 or more days 5 1.98
Frequency Missing = 13.235060364
GET ALCOHOLIC BEVERAGES
FROM HOME
q26a Frequency Percent
Do not Drink 125 45.90
Never 57 20.76
Seldom 64 23.57
Most of the Time 22 8.11
Always 5 1.66
Frequency Missing = 13.330855282
GET ALCOHOLIC BEVERAGES
FROM FRIENDS
q26b Frequency Percent
Do not Drink 125 46.17
Never 58 21.45
Seldom 44 16.34
Most of the Time 38 14.01
Always 5 2.02
Frequency Missing = 14.751188536
GET ALCOHOLIC BEVERAGES
FROM A STORE
q26c Frequency Percent
Do not Drink 131 48.72
Never 115 42.92
Seldom 16 5.94
Most of the Time 4 1.44
Always 3 0.98
Frequency Missing = 16.929585877
GET ALCOHOLIC BEVERAGES
AT PARTIES
q26d Frequency Percent
Do not Drink 116 43.08
Never 43 16.01
Seldom 38 14.21
Most of the Time 48 17.97
Always 24 8.72
Frequency Missing = 16.171521791
GET ALCOHOLIC BEVERAG
FROM OTHER SOURC
q26e Frequency Perc
Do not Drink 124 45
Never 54 19
Seldom 48 17
Most of the Time 30 11
Always 17 6
Frequency Missing = 12.2013477
USE MARIJUANA AS JOIN
q27a Frequency Perc
Never 218 78
Seldom 25 9
Half the time 12 4
Most of the time 17 5
Always 5 1
Don't know 1 0
Frequency Missing = 7.84111210
USE MARIJUANA AS BLUN
q27b Frequency Perc
Never 228 81
Seldom 14 4
Half the time 10 3
Most of the time 13 4
Always 13 4
Don't know 1 0
Frequency Missing = 7.27807885
USE MARIJUANA IN BONGS O
WATER PIP
q27c Frequency Perc
Never 235 84
Seldom 19 6
Half the time 9 3
Most of the time 4 1
Always 8 2Don't know 1 0
Frequency Missing = 9.36068127
The frequencies have been weighted so that the analysis reflects
the distribution of students by grade level in the district
©Copyright 2010, Texas A&M University
All rights reserved.
Page 44 of 49

8/6/2019 Ector County ISD - Nimitz Junior High School - 2010 Texas School Survey of Drug and Alcohol Use
http://slidepdf.com/reader/full/ector-county-isd-nimitz-junior-high-school-2010-texas-school-survey-of 45/49
Ector County ISD - Nimitz Junior High
Spring 2010
USE MARIJUANA IN PIPES
q27d Frequency Percent
Never 228 82.32
Seldom 19 6.72
Half the time 12 4.41
Most of the time 9 3.18
Always 8 2.87
Don't know 1 0.51
Frequency Missing = 9.1656504379
USE MARIJUANA OTHER WAYS
q27e Frequency Percent
Never 239 85.85
Seldom 14 5.07
Half the time 8 2.72
Most of the time 10 3.57
Always 2 0.88
Don't know 5 1.90
Frequency Missing = 8.0361429372
USED METHAMPHETAMINE EVEN
ONE TIME
q28 Frequency Percent
Never heard/used 262 95.29
At least once/month 3 1.17
At least once/year 2 0.76
At least once/life 8 2.79
Frequency Missing = 11.071840281
RECENT PRECRIPTION DRUG USE
- CODEINE
q29a Frequency Percent
Never heard/used 229 83.89
At least once/month 15 5.65
At least once/year 19 6.79
At least once/life 10 3.67
Frequency Missing = 13.154442703
RECENT PRECRIPTION DRUG USE
- OXYCONTIN ETC
q29b Frequency Percent
Never heard/used 254 94.80
At least once/month 2 0.78
At least once/year 4 1.52
At least once/life 8 2.90
Frequency Missing = 18.250683215
RECENT PRECRIPTION DRUG USE
- VICODIN ETC
q29c Frequency Percent
Never heard/used 252 94.77
At least once/month 4 1.32
At least once/year 6 2.14
At least once/life 5 1.78
Frequency Missing = 20.237490719
RECENT PRECRIPTION DRUG USE
- VALIUM ETC
q29d Frequency Percent
Never heard/used 260 97.17
At least once/month 2 0.71
At least once/year 4 1.59
At least once/life 1 0.53
Frequency Missing = 18.717921548
RECENT PRECRIPTION DRUG USE
- XANAX ETC
q29e Frequency Percent
Never heard/used 253 95.29
At least once/month 3 1.25
At least once/year 5 1.86
At least once/life 4 1.61
Frequency Missing = 20.995554805
TAKE DXM, TRIPLE CS, ETC
GET H
q30 Frequency Per
Never heard/used 247 9
At least once/month 1
At least once/year 6
At least once/life 11
Frequency Missing = 20.1382548
DANGEROUS FOR KIDS TO
USE TOBACCO
q31a Frequency Percen
Very 153 56.90
Somewhat 72 26.59
Not very 25 9.17
Not at all 5 1.72
Don't know 15 5.62
Frequency Missing = 16.9295858
DANGEROUS FOR KIDS TO
USE ALCOHOL
q31b Frequency Percen
Very 130 48.25
Somewhat 77 28.45
Not very 39 14.45
Not at all 12 4.37
Don't know 12 4.48
Frequency Missing = 15.7042834
DANGEROUS FOR KIDS TO
USE INHALANTS
q31c Frequency Percen
Very 189 70.44
Somewhat 47 17.62
Not very 11 4.24
Not at all 7 2.51
Don't know 14 5.19
Frequency Missing = 18.2541242
The frequencies have been weighted so that the analysis reflects
the distribution of students by grade level in the district
©Copyright 2010, Texas A&M University
All rights reserved.
Page 45 of 49

8/6/2019 Ector County ISD - Nimitz Junior High School - 2010 Texas School Survey of Drug and Alcohol Use
http://slidepdf.com/reader/full/ector-county-isd-nimitz-junior-high-school-2010-texas-school-survey-of 46/49
Ector County ISD - Nimitz Junior High
Spring 2010
DANGEROUS FOR KIDS TO
USE MARIJUANA
q31d Frequency Percent
Very 178 66.05
Somewhat 37 13.87
Not very 24 8.87
Not at all 18 6.83
Don't know 12 4.38
Frequency Missing = 16.270757707
DANGEROUS FOR KIDS TO
USE COCAINE
q31e Frequency Percent
Very 215 82.11
Somewhat 26 10.08
Not very 7 2.57
Not at all 1 0.25
Don't know 13 4.98
Frequency Missing = 24.479872226
DANGEROUS FOR KIDS TO
USE CRACK
q31f Frequency Percent
Very 219 82.24
Somewhat 26 9.68
Not very 5 1.98
Not at all 1 0.25
Don't know 16 5.85
Frequency Missing = 19.380190716
DANGEROUS FOR KIDS TO
USE ECSTASY
q31g Frequency Percent
Very 194 72.63
Somewhat 31 11.69
Not very 16 5.86
Not at all 3 0.96
Don't know 24 8.87
Frequency Missing = 19.479426632
DANGEROUS FOR KIDS TO
USE STEROIDS
q31h Frequency Percent
Very 195 72.57
Somewhat 41 15.31
Not very 12 4.46
Not at all 4 1.48
Don't know 17 6.19
Frequency Missing = 16.929585877
DANGEROUS FOR KIDS TO
USE HEROIN
q31i Frequency Percent
Very 224 83.15
Somewhat 21 7.74
Not very 4 1.54
Not at all 1 0.25
Don't know 20 7.32
Frequency Missing = 16.267316709
DANGEROUS FOR KIDS TO
USE METHAMPHETAMINE
q31j Frequency Percent
Very 219 81.03
Somewhat 21 7.86
Not very 3 0.98
Not at all 1 0.24
Don't know 27 9.89
Frequency Missing = 15.509252623
DAYS SKIPPED SINCE
SEPTEMBER
q32a Frequency Percent
None 240 88.49
1-3 days 27 9.80
4-9 days 4 1.46
10+ days 1 0.24
Frequency Missing = 14.280509206
DAYS ILL SINCE
SEPTEMBER
q32b Frequency Percent
None 58 21.02
1-3 days 152 55.25
4-9 days 55 20.04
10+ days 10 3.68
Frequency Missing = 11.6348735
OTHER REASON FOR
DAYS MISSED SINCE
SEPTEMBER
q32c Frequency Percent
None 92 34.13
1-3 days 153 56.34
4-9 days 23 8.51
10+ days 3 1.01
Frequency Missing = 15.1378092
SENT TO
PRINCIPAL/DEAN SINCE
SEPTEMBER
q32d Frequency Percent
None 226 82.93
1-3 days 39 14.44
4-9 days 4 1.63
10+ days 3 1.01
Frequency Missing = 13.2502376
SOMEONE CALLED
HOME SINCE
SEPTEMBER
q32e Frequency Percent
None 221 80.99
1-3 days 45 16.41
4-9 days 5 1.90
10+ days 2 0.69
Frequency Missing = 13.2502376
The frequencies have been weighted so that the analysis reflects
the distribution of students by grade level in the district
©Copyright 2010, Texas A&M University
All rights reserved.
Page 46 of 49

8/6/2019 Ector County ISD - Nimitz Junior High School - 2010 Texas School Survey of Drug and Alcohol Use
http://slidepdf.com/reader/full/ector-county-isd-nimitz-junior-high-school-2010-texas-school-survey-of 47/49
Ector County ISD - Nimitz Junior High
Spring 2010
IN TROUBLE FOR
DRINKING SINCE
SEPTEMBER
q32f Frequency Percent
None 270 98.79
1-3 days 3 1.21
Frequency Missing = 12.587968454
IN TROUBLE FOR DRUG
USE SINCE SEPTEMBER
q32g Frequency Percent
None 263 98.76
1-3 days 3 1.24
Frequency Missing = 19.961842223
TROUBLE WITHFRIENDS BECAUSE OF
DRINKING
q33a Frequency Percent
None 259 94.84
1-3 times 13 4.64
4-9 times 1 0.52
Frequency Missing = 13.055206786
DRIVEN A CAR AFTER A
GOOD BIT TO DRINK q33b Frequency Percent
None 264 97.21
1-3 times 8 2.79
Frequency Missing = 14.670570876
CRITICIZED BY DATE
BECAUSE OF DRINKING
q33c Frequency Percent
None 260 95.89
1-3 times 11 4.11
Frequency Missing = 14.942778374
TROUBLE WITH POLICE
BECAUSE OF DRINKING
q33d Frequency Percent
None 263 96.29
1-3 times 9 3.19
4-9 times 1 0.52
Frequency Missing = 13.154442703
TROUBLE WITH
FRIENDS BECAUSE OF
DRUG USE
q33e Frequency Percent
None 255 95.10
1-3 times 10 3.84
4-9 times 3 1.06
Frequency Missing = 17.687649964
DRIVEN A CAR WHILE
HIGH FROM DRUGS
q33f Frequency Percent
None 260 97.69
1-3 times 5 1.78
4-9 times 1 0.53
Frequency Missing = 19.965283221
CRITICIZED BY DATEBECAUSE OF DRUG USE
q33g Frequency Percent
None 254 94.58
1-3 times 13 4.89
4-9 times 1 0.53
Frequency Missing = 17.588414047
TROUBLE WITH POLICE
BECAUSE OF DRUG USE
q33h Frequency PercentNone 264 97.31
1-3 times 7 2.69
Frequency Missing = 14.942778374
CLASS DAYS DRUNK ON
ALCOHOL SINCE SEPT
q34a Frequency Percent
None 250 90.67
1-3 days 24 8.57
4-9 days 1 0.24
10+ days 1 0.52
Frequency Missing = 10.4095711
CLASS DAYS HIGH ON
MARIJUANA SINCE SEPT
q34b Frequency Percent
None 244 88.84
1-3 days 20 7.27
4-9 days 4 1.28
10+ days 7 2.62
Frequency Missing = 11.6348735
CLASS DAYS HIGH ON
INHALANTS SINCE SEPT
q34c Frequency Percent
None 268 97.15
1-3 days 7 2.37
4-9 days 1 0.48
Frequency Missing = 10.4095711
CLASS DAYS HIGH ON
OTHER DRUG(S)
q34d Frequency Percent
None 256 93.97
1-3 days 12 4.58
4-9 days 3 1.21
10+ days 1 0.24
Frequency Missing = 13.0552067
The frequencies have been weighted so that the analysis reflects
the distribution of students by grade level in the district
©Copyright 2010, Texas A&M University
All rights reserved.
Page 47 of 49

8/6/2019 Ector County ISD - Nimitz Junior High School - 2010 Texas School Survey of Drug and Alcohol Use
http://slidepdf.com/reader/full/ector-county-isd-nimitz-junior-high-school-2010-texas-school-survey-of 48/49
Ector County ISD - Nimitz Junior High
Spring 2010
ALCOHOL USE AT PARTIES
THIS SCHOOL YEAR
q35a Frequency Percent
Never 132 48.51
Seldom 34 12.65
Half the time 25 9.23
Most of the time 28 10.34
Always 24 8.92Don't know 4 1.53
Didn't attend 24 8.82
Frequency Missing = 13.522445119
DRUG USE AT PARTIES THIS
SCHOOL YEAR
q35b Frequency Percent
Never 171 62.51
Seldom 23 8.29
Half the time 21 7.81Most of the time 16 5.87
Always 12 4.29
Don't know 5 1.93
Didn't attend 25 9.30
Frequency Missing = 12.2971427
SOUGHT HELP FOR
DRUG/ALCOHOL
PROBLEM
q36 Frequency Percent
No 233 91.10
Yes 23 8.90
Frequency Missing = 30.065410324
WOULD SEEK HELP
FROM SCHOOL
COUNSELOR
q37a Frequency Percent
No 187 69.32
Yes 83 30.68
Frequency Missing = 16.168080793
WOULD SEEK HELP
FROM ANOTHER
ADULT IN SCHOOL
q37b Frequency Percent
No 191 71.13
Yes 78 28.87
Frequency Missing = 16.926144879
WOULD SEEK HELP
FROM COUNSELOR
OR PROGRAM
OUTSIDE SCHOOL
q37c Frequency Percent
No 171 63.24
Yes 100 36.76
Frequency Missing = 14.942778374
WOULD SEEK HELP
FROM PARENTS
q37d Frequency Percent
No 108 40.44
Yes 159 59.56
Frequency Missing = 19.376749718
WOULD SEEK HELP
FROM A MEDICAL
DOCTOR
q37e Frequency Percent
No 165 61.90
Yes 101 38.10
Frequency Missing = 20.138254802
WOULD SEEK HELP
FROM FRIENDS
q37f Frequency Percent
No 93 34.39
Yes 178 65.61
Frequency Missing = 15.410016707
WOULD SEEK HELP
FROM ANOTHER
ADULT
q37g Frequency Percent
No 113 42.13
Yes 155 57.87
Frequency Missing = 18.8137164
WOULD NOT SEEK
HELP
q37h Frequency Percent
No 229 86.46
Yes 36 13.54
Frequency Missing = 20.800523
DRUG/ALCOHOLINFO--SCHOOL
HEALTH CLASS
q38a Frequency Percent
No 124 53.96
Yes 106 46.04
Frequency Missing = 55.8477616
DRUG/ALCOHOL
INFO--SCHOOL
ASSEMBLY PROGRAM
q38b Frequency Percent
No 127 55.72
Yes 101 44.28
Frequency Missing = 58.6884281
DRUG/ALCOHOL
INFO--SCHOOL
GUIDANCE
COUNSELOR
q38c Frequency Percent
No 177 78.43
Yes 49 21.57
Frequency Missing = 60.3809688
The frequencies have been weighted so that the analysis reflects
the distribution of students by grade level in the district
©Copyright 2010, Texas A&M University
All rights reserved.
Page 48 of 49

8/6/2019 Ector County ISD - Nimitz Junior High School - 2010 Texas School Survey of Drug and Alcohol Use
http://slidepdf.com/reader/full/ector-county-isd-nimitz-junior-high-school-2010-texas-school-survey-of 49/49
Ector County ISD - Nimitz Junior High
Spring 2010
DRUG/ALCOHOL
INFO--SCIENCE CLASS
q38d Frequency Percent
No 163 71.60
Yes 65 28.40
Frequency Missing = 57.930364055
DRUG/ALCOHOL
INFO--SOCIAL
STUDIES CLASS
q38e Frequency Percent
No 203 89.19
Yes 25 10.81
Frequency Missing = 57.930364055
DRUG/ALCOHOLINFO--SCHOOL
STUDENT GROUP OR
CLUB
q38f Frequency Percent
No 197 85.47
Yes 33 14.53
Frequency Missing = 55.751966714
DRUG/ALCOHOL
INFO--INVITED
SCHOOL GUEST
q38g Frequency Percent
No 148 65.07
Yes 80 34.93
Frequency Missing = 57.930364055
DRUG/ALCOHOL
INFO--ANOTHER
SCHOOL SOURCE
q38h Frequency Percent
No 138 60.04
Yes 92 39.96
Frequency Missing = 56.314999966
PARENTS FEEL ABOUT KIDS
SMOKING CIGARETTES
q39a Frequency Percent
Strong disapprove 221 82.19
Mild disapprove 18 6.58
Neither 11 3.91
Mildly approve 1 0.46
Don't know 18 6.86
Frequency Missing = 17.393383212
PARENTS FEEL ABOUT KIDS
DRINKING BEER
q39b Frequency Percent
Strong disapprove 178 65.41
Mild disapprove 41 14.95
Neither 24 8.66
Mildly approve 9 3.34
Don't know 21 7.64
Frequency Missing = 14.085478371
PARENTS FEEL ABOUT KIDS
USING MARIJUANA
q39c Frequency Percent
Strong disapprove 226 83.42
Mild disapprove 13 4.89
Neither 13 4.68
Don't know 19 7.02
Frequency Missing = 15.31078079
TESTED FOR DRUG
USE AT SCHOOL
q40 Frequency Percent
No 229 84.70
Yes 41 15.30
Frequency Missing = 15.115749955