Embed Size (px)
Citation preview

Ecosystem services from coastal wetlands
Prof Catherine Lovelock

Seagrass

Mangroves

Saltmarshes (and salt flats) and brackish marshes

The benefits people obtain from ecosystems
Millennium Ecosystem Assessment
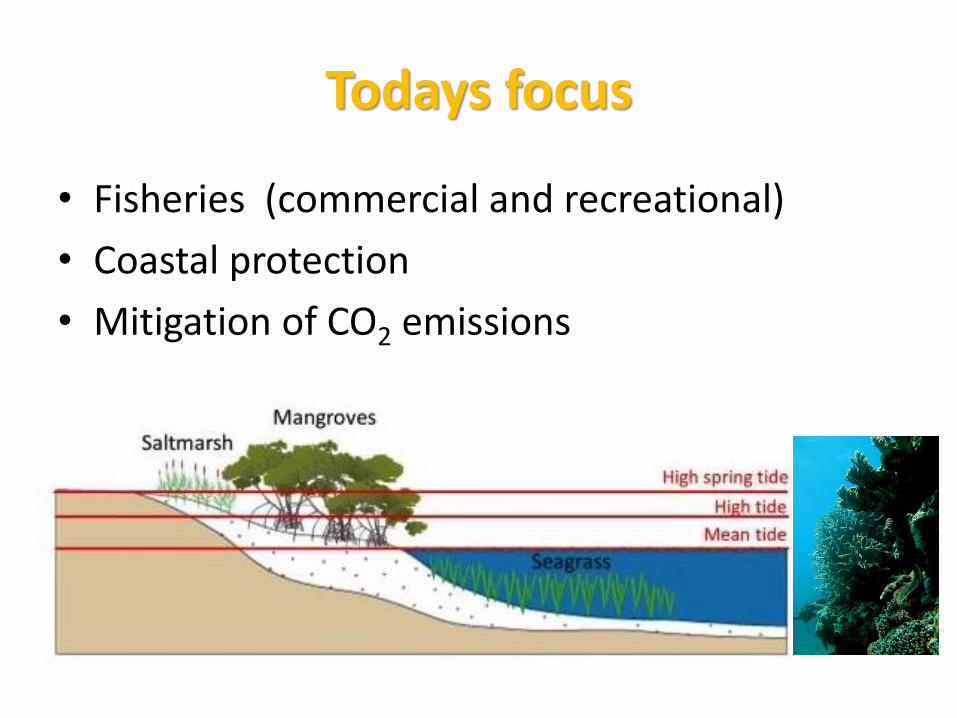
Todays focus
• Fisheries (commercial and recreational)
• Coastal protection
• Mitigation of CO2 emissions

Biodiversity

Culture, recreation, education

Nutrients enter estuarine
wetlands from nearby
terrestrial areas dissolved
in run-off or as particles of
detritus
Crabs and other animals can transfer nutrients (often in
the form of detritus) into and out of the sediment.
Microbes recycle nutrients, taking up nutrients, grazed,
decomposed and exchange nitrogen with the
atmosphere.
Groundwater and riparian vegetation can play a
significant role in reducing nitrogen entering streams,
protecting downstream water quality
Filtration and exchange as
water moves
Animals transform and move
nutrients across landscapes
*Sediment trapping *

Todays focus
• Fisheries (commercial and recreational)
• Coastal protection
• Mitigation of CO2 emissions
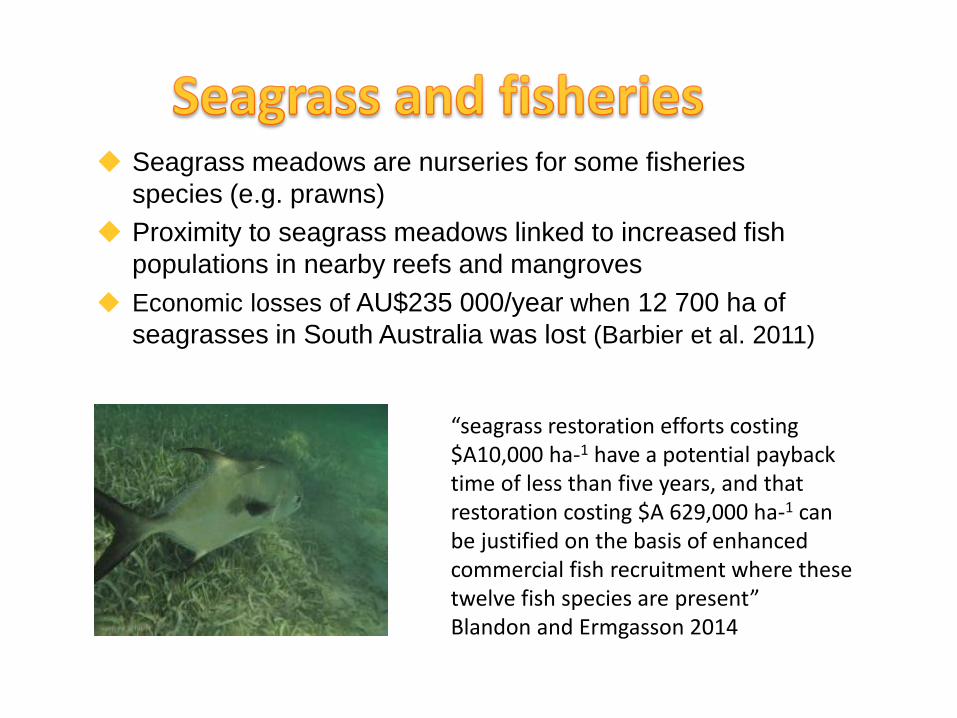
Seagrass meadows are nurseries for some fisheries
species (e.g. prawns)
Proximity to seagrass meadows linked to increased fish
populations in nearby reefs and mangroves
Economic losses of AU$235 000/year when 12 700 ha of
seagrasses in South Australia was lost (Barbier et al. 2011)
“seagrass restoration efforts costing $A10,000 ha-1 have a potential payback time of less than five years, and that restoration costing $A 629,000 ha-1 can be justified on the basis of enhanced commercial fish recruitment where these twelve fish species are present” Blandon and Ermgasson 2014

Fish need mangroves Mangroves are nurseries for some fish species
Mangrove forests are rich in resources for both grazers and
predators – linked to commercially important fish species
Economic value of mangroves for fisheries was estimated at
US$37,500 per hectare (Aburto Oropeza et al. 2008)
Mumby et al. 2003

Coastal protection Mangrove forests and seagrass provide protection from
waves - dissipate energy
Mangrove protection is important during storms
Roots, stems, foliage and sediments attenuate waves
(effectiveness depends on water depth, width of the
vegetation, density etc….)
Economic value estimated at $10 000 per hectare for
prevention of typhoon damage

Attenuation of waves
• inducing wave breaking as the main damping mechanism
• dissipating energy through flow separation
• dissipating energy through friction on rough surfaces
• dissipating energy through porous friction
• producing a barrier effect that reflects energy in the offshore direction
• combination of the above mechanisms

But also vulnerable to storms

Keeping up with sea level rise
• Coral reefs, mangroves, seagrass and saltmarsh all have some capacity to increase in elevation over time(unlike concrete walls)
• Important for maintenance of coasts (coastal protection and other services)
Darwin worked this out in 1842:

Sea level rise – instrumental record and predictions
Church et al. 2011
IPCC 2013

Mangrove forests, seagrass and saltmarsh may keep up with sea level rise
Increasing elevation of the soil surface over time occurs due to:
Sediment deposition
Root growth
Low rates of subsidence (tectonic, oil, gas, water extraction, compaction)

Measurements
surface elevation
change
shallow subsidence or
expansion
deep land movement
0
~12
Dep
th (
m)
RSET (36 pt/site)
DE = f(sediment accretion + sub-surface processes)
sediment accretion (marker bed, tiles)
• Rod Surface Elevation Tables

Coastal wetlands are vulnerable to sea level rise
Mangroves, saltmarsh and
seagrass may not be able to
keep up with predicted future
rates of sea level rise
Predictions for what will happen
in mangroves:
Seaward fringe inundated
too long and dies (retreat)
Landward forests expand –
e.g. invasion of saltmarsh
Barriers will prevent
movement – “squeeze”
*Seagrass predictions – cover
later if interested

Modeling change with sea level rise Models can help visualize the future
See http://drownyourtown.tumblr.com/
Where will mangrove forests exist in the future
Digital elevation models of land surface
Sea level predictions
Knowledge of vertical accretion and other processes
Modeled vegetation change using SLAMM

Consequences of gains in surface elevation
• Sustained coastal protection, even with sea level rise
• Carbon sequestration

Blue carbon
Reducing Emissions from Deforestation and Forest Degradation in Developing Countries (~2008)
2009
Carbon sequestered in mangroves, seagrass and saltmarshes
• 25% of CO2 emitted to the atmosphere from activities of humans comes from land-use change
• Strategies developed to reduce this source and encourage CO2 fixation in ecosystems

Blue Carbon: Mitigation and conservation
IPCC greenhouse gas accounting (Kyoto 2005, IPCC 2006 guidance) – Countries ‘pledge’ to reduce emissions and techniques for counting carbon available Coastal wetland management activities that
affect carbon (e.g. losses and gains) are to be counted: Wetland supplement to 2006 assessment released in 2013 Other mechanisms: Clean Development
Mechanism (IPCC - CDM), REDD+, voluntary markets (e.g. Verified Carbon Standard)

Australia: Emissions White Paper April 2014
Looking for low cost options

Mangrove, saltmarsh and seagrass sediments are
globally significant stocks of carbon
High productivity (roots)
Low oxygen in sediments slows down
decomposition
Plants trap carbon from elsewhere
Soil volumes increase over time

• Seagrass has less carbon per unit area compared to mangroves, but
• Global area of seagrass is very large (could be up to 600 000 km2 compared to mangroves 150 000 km2)
• Dependent on species and environment

Reef Catchments
• Large areas of coastal habitats
• Carbon stocks in mangroves are substantial
Saltm
arsh
es
Bra
ckish m
arsh
es
Gra
ssland
s
Inland
wet
land
sBar
e
Melaleu
ca/C
asua
rina
Sea
gras
s
Man
grov
es
Rai
nfor
ests
Euc
alyp
t
Clear
ed
To
tal carb
on s
tock (
mill
ions o
f T
onne
s)
0
10
20
30
40
50
Saltm
arsh
es
Bra
ckish m
arsh
es
Gra
ssland
s
Inland
wet
land
sBar
e
Melaleu
ca/C
asua
rina
Sea
gras
s
Man
grov
es
Rai
nfor
ests
Euc
alyp
t
Clear
ed
Are
a o
f ve
ge
tatio
n
(ha)
0
100000
200000
300000
400000
500000
NA NA
Probably underestimated

Opportunities – case studies
• Hunter River • Potential for
restoration through reestablishing tidal flows (cheap)
• Carbon + other benefits
Rogers et al. 2014
Floodgates closed – 3000 ha of wetlands: C burial by 2100 – 330 000 tonnes Floodgates open – 8000 ha of wetlands: C burial by 2100 – 600 000 tonnes

Mangroves, seagrass meadows and
saltmarshes are valuable assets
Supporting fisheries production
Coastal protection
Climate regulation (carbon dioxide
sequestration)
Regulates water quality
Biodiversity
Culture/recreation/education

Management for maintaining ecosystem services
Plan for climate change
Secure land for coastal wetland landward expansion
Remove barriers to landward movement of the ecosystem (pond walls,
roads, dykes)
Redraw boundaries around wetland reserves
Ensure sediment supply is maintained for accretion (dams and levees)
Reduce unsustainable extraction
Restore *Restoring seagrass meadows is difficult and expensive
because water quality has to be improved before restoration can work
– best to prevent losses.
Maintaining seagrass requires management of land-based nutrient and
sediment inputs as well as preventing direct disturbance (e.g. dredging)
Monitoring networks (e.g. Seagrass Watch)

Responses of seagrasses to sea level rise
Light limitation
Desiccation, hydrodynamic limitation
• Losses on deep edge, especially with poor water quality? • Increases in shallow water?

Habitat distribution model
Seagrass
Roelfsema et al. 2009
Secchi Depth
EHMP
Wave height
SWAN model
Depth
LiDAR and Deep Reef
Saunders et al. 2013
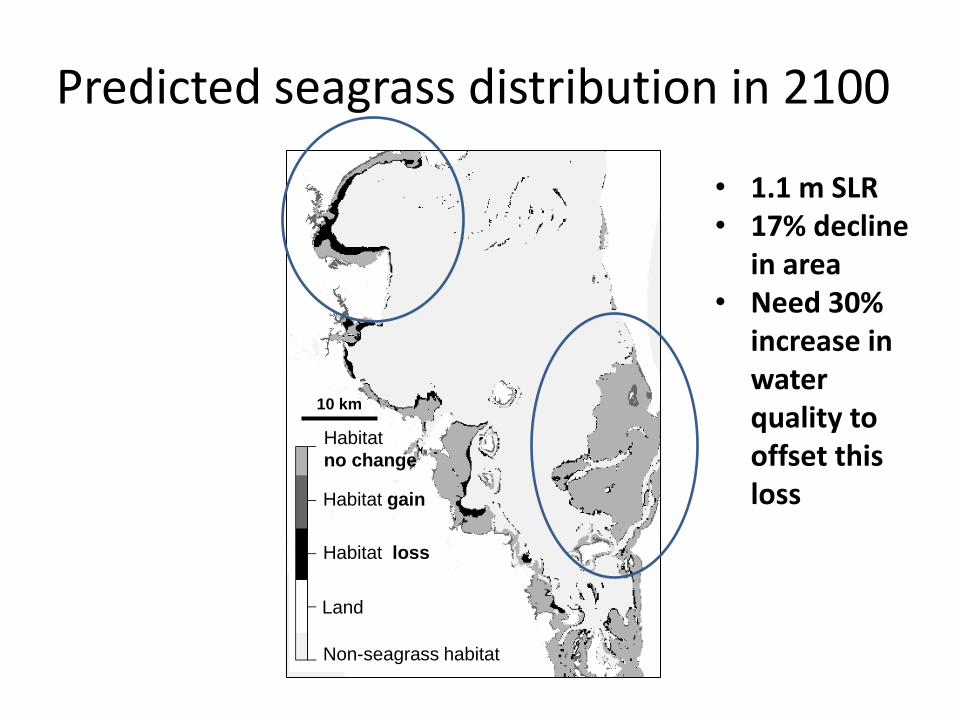
Predicted seagrass distribution in 2100
10 km
Habitat
no change
Habitat gain
Habitat loss
Land
Non-seagrass habitat
• 1.1 m SLR • 17% decline
in area • Need 30%
increase in water quality to offset this loss