Embed Size (px)
Citation preview

Economics Characteristics of the New York Agriculture & Food Sectors
Jennifer IfftAssistant Professor and Mueller Family Sesquicentennial
Faculty Fellow in Agribusiness and Farm Management
Contributions by Chad Fiechter, Jerzy Jaromczyk, Farnaz SafariJanuary 17, 2020
#NYAgOutlook

Outline
NY Farm Sector Indicators• Farm income
• Revenue and expenses• MFP • Financial measures
• Crop loss• 2017 Census of Agriculture
A Closer Look • Nontraditional finance • NY Cost of Production
Looking Forward
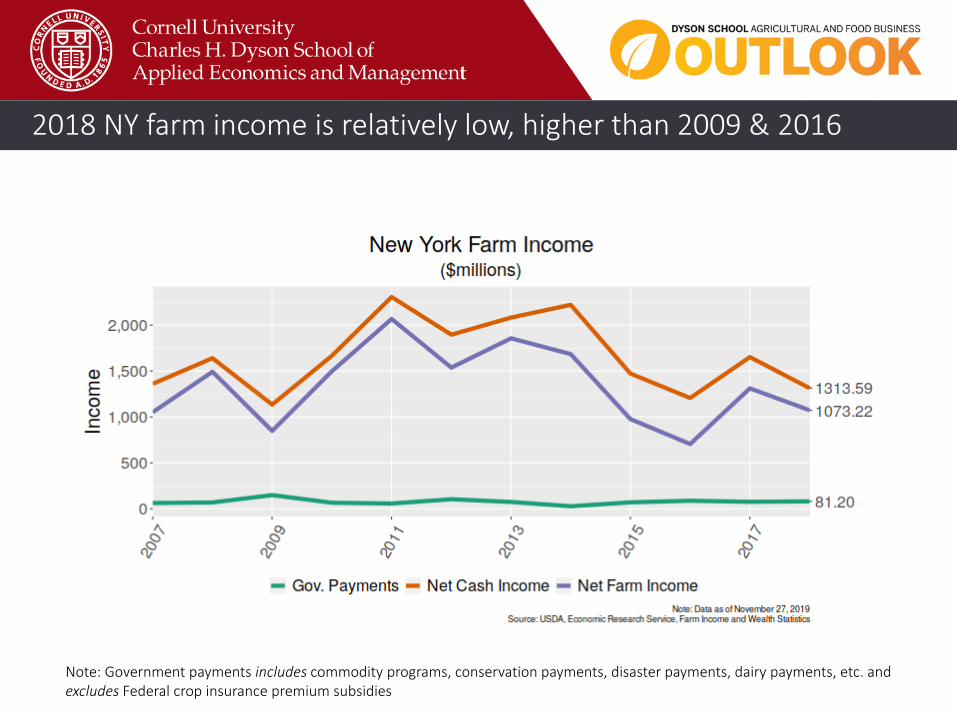
2018 NY farm income is relatively low, higher than 2009 & 2016
Note: Government payments includes commodity programs, conservation payments, disaster payments, dairy payments, etc. and excludes Federal crop insurance premium subsidies

0
500
1000
1500
2000
2500
2010 2011 2012 2013 2014 2015 2016 2017 2018F 2019F
NY Net Cash Farm Income, $ Million
Actual Forecast
Farm income for 2018 below average, 2019 should be higher
Note: 1997-2006 average is reported in 2019$. The 2009-18 average is not inflation-adjusted and would be higher in real terms.Source: USDA Economic Research Service, forecast based on national trend.
2009-2018 average
1999-2008 average*

Small revenue declines in 2018

National cash receipts forecasts– up for dairy, generally mixed
Source: USDA Economic Research Service for national cash receipt forecast changes, Jan 2020 WASDENote: NY 2018 ranking in terms of cash receipts in (), apples #5, cabbage #11
2018-2019F % change
2020 WASDE
Dairy (1) +11.2% All milk price up for 2020 (18.6 to 19.25), production up 1.7%
Cattle (3) -0.1% Prices up 0.6%, production up 1.1%
Corn (4) +1.9% Prices up 6.6%, production down 4.5%
Fruit (5*) +1.3%
Chicken Eggs (7) -31% Prices up 1.6%, production up 1.4%
Soybeans (8) -4.9% Prices up 6.1%, production down 19.6%
Hay (9) +20%
Vegetables (11*) +10%
Wheat (15) -9.5% Prices down 11.8%, production up 1.9%
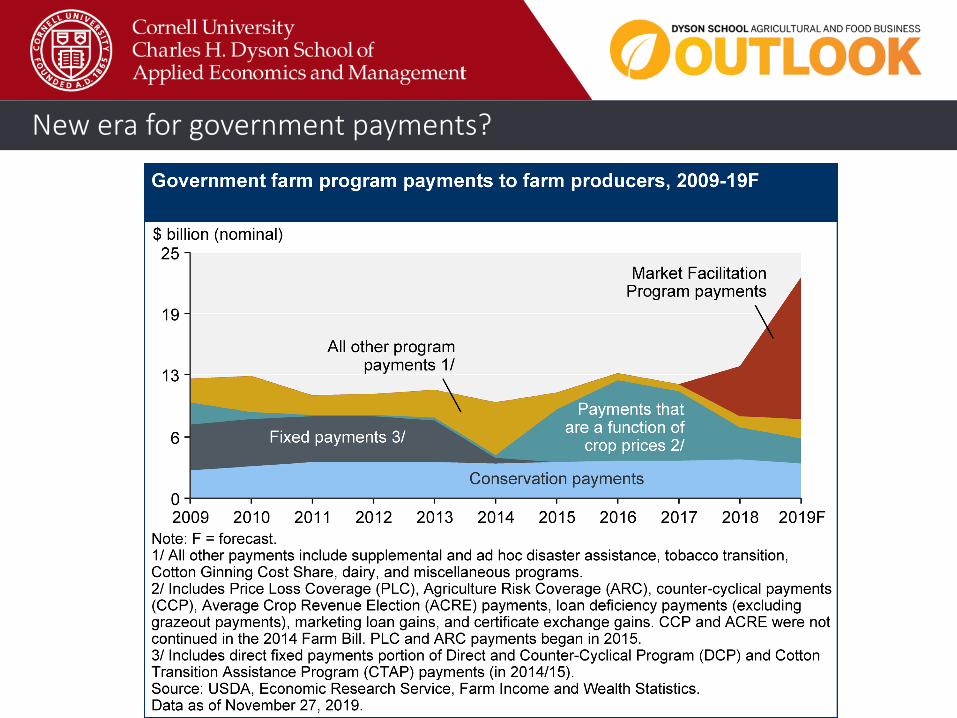
New era for government payments?

DMC, Conservation, MFP have highest payouts
Selected programs & total$ Million2018
$ Million2019
Price Loss Coverage (PLC) 1.0 ?
Supplemental and ad hoc disaster assistance 5.0 ?
Agriculture Risk Coverage (ARC) 7.4 ?
Conservation 19.7 ?
Market Facilitation Program 23.5 48
Dairy Margin Coverage Program 24.6 28?
Total 81.2 ?
Source: USDA Economic Research Service for 2018; Farm Bureau estimate for 2019; FSA mid-2019 estimate for DMC

Sizeable MFP rates in many counties
Note: average per acre rate for eligible crops. Dairy rate of $0.20 per cwt excluded.

Labor and feed costs increased nationally in 2019

Inflation-adjusted wages up again in 2019
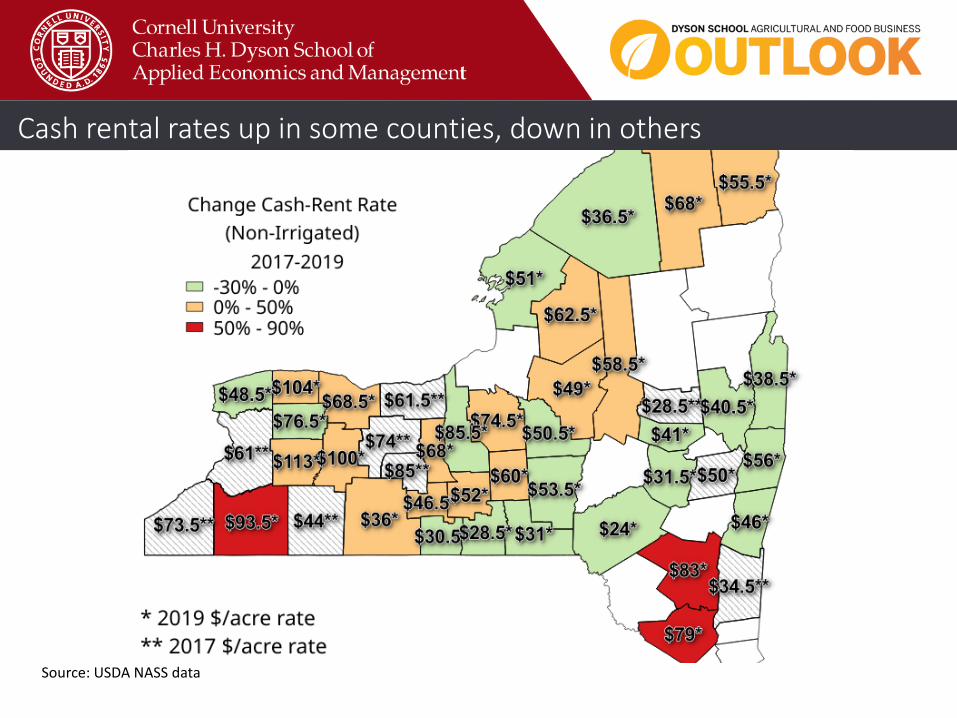
Cash rental rates up in some counties, down in others
Source: USDA NASS data

Farmland values stable in 2019

Bankruptcies appear to be down in 2019, delinquencies not increasing
Source: Court filings, regulatory reports

2019 insurance payouts (to date) very high for field crop producers
Note: Loss ratio = 1 implies total premiums (including premium subsidy) are equivalent to indemnities; typically farm operationspay less than 40 percent of total premiums, with the remainder as premium subsidy

Another wet year in 2019, much higher payouts than 2018

Similar weather experiences across NY state
Note: Cause of Loss (for crop insurance indemnities), 2019 indemnities as reported on 1/16/20Source: USDA Risk Management Agency

Large prevented planting indemnities in many counties
"Note: Cause of Loss (for crop insurance indemnities), 2018 indemnities as reported on 1/15/19Source: USDA Risk Management Agency

Selected 2017 Census highlights
• About 2,000 less farms than 2012• 4% decline in land in farms• Increase in farm wealth (asset value)• More younger, older producers
• Declining middle• More than 700 farms with 1-9 acres added• All others declined, other than >2,000 acre farms
• Half of producers have a primary occupation *other* than agriculture• Larger number work off farm
• Increase in rental income, forest products, agritourism, maple, mushrooms, greenhouses, organic production
• Less Christmas trees, short rotation woody crops, floriculture
• 3,300 farms with renewable energy – doubled from 2012• More hired managers

Source: USDA NASS Census of AgricultureNote: Acres farms increase or decrease by county
Mixed trends in land in farms

Increase Decrease
Vegetable production changes: 2017 Census of Agriculture
More farms, Lower acreage
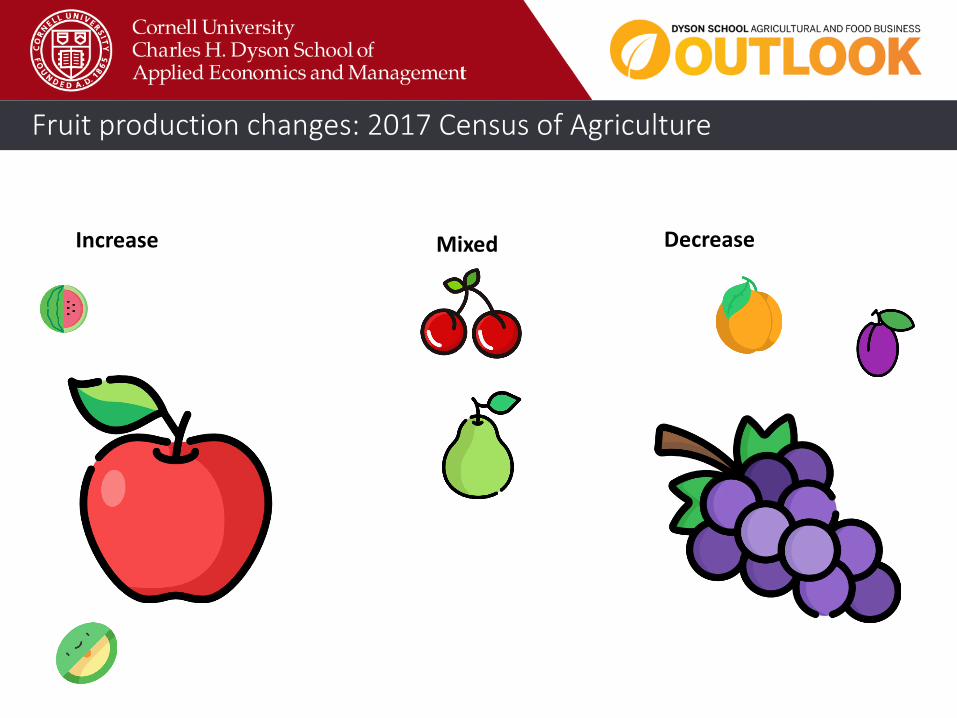
Fruit production changes: 2017 Census of Agriculture
Increase DecreaseMixed

Decline in small dairy farms continues in most NY counties
Source: USDA NASS Census of Agriculture

Medium size dairy farm numbers largely stable from 2012-17
Source: USDA NASS Census of Agriculture

Larger dairy farm numbers grew in most counties from 2012-17
Source: USDA NASS Census of Agriculture

Long term trend – dairy concentrated in Western NY
Source: USDA NASS Census of Agriculture

Cost of production study
Strong economy… High costs

Cost of production study
• Approach• Comparison with
“competitor states” for dairy and specialty crop production
• Apples-to-apples, would be ideal but prohibitive
• Major categories for many farm inputs and capital expenses
to
to
to
to

Cost of production study: categories
Low Medium High
Feed (1) X
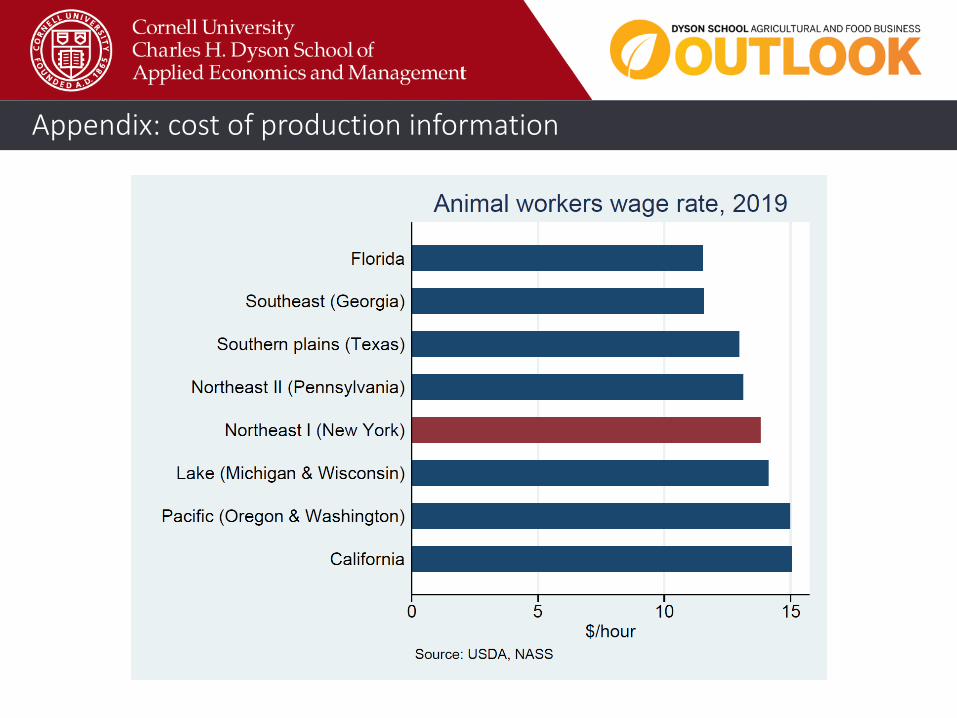
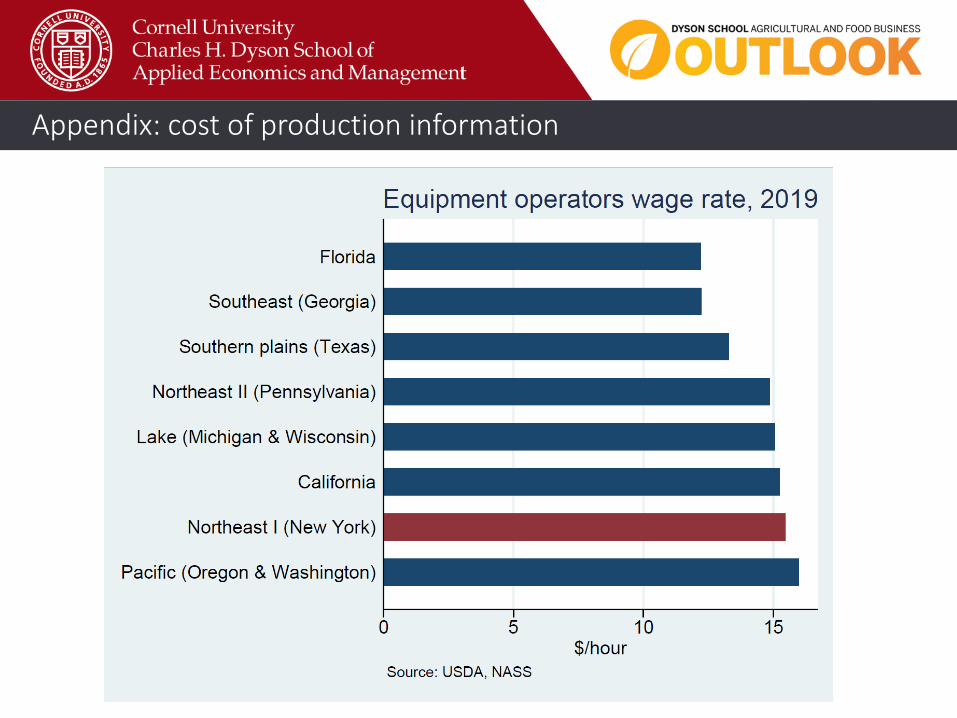
Labor (2) X
Construction (3-4) ? ?
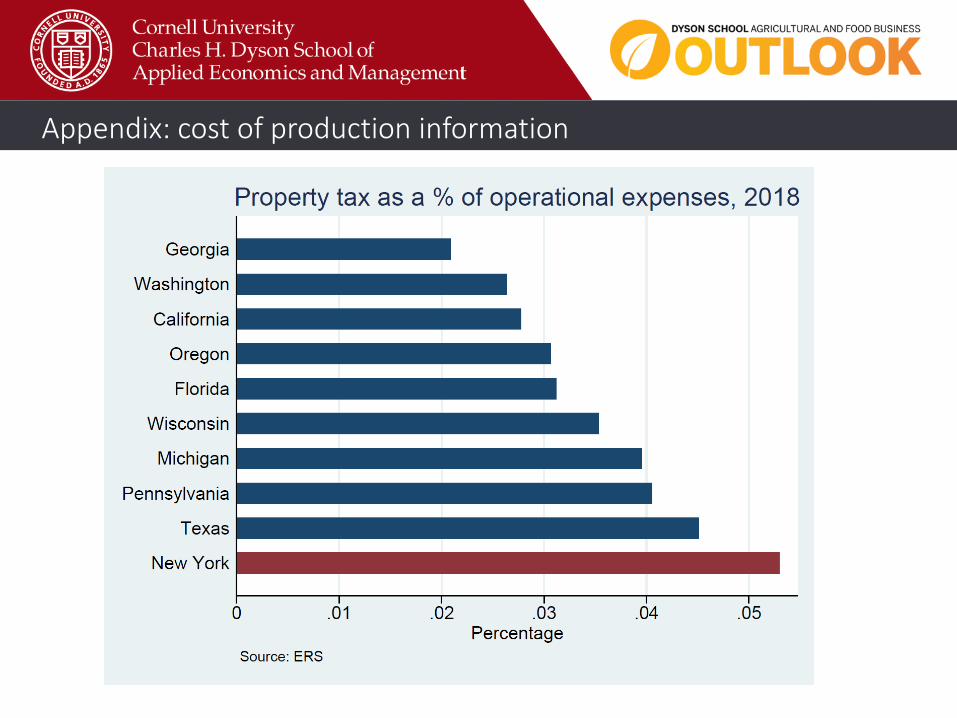
Property taxes (6) X
Fuel (7) X
Electricity (12) X
Land X
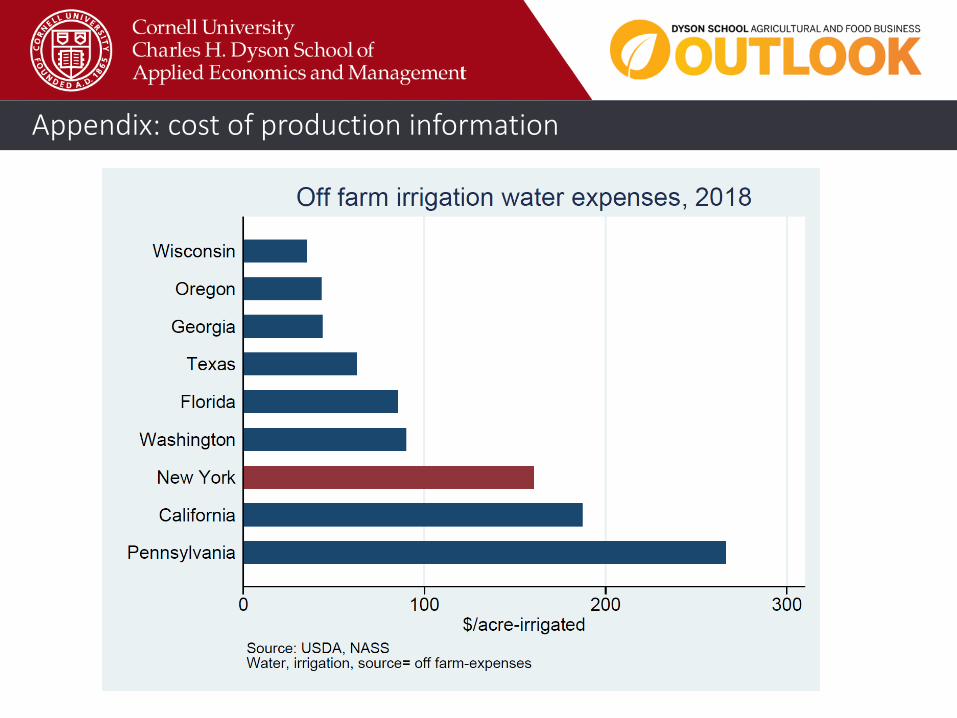
Irrigation ? ?
General cost of business
X
Note: approximate NY ranking for expenses levels in () based on USDA Economic Research Service data

Moderate corn price

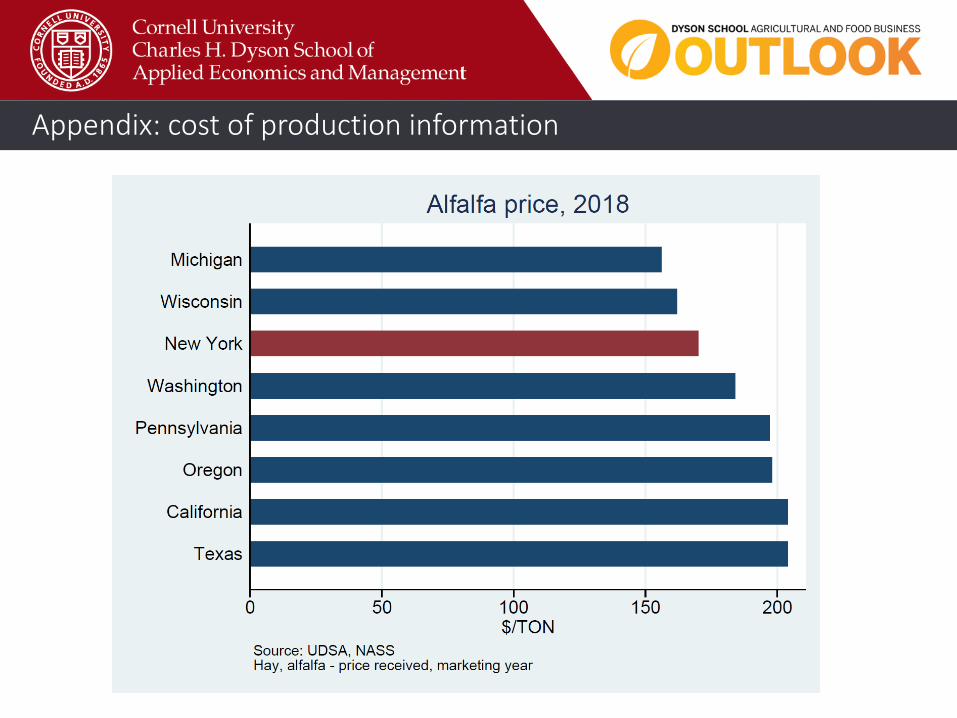
Moderate alfalfa price
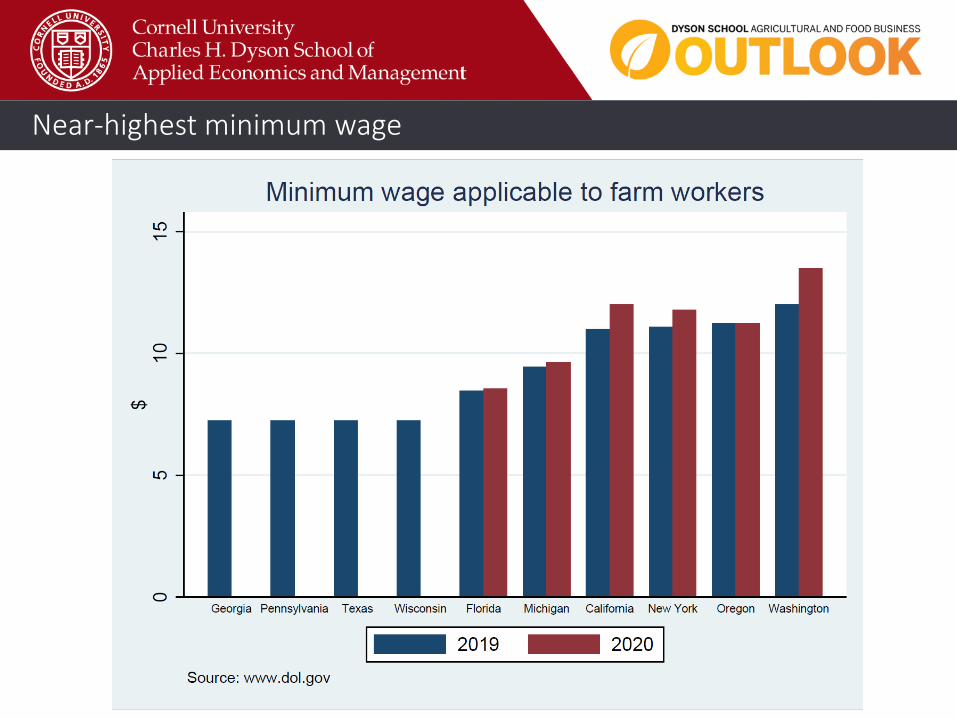
Near-highest minimum wage
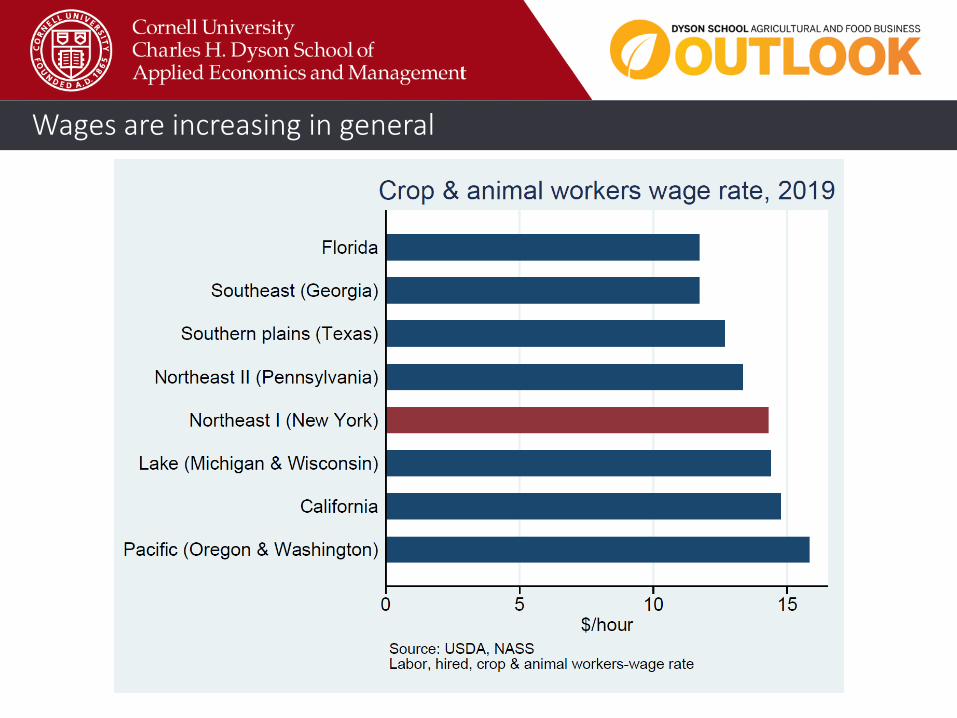
Wages are increasing in general

Moderate construction costs

High property tax rate
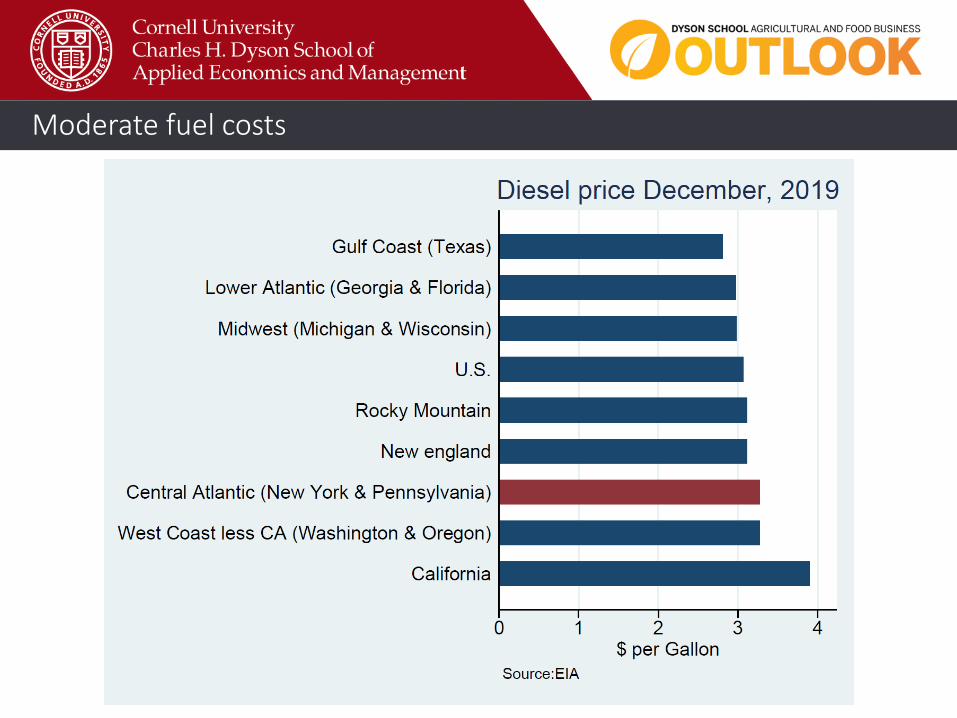
Moderate fuel costs

Average electricity costs

Relatively low real estate costs

Moderate farmland affordability

Moderate farmland affordability
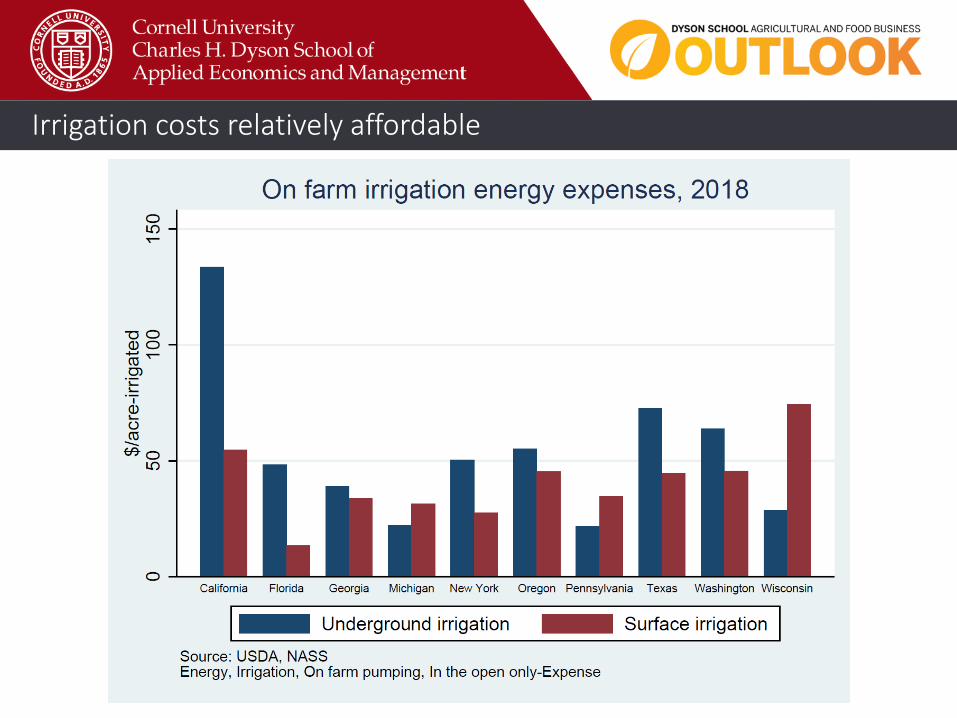
Irrigation costs relatively affordable

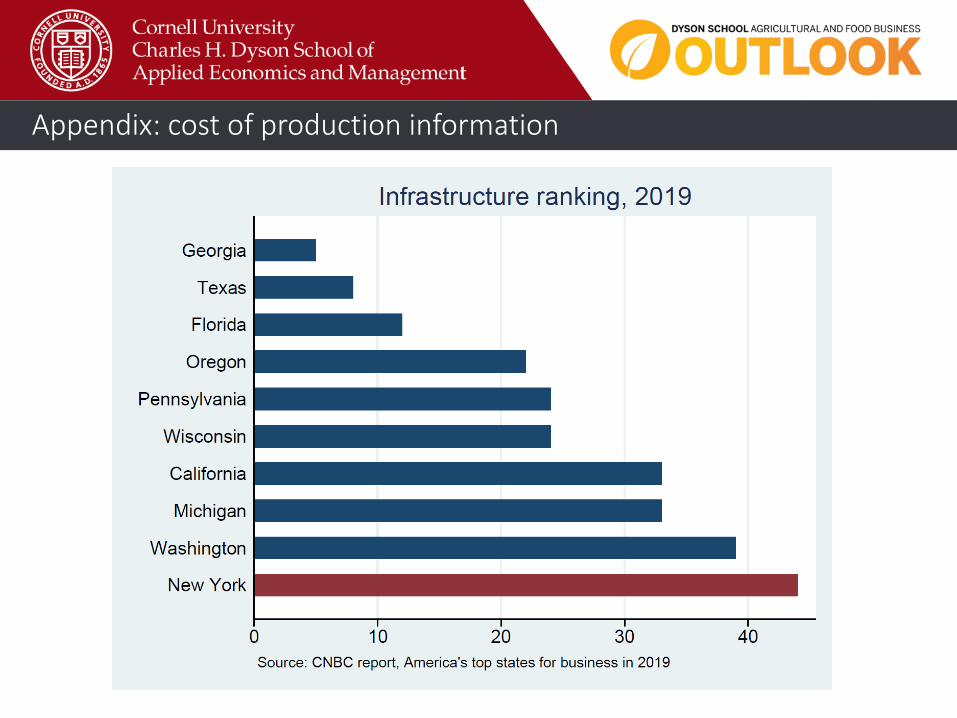
Overall business climate is right in the middle

Summary – cost of production
• NY doesn’t have a cost advantage in general, tends to be on the high cost side• But usually not the worst• Similar to many competitors
• Implications• Competitive edge not based on
underlying costs• NY advantage lies elsewhere
• Innovation• Marketing and market access• Human capital

Nontraditional finance - introduction
Traditional finance Nontraditional finance
USDAFSA

Nontraditional finance: why does it matter?
• Farm management• Maturing agricultural credit market with increasingly complex alternatives• Influences cost of production
• Important during periods of farm stress
Source https://www.democratandchronicle.com/story/news/2016/12/09/its-a-wonderful-life-seneca-falls-george-bailey-frank-capra/94825632/
OR ?
Off ramp

Nontraditional finance: what do we know?
• Nontraditional finance is growing• Less or “differently” regulated• Data is not always available
• May lead to higher input costs• https://www.progressiveforage.com/forage-production/management/managing-
seed-discounts-and-financing
• Research finding: (implicit) feed supplier financing has been important for NY dairy industry
https://investigatemidwest.org/2019/12/26/the-largest-single-beneficiary-of-trumps-tariff-payments-an-alternative-farm-lender/

Nontraditional finance: research NE feed supplier credit
• MS thesis project – Chad Fiechter• Partnership with NEAFA
• Survey of feed manufacturers, representing > 70% of NE feed industry
• Goals: establish industry norms, estimate feed supplier credit volume, compare to lenders
• Trade credit terms & financial metrics, 2014-18• Sales, volume for dairy feed & ingredients• Value of sales past due• Value of sales >90 days past due• Current terms
• Project report in progress

Demand for financing driven by milk prices
Source: Fiechter and Ifft, 2019Data: Cornell Dairy Farm Business Summary
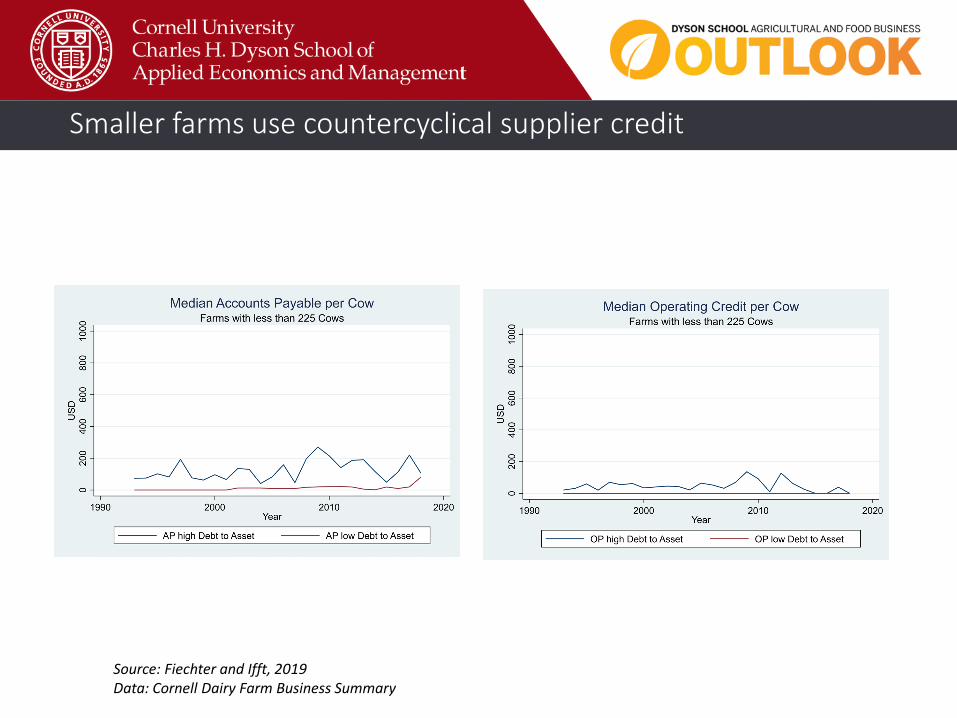
Smaller farms use countercyclical supplier credit
Source: Fiechter and Ifft, 2019Data: Cornell Dairy Farm Business Summary

Midsize farms have higher AP than OC balance recently
Source: Fiechter and Ifft, 2019Data: Cornell Dairy Farm Business Summary

Supplier credit less important for large than midsize farms
Source: Fiechter and Ifft, 2019Data: Cornell Dairy Farm Business Summary
Data issues….

Looking forward
• The current 2020 outlook is stable to “cautiously optimistic”, as usual a lot could go wrong
• Politics continue to be a source of volatility• TRADE is a continued source of uncertainty but may be
stabilizing with new trade deals• Government programs ($) have supported positive incomes
for grain farms, might create longer-term uncertainty
• Labor supply and cost will continue to be an issue
• Many NY farms are struggling in the current farm economy, lots of signposts for a (continued) “shrinking middle”
• There are many opportunities for NY agriculture, competitive advantages lies in innovation and market access, not cost
Jennifer IfftAssistant ProfessorMueller Family Sesquicentennial Faculty Fellow in Agribusiness and Farm ManagementPhone: (607) 255-4769Email: [email protected]: http://dyson.cornell.edu/people/profiles/ifft.php

Appendix: MFP

Appendix: MFP

Appendix: MFP

Appendix: MFP

Appendix: MFP

Appendix: cost of production information
Appendix: cost of production information
Appendix: cost of production information

Appendix: cost of production information

Appendix: cost of production information

Appendix: cost of production information

Appendix: cost of production information

Appendix: cost of production information

Appendix: cost of production information

Appendix: cost of production information

Appendix: cost of production information

Appendix: cost of production information

Appendix: cost of production information
Appendix: cost of production information

Appendix: cost of production information

Appendix: cost of production information
Appendix: cost of production information

Appendix: cost of production information
Appendix: cost of production information

Appendix: cost of production information
Appendix: cost of production information

Appendix: cost of production information