Embed Size (px)
Citation preview

ECONOMICAL IMPACT OF A DUAL GRADIENT DRILLING SYSTEM
A THESIS SUBMITTED TO THE GRADUATE SCHOOL OF NATURAL AND APPLIED SCIENCES
OF MIDDLE EAST TECHNICAL UNIVERSITY
BY
MERTER PEKER
IN PARTIAL FULFILLMENT OF THE REQUIREMENTS FOR
THE DEGREE OF MASTER OF SCIENCE IN
PETROLEUM AND NATURAL GAS ENGINEERING
JUNE 2012
ii
Approval of the thesis:
ECONOMICAL IMPACT OF A DUAL GRADIENT DRILLING SYSTEM
submitted by MERTER PEKER in partial fulfillment of the requirements for
the degree of Master of Science in Petroleum and Natural Gas
Engineering Department, Middle East Technical University by,
Prof. Dr. Canan Özgen _________ Dean, Graduate School of Natural and Applied Sciences
Prof. Dr. Mahmut Parlaktuna _________ Head of Department, Petroleum and Natural Gas Eng.
Prof. Dr. Mahmut Parlaktuna _________ Supervisor, Petroleum and Natural Gas Eng. Dept., METU
Examining Committee Members:
Prof. Dr. Nurkan Karahanoğlu _________ Geological Eng. Dept., METU Prof. Dr. Mahmut Parlaktuna _________ Petroleum and Natural Gas Eng. Dept., METU Assist. Prof. Dr. Çağlar Sınayuç _________ Petroleum and Natural Gas Eng. Dept., METU M.Sc. H. Ali Doğan _________ TPAO, ANKARA M.Sc. E. Doruk Tanyel _________ TPAO, ANKARA
Date: 19.06.2012_

iii
I hereby declare that all information in this document has been obtained and presented in accordance with academic rules and ethical conduct. I also declare that, as required by these rules and conduct, I have fully cited and referenced all material and results that are not original to this work.
Name, Last Name: MERTER PEKER
Signature:

iv
ABSTRACT
ECONOMICAL IMPACT OF A DUAL GRADIENT DRILLING SYSTEM
Peker, Merter
M.Sc., Department of Petroleum and Natural Gas Engineering
Supervisor: Prof. Dr. Mahmut Parlaktuna
June 2012, 74 pages
Dual Gradient Drilling (DGD) system is a promising technology that was
developed to overcome the deep water drilling problems occurred due to
narrow operating window between pore pressure and fracture pressure.
In conventional drilling practice, single mud weight exists from drilling unit
to TVD (True Vertical Depth) which creates big hydrostatic pressure in
bottom hole ,moreover, minor changes in mud weight results a big
pressure changes proportional to the length of hydrostatic column increase
with water depth. On the other hand, DGD allows using two different mud
weights to get same bottom hole pressure; low gradient drilling fluid from
drilling unit to the sea floor and high gradient drilling fluid form the sea floor
to TVD, to decrease the effect of water column on mud hydrostatic
pressure in TVD.

v
In this thesis, a conventionally drilled deepwater well was redesigned
considering the DGD system and drilled virtually to determine the changes
of cost of services and materials on total operation budget to prove the
positive impact of system on total operation cost.
This study not only proved the technical advantages of the DGD system,
but also showed economical impact of the system on total drilling cost, by
decreasing around 19%.
Keywords: Dual Gradient Drilling, Subsea Mudlift Drilling (SMD) System,
Deep Water Drilling, Drilling Expenditure.
vi
ÖZ
ÇİFT BASINÇ EĞİLİMLİ SONDAJ SİSTEMİNİN EKONOMİK ETKİSİ
Peker, Merter
Yüksek Lisans, Petrol ve Doğal Gaz Mühendisliği Bölümü
Tez Yöneticisi: Prof. Dr. Mahmut Parlaktuna
Haziran 2012, 74 sayfa
Çift Basınç Eğilimli Sondaj, derin denizlerdeki sondajlarda formasyon
basıncı ve formasyon çatlatma basıncı arasındaki dar operasyon alanının
ortaya çıkardığı zorlukları çözmek adına geliştirilmiş umut vadeden bir
teknolojidir.
Geleneksel sistemde kullanılan sondaj çamuru sondaj ünitesinden kuyu
dibine kadar tek basınç eğiliminde kuyu dibine basınç uygular. Sondaj
çamurundaki ufak öz kütle değişikleri kuyu dibine kuyu derinliği ile orantılı
olarak etki eder ve bu derinlik su derinliği arttıkça artış gösterir. Bu durum
güvenli bir operasyon yapmak için, içinde bulunulması gereken
operasyonda çalışmayı zorlaştırır. Çift Basınç Eğilimli Sondaj, su
sütununun kuyu dibi basıncı üzerindeki etkisini azaltmak amacıyla, iki farklı
çamur ağırlığı kullanılarak aynı kuyu dibi basıncını elde etmeye olanak
tanır; sondaj ünitesinden deniz tabanına kadar düşük öz kütleli sondaj

vii
çamuru kullanılırken, deniz tabanından kuyu dibine kadar ağır öz kütleli
sondaj çamuru kullanılır.
Bu tezde sistemin olumlu etkisini kanıtlamak için, geleneksel yollarla
kazılan bir kuyu Çift Basınç Eğilimli Sondaj sistemi ile tekrar dizayn
edildikten sonra, sanal sondaj operasyonu tatbik edilmiştir. Sondaj
servislerindeki ve sondaj malzemelerindeki maliyet düşüşlerinin toplam
operasyon bütçesindeki etkisi ortaya konulmuştur.
Bu çalışma Çift Basınç Eğilimli Sondaj sisteminin teknik avantajlarını
kanıtlamanın yani sıra, sistemin ekonomik etkisini, toplam operasyon
maliyetindeki 19%’lik azalma ile ortaya koymuştur.
Anahtar Kelimeler: Çift Basınç Eğilimli Sondaj, Denizaltı Çamur Kaldıraç
Pompa Yöntemi, Derin Deniz Sondajı, Sondaj Maliyeti.

viii
ACKNOWLEDGMENTS
I wish to express his deepest gratitude and appreciation to Prof. Dr.
Mahmut Parlaktuna for his guidance, advice, help and encouragement
throughout this study.
I would like to thank to my parents, my brother and my biggest supporter
Zeynep Aksoy, for their endless support, trust, love and understanding in
every stage of this study.
For sharing their experience, I would like to thank to Ali Uçarlar, Serhat
Altun, Fernando Nobrega, Jose Carlos Bruno, Tuğçe Bayram, Gökhan
Cüylan.
ix
TABLE OF CONTENTS
ABSTRACT ..................................................................................................... iv
ÖZ ................................................................................................................... vi
ACKNOWLEDGMENTS ................................................................................. viii
TABLE OF CONTENTS .................................................................................. ix
LIST OF TABLES ............................................................................................ xi
LIST OF FIGURES ......................................................................................... xii
LIST OF SYMBOLS AND ABBREVIATIONS ................................................. xiii
CHAPTERS
1.INTRODUCTION ........................................................................................... 1
2.LITERATURE REVIEW ................................................................................. 4
2.1 Conventional Drilling ............................................................................... 4
2.2 Dual Gradient Drilling ............................................................................ 11
2.3 Advantages of Dual Gradient Drilling .................................................... 14
2.4 Types of Dual Gradient Drilling Systems ............................................... 16
2.4.1 Reduced Mud Weight .................................................................... 17
2.4.1.1 Mud Dilution ............................................................................ 17
2.4.1.2 Injection of Hollow Spheres of Low Density ............................. 18
2.4.2 Mechanical Mud Lifting .................................................................. 20
2.4.2.1 Subsea Mudlift Drilling (SMD) ................................................. 21
2.4.2.2 Deep Vision ............................................................................. 22
2.4.2.3 Shell's Subsea Pumping System (SSPS) ................................ 22
2.4.2.4 Controlled Mud Pressure (CMP) ............................................. 22
2.5 CONCEPT OF SUBSEA MUDLIFT DRILLING SYSTEM ..................... 24
2.5.1 History ............................................................................................ 25
2.5.1.1 Phase I – Conceptual Engineering .......................................... 26
2.5.1.2 Phase II – Component design and Testing, Procedure
Development ........................................................................................ 28
2.5.1.3 Phase III – System Design, Fabrication and Testing ............... 29
2.5.2 Operational part ............................................................................. 31
2.5.3 U tube ............................................................................................ 36
3.STATEMENT OF THE PROBLEM .............................................................. 39
4.METHOD OF STUDY .................................................................................. 40
4.1 Alpha Well ............................................................................................. 42
4.2 Simulation Criteria ................................................................................. 45
x
4.2.1 Designing Beta Well (Re-designing Alpha Well with DGD
system) .................................................................................................... 45
4.2.2 DWOP (Drill Well on Paper) Beta Well .......................................... 46
4.2.3 Establishing Beta Well AFE breakdown ......................................... 49
5.SIMULATION RESULTS, ANALYSIS AND DISCUSSION .......................... 52
5.1 Design Beta Well................................................................................... 52
5.1.1 Wellhead Selection ........................................................................ 55
5.1.2 Casing Selection (Casing Types, Casing Accessories, Liner
hanger & Cement Chemicals) .................................................................. 56
5.1.3 Mud Chemicals .............................................................................. 58
5.1.4 Bit Selection ................................................................................... 62
5.1.5 Section Based Service ................................................................... 63
5.2 DWOP Beta Well................................................................................... 64
5.3 BETA WELL COST CALCULATION ..................................................... 68
6.CONCLUSIONS .......................................................................................... 71
REFERENCES ............................................................................................... 73
xi
LIST OF TABLES
TABLES
Table 2.1 Casing selection for conventional well and DGD well ................ 30
Table 4.1 AFE Example ............................................................................ 41
Table 4.2 Alpha Well Casing List ............................................................... 43
Table 4.3 Time Breakdown of Alpha Well Per Sections ............................ 44
Table 4.4 Operation Sub Categories ......................................................... 46
Table 4.5 Alpha Well Operation Breakdown- Detailed .............................. 48
Table 4.6 Alpha Well AFE Breakdown ...................................................... 51
Table 5.1 Example Depth Correction ........................................................ 52
Table 5.2 Beta Well Casing List ................................................................ 55
Table 5.3 Alpha Well Casing Summary ..................................................... 57
Table 5.4 Beta Well Casing Summary ....................................................... 58
Table 5.5 Comparison Table Alpha – Beta ................................................ 58
Table 5.6 Alpha Well Volume Summary .................................................... 60
Table 5.7 Alpha Well Maximum Volume .................................................... 60
Table 5.8 Mud – Volume Ratio .................................................................. 61
Table 5.9 Beta Well Volume Summary ...................................................... 61
Table 5.10 Beta Well Mud – Volume Calculation ...................................... 62
Table 5.11 Bit Selection Table .................................................................. 62
Table 5.12 Section Based Services ........................................................... 64
Table 5.13 Alpha – Beta Section Comparison ........................................... 65
Table 5.14 ROP Calculation ...................................................................... 65
Table 5.15 Total Operation Time ............................................................... 66
Table 5.16 Alpha Well Timeline ................................................................. 67
Table 5.17 Beta Well AFE Breakdown ...................................................... 69

xii
LIST OF FIGURES
FIGURES
Figure 1.1 Differences between Conventional Drilling and DGD. ................ 2
Figure 1.2 Schematic demonstration of dual gradient system effect. .......... 3
Figure 2.1 Schematic Demonstration of Pressure Behavior ........................ 5
Figure 2.2 Schematic Subsea Drilling Equipment. ...................................... 7
Figure 2.3 Casing Setting Points ................................................................. 8
Figure 2.4 Effect of Sea Water on Formation Pressure Calculation. ........... 9
Figure 2.5 Schematic of Effect of Sea Water on Well Design. .................. 10
Figure 2.6 Zoom of the Area X. ................................................................. 10
Figure 2.7 Schematic of Effect of Sea Water on Well Design. .................. 13
Figure 2.8 Zoom of the Area Y. ................................................................. 13
Figure 2.9 Schematic Of DGD Techniques. .............................................. 16
Figure 2.10 Schematic of Mud Dilution System. ........................................ 18
Figure 2.11 Schematic of Mud Dilution System ......................................... 19
Figure 2.12 Schematic of Mechanical Mud Lifting. .................................... 20
Figure 2.13 Positive Displacement Diaphragm Pumps. ............................ 21
Figure 2.14 Schematic of Controlled Mud Pressure System-1. ................. 23
Figure 2.15 JIP project schedule ............................................................... 26
Figure 2.16 Schematic of SubSea Mudlift System. ................................... 32
Figure 2.17 Schematic of Mudlift Pump. .................................................... 33
Figure 2.18 Schematic of Subsea Rotating Device ................................... 34
Figure 2.19 Picture of Subsea Rotating Device. ........................................ 35
Figure 2.20 Schematic of Drill String Valve. .............................................. 36
Figure 2.21 Schematic of U-Tube – Dynamic Condition ............................ 37
Figure 2.22 Schematic of U-Tube – Static Condition ................................. 37
Figure 4.1 Pressure Graph of Alpha Well .................................................. 42
Figure 4.2 Pressure Graph of Alpha Well with mud weight. ...................... 43
Figure 4.3 Time vs Depth Graph of Alpha Well. ........................................ 44
Figure 4.4 Beta Well Simulation Flow ........................................................ 45
Figure 5.1 Pressure vs Depth Graph of Beta Well. .................................... 53
Figure 5.2 Beta Well Architecture .............................................................. 54
Figure 5.3 Relation To Calculate Mud Consumption ................................. 59
Figure 5.4 Time Vs Depth Comparison of Alpha and Beta Well ................ 68

xiii
LIST OF SYMBOLS AND ABBREVIATIONS
Pf= Formation Pressure, psi
Pfracture= Fracture Pressure, psi
Pfluid= Fluid Hydrostatic Pressure, psi
μ = Viscosity, cp
ρfluid = Fluid density, lbm/ft3
σ= Overburden stress, psi
ROP= Rate of Penetration
AFE= Authorization for Expenditure
D=Depth, m
WD= Water Depth, m
TVD= True Vertical Depth, m

1
CHAPTER 1
INTRODUCTION
In order to meet the world's increasing demand for energy and petroleum
need, major oil and gas companies started to search for oil and gas in new
environments. Based on their evaluations of the earth, most of these
companies were interested to explore for resources offshore. Oil and gas
discoveries in shallow water areas encouraged them to search deep water
areas. As drilling moves into deeper waters, new technologies must be
developed for safe and successful operations.
Drilling in deep water is complicated and expensive compared to the
onshore or shallow water exploration operations. As the search for
hydrocarbons is getting deeper, new prospects are discovered where the
difference between the pore pressure and the fracture pressure is
decreased that in turn has a negative effect on the drilling operation. In
conventional drilling, single gradient drilling, that has a single mud weight is
used from surface to total depth to control bottom hole pressure (BHP). On
the other hand single gradient drilling does not successfully solve the
problem of narrow operation window between pore and fracture pressure in
deep water drilling operations. This resulted companies to use longer
casing strings with bigger sizes and wider ranges, larger wellheads,
heavier risers and more expensive rigs to reach target zones.
2
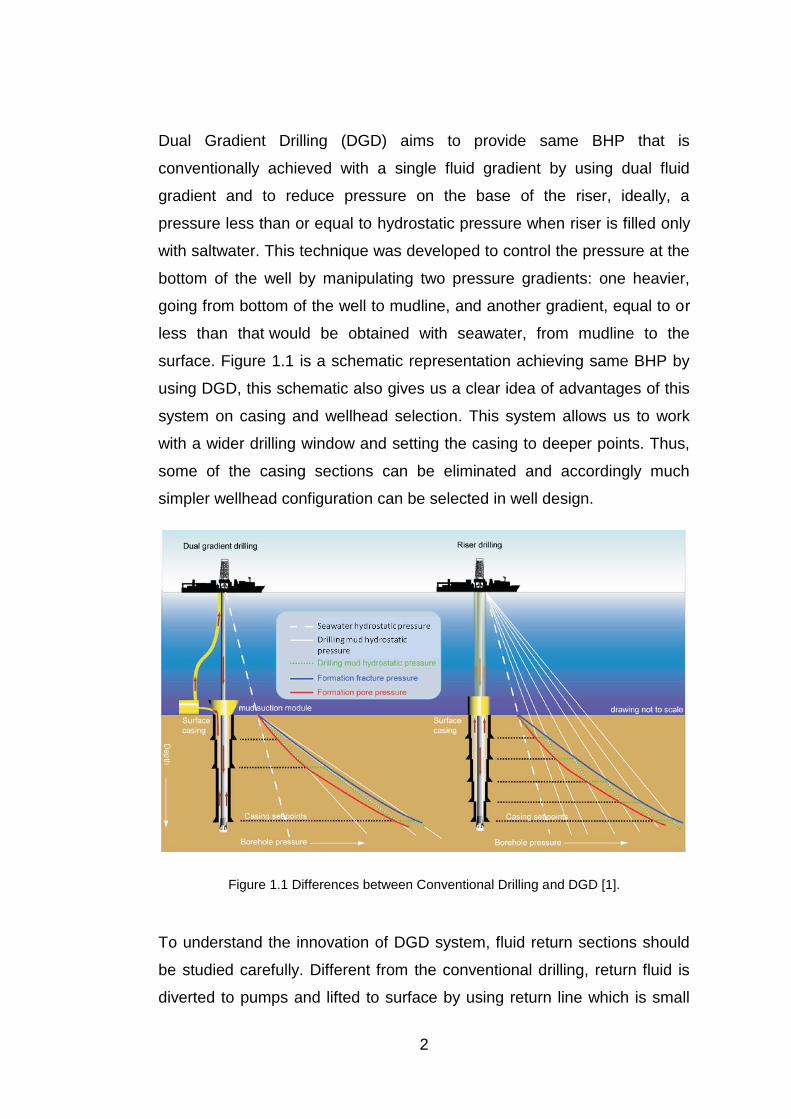
Dual Gradient Drilling (DGD) aims to provide same BHP that is
conventionally achieved with a single fluid gradient by using dual fluid
gradient and to reduce pressure on the base of the riser, ideally, a
pressure less than or equal to hydrostatic pressure when riser is filled only
with saltwater. This technique was developed to control the pressure at the
bottom of the well by manipulating two pressure gradients: one heavier,
going from bottom of the well to mudline, and another gradient, equal to or
less than that would be obtained with seawater, from mudline to the
surface. Figure 1.1 is a schematic representation achieving same BHP by
using DGD, this schematic also gives us a clear idea of advantages of this
system on casing and wellhead selection. This system allows us to work
with a wider drilling window and setting the casing to deeper points. Thus,
some of the casing sections can be eliminated and accordingly much
simpler wellhead configuration can be selected in well design.
Figure 1.1 Differences between Conventional Drilling and DGD [1].
To understand the innovation of DGD system, fluid return sections should
be studied carefully. Different from the conventional drilling, return fluid is
diverted to pumps and lifted to surface by using return line which is small

3
diameter line from sea floor to drilling unit. The hydrostatic head below the
mud line is made equivalent as drilling unit placed on the sea floor and the
hydrostatic pressure problem of the sea water is eliminated, demonstrated
in Figure 1.2.
Figure 1.2 Schematic demonstration of dual gradient system effect.
It is an expensive, complex, step-change technology that the industry has
been trying to develop for over a decade. A number of different strategies
have been attempted with varying degrees of success. Major oil companies
have efforts to commercialize this technology and bring it to fruition.
Although the technical advantages of this system were reported in many
articles, there is no paper published to show the economical impact of this
system on total operational cost. Therefore, this study was performed to
figure out this impact by resigning the previously drilled deep water well
with DGD system and simulating the drilling of the resigned well on paper.
Finally, the expenditures of both wells (original and redesigned) were
compared to show this impact.

4
CHAPTER 2
LITERATURE REVIEW
In this chapter of the study, the aim is provide more information about
DGD; starting from the basic to advance. Thus it is going to be started with
conventional drilling; the way that industry uses mostly today, and be
continued with DGD and what kind of advantages that DGD brings to
industry, then the chapter is finalized with different kinds of system to
achieve DGD.
2.1 Conventional Drilling
The aim of the conventional drilling is to optimize BHP between pore
pressure and fracture gradient to make a controlled drilling where pore
pressure is defined as the pressure of fluids inside the pore of the
formation, usually hydrostatic pressure and fracture pressure are defined
as the pressure at which a formation break down, or fracture.
5
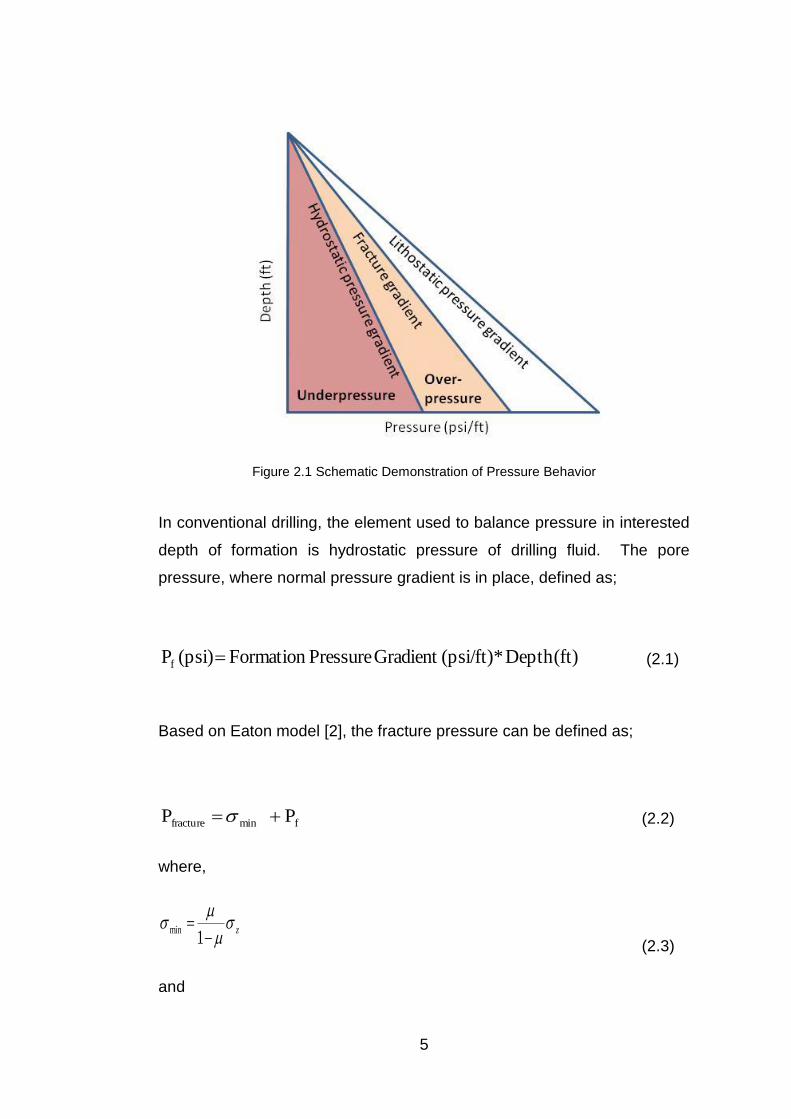
Figure 2.1 Schematic Demonstration of Pressure Behavior
In conventional drilling, the element used to balance pressure in interested
depth of formation is hydrostatic pressure of drilling fluid. The pore
pressure, where normal pressure gradient is in place, defined as;
(ft)Depth * (psi/ft)Gradient PressureFormation (psi)Pf
(2.1)
Based on Eaton model [2], the fracture pressure can be defined as;
fminfracture P P (2.2)
where,
z
1 min
(2.3)
and

6
fP noverburdenz (2.4)
Therefore, to perform a balanced drilling, drilling fluid hydrostatic pressure
value stays between pore pressure and fracture pressure.
Pformation < Pfluid < Pfracture (2.5)
where,
D fluidfluid 0.052 P
(2.6)
Considering the deep water environment, pore pressure and fracture
pressure are directly affected by the water column; the hydrostatic
pressure of the water is also added to the pore pressure to calculate the
total formation pressure of the interested depth, from sea level.
Likewise, due to usage of the marine riser, (which is the link to conduct to
drilling fluid between sea floor to drilling unit [2], figure 2.2) the hydrostatic
pressure of the drilling fluid in the marine riser section, is taken into
account to calculate BHP (which is demonstrated in figure 2.2).

7
Figure 2.2 Schematic Subsea Drilling Equipment [2].
Therefore, the formation pressure is calculated like;
WD)-(TD *ent ress.GradiFormationP WD* s.Gradient WaterPresPf (2.7)
How to Select Casing Setting Depths
The correlation of pore-pressure gradients and fracture gradients is the
main criteria to determine the number of casing string and their setting
depths.
The mud weight is chosen above the formation pore pressure in interested
depth (casing shoe point) and is kept constant until reaching the bottom

8
hole pressure (mud hydrostatic) excess the fracture pressure (next casing
shoe point) where both formation pore pressure and fracture pressure are
expressed as equivalent circulating density. Moreover, trip margin, which is
the effect of pipe movement on bottom hole pressure; commonly used
0.5ppg, is also considered during design process.
The Figure 2.3 shows the way of the selection if casing setting depths
based on these pressure gradients.
Figure 2.3 Casing Setting Points
Considering the minimum mud weight to reach objective depth at Point-A
without getting an influx from formation fluid, Point-B is the maximum point
that this fluid can result safe operation without fracturing the formation.
Thus, the Point-B, where fracture gradient is equal to mud weight, is
selected to set casing shoe depth and selected mud weight is used
between Point-A and Point-B to perform operation.

9
After the determination of the casing shoe depth in Point-B, new mud
weight is selected to figure out new casing shoe in upper section.
Similarly, lowest mud weight is selected in Point-B considering the pore
pressure gradient in same depth, which is Point-C. The new weight can
balance the formation pressure until fracturing it until Point-D where is the
casing shoe point prior casing.
Figure 2.4 Effect of Sea Water on Formation Pressure Calculation.
The hydrostatic pressure of water column makes engineer to design more
complex well architecture and drilling program. The main reason of this is
the narrow operation area between pore pressure and fracture pressure
which is called operating window. As it is mentioned before, to perform a
safe and controlled drilling operation, hydrostatic pressure of the drilling
fluid should be selected inside the operating window. On the other hand,
in deep water environment due to the additional hydrostatic pressure of
the water, operating window gets narrow. Thus, more complex well
architecture is required with many sections and casings. In figures 2.4 and
2.5 are the demonstration of this problem; to drill down to planned depth,
five sections are needed to be drilled with five different mud weight and
four different casing are needed to be set.

10
Figure 2.5 Schematic of Effect of Sea Water on Well Design.
Figure 2.6 Zoom of the Area X.
Area X-

11
The Figure 2.6 shows the zoom version of the Area X marked in Figure
2.5 with the application of the casing selection depths mentioned with
Figure 2.3. The only difference between these figures; the graph in Figure
2.3 is drown in pressure gradient vs depth but; the graph in Figure 2.5 is in
pressure vs depth. Thus, the vertical lines referring constant mud weight in
Figure 2.3 same as the straight trendy lines. Similarly, after determining
the casing setting depth in Point-B, next mud weight is calculated based
on pore pressure value in same depth. The operation can be performed
safely inside the operation window until reaching the depth where mud
pressure is equal to fracture pressure. This is the signal of necessity of
changing mud weight and setting new casing.
Other critical point that questions the conventional drilling in deep water
environment, open hole section of the wellbore faces with risk of fracture
due to full column of drilling fluid between drilling unit and TVD [3].
The risk of the fracturing the formation and the expensive design of well
architecture due to narrow operation window make companies to search
different techniques and technologies. Dual Gradient Drilling, the one of
the invention, was developed to cure these problems.
2.2 Dual Gradient Drilling
Basic definition of DGD is a technique that allow us to use two different
pressure gradient to maintain same bottom hole pressure as conventional
drilling. The importance of the using two pressure gradient is to eliminate
the effect of the hydrostatic pressure of the sea water. To achieve dual
gradient, special design materials and tool designed to support, one

12
gradient which is equal to water gradient from sea floor to mud line and
second gradient from mud line to total depth.
DGD provides opportunity to work with narrow operation window than
conventional drilling by replacing reference point of pore & fracture
pressures calculation to mudline which is rotary table in conventional.
Wider operation window allows setting fewer casing size and going deeper
sections. Thus, the simpler wellhead configuration can be used. Another
benefit of working wider operation window is limitations on determining the
mud weight decrease, which reduce the risk of kicks & lost circulation and
increase the operational ability during well control operations.
Figure 2.7 shows the effect of dual gradient concept on operation window
and casing selection. This graph was prepared with same data as figure
2.5 by simulating dual gradient concept. It is very good example to see how
DGD does effective solution to well design problems due to narrow window
between pore and fracture pressure.

13
Figure 2.7 Schematic of Effect of Sea Water on Well Design.
Figure 2.8 Zoom of the Area Y.
Area Y-

14
Figure 2.8 shows the Area Y with the study of casing selection point. In this
case, the selected mud weight can cover longer interval after eliminating
effect of extra mud pressure due to water column.
After applying the same process to the advantages and the techniques to
achieve DGD are briefly explained in next chapters. Moreover, as a main
goal of this study, the economic impact of the DGD is deeply investigated.
2.3 Advantages of Dual Gradient Drilling
Considering the main purpose of the DGD; eliminating drilling fluid head
inside the riser, the return of this system is to improve the working interval
between formation pressure and fracture pressure. This improvement
actually brings advantage of the system from designing phase to
completion phase.
High pore pressure and low fracture gradients leads engineer to design
well with more casing points not to fracture the formation. This issue also
drives many problems like selection of wellhead. The more casing size, the
more complex wellhead is need to be selected which means extra money,
delivery time, even larger and heavier risers and finally bigger, more
expensive rigs selection.
Setting additional casing strings to reduce the operational risks, increase
the well integrity and allow drilling head create a risk not to reach targeted
TVD, count out your contingency options as well. Even target can be
reached, mostly well is ended up with small production casing, which also

15
limits well production design. Small wellbore at TVD precludes large
production tubing - limiting production rates.
Dual Gradient Drilling is the cure of all problems mentioned above.
Creating wider operational window allow using fewer casing strings, thus
less complex wellhead configurations can be selected. Moreover, less
casing string are required to reach planned TVD without reducing hole size
which allows room for high rate completions. Reducing casing strings also
means that fewer casing, cementing and logging operations which results
with shorter drilling campaigns with lower cost. Reduced operation cost
allows drilling wells being not commercial with conventional drilling, which
makes exploring new areas and developing deeper wells possible.
In terms of subsea point of view, DGD system reduce the weight of riser
system which expands capacity of existing rig fleet and mitigates effects of
high currents.
Conventional deep water drilling results in longer and heavier drilling risers
and well control become more difficult due to the pore pressure and
fracture pressure proximity and long choke lines with high friction pressure
drops. DGD also helps us to solve this issue and gives opportunity perform
better well control. Also DGD safer than the conventional drilling in case of
any emergency disconnect because the riser filled by sea water which
allow to makes safer and more environmental friendly emergency
disconnects.

16
2.4 Types of Dual Gradient Drilling Systems
There are three main techniques also illustrated on Figure 2.9, were
developed to achieve DGD by reducing the annular mud hydrostatic
pressure at riser; Mechanical Mud Lifting (mud pumps), Mud Dilution (gas
lift) and Hollow Glass Spheres (lightweight solid additives).
Figure 2.9 Schematic Of DGD Techniques [4].
Although, Mud Dilution and Hollow Glass Spheres techniques shown with
riser, with the required mortification, both system can be used as riserless
with return line [4].
In this study, three techniques will be studied under two sections;
1- Reduced Mud Weight; based on low-density components injection into
riser to decease mud weight.
2- Mechanical Mud Lifting; based on installing pumps to sea floor to lift
return mud from seabed to drilling unit.

17
2.4.1 Reduced Mud Weight
The technique consists of diluting the mud returns from the base of the
riser to above sea floor with the injection of low-density components such
as; nitrogen and hollow spheres. This is the way to cut the mud and reduce
the mud density to sea water gradients or lower.
Mainly, there are two techniques to diluting the mud in the riser; injecting
low density fluid, nitrogen or adding lightweight solid additives to mud.
2.4.1.1 Mud Dilution
Development of the Dual Gradient Drilling concept (DGD) injection
of lighter fluid in the Lower Marine Riser Package (LMRP) for the
purpose of avoiding drilling problems such as loss of circulation, in
scenarios characterized by narrow operating margin between pore
pressure and fracture.
Instead of removing mud column in the riser, this system dilutes the mud in
the riser to reduce extra mud hydrostatic in the riser by decreasing mud
weight. Nitrogen is injected to cut mud weight from down riser to seafloor.
Low density fluid (nitrogen) reduces the weight of return mud equal or
lower than mud weight.
Figure 2.10 show the basic flow line and cycle of Mud Dilution technique.
Low density fluid (nitrogen) is pumped from rig floor to down riser via lower
marine riser package (LMRP) then mixes with return mud to get reduced
mud weight fluid. Mixed fluid goes up to separator on rig floor where
mixture is separated into low density fluid and mud.

18
Figure 2.10 Schematic of Mud Dilution System.
Use of nitrogen, as the fluid to lower the density of the mud, needs
availability of storage space on drilling unit for the tanks of nitrogen and
multiphase separator to split nitrogen from mixed fluid. Moreover,
compressibility factor of nitrogen causes non-linear pressure gradient
inside the riser. [4]
2.4.1.2 Injection of Hollow Spheres of Low Density
The US-Maurer technology developed a new technique called Hollow
Spare Dual-Gradient Drilling System, which involves the injection of high
concentration of lightweight materials such as, for example, hollow spheres
and solids through one or more points in the riser.

19
The theory is same as Mud Dilution system, to eliminate the excess
pressure of annulus mud column by reducing mud weight in the riser.
While injecting nitrogen in Mud Dilution system, Lightweight Solid Additives
(LWSA) are pumped in Hollow Spare Dual-Gradient Drilling System.
Lightweight solid additives (plastic, composite, glass, metal, etc.) are mixed
with slurry and pumped by a surface pump in drilling unit to the line in sea
floor which communicates with riser connection point through valve. Then,
mixed return drilling fluid, cuttings and the balls return to the surface and
transferred to the separator where the gravel will be extracted. Lightweight
solid additives (LWSA) are able separated from mud by conventional shale
shaker. Figure 2.11 below shows the system of hollow spheres.
Figure 2.11 Schematic of Mud Dilution System

20
Although, the technique of injection in the riser is similar to the gas injection
system, due to the using incompressible hollow spheres, it is possible to
get linear pressure gradients inside the riser. [4]
2.4.2 Mechanical Mud Lifting
In conventional offshore drilling, drilling fluid is pumped down through drill
pipe and return up through annulus and riser. In mechanical mud lift model,
unlike reducing return mud weight in the riser, usage of riser eliminated by
diverting return flow to alternative small diameter return line and pumping
up to drilling unit by mud lift pump system installed to seabed. In this way,
effect of return mud hydrostatic head in riser is eliminated as shown in
Figure 2.12.
Figure 2.12 Schematic of Mechanical Mud Lifting [8].
21
Three different Joint Industry Project (JIP) established to develop DGD
system based on this concept: Subsea Mudlift Drilling (SMD); DeepVision
Project, Shell's Subsea Pumping System – SSPS and CMP (Controlled
Mud Pressure) which the AGR is developing, based on RMR pump
technology.
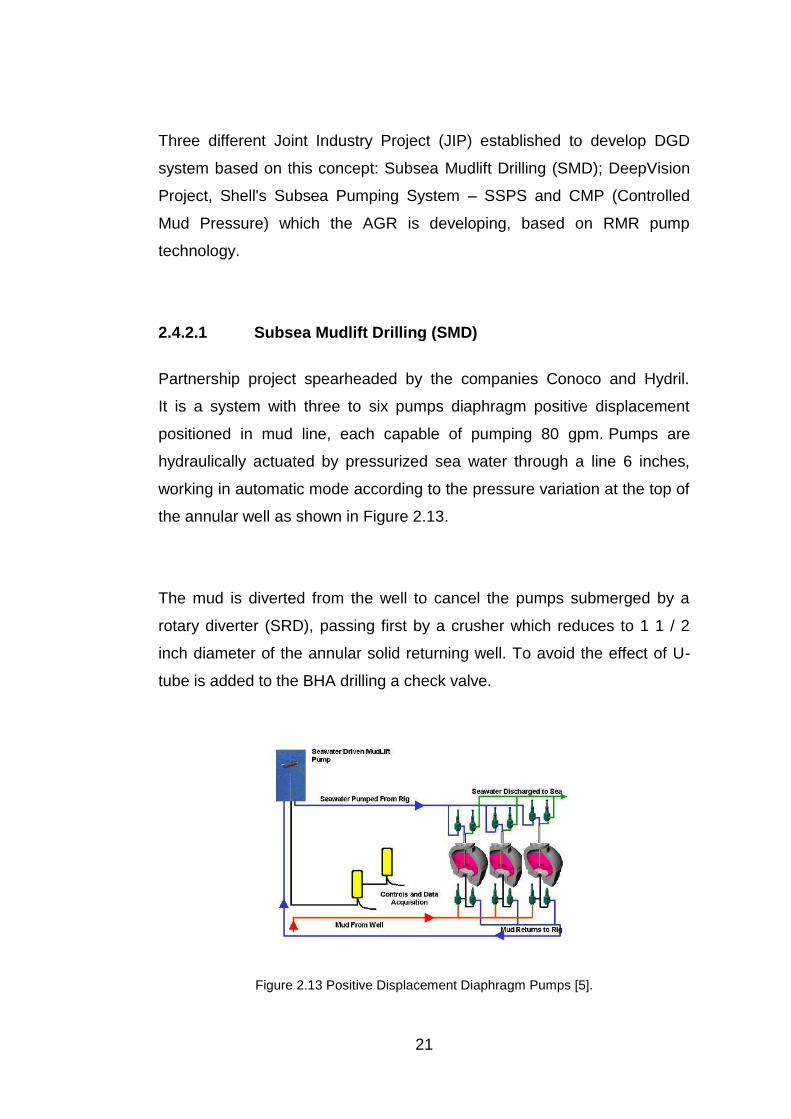
2.4.2.1 Subsea Mudlift Drilling (SMD)
Partnership project spearheaded by the companies Conoco and Hydril.
It is a system with three to six pumps diaphragm positive displacement
positioned in mud line, each capable of pumping 80 gpm. Pumps are
hydraulically actuated by pressurized sea water through a line 6 inches,
working in automatic mode according to the pressure variation at the top of
the annular well as shown in Figure 2.13.
The mud is diverted from the well to cancel the pumps submerged by a
rotary diverter (SRD), passing first by a crusher which reduces to 1 1 / 2
inch diameter of the annular solid returning well. To avoid the effect of U-
tube is added to the BHA drilling a check valve.
Figure 2.13 Positive Displacement Diaphragm Pumps [5].

22
2.4.2.2 Deep Vision
Partnership project spearheaded by companies Baker Hughes and
Transocean. System works with multistage centrifugal pumps in series
which are electrically driven. Drilling riser is filled with sea water and
wellhead modified (Mechanical Seawater Mud- Isolation System)
isolates the annular and riser.
2.4.2.3 Shell's Subsea Pumping System (SSPS)
System of electric submersible pumps (SESPs - seafloor electric-
submersible pumps) operates in series. SSPS pumps are similar ESPs
pumps used for pumping oil and water in oil production wells. A bed of
nitrogen separates the well from submerged pumping system and ensures
that the pressure in the annular space is equalized with the hydrostatic
pressure of seawater. Gravels larger than 0.25, are separated from drilling
mud in mud line and discharged to water.
2.4.2.4 Controlled Mud Pressure (CMP)
AGR is developing a drill system called CMP - Controlled Mud Pressure
System that is targeted towards the application of the technology used in
drilling equipment in riserless mud recovery (RMR) with riser and BOP
submarine. The RMR is employed in the recovery of drilling fluid and
cuttings in the drilling of the initial phases of offshore well, with no riser.
23
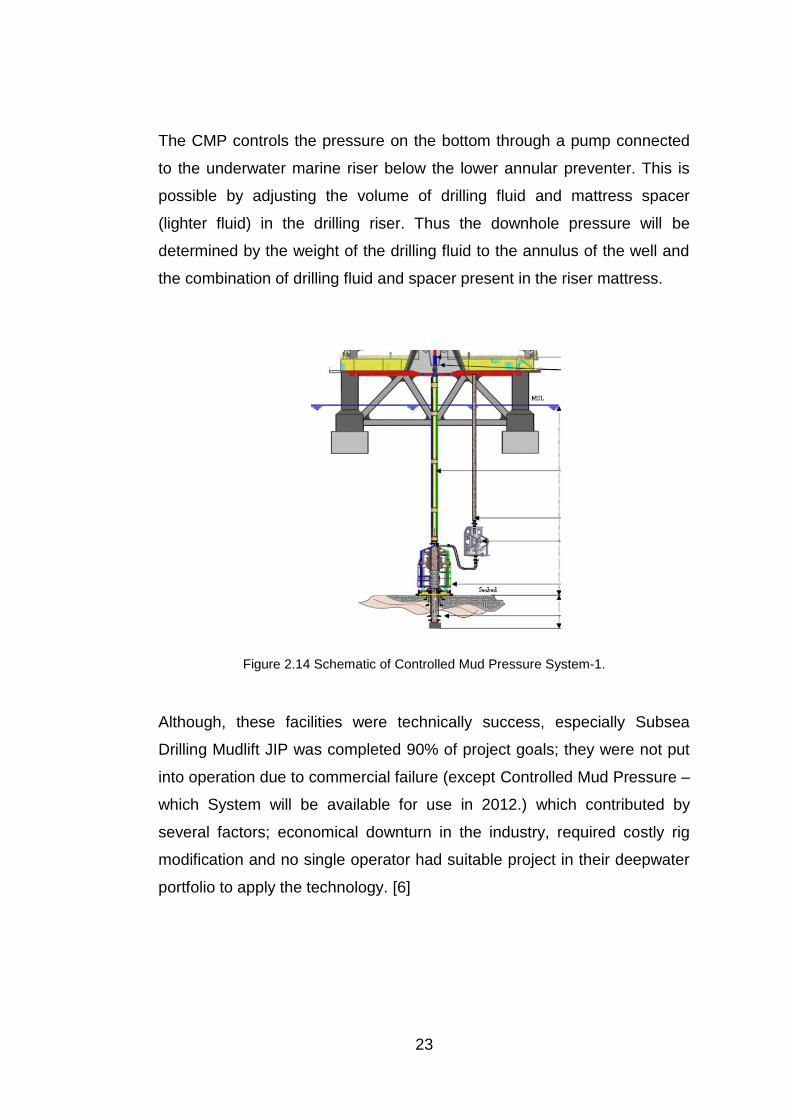
The CMP controls the pressure on the bottom through a pump connected
to the underwater marine riser below the lower annular preventer. This is
possible by adjusting the volume of drilling fluid and mattress spacer
(lighter fluid) in the drilling riser. Thus the downhole pressure will be
determined by the weight of the drilling fluid to the annulus of the well and
the combination of drilling fluid and spacer present in the riser mattress.
Figure 2.14 Schematic of Controlled Mud Pressure System-1.
Although, these facilities were technically success, especially Subsea
Drilling Mudlift JIP was completed 90% of project goals; they were not put
into operation due to commercial failure (except Controlled Mud Pressure –
which System will be available for use in 2012.) which contributed by
several factors; economical downturn in the industry, required costly rig
modification and no single operator had suitable project in their deepwater
portfolio to apply the technology. [6]

24
2.5 Concept of Subsea Mudlift Drilling System
Deepwater drilling is considered as a future of drilling industry, the deeper
well is drilled, the more place is explored. This is why oil industry works to
develop new techniques and invent new technologies to get the ability to
drill deeper.
Although deepwater drilling is the big opportunity to explore new reserves,
it also brings the challenges with itself. As the demand of exploring the
deeper waters and drilling deeper, the challenges increase like hydrostatic
head difference between water and drilling mud. Actually, this pressure
difference can be pointed as a main difficulty in deepwater drilling
operations, which causes operational difficulties and also brings many
limitations to well design.
With the interest of exploring oil and gas in deepwater, major oil companies
started to research a way to cure this pressure difference. “Dual Gradient
Drilling”, also named as “Riserless drilling” concept is one of the ideas that
considered as solution. Since 60’s, companies have been trying to develop
this concept and make it commercial solution. There are three large scale
project were conducted to develop different approaches to archive dual
gradient system. [7]
In this project, one the major and most significant joint industry projects
(JIPs) is selected to indicate the economical benefits of the DGD with
technical capabilities; the SubSea Mudlift Drilling JIP.

25
In the following chapters, the SubSea Mudlift Drilling concept is studied;
how it developed and how it works.
2.5.1 History
Interest of searching beneficial technologies to explore deep waters start in
the early 1960s and removing riser effect is one of these technologies. On
the other hand, due to the lack of technology capability, this idea could not
reach the maturity.
With the increase demand in 1990’s, the aim to explore increased rapidly,
especially in Gulf of Mexico. However, limited number of offshore drilling
rigs with weak capability with the increase the demand of new technology
in dramatic way let companies to re study the riserless drilling, which
system allow incapable rig to drill deeper wells in deeper water depths with
required modification.
Additional to system advantages on increasing the capability of rig, system
also decrease the operational costs by decreasing variety of casing
sections, allowing to use simple wellhead configuration and more which are
discussed in previous chapters.
It was too much effort to achieve this kind of project by one single
company, although Conoco and Hydril started to investigate the way to
design riserless drilling, they quickly understood that they needed
contribution of others companies. In 1996, they collected other major 25
companies; operators, service companies and contractors under same
26
umbrella by arranging one day workshop. It was a one-day workshop to
share the idea with other companies and to perform brain storming on
riserless drilling which was called "SubSea MudLift Drilling JIP" later.
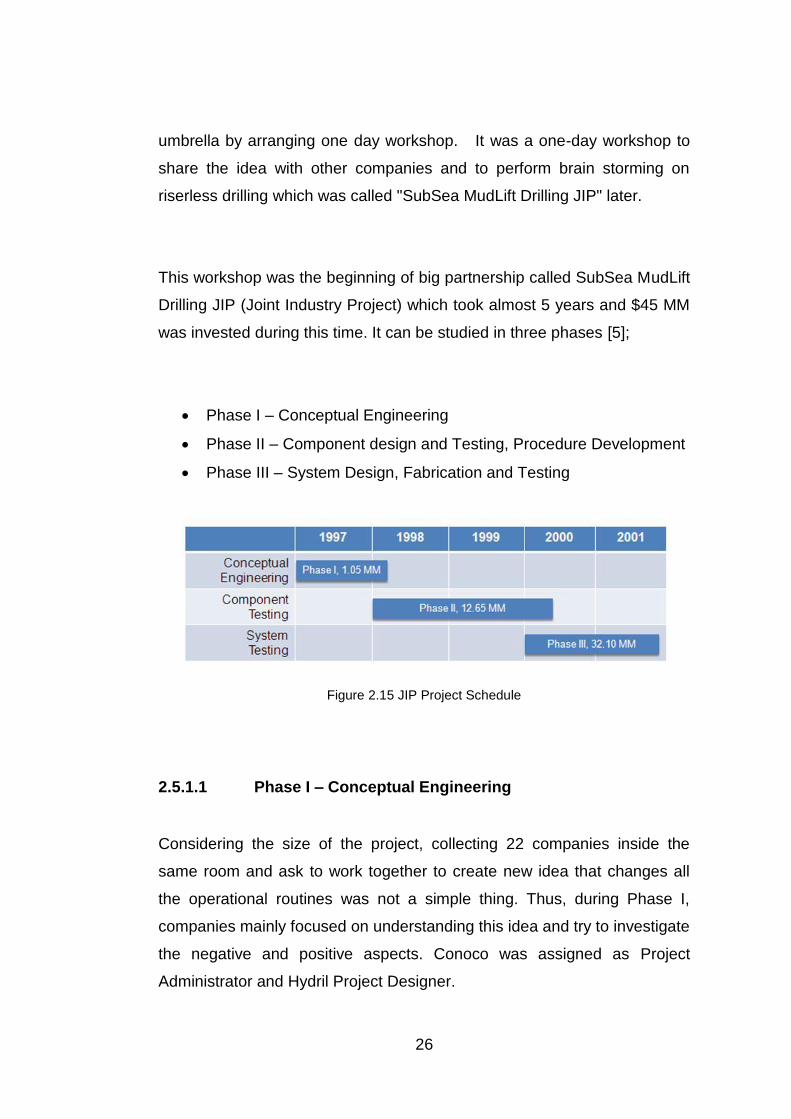
This workshop was the beginning of big partnership called SubSea MudLift
Drilling JIP (Joint Industry Project) which took almost 5 years and $45 MM
was invested during this time. It can be studied in three phases [5];
Phase I – Conceptual Engineering
Phase II – Component design and Testing, Procedure Development
Phase III – System Design, Fabrication and Testing
Figure 2.15 JIP Project Schedule
2.5.1.1 Phase I – Conceptual Engineering
Considering the size of the project, collecting 22 companies inside the
same room and ask to work together to create new idea that changes all
the operational routines was not a simple thing. Thus, during Phase I,
companies mainly focused on understanding this idea and try to investigate
the negative and positive aspects. Conoco was assigned as Project
Administrator and Hydril Project Designer.

27
The aim of the participants in this stage was to investigate ways to
establish dual gradient system, to search required modification on well
control procedure for dual gradient system, to search the ways to apply this
new technology to existing rigs.
The JIP set project target to achieve the dual gradient system working with
maximum 108gpm with an unweighted mud and 800gpm with an 18.5ppg
mud in an environment; 12 1/4” hole in 10,000’ water depth.
At this phase, project team selected to use positive displacement pump
which was an electro-hydraulically powered diaphragm pumping system to
lift return fluid from sea floor to drilling unit after reviewing a wide range of
lifting system; dilution of return mud with low density material (gas or glass
beads) and mud pump located sea floor with various pump design.
Two riser configurations determined; one return line designed inside the
existing riser, other one return line separate from the existing riser and in
both pumping system located above the BOP.
Moreover, Texas A&M University was selected to prepare simulator to
understand the behavior of dual gradient system.

28
2.5.1.2 Phase II – Component design and Testing, Procedure
Development
Due to the primary focus on Gulf of Mexico operations in Phase I, JIP
participant’s number decreased to 9 in Phase II.
Phase II can be considered the beginning the technology getting shapes
with development system and procedures simultaneously. The designs of
most critical items were concluded and related procedures were started to
established.
The critical change in the project during the Phase II was the changing
electro-hydraulically powered diaphragm pumping system. Although,
project team was sure that changing electro-hydraulically powered pump
could create enough power to achieve project goal, the long term viability
of high powered cables was questionable. Thus, project team decided to
use diaphragm pumps running by sea water which pumped from surface to
power the system. It also decreased the complexity of electro-hydraulically
powered pump, decreased the system weight 75kips and helped team to
eliminate the high voltage power cables.
Moreover, since participants did not want to design and produce new riser
in limited time frame, project team decide to eliminate remote riser for
return flow. The riser modeling was performed based on the 5th generation
drillships to make the system fitting to several rig types [5].
As it was already mentioned; creating new technology one thing, using this
technology other thing. To make the people familiar to this new technology,

29
also additional to new drilling procedure coming with dual gradient drilling,
all existing conventional drilling procedures were modified. Other issue that
became more clear in Phase II, specific training should be prepared during
Phase III since the dual gradient drilling procedure and well control
procedures for dual gradient with were defined during Phase II much more
different than the conventional ones.
2.5.1.3 Phase III – System Design, Fabrication and Testing
This is the actual phase that all pieces of the puzzle came together to
make meaning. During this stage, pumping system design was completed
and started to fabricate, riser system modified to fit second generation
semisubmersible rig which accommodate 2 ea 5” lines to the seafloor; one
for return mud, other for powering diaphragm pumps in seafloor.
The main target of the project team was manufacturing system that is
totally trustable and commercially applicable for deep-water drilling.
Moreover, under this main target, there were more than 100 minor targets
were set by project team, such as; drilling real well, prove dual gradient
system and components, prove all procedures…etc.
Texaco and its prospect in Green Canyon were selected as test operator
and test area. Diamond Offshore New Era semisubmersible rig was
modified to perform drilling operation; additional weight, power
requirements and other equipment required for mudlift system. Meanwhile,
Project team designed the additional equipment based on rig’s moonpool
and BOP handling equipment dimensions.

30
Other important step accomplished during this step was training of the rig
crew. It was a big change for Diamond Offshore New Era crew, up to that
moment; they just had to focus on conventional drilling and now faced with
something different. With the assistance of Texas A&M University, all the
drilling procedures were revised and new procedures specific for dual
gradient drilling were written. These procedures were used in 3-week
training held for rig crew.
Different from other operations in Texaco’s portfolio, for this special case,
experts re-write Texaco’s conventional drilling program according to
special procedures. Although, Texaco’s original drilling program contained
4 casing sections, to perform a better test, project team added 1 more
casing section.
Table 2.1 Casing selection for conventional well and DGD well [8].
Conventional Shasta Well
SMD Field Test Well
30” drive pipe 30” drive pipe
16” surface casing 20” surface casing
10-3/4” casing 13-3/8” casing
7-5/8” production string 9-5/8” liner
7” production string
Texaco drilled first two sections with conventional single gradient drilling.
The project team drilled two sections and cased with 13 3/8” and 9 5/8”
casing. Then Texaco returned to drill last section and set 7” production
casing. [8]

31
Considering the time and budget spent this project, it was one of the
biggest projects in oil industry. Furthermore, JIP performed successful field
test by drilling a well with 90% project goals achieved. Although, in terms of
technical view, project team accomplished the built dual gradient drilling
system, due to the several factor it could be considered as commercial
failure. [6]
1- Economical turbulent in industry in 2001.
2- The huge cost required to modify existing rigs.
3- No deep-water prospect in company’s portfolio.
Nowadays, Chevron is planning to drill a well by using similar system; dual
derrick rig Pacific Santa Ana was selected and modified with dual gradient
system when she was in shipyard in Korea other considering the oil prices.
The expected date of the start operation is 1st Quarter of 2012 in GOM.
Considering the increase in oil price since 2001 and new technical
developments, Chevron aims to deploy first commercial dual gradient
system.
2.5.2 Operational part
In SubSea Mudlift system like conventional drilling; drilling fluid is pumped
from mud pumps in drilling unit to bit through the drilling string. The
innovation that SubSea Mudlift system brings to industry, takes in place
where the flow return back to drilling unit. Instead of conventional drilling
riser, the return flow send to drilling unit through small diameter return lines
by mudlift pump located on mudline. Although, the idea seems to be so

32
easy, considering the complexity of the deep-water drilling special
designed equipment required.
Figure 2.16 Schematic of SubSea Mudlift System.
Mudlift Pump (MLP): It is a diaphragm pump running by sea water which
pumped from surface to power the system and can be considered as heart
of the SubSea Mudlift system. It is positive displacement pump, works
similar to booster line in conventional drilling, which adds energy to return
flow and lifts it to drilling unit. [7] The MLP can be used as two triplex
pumps, a quintablex, a quadraplex, a triplex, a dublex or as a single
chamber pump because each chamber of MLP can be run separately. [6]

33
Figure 2.17 Schematic of Mudlift Pump [5].
Solid Processing Unit (SPU): Managing cuttings is one of the important
issues in subsea pumping system. Cutting come in variety of size and
geometry so to avoid any blockage in system cuttings have to be
processed. [9] The solid processing unit was designed to avoid any
cuttings bigger than 1 ½” x 1 ½” x 1 ½” enter to mudlift pump. The bigger
cuttings are sheared by SPU cutters and after that send to MLP to pump
up the drilling unit. SPU has a vital role to keep MLP operating without any
blockage, considering the deepwater environment; even small failure in
MLP is a reason to stop drilling for days. [6]

34
Subsea Rotating Device (SRD): It is similar to the conventional rotating
heads which serves a mechanical barrier between seawater inside the riser
and return mud flow. SRD is an upper part of the SubSea Mudlift system
which is 60ft above the MLP. It also used to get pressure above wellhead
equal to the seawater pressure, which works in pressure balance
environment between riser and wellhead. Sealing element of SRD run on
the drill pipe and each trip came to surface for maintenance. [6] [7]
Figure 2.18 Schematic of Subsea Rotating Device [6].
35
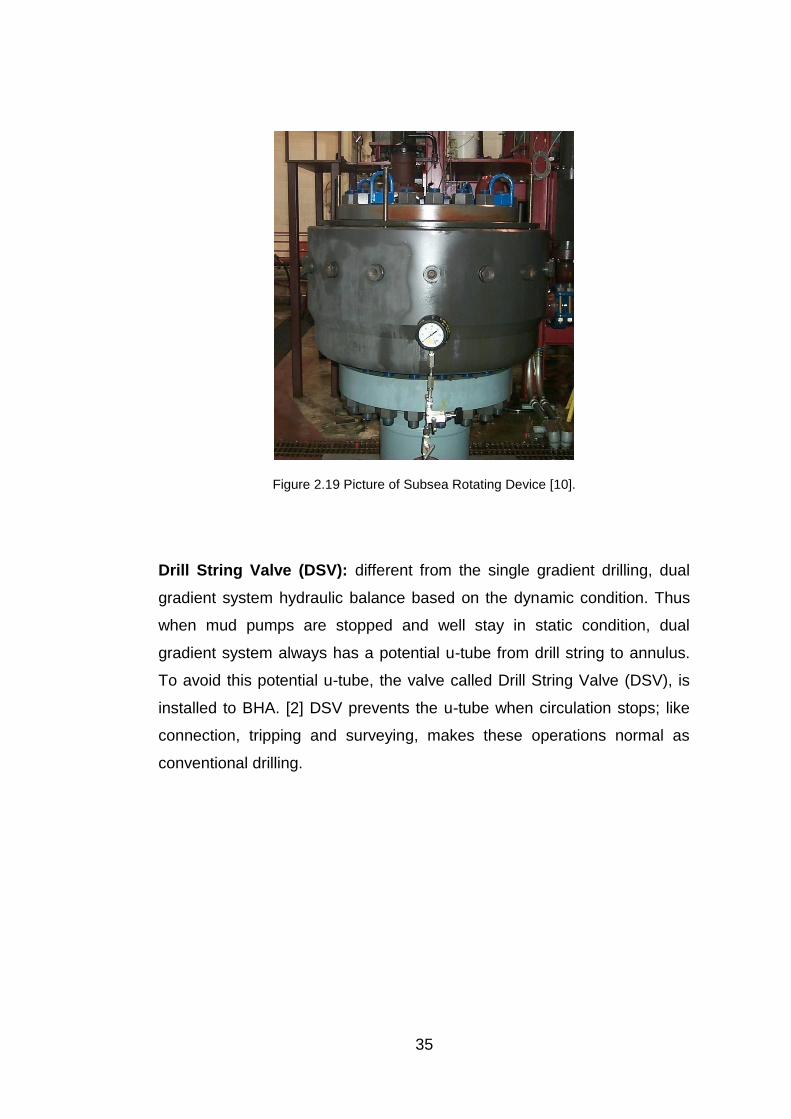
Figure 2.19 Picture of Subsea Rotating Device [10].
Drill String Valve (DSV): different from the single gradient drilling, dual
gradient system hydraulic balance based on the dynamic condition. Thus
when mud pumps are stopped and well stay in static condition, dual
gradient system always has a potential u-tube from drill string to annulus.
To avoid this potential u-tube, the valve called Drill String Valve (DSV), is
installed to BHA. [2] DSV prevents the u-tube when circulation stops; like
connection, tripping and surveying, makes these operations normal as
conventional drilling.

36
Figure 2.20 Schematic of Drill String Valve [6].
Riser Dump Joint (RDJ): Studies shows that incase of any emergency
disconnect, the heavy load, inside the riser because of SRD which is
trapped the sea water inside the riser, brings too much forces to subsea
system. Thus, the modified riser joint, called Riser Dump Joint, is installed
to riser string and during the emergency disconnect it opens and allows to
free movement to sea water inside the riser.
2.5.3 U tube
Mud lift system should be considered as a dynamic close circulation
system; all hydraulic calculations are made when pumps are on. On the
other hand there is a possible u tube affect when pumps are off;
considering the higher mud column in drill string, the u tubing phenomena
must be examined carefully to perform a safe and successful operation.

37
Figure 2.21 Schematic of U-Tube – Dynamic Condition
The inlet pressure of the MLP is maintained to hydrostatic pressure of the
sea water. Therefore, when the circulation stops, drilling mud static
pressure inside the drill string makes more pressure than MLP inlet
pressure; they are not statically balanced. This differential pressure drives
the system u-tubing.
Figure 2.22 Schematic of U-Tube – Static Condition
38
Since U-tubing is a big challenge for rig crew to manage and makes not possible
to operate; DSV was invented to eliminate u-tubing affect. Thus using DSV makes
operations (connection, tripping, surveying, etc.) like conventional drilling.

39
CHAPTER 3
STATEMENT OF THE PROBLEM
Dual Gradient Drilling (DGD) is a new concept that allows reaching ultra
deep water targets more economically and safely by eliminating the
problems that occur due to the narrow operating window between pore
pressure and fracture pressure. Principally, this system minimizes the
effect of hydrostatic pressure of the drilling fluid inside the riser and thus on
the bottom hole pressure.
The primary objective of DGD is to explore the deep water environment
and to drill deeper wells. The system also decreases operational costs,
which can be considered as an important primary objective by most major
companies.
The main objective of this research is to determine the effect of DGD on
operational costs. A first step is to prove the technical advantages of the
system by redesigning a conventionally planned well using the DGD
system. The new design is compared with the old design and technical
advantages are presented. Then the newly designed well is drilled on
paper and its performance is compared with the conventional well results.
Finally, based on the new design and performance of the well, operational
budgets are compared and results are presented.
40
CHAPTER 4
METHOD OF STUDY
Pore and fracture pressures are the most critical parameters to determine
whether the prospect technically can be drilled or not. Based on pressure
data of the formation, well trajectory and casing set points are calculated.
This pressure information is the starting point of the well engineering phase
where well design, casing types, bit types and mud program are
determined. From this point of view, a link can be established between
pore and fracture pressures and the total drilling operation budget; a more
complex pressure behavior means the operational costs will be higher.
Technical difficulties which affect the cost and time of drilling operations
can be minimized when the operating window between the pore pressure
and fracture pressure is enlarged. Although it is not possible to change
earth’s pressure behavior, there is a way to eliminate the hydrostatic effect
of the water column in the deep water environment; called Dual Gradient
Drilling, which has the effect of increasing maneuverability inside the
narrow operating window. Increasing the maneuverability inside the
operating window decreases the number of required casing strings needed
to reach deeper formations which in turn lowers operational costs.
The aim of this study is to investigate the effect of Dual Gradient System
on the operational costs. According to this purpose, a deep water well;
Alpha well, was studied based on Alpha well drilling history and a new well,

41
Beta Well, is simulated based on Alpha well drilling history by using Dual
Gradient System.
From now on total operation cost is called as an AFE (Authority for
Expenditure) which is budgetary document, usually prepared by the
operator, to list estimated expenses of drilling a well. Such expenses are
cover cost of materials which planned to be used in operation, as well as
the cost of the services were intended to perform in operation. Although,
AFE is prepared prior or operation to get necessary approval from
partners, AFE structure is used to follow up the total operation expenditure
and represents the final operation cost at the end of the operation. The
example AFE structure can be seen in Table 4.1.
Table 4.1 AFE Example
AFE Example
Material Cost ($)
Wellhead xxx.xx
Casing xxx.xx
Liner & Casing Accessories xxx.xx
Fuel & Lubricants & Water xxx.xx
Bits xxx.xx
Cement & Chemicals xxx.xx
… xxx.xx
Services Cost ($)
Well Design And Planning xxx.xx
Well Site Supervision & Office Supervision xxx.xx
Contract Drilling Rig xxx.xx
Logistic Support Base xxx.xx
Wellhead Service xxx.xx
Drilling And Fishing Tools xxx.xx
Casing & Tubing Running Services xxx.xx
…
TOTAL XXX.XX
Basically, the AFE consists of two section; material and services. Material
costs are calculated based on well design; specifications and quantity of
wellhead, casing, liner hangers, usage of the fuel, cement chemicals and

42
mud chemicals. Moreover, duration of the operation and necessary
services per sections are considered to calculate service costs.
Therefore, this study continues on presenting Alpha Well in section 2.1 and
simulation scenario in 2.2.
4.1 Alpha Well
Alpha well is a deep water well in 2175m water depth. Figure 4.1,
illustrates depth - pressure data of the well. The yellow area represents the
narrow operational window between pore pressure and fracture pressure,
which is lower than 1ppg in some sections.
Figure 4.1 Pressure Graph of Alpha Well
43
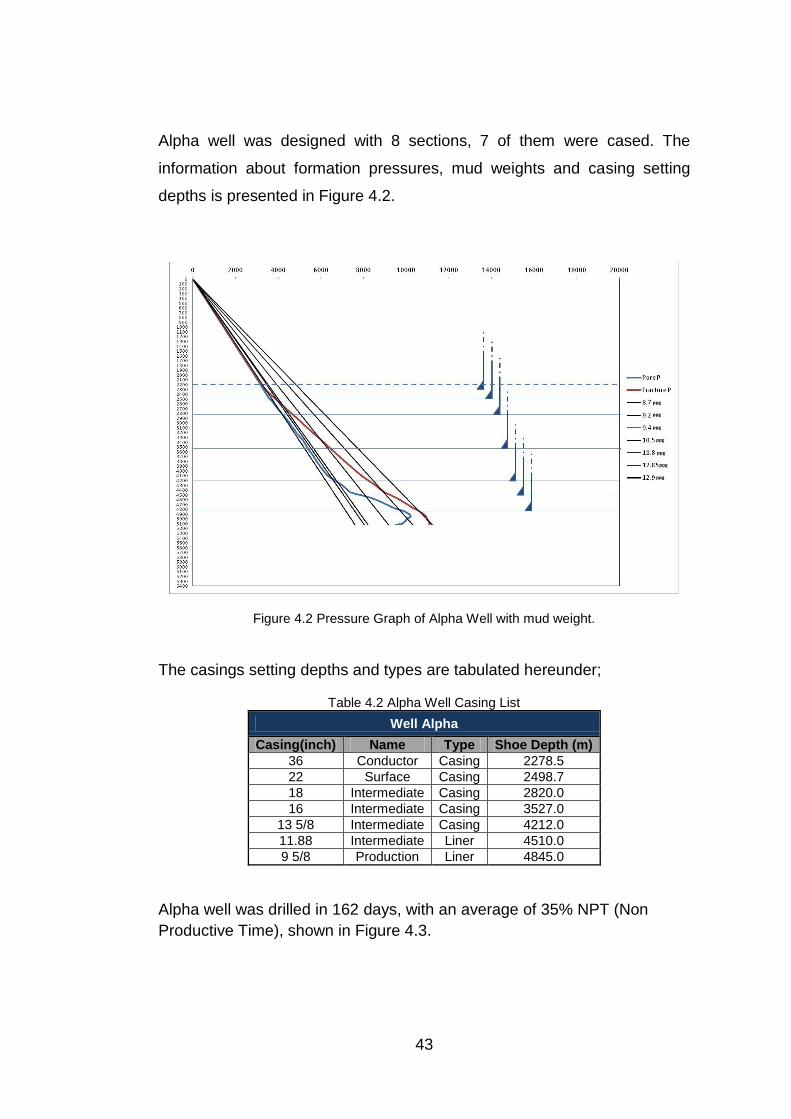
Alpha well was designed with 8 sections, 7 of them were cased. The
information about formation pressures, mud weights and casing setting
depths is presented in Figure 4.2.
Figure 4.2 Pressure Graph of Alpha Well with mud weight.
The casings setting depths and types are tabulated hereunder;
Table 4.2 Alpha Well Casing List
Well Alpha
Casing(inch) Name Type Shoe Depth (m)
36 Conductor Casing 2278.5
22 Surface Casing 2498.7
18 Intermediate Casing 2820.0
16 Intermediate Casing 3527.0
13 5/8 Intermediate Casing 4212.0
11.88 Intermediate Liner 4510.0
9 5/8 Production Liner 4845.0
Alpha well was drilled in 162 days, with an average of 35% NPT (Non
Productive Time), shown in Figure 4.3.
ppg
ppg
ppg
ppg
ppg
ppg
ppg

44
Figure 4.3 Time vs Depth Graph of Alpha Well.
The breakdown of total operation schedule is tabulated as per sections
hereunder.
Table 4.3 Time Breakdown of Alpha Well Per Sections
SECTIONS TIME (hrs)
PHASE ZERO 62
PHASE 1 – Conductor Casing 73
PHASE 2 - Surface Casing 290.5
PHASE 3 - Intermediate Casing 719.5
PHASE 4 - Intermediate Casing 370
PHASE 5 - Intermediate Casing 927
PHASE 6 - Intermediate Casing 528
PHASE 7 - Intermediate Casing 355
PHASE 8 - 8 1/2" Hole 376.5
PLUG & ABANDON 167.5
TOTAL 3869

45
4.2 Simulation Scenario
Simulation of the Alpha well is performed in 3 steps, given in Figure 4.4;
1. Designing Beta well (Re-designing Alpha well with DGD system).
2. Drilling Beta well on paper based on Alpha well’s drilling timeline.
3. Establishing Beta well AFE breakdown.
Figure 4.4 Beta Well Simulation Flow
4.2.1 Designing Beta well (Re-designing Alpha well with DGD
system)
Purpose: To determine the materials and services required for Beta Well.
Pressure data of the Alpha well was re-arranged by eliminating the water
column, like an onshore well operation. Principally, the pressure readings
at the mud line are transferred to the sea level. This pressure transfer
could be considered as a depth correction from Alpha well to Beta well.

46
After making the depth revision, the Beta well was designed by using
software called Stress Check according to new depth and pressure data.
Casing types and setting depths were determined and wellhead & bit types
were selected.
4.2.2 DWOP (Drill Well on Paper) Beta well
Purpose: To determine duration of the operation (for calculating costs of
services which are directly proportional with duration).
After completion of the engineering phase where well architecture was
completed and required materials and services were determined, the Beta
well drilling program was written. The Alpha well timeline was separated
into 6 sub-operations which were identified based on industry norms.
Duration requirements, identified to perform each sub-operation, were
designated as PT (productive time) and NPT (non productive time), shown
in Table 4.4. This data was used to simulate Beta well and to calculate the
duration of the Beta well drilling operation.
Table 4.4 Operation Sub Categories
OPERATION SUB CATAGORIES
Drilling Operation
Since the Beta well was simulated from the Alpha well, the location and formations of the Beta well are the same as the Alpha well. Thus, same ROP values were used for equivalent depths to calculate drilling time. However, since section lengths of the Beta Well are longer than the Alpha well, in some cases, one section of Beta well covers two sections of the Alpha well. In such cases, the lower ROP value of the two sections was used for the single section of the Beta well.
Enlargement Operation
As the Alpha well is ultra-deep water well, some sections required enlargement to set the required

47
casing strings. However, with the technical advantages provided by DGD, enlargement was not required for the Beta well. Thus the time spent for enlargement was not taken into account for the Beta well.
Casing & Cement Operation
The time requirement was calculated based on the length of the casing.
Logging Operation
The time requirement was calculated based on the length of logged interval.
Drill Out
It is the operation in which cement is drilled out after cementing the casing, to start a new section. The time required to perform this operation was assumed the same as the Alpha well.
BOP Operation
The Blow Out Preventer (BOP) should be tested periodically. This operation refers the time required to perform BOP testing and was assumed the same as the Alpha well.

48
Table 4.5 Alpha Well Operation Breakdown- Detailed
APLHA WELL OPERATION BREAKDOWNTIME
(HRS)
NPT
(HRS)
PT
(HRS)
PHASE ZERO 62.00
Preparing to Spud 62.00 5.50 56.50
PHASE 1 73.00
Drilling 10.00 0.00 10.00
Casing and Cement 49.00 1.50 47.50
Drill Out 14.00 0.00 14.00
PHASE 2 290.50
Drilling 16.00 0.00 16.00
Casing and Cement 98.00 47.00 51.00
BOP 132.00 21.50 110.50
Dual Gradient System Installation - - -
Drill Out 44.50 4.50 40.00
PHASE 3 719.50
Drilling Pilot Hole 270.00 80.50 189.50
Enlarging Pilot Hole 68.00 26.00 42.00
Logging 25.50 0.00 25.50
Casing and Cement 65.50 1.00 64.50
BOP Test 221.00 178.00 43.00
Drill Out 69.50 21.00 48.50
PHASE 4 370.00
Drilling 188.50 70.00 118.50
Logging 41.50 1.00 40.50
Casing and Cement 84.50 0.50 84.00
BOP 29.00 2.00 27.00
Drill Out 26.50 0.50 26.00
PHASE 5 927.00
Drilling 660.50 500.00 160.50
Casing and Cement 126.50 0.50 126.00
BOP 36.50 5.50 31.00
Logging 19.50 2.00 17.50
Drill Out 84.00 43.50 40.50
PHASE 6 528.00
Drilling 179.50 54.00 125.50
Logging 0.00 0.00 0.00
Enlarging Hole 56.50 0.00 56.50
Liner and Cement 234.00 97.50 136.50
BOP 21.50 3.00 18.50
Drill Out 36.50 6.50 30.00
PHASE 7 355.00
Drilling 105.00 1.00 104.00
Logging 45.00 1.00 44.00
Liner and Cement 128.00 6.50 121.50
BOP 34.50 1.00 33.50
Drill Out 42.50 16.00 26.50
PHASE 8 376.50
Drilling 146.00 21.50 124.50
Logging 230.50 155.50 75.00
PLUG & ABANDON 167.50
Cement Plugs 111.50 5.50 106.00
Abandon 56.00 3.00 53.00
TOTAL 3,869 1,384 2,485

49
4.2.3 Establishing Beta Well AFE breakdown
Purpose: Set benchmarks on AFE to simulate Beta well AFE.
The AFE of Alpha well was tabulated in Table 4.5; with service and
material breakdowns. Since in the final stage of this research the
economical benefit of DGD system will be calculated in percentages, all
services and material costs of the Alpha well were converted to
percentages to express their effects on total operational cost. Thus, in the
following steps of this study, these percentages refer to the cost of the
mentioned service or material.
Unit price of material and service in the Beta well was assumed the same
as the Alpha well since the operation was performed in same location, at
the same time and with the same companies. The price of any item in Beta
well is taken from Alpha well.
In order to establish a link between the two wells, four benchmarks were
determined.
Material Based: It is considered for the material section in AFE; wellhead,
casing, bit, liner hanger, etc. The amount of material is the only factor for
these items to calculate their costs. Therefore based on the Beta well
design, amount of the material is determined and cost of same is
calculated considering its unit price by Alpha well. Parameters were
determined based on the Beta well design.

50
Time Based: There are rental services required to perform the drilling
operations such as MWD (Measuring While Drilling), LWD (Logging While
Drilling) tools, rental charge of the drilling unit, mud logging services, etc.
Although small changes can be observed depending on the quantity of
tools used in some service lines such as MWD/LWD, considering the total
operation time, these changes are negligible. Thus, daily averages of these
services can be used to calculate the Beta well operational costs
considering the duration of the drilling campaign. For instance, as the
duration of the Beta well is 1.2 times longer than the Alpha well, the rental
charge of the drilling unit increases with the same ratio of 1.2. Parameters
were determined based on Beta well operation duration calculated from the
DWOP.
Section Based: Section based analysis show services and/or material
requirements for specific sections or specific time requirements which are
not purchased for all sections or rented for the whole operation. Thus, the
ratio is dependent on the number or length of services performed. For
instance; there were two liner hangers used in the Alpha well whereas
there was only one used in the Beta well. Thus, the cost of liner hangers is
decreased by half in the Alpha well as compared to the Beta well.
Moreover, underreaming service costs depend on usage time which is
10hrs in the Beta well and 491.5hrs in the Alpha Well, which reduces the
total cost of this service by almost 88%. Parameters were determined
based on the Beta well design.
Fixed Cost: Fixed cost criterion is set for services which are the same for
both the Alpha and Beta wells. For instance, as an environmental impact
assessment was performed for the Alpha well; an environmental impact
assessment must also be performed for the Beta well. Thus, the cost of
this service must be same in both wells.

51
Table 4.6 Alpha Well AFE Breakdown
MATERIALS
WELLHEAD 0.43% Material Based
CASING 2.15% Material Based
LINER HANGER 0.30% Material Based
CASING ACCESSORIES 0.03% Material Based
RIG FUEL & LUBRICANTS & WATER 1.69% Time Based
BITS 0.64% Material Based
CEMENT & CHEMICALS 1.39% Material Based
DRILL/COMPLETION FLUID MATERIALS 2.64% Material Based
TOTAL M ATERIAL 9.28%
ALPHA WELL AFE BREAKDOWNWeight
(%)
Base of
Simulation
SERVICES
WELL PLANNING 0.76% Fixed Cost
SUPERVISION 4.50% Time Based
CONTRACT DRILLING RIG 56.02% Time Based
ROV 0.70% Time Based
AIR TRANSPORTATION (HELICOPTER) - -
Helicopter Mobilization Costs 1.04% Fixed Cost
Helicopter Operational Cost 2.81% Time Based
Helicopter Demobilization Cost 0.14% Fixed Cost
MARITIME TRANSPORTATION - -
PSV Mobilization Cost 0.75% Fixed Cost
PSV Operational Cost 3.41% Time Based
PSV Demobilization Cost 0.56% Fixed Cost
LOGISTIC SUPPORT BASE 2.89% Time Based
WELLHEAD SERVICE 0.84% Time Based
DRILLING RENTAL AND FISHING TOOLS 0.45% Time Based
UNDERREAMER SERVICE 0.98% Section Based
LINER HANGER SERVICE 0.35% Section Based
CASING & TUBING RUNNING 0.93% Section Based
H2S SERVICES 0.15% Time Based
DIRECTIONAL TOOLS & SERVICE 0.76% Time Based
MWD, LWD & APWD TOOLS & SERVICE 1.53% Time Based
DRILL/COMPLETION FLUID SERVICE 0.52% Time Based
OPEN HOLE & CMT LOGS 7.17% Section Based
WELL SITE LOCATION/ RIG POSITIONING 0.03% Fixed Cost
O.S. SITE SURVEY/ ENV. BASE LINE SURVEY 0.22% Fixed Cost
MUD LOGGING 0.28% Time Based
CEMENTING SERVICE 0.82% Time Based
COMMUNICATION 0.17% Time Based
CATERING 0.07% Time Based
OTHER RENTALS & SERVICES 1.87% Time Based
TOTAL SERVICES 90.72%
TOTAL 100.00%
52
CHAPTER 5
SIMULATION RESULTS, ANALYSIS AND
DISCUSSION
5.1 Design Beta Well
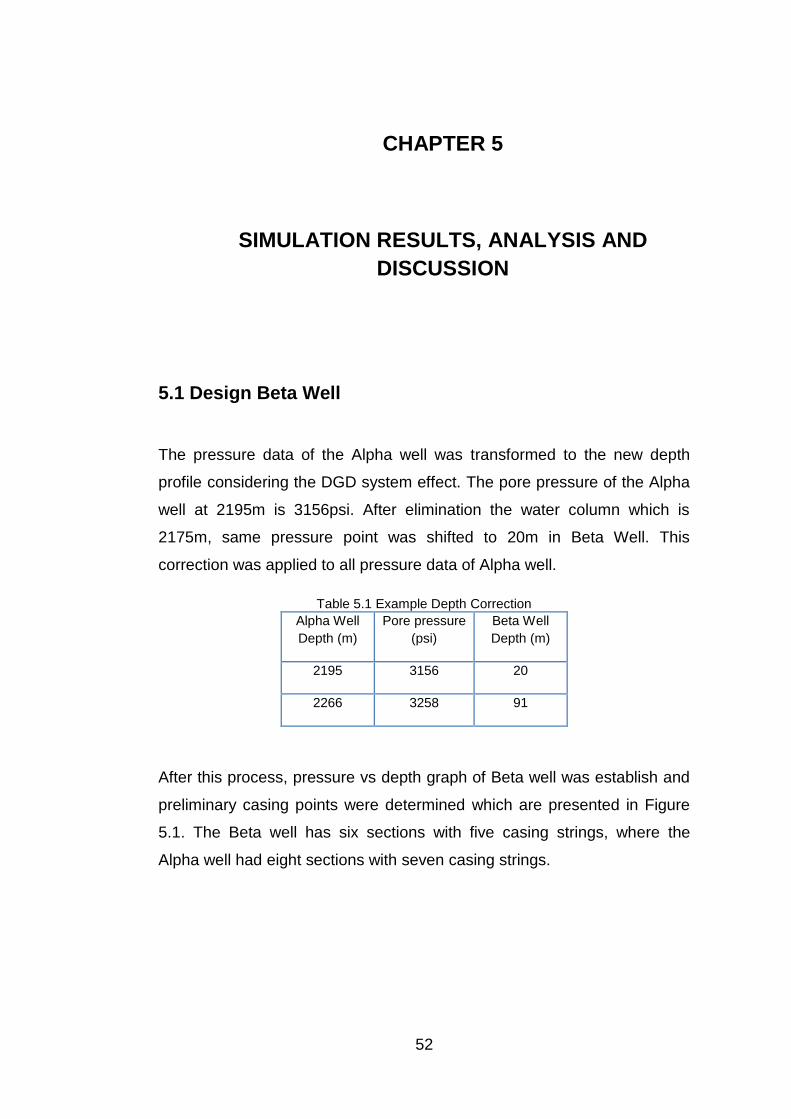
The pressure data of the Alpha well was transformed to the new depth
profile considering the DGD system effect. The pore pressure of the Alpha
well at 2195m is 3156psi. After elimination the water column which is
2175m, same pressure point was shifted to 20m in Beta Well. This
correction was applied to all pressure data of Alpha well.
Table 5.1 Example Depth Correction
Alpha Well
Depth (m)
Pore pressure
(psi)
Beta Well
Depth (m)
2195 3156 20
2266 3258 91
After this process, pressure vs depth graph of Beta well was establish and
preliminary casing points were determined which are presented in Figure
5.1. The Beta well has six sections with five casing strings, where the
Alpha well had eight sections with seven casing strings.

53
Figure 5.1 Pressure vs Depth Graph of Beta Well.
After selection of preliminary casing depths, the final well architecture was
determined by Stress Check, which is casing design software. The final
well design was presented in Figure 5.2 and the final casing selections are
presented in the Table 5.1.
According to Beta well simulation flow in Section 2.2, new quantities of
materials, which are listed hereunder and required services are determined
necessary for Beta well in the following sections.
Wellhead
Casing Types, Casing Accessories, Liner hanger & Cement Chemicals
Mud Chemicals
Bit
ppg
ppg
ppg
Pore Pre. Frac. Pre.

54
Moreover, it was determined that all services were performed in Alpha well
are also required in Beta well. Although, the duration of the services is
calculated under Section 3.2 DWOP Beta well one by one, in this section
well design based services are studied and results are presented.
Figure 5.2 Beta Well Architecture

55
Table 5.2 Beta Well Casing List
5.1.1 Wellhead Selection
The reduction in casing strings also allowed using a simpler wellhead
design in the Beta well. According to market research, the simple wellhead,
which complies with the Beta well requirements, is 50% cheaper than the
complex wellhead used in the Alpha well.
Below is the wellhead selection of both wells;
Alpha wellhead: 36/30 x 28/26 x 22 x 18 x 16 x 13 5/8 x 10 ¾ x 7
Beta wellhead: 36/30 x 20 x 16 x 13 5/8 x 10 ¾ x 7
Moreover, the complex deep water wellhead used in the Alpha well had
sub-mudline casing receptacles which required extra haldling attention to
avoid damage while running casings or large diameter downhole tools.
However, the simple wellhead used in the Beta well not only provided
economical benefit, but also prevented such kinds of operational risks.
Results - Simpler and cheaper wellhead.
- Easier installation.
OD
(inch)Name Type Hanger Shoe TOC
36,000 Conductor Casing 0,0 85,0 0,0
20,000 Surface Casing 0,0 305,0 0,0
16,000 Intermediate Casing 0,0 1275,0 1000,0
13,625 Intermediate Casing 0,0 2185,0 1900,0
10,750 Production Liner 2135,0 2535,0 2300,0
Measured Depths (m)Casing

56
5.1.2 Casing Selection (Casing Types, Casing Accessories,
Liner hanger & Cement Chemicals)
Although, design results allowed using low grade casings for some
sections of the Beta well, to make a better cost comparison, the same
grades were selected in the Beta well as in the Alpha well. Moreover,
there were two assumptions made while calculating the cost of the Beta
well. Even though smaller casing sizes were selected (20” and 10 3/4”
casings, instead of 22” and 11 7/8” casings) higher casing prices were
taken as base prices instead of lower casing prices, which was a
conservative approach considering the worst case.
Table 5.2, shows the casing sizes of the Alpha well, with the related costs
of the casing sections including casing, casing accessories, liner hanger
and cementing chemicals.
The percentages represent the weight of each section in its material group.
For instance, cost of the 13 5/8” casing is equal to 50.02% of the total
casing cost; the cost of the 9 5/8” cement job is equal to 6.55% of the total
cement cost of the Alpha well. These percentages were used as base
values while calculating costs of the Beta well.

57
Table 5.3 Alpha Well Casing Summary
Table 5.3 represents the calculation of the costs based on the Beta well.
Casing costs were calculated proportional to the length of the casing; if the
length of casing increases in Beta well, cost of the casing also increases by
the same ratio.
Cost of the casing accessories does not change with the length change;
the cost is fixed for each section. Thus, the cost of the accessories were
taken directly from the Alpha well and used in the Beta well, otherwise this
cost was not reflected in the Beta well cost. This approach was also used
for liner hanger and cement chemical cost calculations.
SECTIONCASING
LENGTH (m)CASING CASING ACC. LINER HANGER
CEMENT
CHEM.
36" Casing 71.5 8.44% included casing 15.69%
22" Casing 291.7 9.25% included casing 24.71%
18" Casing 378.4 3.12% 31.12% 8.81%
16" Casing 1155.8 11.87% 18.31% 5.75%
13 5/8" Casing 2005 50.02% 36.36% 9.84%
11 7/8" Casing 250 7.05% 8.57% 50.16% 16.14%
9 5/8" Casing 751.4 10.24% 5.64% 49.84% 6.55%
P&A 12.53%
100.00% 100.00% 100.00% 100.00%
COST
TOTAL

58
Table 5.4 Beta Well Casing Summary
Table 5.4 shows the comparison between Alpha well and Beta well.
Table 5.5 Comparison Table Alpha – Beta
Results - Fewer casing variety.
- Less casing string, casing accessories and cement
material.
5.1.3 Mud Chemicals
Two criteria were used to make the comparison; maximum section volume
and mud losses. Assuming drilling the same formation, mud losses were
same and equal in the Beta well as in the Alpha well. Then ration between
the amounts of mud generated and mud lost, projected to Beta well were
proportional to the maximum section volumes of the Beta and Alpha wells.
CASING
LENGTHCASING CASING ACC. LINER HANGER
CEMENT
CHEM.
36" Casing 85 9.54% included casing 15.69%
20" Casing 305 9.69% included casing 24.71%
16" Casing 1275 13.10% 31.12% 5.75%
13 5/8" Liner 2185 54.51% 36.36% 9.84%
10 3/4" Liner 400 7.72% 8.57% 50.16% 16.14%
P&A 12.53%
94.56% 76.05% 50.16% 84.65%
COST
TOTAL
CASING CASING ACC. LINER HANGERCEMENT
CHEM.
Well Alpha 100% 100% 100% 100%
Well Beta 95% 76% 50% 85%
Difference 94.56% 76.05% 50.16% 84.65%

59
Figure 5.3 Relation To Calculate Mud Consumption
To estimate the Beta well mud chemical cost (based on the Alpha well
consumption), the basic relation is established; total volume is summation
of “max. well volume”, “volume required to condition the drilling fluid” and
“volume of drilling fluid losses”.
According to section volumes and final mud report tabulated in Table 5.5,
maximum volume (A) and generated mud volume (D) is summarized in
Table 5.6.

60
Table 5.6 Alpha Well Volume Summary
Table 5.7 Alpha Well Maximum Volume
Based on this information, for the Alpha well total mud losses (C) were
reported as 32,214bbl and the remaining volume was correlated with the
maximum well volume. The idea is that in a perfect operation (without any
losses) except for conditioning mud, the generated mud volume can be
used for all sections, thus maximum mud volume is equal to the maximum
hole volume. Based on that, a maximum well volume (A) and generated
mud volume (without losses) (A+B) ratio was calculated as 4.08, Table 5.7.
SECTIONS VOLUME (bbl) TOTAL VOL. (bbl) MUD VOL. (bbl) MUD LOSSES (bbl)
42" Hole 402 1185 5650
28" Hole 783
Riser 2605 3522 14201 8527
22" Casing 372
22" Open Hole 546
Riser 2605 3855 14245 8114
18" Casing 338
20" Open Hole 912
Riser 2605 4092 7895 7895
16" Casing 812
17 1/2" Open Hole 676
Riser 2605 3790 3204 2412
13 5/8" Casing 978
14 3/4" Open Hole 207
Riser 2605 3831 1918 713
13 5/8" Casing 972
11 7/8" Casing 91
12 1/4" Open Hole 162
Riser 2605 3857 1801 4553
13 5/8" Casing 920
9 5/8" Casing 174
8 1/2" Open Hole 158
SECTION VIII
SECTION I + II
SECTION III
SECTION IV
SECTION V
SECTION VI
SECTION VII
Max. Volume
(bbl)Total Mud Vol. (bbl)
Total Mud Losses
(bbl)
4,092 48,914 32,214

61
Table 5.8 Mud – Volume Ratio
After calculating the maximum well volume and total mud volume
generated without losses for Alpha well which is (A+B) / (A). This ratio was
used to calculate total mud volume for Beta well via same relation.
Maximum hole volume (A) was calculated as 1,995 bbl based on Table 5.9
for Beta well. By using the ratio calculated for the Alpha well and assuming
drilling the same formation as the Alpha well, the same losses (C) were
also added to calculate the total mud (D) required to be generated for Beta
well, Table 5.10. Therefore total required volume for Beta well was
calculated 40,356.95 bbl.
Table 5.9 Beta Well Volume Summary
Total Mud Dilution 48,914Total Mud Losses 32,214Net Mud Volume -Perfect
Operation (no losses) 16,700Biggest Well Volume 4,092Well Vol. - Mud Vol. Ratio 4.08
SECTIONS VOLUME (bbl) TOTAL VOL. (bbl)
Return Liner 5" 176 1480
42" Hole 478
28" Hole 827
Return Liner 5" 176 1437
20" Casing 315
17 1/2" Hole 946
Return Liner 5" 176 1702
16" Casing 895
14 3/4" Hole 631
Return Liner 5" 176 1409
13 5/8" Casing 1066
12 1/4" Hole 167
Return Liner 5" 176 1995
13 5/8" Casing 1041
10 3/4" Casing 195
8 1/2" Hole 583
SECTION I + II
SECTION III
SECTION IV
SECTION V
SECTION VI

62
Table 5.10 Beta Well Mud – Volume Calculation
Result: - Drilling riser was eliminated and 5” return line was used for return flow, so quantity of drilling fluid in riser was eliminated. It decreases the total generated mud volume.
- New well design may allow to drill small hole sizes, which slightly decreases the total generated mud volume.
5.1.4 Bit Selection
Weight of each bit cost, used in Alpha well, was calculated based on total
bit cost. According to the Beta well design, the bit selection was made from
the Alpha well inventory. In Table 5.10, “x” represents Alpha well bit
selection and “o” represents the Beta well bit selection. Based on this
study, %74.03 of Alpha well bit cost is enough to cover Beta well.
Table 5.11 Bit Selection Table
Result: - Decrease in bit quantity.
Well Vol. - Mud Vol. Ratio 4.08Biggest Well Volume 1,995Net Mud Volume -Perfect
Operation (no losses) 8,143Total Mud Losses 32,214Total Mud Dilution 40,356.95
Well Alpha (x) Well Beta (o)
SECTIONS 1 2 3 4 5 6 7 8 9 10 11 12 13 SECTIONS
SECTION I xo SECTION I
SECTION II xo SECTION II
SECTION III xo xo SECTION III
SECTION IV x x
SECTION V xo xo SECTION IV
SECTION VI x x x
SECTION VII o xo SECTION V
SECTION VIII xo xo SECTION VI
100.00% 3.88% 13.99% 1.24% 12.83% 2.44% 10.47% 11.35% 1.56% 9.14% 9.07% 16.71% 6.16% 1.18% 74.03%
BIT NUMBER - COST

63
5.1.5 Section Based Service
Some of the services were not charged based on time; the cost of these
services is related with the number of services provided or length of
interval performed. Table 5.11, shows the 4 services with their criteria of
simulation. The calculated ratio refers the cost effect of services for the
Beta well.
Liner hanger quantity is decreased from 2 to 1 with new well design. Beta
well has only one liner hanger.
Casing tubing services can considered as callout based services, when the
service is required, the contractor team and material are mobilized to
drilling unit and after completion of the service they are demobilized out of
the drilling unit. Although, duration of the services proportional with the
length of the casing string, in general charges per sections are close to
each other; this is why in this study service cost calculated proportional to
number of cased section assuming the cost of services per section is
identical.
Considering the Beta well reaches same target as Alpha well and evaluate
the same formation interval, wireline logging interval is not change and cost
of this service remains same.
The underreamer service is required in complex well design where bit
could not pass through inside the previous casing to drill next section.
Simpler well design in Beta well results in fewer drilling sections, which

64
eliminates the necessity of underreamer services. In Beta well, this service
used just for first section; hole opener for 42”x 28” section.
Table 5.12 Section Based Services
Result: - One liner hanger out of two was eliminated because of simpler well design. Thus, necessity of liner hanger services reduces 50%.
- Due to lower value of casing string, casing & tubing running services is reduced 71.43% accordingly.
- As total depth of the well is not changed, the wireline logging interval does not change.
- Due to the simpler well design, necessity of underreamer service is almost eliminated.
5.2 DWOP Beta Well
In this section, drilling operations of the Beta well was simulated on paper.
All steps of the Alpha drilling plan were revised based on the Beta well
design. The main milestone of this study was determining ROP rates;
considering that both wells were drilled in the same formation, based on bit
performance of Alpha well transferred to Beta Table 5.12. If the section of
the Beta well was longer than the Alpha well, the minimum ROP in the
Alpha well was transferred to the Beta well, reference Table 5.13.
Services Criteria Well Alpha Well Beta Ratio
Liner Hanger Service Liner Hanger Number 2 1 50.00%
Casing & Tubing Running Casing and Liner Number 7 5 71.43%
Open Hole & CMT Log Logging Length 3024 3005 99.37%
Underreamer Service Underream Service Time 491.5 10 2.03%
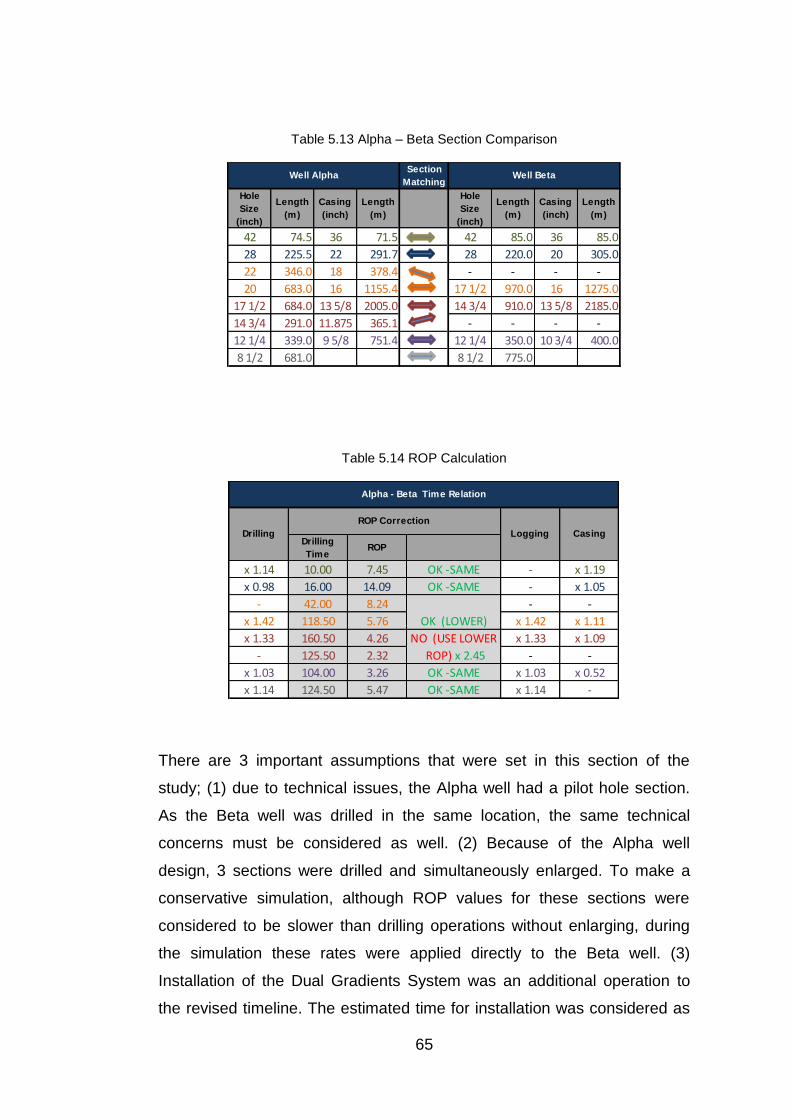
65
Table 5.13 Alpha – Beta Section Comparison
Table 5.14 ROP Calculation
There are 3 important assumptions that were set in this section of the
study; (1) due to technical issues, the Alpha well had a pilot hole section.
As the Beta well was drilled in the same location, the same technical
concerns must be considered as well. (2) Because of the Alpha well
design, 3 sections were drilled and simultaneously enlarged. To make a
conservative simulation, although ROP values for these sections were
considered to be slower than drilling operations without enlarging, during
the simulation these rates were applied directly to the Beta well. (3)
Installation of the Dual Gradients System was an additional operation to
the revised timeline. The estimated time for installation was considered as
Section
Matching
Hole
Size
(inch)
Length
(m)
Casing
(inch)
Length
(m)
Hole
Size
(inch)
Length
(m)
Casing
(inch)
Length
(m)
42 74.5 36 71.5 42 85.0 36 85.0
28 225.5 22 291.7 28 220.0 20 305.0
22 346.0 18 378.4 - - - -
20 683.0 16 1155.4 17 1/2 970.0 16 1275.0
17 1/2 684.0 13 5/8 2005.0 14 3/4 910.0 13 5/8 2185.0
14 3/4 291.0 11.875 365.1 - - - -
12 1/4 339.0 9 5/8 751.4 12 1/4 350.0 10 3/4 400.0
8 1/2 681.0 8 1/2 775.0
Well Alpha Well Beta
Drilling
TimeROP
x 1.14 10.00 7.45 OK -SAME - x 1.19
x 0.98 16.00 14.09 OK -SAME - x 1.05
- 42.00 8.24 - -
x 1.42 118.50 5.76 x 1.42 x 1.11
x 1.33 160.50 4.26 x 1.33 x 1.09
- 125.50 2.32 - -
x 1.03 104.00 3.26 OK -SAME x 1.03 x 0.52
x 1.14 124.50 5.47 OK -SAME x 1.14 -
Alpha - Beta Time Relation
Drilling Logging Casing
ROP Correction
OK (LOWER)
NO (USE LOWER
ROP) x 2.45

66
50% of the BOP installation time. Actually, as BOP installation also covers
deploying same and DGD equipments to sea bed in single run; half of the
BOP installation time could be considered more than enough to make a
conservative estimation. Table 5.15 demonstrates the timeline of the Alpha
operation; which is also separated by NPT (non-productive time) which
occupied 35.77% of the total operation time, and PT (productive time). The
simulation of the Beta well was tabulated under “Beta Opr. Time” column,
which was correlated with Alpha operation PT by “Time Relation” which is
the result of the studies mentioned above.
Based on DWOP results; the Beta well was drilled in 2,262 hours without
any NPT, then considering the same drilling location with the same rig and
crew, a 35.77% NPT was applied. The comparison of the total operation
hours for both the Alpha and Beta wells are tabulated in table 5.14.
Table 5.15 Total Operation Time
Well Alpha 3869
Well Beta 3072
Difference 79.39%
TOTAL OPERATION TIME
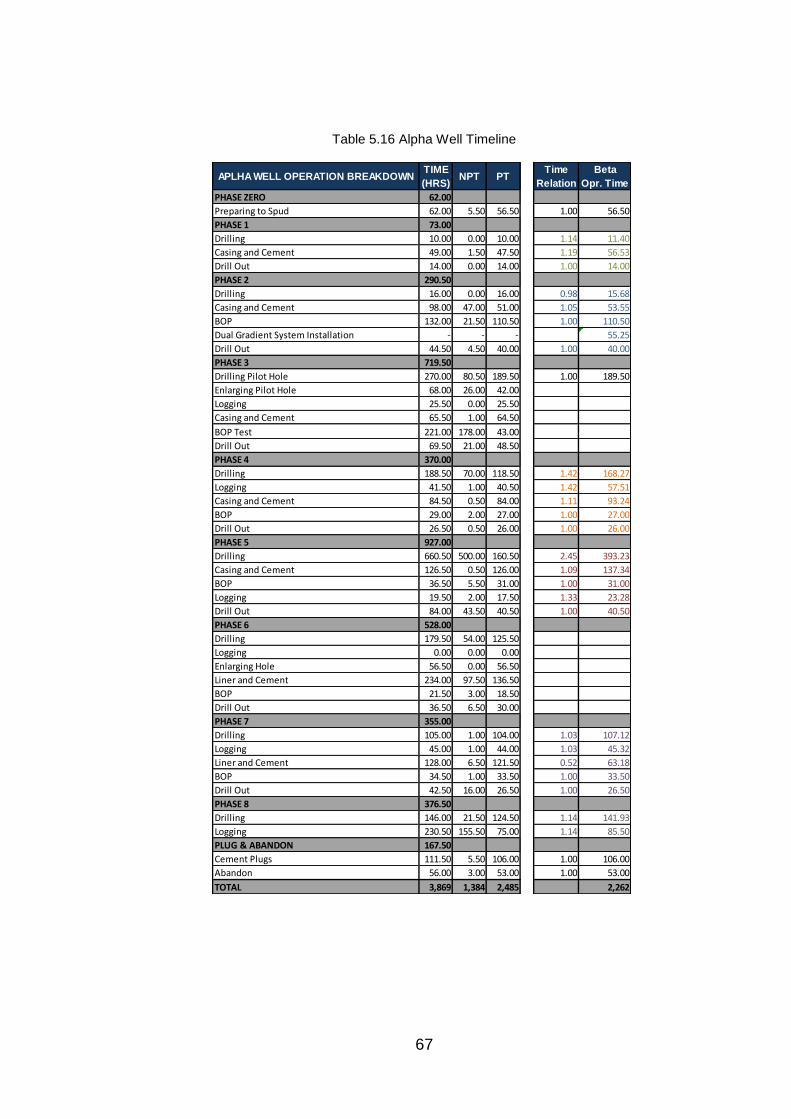
67
Table 5.16 Alpha Well Timeline
APLHA WELL OPERATION BREAKDOWNTIME
(HRS)NPT PT
Time
Relation
Beta
Opr. Time
PHASE ZERO 62.00
Preparing to Spud 62.00 5.50 56.50 1.00 56.50
PHASE 1 73.00
Drilling 10.00 0.00 10.00 1.14 11.40
Casing and Cement 49.00 1.50 47.50 1.19 56.53
Drill Out 14.00 0.00 14.00 1.00 14.00
PHASE 2 290.50
Drilling 16.00 0.00 16.00 0.98 15.68
Casing and Cement 98.00 47.00 51.00 1.05 53.55
BOP 132.00 21.50 110.50 1.00 110.50
Dual Gradient System Installation - - - 55.25
Drill Out 44.50 4.50 40.00 1.00 40.00
PHASE 3 719.50
Drilling Pilot Hole 270.00 80.50 189.50 1.00 189.50
Enlarging Pilot Hole 68.00 26.00 42.00
Logging 25.50 0.00 25.50
Casing and Cement 65.50 1.00 64.50
BOP Test 221.00 178.00 43.00
Drill Out 69.50 21.00 48.50
PHASE 4 370.00
Drilling 188.50 70.00 118.50 1.42 168.27
Logging 41.50 1.00 40.50 1.42 57.51
Casing and Cement 84.50 0.50 84.00 1.11 93.24
BOP 29.00 2.00 27.00 1.00 27.00
Drill Out 26.50 0.50 26.00 1.00 26.00
PHASE 5 927.00
Drilling 660.50 500.00 160.50 2.45 393.23
Casing and Cement 126.50 0.50 126.00 1.09 137.34
BOP 36.50 5.50 31.00 1.00 31.00
Logging 19.50 2.00 17.50 1.33 23.28
Drill Out 84.00 43.50 40.50 1.00 40.50
PHASE 6 528.00
Drilling 179.50 54.00 125.50
Logging 0.00 0.00 0.00
Enlarging Hole 56.50 0.00 56.50
Liner and Cement 234.00 97.50 136.50
BOP 21.50 3.00 18.50
Drill Out 36.50 6.50 30.00
PHASE 7 355.00
Drilling 105.00 1.00 104.00 1.03 107.12
Logging 45.00 1.00 44.00 1.03 45.32
Liner and Cement 128.00 6.50 121.50 0.52 63.18
BOP 34.50 1.00 33.50 1.00 33.50
Drill Out 42.50 16.00 26.50 1.00 26.50
PHASE 8 376.50
Drilling 146.00 21.50 124.50 1.14 141.93
Logging 230.50 155.50 75.00 1.14 85.50
PLUG & ABANDON 167.50
Cement Plugs 111.50 5.50 106.00 1.00 106.00
Abandon 56.00 3.00 53.00 1.00 53.00
TOTAL 3,869 1,384 2,485 2,262

68
In Figure 5.3, the graph shows the time versus depth comparison of both
the Alpha and Beta wells; Alpha operations took 161days, whereas Beta
well was completed in 128 days resulting in a 33 day savings.
Figure 5.4 Time Vs Depth Comparison of Alpha and Beta Well
5.3 BETA WELL COST CALCULATION
Table 5.16 shows the final AFE of the Beta well with comparison to the
Alpha well AFE. It was calculated based on the “ratio per service” which
were calculated in 4 different criteria (material based, time based, section
based, fixed cost) in previous sections.

69
Table 5.17 Beta Well AFE Breakdown
Ratio per
Service
Effective
Ratio
MATERIALS
WELLHEAD 0.43% Material Based 50.00% 0.22%
CASING 2.15% Material Based 98.12% 2.11%
LINER HANGER 0.30% Material Based 50.16% 0.15%
CASING ACCESSORIES 0.03% Material Based 76.05% 0.02%
RIG FUEL & LUBRICANTS & WATER 1.69% Time Based 79.39% 1.34%
BITS 0.64% Material Based 77.41% 0.50%
CEMENT & CHEMICALS 1.39% Material Based 84.65% 1.18%
DRILL/COMPLETION FLUID MATERIALS 2.64% Material Based 82.51% 2.18%
TOTAL M ATERIAL 9.28% 7.70%
BETA WELL
ALPHA WELL AFE BREAKDOWNWeight
(%)
Base of
Simulation
SERVICES
WELL PLANNING 0.76% Fixed Cost 100.00% 0.76%
SUPERVISION 4.50% Time Based 79.39% 3.57%
CONTRACT DRILLING RIG 56.02% Time Based 79.39% 44.48%
ROV 0.70% Time Based 79.39% 0.55%
AIR TRANSPORTATION (HELICOPTER) - - 0.00% 0.00%
Helicopter Mobilization Costs 1.04% Fixed Cost 100.00% 1.04%
Helicopter Operational Cost 2.81% Time Based 79.39% 2.23%
Helicopter Demobilization Cost 0.14% Fixed Cost 100.00% 0.14%
MARITIME TRANSPORTATION - - 0.00% 0.00%
PSV Mobilization Cost 0.75% Fixed Cost 100.00% 0.75%
PSV Operational Cost 3.41% Time Based 79.39% 2.70%
PSV Demobilization Cost 0.56% Fixed Cost 100.00% 0.56%
LOGISTIC SUPPORT BASE 2.89% Time Based 79.39% 2.30%
WELLHEAD SERVICE 0.84% Time Based 79.39% 0.67%
DRILLING RENTAL AND FISHING TOOLS 0.45% Time Based 79.39% 0.36%
UNDERREAMER SERVICE 0.98% Section Based 2.03% 0.02%
LINER HANGER SERVICE 0.35% Section Based 50.00% 0.17%
CASING & TUBING RUNNING 0.93% Section Based 71.43% 0.66%
H2S SERVICES 0.15% Time Based 79.39% 0.12%
DIRECTIONAL TOOLS & SERVICE 0.76% Time Based 79.39% 0.60%
MWD, LWD & APWD TOOLS & SERVICE 1.53% Time Based 79.39% 1.22%
DRILL/COMPLETION FLUID SERVICE 0.52% Time Based 79.39% 0.41%
OPEN HOLE & CMT LOGS 7.17% Section Based 99.37% 7.13%
WELL SITE LOCATION/ RIG POSITIONING 0.03% Fixed Cost 0.03% 0.00%
O.S. SITE SURVEY/ ENV. BASE LINE SURVEY 0.22% Fixed Cost 100.00% 0.22%
MUD LOGGING 0.28% Time Based 79.39% 0.22%
CEMENTING SERVICE 0.82% Time Based 79.39% 0.65%
COMMUNICATION 0.17% Time Based 79.39% 0.13%
CATERING 0.07% Time Based 79.39% 0.06%
OTHER RENTALS & SERVICES 1.87% Time Based 79.39% 1.48%
TOTAL SERVICES 90.72% 73.21%
TOTAL 100.00% 80.91%

70
Since DGD system has not become commercial yet, daily rate of the
service has not disclosed. Therefore, this data was not covered in cost
comparison calculation. Also, lack of this data was not allowed to calculate
the minimum operation duration to recover the cost of the system.
Moreover, the mud weight in Beta Well reached the 15.5ppg in the last
phase of the well, which was 12.9ppg in Alpha Well. The cost of the
required barite to increase mud weight 2.6ppg was also not calculated
separately in this study, it was considered under “volume required to
condition the drilling fluid” in section 5.1.3.
71
CHAPTER 6
CONCLUSIONS
To understand the economical impact of the Dual Gradient System, the
deepwater well, which was drilled conventionally, was redesigned and
simulated with Dual Gradient System. The results of this simulation were
compared with the original well data. Based upon the work performed for
this thesis the following conclusions were drawn.
In addition to technical advantages of the Dual Gradient System in deep-
water environment;
1. Dual Gradient System increases the operation ability where a narrow
operational window exists between pore pressure and fracture
pressure as expected.
2. Dual Gradient System allows using less casing strings to reach
planned TVD.
3. Simpler wellhead configurations can be selected in deep water
environment.
4. Dual Gradient System allows reaching TVD without reducing hole
size which provides an opportunity for high rate completions
72
Under the conditions studied in this thesis, the following conclusions were
drawn;
5. Variety of casing string was decreased from 7 casings for Alpha well
to 5 casings for Beta Well.
6. Simpler well design also brought the simpler wellhead configuration,
which decreased the wellhead cost around 50%.
7. Beta Well reached the same target with wider casing size, 10 3/4”
which was 9 5/8” in Alpha Well. It made the higher production rate
possible in production phase of the well.
8. As system simplifies the well design, the necessity of some services
are eliminated such as; liner hanger service and hole enlargement
service.
9. Dual Gradient System decreases the operation cost around 19%
considering the limitations. System also decreases the operation
duration around 20%, material cost around 17%
73
REFERENCES
[1] Greg, M. (2008). “Ultra-Deepwater Riserless Mud Circulation with
Dual Gradient Drilling.” Scientific Drilling, no.5, pp.48-51.
[2] Bourgoyne, A.T., Millheim, K.K.M., Chenevert, E. and Young, F.S.
(1991). “Applied Drilling Engineer.” Richardson Texas: SPE.
[3] Lopes, C.A., Bourgoyne, A.T.Jr. (1997). “The Dual Density Riser
Solution.” Amsterdam: SPE/IADC Drilling Conference. SPE 37628
[4] Cohen, J.H. and Deskins, G. (2006). “Use of Lightweight Solid
Additives to Reduce the Weight of Drilling Fluid in the Riser.”
Florida: IADC/SPE Drilling Conference. IADC/SPE99174.
[5] Smith, K.L., Gault, A.D., Witt, D.E. and Weddle, C.E. (2001).
“SubSea MudLift Drilling Joint Industry Project: Delivering Dual
Gradient Drilling Technology to Industry.” Louisiana: SPE Annual
Technical Conference and Exhibition. SPE 71357.
[6] Dowell, J.D. (2010). “Deploying the World’s First Commercial Dual
Gradient Drilling System.” Texas: SPE Deepwater Drilling and
Completions Conference. SPE137319.
[7] Forrest, N., Bailey, T. and Hannegan, D. (2001). “Subsea Equipment
for Deep Water Drilling Using Dual Gradient Mud System.”
Netherlands: SPE/IADC Drilling Conference. SPE/IADC 67707.
[8] Schumacher, J.P., Dowell, J.D., Ribbeck, L.R. and Eggemeyer, J.C.
(2001). “Subsea Mudlift Drilling: Planning and Preparation for the
First Subsea Field Test of a Full-Scale Dual Gradient Drilling
System at Green Canyon 136, Gulf of Mexico.” Louisiana: SPE
Annual Technical Conference and Exhibition. SPE 71358.
[9] Eggemeyer, J.C., Akins, M. E., Brainard, R.R., Judge, R.A.,
Peterman, C.P., Scavone, L.J. and Thethi, K. S. (2001). “SubSea
MudLift Drilling: Design and Implementation of a Dual Gradient

74
Drilling System.” Louisiana: SPE Annual Technical Conference and
Exhibition. SPE 71359.
[10] Online, Smith, K. (2009). “Dual Gradient Drilling.” Retrieved from
http://www.aade.org/houston/study/DETG/April09/DETG%204-22-
09%20Ken%20Smith-%20Dual%20Gradient%20Drilling[1].pdf


![A Comparative Analysis of Conjugate Gradient Algorithms ...economical, automatic tool to generate reusability ranking of software [10]. But, when one designs with Neural Networks alone,](https://img.dokumen.tips/doc/110x75/6059194b6a8e5636a6513050/a-comparative-analysis-of-conjugate-gradient-algorithms-economical-automatic.jpg)