Embed Size (px)
Citation preview

Economic Valuation of Coral Economic Valuation of Coral Reefs in Tobago – Reefs in Tobago –
June 13, June 13, 20082008
Tobago Tobago
Lauretta Lauretta BurkeBurke
World World Resources Resources InstituteInstitute

Project Partners IncludeProject Partners Include
Trinidad and TobagoTrinidad and Tobago
Buccoo Reef TrustBuccoo Reef Trust
T&T Institute of Marine T&T Institute of Marine Affairs (IMA)Affairs (IMA)
Tobago House of Assembly Tobago House of Assembly (THA) / Policy Research (THA) / Policy Research Development Institute Development Institute (PRDI)(PRDI)
T&T Central Statistics Office T&T Central Statistics Office (CSO)(CSO)
T&T Environmental T&T Environmental Management Agency (EMA)Management Agency (EMA)
Environment Tobago and Environment Tobago and SOSSOS
Saint LuciaSaint Lucia
Government of Saint LuciaGovernment of Saint Lucia
Regional PartnersRegional Partners
University of the West University of the West Indies (UWI) / Sustainable Indies (UWI) / Sustainable Economic Development Economic Development Unit (SEDU)Unit (SEDU)
Caribbean Natural Caribbean Natural Resources Institute Resources Institute (CANARI)(CANARI)

Financial SupportFinancial Support
Macarthur Macarthur Foundation Foundation
Ocean Foundation Ocean Foundation
Henry Foundation Henry Foundation
Munson Munson Foundation Foundation
Dutch Ministry of Dutch Ministry of Foreign Affairs Foreign Affairs
SwedBioSwedBio
International Coral International Coral Reef Action Reef Action Network (ICRAN)Network (ICRAN)
Buccoo Reef Trust Buccoo Reef Trust

BeautifulBeautiful

ValuableValuable

ThreatenedThreatened
Coastal developmentCoastal development Mangrove removalMangrove removal SewageSewage DredgingDredging RunoffRunoff TourismTourism OverfishingOverfishing Warming SeasWarming Seas

Influencing Better Influencing Better ManagementManagement
Economic Valuation is a tool to guide Economic Valuation is a tool to guide coastal planning, investment and coastal planning, investment and management in the long-term management in the long-term interest of local communities and the interest of local communities and the country country

Evaluating trade-offsEvaluating trade-offs
OPTIONSOPTIONS Development Development
optionsoptions Enforcement of Enforcement of
regulationsregulations Capping tourist Capping tourist
numbersnumbers Investing in Investing in
pollution controlpollution control
OUTCOMESOUTCOMES Revenue streams Revenue streams
from tourismfrom tourism Societal benefits Societal benefits
from reefsfrom reefs Ecosystem goods Ecosystem goods
and servicesand services

Economic Valuation of Coral Economic Valuation of Coral ReefsReefs
WRI (with partners) developed a coral WRI (with partners) developed a coral reef valuation methodology and reef valuation methodology and implemented valuations for the coral implemented valuations for the coral reefs of Tobago and St. Lucia. reefs of Tobago and St. Lucia.
The study evaluated the overall annual The study evaluated the overall annual
economic contribution of coral reef-economic contribution of coral reef-associated associated tourism and recreation, tourism and recreation, fisheries, and fisheries, and shoreline protection services. shoreline protection services.

Ecosystem Services from Coral Ecosystem Services from Coral ReefsReefs
Provisioning Provisioning ServicesServices
--food – fish and food – fish and shellfish shellfish
-genetic resources-genetic resources
- natural medicines - natural medicines and and pharmaceuticalspharmaceuticals
-ornamental resources-ornamental resources
- building materials- building materials
Regulating Regulating ServicesServices
- carbon storage / - carbon storage / climate climate regulationregulation
--erosion controlerosion control
-storm protection-storm protection
Cultural Cultural ServicesServices
-spiritual and religious -spiritual and religious valuesvalues
-knowledge systems-knowledge systems/ educational values/ educational values
-inspiration-inspiration-aesthetic values-aesthetic values-social traditions -social traditions
-sense of place-sense of place
--recreation and ecotourismrecreation and ecotourism
Supporting Services Supporting Services -sand formation -primary production-sand formation -primary production

Ecosystem Services from Coral Ecosystem Services from Coral ReefsReefs
Provisioning Provisioning ServicesServices
--food – fish and food – fish and shellfish shellfish
-genetic resources-genetic resources
- natural medicines - natural medicines and and pharmaceuticalspharmaceuticals
-ornamental resources-ornamental resources
- building materials- building materials
Regulating Regulating ServicesServices
- - carbon storage / carbon storage / climate climate regulationregulation
--erosion controlerosion control
-storm protection-storm protection
Cultural Cultural ServicesServices
-spiritual and religious -spiritual and religious valuesvalues
-knowledge systems-knowledge systems/ educational values/ educational values
-inspiration-inspiration-aesthetic values-aesthetic values-social traditions -social traditions
-sense of place-sense of place
--recreation and ecotourismrecreation and ecotourism
Supporting Services Supporting Services -sand formation -primary production-sand formation -primary production

Non-Valued ServicesNon-Valued Services
Total Economic Value (TEV) would also Total Economic Value (TEV) would also include:include:
Other Use Values:Other Use Values: Research ValuesResearch Values Option Values (e.g. pharmaceutical)Option Values (e.g. pharmaceutical) Carbon storageCarbon storage
Non-Use ValuesNon-Use Values Bequest ValueBequest Value Existence ValueExistence Value
We focus on values that can be reliably
estimated using available data

Summary of ValuesSummary of Values

Valuation Summary Valuation Summary
Coral reef-associated Coral reef-associated tourism and recreationtourism and recreation – –
contributed between US$100 and $130 million to contributed between US$100 and $130 million to
the national economy in 2006. the national economy in 2006.
Photo
: B
RT

Valuation Summary Valuation Summary
Coral reef-associated Coral reef-associated fisheriesfisheries ––
important for cultural tradition, safety net, and important for cultural tradition, safety net, and
livelihoodlivelihood
provide annual economic benefits estimated at provide annual economic benefits estimated at
between between US$0.8 – 1.3 million.US$0.8 – 1.3 million.
Photo
: B
RT

Valuation Summary Valuation Summary
Shoreline Protection ServicesShoreline Protection Services of Coral Reefs of Coral Reefs ––
avoided erosion and storm damage from avoided erosion and storm damage from
waves valued between US$18 and $33 waves valued between US$18 and $33
million per year. million per year.

Valuation SummaryValuation Summary
Tourism and Recreation - Tourism and Recreation - US$100 to $130 million in US$100 to $130 million in 2006. 2006.
Coral reef-associated fisheries - Coral reef-associated fisheries - US$0.8 – 1.3 million / year US$0.8 – 1.3 million / year
Shoreline protection services –Shoreline protection services –US$18 and $33 million per US$18 and $33 million per year.year.
These are significant compared These are significant compared to Tobago’s GDP, which was to Tobago’s GDP, which was $286 million in 2006. $286 million in 2006.
Coral reefs provide other important values not estimated in this study, Coral reefs provide other important values not estimated in this study, and these numbers should be regarded as a lower bound estimate.and these numbers should be regarded as a lower bound estimate.
Annual Economic Contribution of Coral Reefs in Tobago
0
20
40
60
80
100
120
140
Tourism andRecreation
Fisheries ShorelineProtection
US$
mill
ion
High estimate
Low estimate
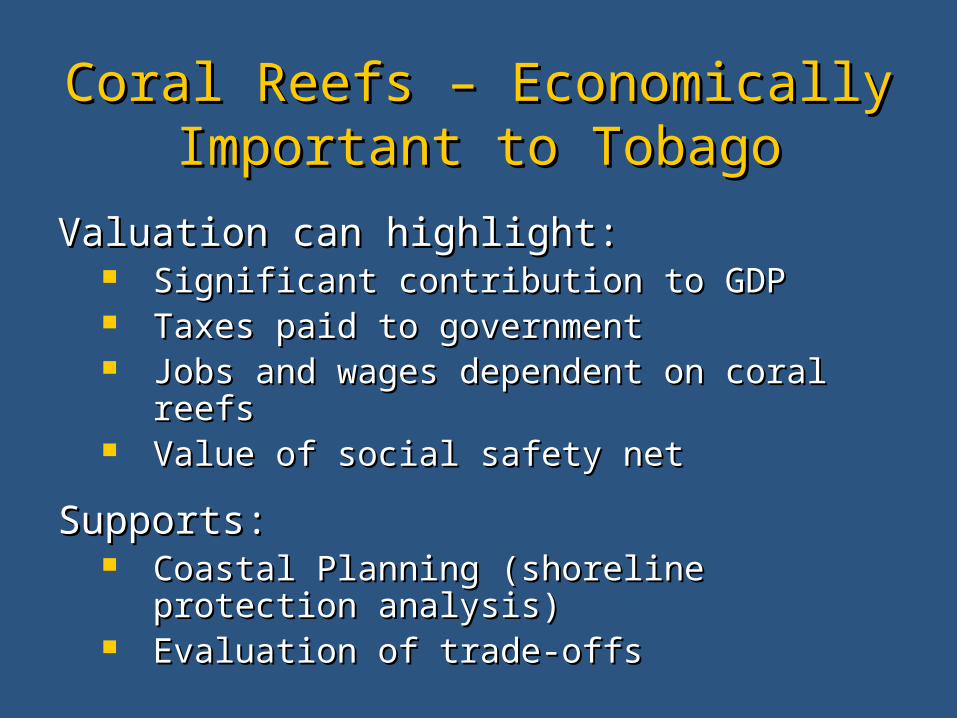
Coral Reefs – Economically Coral Reefs – Economically Important to TobagoImportant to Tobago
Valuation can highlight:Valuation can highlight: Significant contribution to GDPSignificant contribution to GDP Taxes paid to governmentTaxes paid to government Jobs and wages dependent on coral reefsJobs and wages dependent on coral reefs Value of social safety netValue of social safety net
Supports: Supports: Coastal Planning (shoreline protection Coastal Planning (shoreline protection
analysis)analysis) Evaluation of trade-offsEvaluation of trade-offs

Economic Valuation Economic Valuation applicationsapplications
Estimate Economic Contribution to GDP Estimate Economic Contribution to GDP Compare benefits of development / Compare benefits of development /
management options management options Encourage increased investment in coastal Encourage increased investment in coastal
management / MPAs / fisheries management / MPAs / fisheries managementmanagement
Identify sources of support for management Identify sources of support for management / policy / protected areas/ policy / protected areas
Set fees, such as visitor feesSet fees, such as visitor fees Damage assessmentDamage assessment

Tobago-specific examplesTobago-specific examples
Evaluate the costs and benefits of investing in more Evaluate the costs and benefits of investing in more active management of Buccoo Reef Marine Parkactive management of Buccoo Reef Marine Park
Evaluating the benefits of investment in improved Evaluating the benefits of investment in improved sewage treatment in SW Tobagosewage treatment in SW Tobago
Examine changes in fisheries management and the Examine changes in fisheries management and the impact on short-term livelihoods versus long-term impact on short-term livelihoods versus long-term benefitsbenefits
Comparing the benefits of consumptive vs. non-Comparing the benefits of consumptive vs. non-consumptive use of sea turtlesconsumptive use of sea turtles

Econ Val Project Econ Val Project CharacteristicsCharacteristics
1.1. Develop method which is simple and Develop method which is simple and replicable replicable
2.2. Rely predominantly on existing, available Rely predominantly on existing, available datadata
3.3. Produce coral reef valuation estimates for Produce coral reef valuation estimates for two pilot areas (Tobago and St. Lucia) two pilot areas (Tobago and St. Lucia)
4.4. Estimate likely economic loss due to coral Estimate likely economic loss due to coral reef degradationreef degradation

Valuation – Main Valuation – Main ComponentsComponents
Tourism Tourism Method: Financial Analysis Method: Financial Analysis (Net revenues plus transfers)(Net revenues plus transfers)
Fisheries Fisheries Method: Financial Analysis Method: Financial Analysis (Net revenues plus transfers)(Net revenues plus transfers)
Shoreline ProtectionShoreline ProtectionMethod: “Avoided Damages” Method: “Avoided Damages”

Tourism ComponentsTourism Components
AccommodationAccommodation Reef Recreation – DivingReef Recreation – Diving Reef Recreation – SnorkelingReef Recreation – Snorkeling Marine Park RevenuesMarine Park Revenues Misc. Expenses (e.g., departure taxes, Misc. Expenses (e.g., departure taxes,
visitor expenditure)visitor expenditure) Local Use Local Use Indirect economic effects Indirect economic effects

Tourism Valuation issuesTourism Valuation issues
1.1. Identifying “coastal” visitorsIdentifying “coastal” visitors
2.2. Quantifying reef recreationQuantifying reef recreation
3.3. Getting accurate MPA visitation Getting accurate MPA visitation numbersnumbers
4.4. Tobago-specific dataTobago-specific data

Tourism and Recreation Tourism and Recreation Valuation AssumptionsValuation Assumptions
40% of visitors come to Tobago in 40% of visitors come to Tobago in part due to the reefs.part due to the reefs.

Tourism Valuation for TobagoTourism Valuation for Tobago
Coral Reef-associated: ($US million)
Accommodation ValueAccommodation Value $24.7
Reef Recreation – Diving Reef Recreation – Diving $1.3
Reef Recreation – Snorkeling Reef Recreation – Snorkeling $1.5
Marine Park Revenues Marine Park Revenues n.a.
Misc. Visitor Expenses Misc. Visitor Expenses $16.0
Total Direct ImpactTotal Direct Impact $43.5
(15% of GDP)

Tourism Valuation for TobagoTourism Valuation for Tobago
Coral Reef-associated: ($US million)
Accommodation ValueAccommodation Value $24.7
Reef Recreation – Diving Reef Recreation – Diving $1.3
Reef Recreation – Snorkeling Reef Recreation – Snorkeling $1.5
Marine Park Revenues Marine Park Revenues n.a.
Misc. Visitor Expenses Misc. Visitor Expenses $16.0
Total Direct ImpactTotal Direct Impact $43.5
Indirect economic ImpactIndirect economic Impact ** $58 – 72
Total Direct & Indirect ImpactTotal Direct & Indirect Impact US$101 – 130 million
Consumer SurplusConsumer Surplus $1
Local Use Local Use $13 – 44

Local Reef Use SurveyLocal Reef Use Survey
Commissioned a survey through the Commissioned a survey through the University of West Indies / Sustainable University of West Indies / Sustainable Economic Development Unit / Government Economic Development Unit / Government of St. Lucia, Department of Statisticsof St. Lucia, Department of Statistics
300 people surveyed in 6 locations in 300 people surveyed in 6 locations in Tobago Tobago (Reef - Buccoo, Pigeon Point, and Speyside, and (Reef - Buccoo, Pigeon Point, and Speyside, and non-reef - Mt. Pleasant, Roxborough, and Patience Hill)non-reef - Mt. Pleasant, Roxborough, and Patience Hill)
Designed to measure local use of beaches Designed to measure local use of beaches and reefs as well as recreational and and reefs as well as recreational and subsistence fishing subsistence fishing

Fisheries ComponentsFisheries Components
Commercial FisheriesCommercial Fisheries
Fish Processing and CleaningFish Processing and Cleaning
Local Use (fishing)Local Use (fishing)
Indirect economic effects Indirect economic effects
Focus on reef-associated species – snapper, grouper, grunts, squirrelfish, parrot fish, lobster and conch.

Fisheries Valuation IssuesFisheries Valuation Issues
1.1. Lack of meaningful data on fish Lack of meaningful data on fish landingslandings
2.2. Limited data on sales and exportsLimited data on sales and exports
3.3. Limited data on local useLimited data on local use
4.4. Focus on economic impact – does Focus on economic impact – does not fully capture social values.not fully capture social values.

Commercial Fishing in Commercial Fishing in Tobago Tobago
Estimate derived from two Estimate derived from two approaches – approaches –
1.1. reef fish productivityreef fish productivity
2.2. estimated pot fishing effort estimated pot fishing effort
Coral reefs are over-fished Coral reefs are over-fished Tobago / productivity is declining Tobago / productivity is declining

a) Reef Fish Productivitya) Reef Fish Productivity
Reef Area: 30 kmReef Area: 30 km22 (from this project)(from this project)
Estimated fish productivity rate: Estimated fish productivity rate: range of 2 to 5 MT of fish / kmrange of 2 to 5 MT of fish / km22 of of coral reefcoral reef
Potential sustainable harvest of Potential sustainable harvest of 130,000 to 330,000 lb of reef fish130,000 to 330,000 lb of reef fish

b) Landings based on boats b) Landings based on boats
16 boats doing pot fishing, average 16 boats doing pot fishing, average 105 trips per year, landing an 105 trips per year, landing an average of 150 - 200 lbs per trip average of 150 - 200 lbs per trip
This leads to an estimated This leads to an estimated 250,000 - 336,000 lbs of fish caught. of fish caught. (Comparable to the maximum productivity (Comparable to the maximum productivity estimate)estimate)
Average Price of pot fish = TT$15 Average Price of pot fish = TT$15 ($2.50 US), leads to gross value of ($2.50 US), leads to gross value of catch of catch of US$630,000 - 840,000.US$630,000 - 840,000.

b) Landings based on boats b) Landings based on boats (cont.) (cont.)
We assume an additional We assume an additional 15,000 - 20,000 lbs lbs of lobsterof lobster caught (and US$7 per pound for caught (and US$7 per pound for lobster) so lobster) so US$106,000 - 140,000US$106,000 - 140,000
Total Gross revenue = Total Gross revenue = US$735,000 - 981,000.US$735,000 - 981,000.

Fisheries Valuation for TobagoFisheries Valuation for Tobago
Coral Reef-associated: ($US thousand)
Commercial Fisheries – Gross Revenue $736 - 981
N.L. Operating Costs (25%) $184 – 245
Commercial Fisheries – Net Revenue $552 - 736

Fisheries Valuation for TobagoFisheries Valuation for Tobago
Coral Reef-associated: ($US thousand)
Commercial Fisheries – Gross Revenue $736 - 981
N.L. Operating Costs (25%) $184 – 245
Commercial Fisheries – Net Revenue $552-736
Fish cleaning and processing $88-177
Total Direct ImpactTotal Direct Impact $640-913
Indirect economic ImpactIndirect economic Impact $118-235
Total Direct & Indirect ImpactTotal Direct & Indirect Impact $758 – 1,148

Shoreline Protection Shoreline Protection ServicesServices
Innovative method for isolating the role Innovative method for isolating the role of coral reefs and integrating of coral reefs and integrating economics economics
Map outputs – Map outputs –
Shoreline protected by coral reefsShoreline protected by coral reefs
Areas vulnerable to waves \ storm damageAreas vulnerable to waves \ storm damage
Relative contribution of reefs to shoreline Relative contribution of reefs to shoreline protectionprotection

Physical FactorsPhysical Factors
Physical factors affecting the protection Physical factors affecting the protection afforded by a coral reef: afforded by a coral reef:
orientation of the coast (windward / leeward; orientation of the coast (windward / leeward; high energy or low energy coast)high energy or low energy coast)
bathymetry / shoreline profile bathymetry / shoreline profile
shoreline shape (bay, headland)shoreline shape (bay, headland)
depth of the reef / geology (type of reef)depth of the reef / geology (type of reef)
distance the reef is from landdistance the reef is from land

Complex AnalysisComplex Analysis
IMA developed shoreline protection IMA developed shoreline protection framework - rules for how much framework - rules for how much protection the reef affords this protection the reef affords this coastline situation.coastline situation.
Can be adapted for climate Can be adapted for climate scenariosscenarios

Shoreline Protection Analysis Shoreline Protection Analysis (5 Steps)(5 Steps)
1.1. Identify vulnerable areasIdentify vulnerable areas
2.2. Identify areas protected by coral Identify areas protected by coral reefsreefs
3.3. Evaluate the relative protection Evaluate the relative protection provided by reefsprovided by reefs
4.4. Incorporate property valuesIncorporate property values
5.5. Combine to evaluate potential Combine to evaluate potential storm damage avoidedstorm damage avoided

1.
6% of Tobago’s land area rated “vulnerable.

Reef Protection
0 Not protected by reef 51%
2 Within 100 m of fringing reef 45%
3 Protected by Barrier Reef 4%
2.

Shoreline Stability Factors Shoreline Stability Factors (from IMA)(from IMA)
1.1. Coastal Geomorphology Coastal Geomorphology 2.2. Coastal Geology Coastal Geology 3.3. Coastal Protection Structures Coastal Protection Structures 4.4. Wave EnergyWave Energy5.5. Storm/Hurricane Events Storm/Hurricane Events 6.6. Coral Reef Index (Reef type, continuity, Coral Reef Index (Reef type, continuity,
distance offshore) distance offshore) 7.7. Coastal ElevationCoastal Elevation8.8. Coastal SlopeCoastal Slope9.9. Coastal VegetationCoastal Vegetation10.10. Anthropogenic ActivitiesAnthropogenic Activities

FactorFactorCoastal Protection Scheme (from IMA)Coastal Protection Scheme (from IMA)
Very HighVery High44
HighHigh33
MediumMedium22
LowLow11
NoneNone00
Coastal GeomorphologyCoastal Geomorphology Rocky, Cliffed Rocky, Cliffed CoastlineCoastline
Soft (Limestone) Soft (Limestone) Cliffs or Low BluffsCliffs or Low Bluffs
MangrovesMangroves BeachesBeaches N/AN/A
Coastal GeologyCoastal Geology Igneous and/or Igneous and/or VolcanicVolcanic
MetamorphicMetamorphic SedimentarySedimentaryUnconsolidated Unconsolidated
SedimentsSedimentsN/AN/A
Coastal Protection StructuresCoastal Protection StructuresProtected by 2 Protected by 2
prominent headlands prominent headlands and breakwaterand breakwater
Protected by 2 Protected by 2 prominent headlandsprominent headlands
Seawalls, Riprap or Seawalls, Riprap or BreakwatersBreakwaters
Protected by one or Protected by one or two small headlandstwo small headlands
No protection by No protection by headlands headlands
Wave Energy (~ Max. Wave Wave Energy (~ Max. Wave Height [cm])Height [cm])
< 20< 20 20 - 4020 - 40 40 - 6040 - 60 >60>60 N/AN/A
Coral ReefsCoral Reefs Reef TypeReef Type Reef DistributionReef Distribution Reef Distance (m)Reef Distance (m)
Barrier Barrier N/AN/A< 250< 250
PatchPatchN/AN/A250 - 500250 - 500
FringeFringeContinuousContinuous500 - 1000500 - 1000
ApronApronDiscontinuousDiscontinuous> 1000> 1000
No reef presentNo reef presentNo reef presentNo reef presentNo reef presentNo reef present
Storm/Hurricane EventsStorm/Hurricane Events Affected by 1-5 TS Affected by 1-5 TS every 10 yearsevery 10 years
Affected by at least 5 Affected by at least 5 TS every 10 yearsTS every 10 years
Affected by at least a Affected by at least a category 1 every 25 category 1 every 25
yearsyears
Affected by at least a Affected by at least a category 3 every 25 category 3 every 25
yearsyearsN/AN/A
Coastal Elevation (m)Coastal Elevation (m) > 12> 12 5 - 125 - 12 1 - 51 - 5 0 - 10 - 1 < 0 (N/A) **< 0 (N/A) **
Coastal Slope (%)Coastal Slope (%) 6.2 – 9.76.2 – 9.7 2.6 – 6.22.6 – 6.2 1.1 – 2.61.1 – 2.6 0.4 – 1.10.4 – 1.1 N/AN/A
Coastal Vegetation *Coastal Vegetation * TypeType DistributionDistribution
MangrovesMangroves> 75 % length of > 75 % length of coastlinecoastline
Coastal WoodlandsCoastal Woodlands50% - 75 % of length 50% - 75 % of length
ThicketThicket25% - 50 % of length 25% - 50 % of length
RunnersRunners< 25% length of < 25% length of coastlinecoastline
NoneNoneNo VegetationNo Vegetation
Coastal Anthropogenic ActivitiesCoastal Anthropogenic ActivitiesNo sand mining, No sand mining,
coastal development, coastal development, etc. etc.
Misc. Other ActivitiesMisc. Other ActivitiesEither sand mining or Either sand mining or coastal developmentcoastal development
Sand mining and Sand mining and coastal developmentcoastal development
N/AN/A

Stability Factors used in Tobago Stability Factors used in Tobago AnalysisAnalysis
1.1. Coastal Geomorphology Coastal Geomorphology 2.2. Coastal Geology Coastal Geology 3.3. Wave EnergyWave Energy4.4. Storm/Hurricane Events Storm/Hurricane Events 5.5. Coral Reef Index (Reef type, continuity, Coral Reef Index (Reef type, continuity,
distance offshore) distance offshore) 6.6. Coastal ElevationCoastal Elevation
Not AvailableNot Available1.1. Coastal VegetationCoastal Vegetation2.2. Coastal SlopeCoastal Slope3.3. Coastal Protection StructuresCoastal Protection Structures4.4. Anthropogenic ActivitiesAnthropogenic Activities

3a. Relative Total Coastal 3a. Relative Total Coastal Protection (RTCP)Protection (RTCP)
With reef presentWith reef present Without reefWithout reef

3b.

3b.

Potentially Avoided Potentially Avoided DamagesDamages
Estimated based on property values Estimated based on property values in “vulnerable areas” which are in “vulnerable areas” which are “protected by a reef,” based on the “protected by a reef,” based on the “relative reef contribution” for that “relative reef contribution” for that area.area.
Tobago – property values estimated Tobago – property values estimated
at US$18 – 22 per square foot at US$18 – 22 per square foot

Shoreline Protection Shoreline Protection Summary – Summary –
TobagoTobago TobagoTobago
Land Area (sq km)Land Area (sq km) 300 km2300 km2
Vulnerable Land Area (sq km)Vulnerable Land Area (sq km) 19 km219 km2 6%6%
Vulnerable Area Protected by reefs (sq km)Vulnerable Area Protected by reefs (sq km) 9 km29 km2 3%3%
Shoreline length Protected by ReefsShoreline length Protected by Reefs49%49%
Average Property Value (US$)Average Property Value (US$) US $18 - $22US $18 - $22
Potentially Avoided Damages Potentially Avoided Damages (annual average)(annual average)
US $18 – 33 millUS $18 – 33 mill

Shoreline Protection Shoreline Protection Summary – Summary –
BuccooBuccoo
BuccooBuccoo
Potentially Avoided Damages Potentially Avoided Damages (2007)(2007)
US $5 – 10 millUS $5 – 10 mill
30% of 30% of TobagoTobagoTotalTotal
Potentially Avoided Damages Potentially Avoided Damages (over 25 years)(over 25 years)
US $140 – 250 US $140 – 250 millionmillion

Summary of Values for Summary of Values for TobagoTobago
Coral Reef-associated : ($US million / yr)
Tourism and Recreation – Total Direct Impact $43.5 million
Tourism and Recreation – Total economic Impact $100 – 130 million
Fisheries – economic Impact ~ $1 million
Shoreline Protection Services $18 – 33 million

Policy Exploration – Buccoo Policy Exploration – Buccoo ReefReef
Tourist DestinationTourist Destination Environmental Environmental
issues issues water qualitywater quality overfishingoverfishing reef condition reef condition
BRMP - BRMP - enforcementenforcement

Management Options – Buccoo Management Options – Buccoo ReefReef
Enforcement of no-Enforcement of no-fishing regulationsfishing regulations
Re-routing of storm Re-routing of storm draindrain
Integrated Integrated watershed watershed managementmanagement
Sewage treatmentSewage treatment

Economic Value – Buccoo Economic Value – Buccoo ReefReef
Glass-bottom / snorkel Glass-bottom / snorkel Tours –US$1.4 mill / yrTours –US$1.4 mill / yr
Tourism Tourism US$7-8 million / yr US$7-8 million / yr US$128 – 156 million over US$128 – 156 million over
25 years25 years Shoreline protection - Shoreline protection -
US$140-250 million over US$140-250 million over 25 years 25 years

Policy Recommendations for Policy Recommendations for TobagoTobago
Improve coastal water quality Improve coastal water quality Maintain coastal mangroves Maintain coastal mangroves Establish an entrance fee to BRMP Establish an entrance fee to BRMP
and use revenue for park and use revenue for park management management
Monitor marine recreation and Monitor marine recreation and manage within sustainable limitsmanage within sustainable limits
Improve mapping and monitoring of Improve mapping and monitoring of coral reefs and mangrovescoral reefs and mangroves

Policy Recommendations for Policy Recommendations for Tobago Tobago (continued)(continued)
Improve fishing survey design, data Improve fishing survey design, data collection and information collection and information management at THA to allow tracking management at THA to allow tracking of fishing effort and catch over timeof fishing effort and catch over time
Monitor sea turtle populations – Monitor sea turtle populations – manage sustainablymanage sustainably
Use the coral reef valuation Use the coral reef valuation methodology and Tool to track the methodology and Tool to track the economic contribution of coral reefs economic contribution of coral reefs over time over time

Available online at www.buccooreef.org andwww.wri.org/project/valuation-caribbean-reefs
Contacts: WRI –Lauretta Burke, +1 (202) 729 7774, [email protected] BRT – Hyacinth Armstrong, +868 635 2000, [email protected] IMA – Sean Paddy, (868) 634 4291 x405, [email protected]