Embed Size (px)
Citation preview

334 Rune SkarsteinJournal of Agrarian Change, Vol. 4 No. 1 and 2, January and April 2004, pp. 00–00.Journal of Agrarian Change, Vol. 5 No. 3, July 2005, pp. 334–362.
© Blackwell Publishing Ltd, Henry Bernstein and Terence J. Byres 2005.
Economic Liberalization and SmallholderProductivity in Tanzania. From Promised
Success to Real Failure, 1985–1998
RUNE SKARSTEIN
In the mid-1980s, Tanzania adopted a programme for economic liberalizationof the entire economy, including agriculture. After pressure from the IMFand the World Bank in particular, but also from most of the bilateral donors,agricultural producer and input prices were decontrolled, panterritorial priceswere abolished, subsidies were removed and trade in agricultural products andinputs was to a large extent taken over by private traders. The internationaldonor community promised that economic liberalization would provide a strongstimulus to Tanzanian agriculture, resulting in increasing yields, increasedlabour productivity, rising agricultural production and higher incomes. However,available data show that, as far as food crop production is concerned, this promisehas not been fulfilled. Even compared to the ‘crisis years’ 1979–1984, labourproductivity, yields and production per capita of food grains stagnated ordeclined up to the end of the 1990s. Some causes of this failure are discussed.
Keywords: economic liberalization, agricultural labour productivity,land productivity, agricultural output, Tanzania
1. BACKGROUND
Smallholders are the main producers of food crops in Tanzania.1 In 1994/95,approximately 88 per cent of the total agricultural area in Tanzania was under
Rune Skarstein, Department of Economics, NTNU, N-7491 Trondheim, Norway. e-mail:[email protected]
I am indebted to participants at the seminar on ‘Agriculture and Rural Development’ at ESRF,Dar es Salaam, 2 –3 September 2004, for most useful comments on an earlier draft of this paper. I amalso grateful to Amit Bhaduri, Anders Skonhoft and two referees of this journal for helpful comments.Last but not least, I wish to thank Dennis Rweyemamu at ESRF for his assistance in collecting data.The paper has been prepared as part of the research project ‘Global Models and Local Realities –African Peasants in the Age of Liberalization’. Financial support from The Research Council of Norway(NFR) is gratefully acknowledged.1 In this article, the term ‘smallholder’ has the same meaning as in official Tanzanian statistics.According to the National Sample Census of Agriculture of 1994/95 (United Republic of Tanzania 1996),there were 3,873,000 smallholders in Tanzania Mainland. In the masika season (the great rain season),average planted area per smallholder was 0.86 ha. 9.9 per cent of all smallholders had a planted areaof more than 2 ha, while only 1.4 per cent had a planted area of more than 5 ha. 99.9 per cent hada hand hoe ( jembe), while 9.3 per cent had an animal-operated plough. 17.6 per cent employedtemporary worker(s), while only 1.1 per cent employed permanent wage labour. Thus, the Tanzaniansmallholders operate their holdings mainly with family labour, the great majority using only handtools. In my interpretation, the term ‘smallholder’ is therefore identical with the term ‘peasant’.
JOAC5_3C104 5/16/05, 11:16 PM334

Economic Liberalization and Smallholder Productivity in Tanzania 335
smallholdings, which accounted for 97.8 per cent of total maize production,97.3 per cent of total paddy production, and almost all production of sorghum/millet in the country (United Republic of Tanzania 1996, 38; 1997, vi–vii). Forthis reason, the focus of this paper is the impact of economic liberalization onsmallholder productivity.
Let me start by recapitulating the stagnation in Tanzania’s agriculturalproduction in the late 1970s and early 1980s. The first serious setback was in1973/74 and 1974/75, associated with the villagization campaign, but also attributedto bad weather. In 1976/77, agricultural production recovered again. But in subse-quent years, there was a persistent stagnation until 1983. In the period 1976–77to 1982–83, the average annual growth of maize and rice production was 1.0 percent and 0.2 per cent, respectively, while agricultural GDP (crop and animalhusbandry) increased by only 1.3 per cent per year. With a population growthrate of 3.2 per cent per annum in this period, per capita production of the twomajor food grains declined by 2.2 per cent and 3.0 per cent per year, respec-tively.2 Thus, production of the most important staple food by far, maize, droppedfrom an average of 93.5 kg per capita in 1976–77, to 82.1 kg per capita in 1982–83. On the other hand, it is notable that in the years 1983–86 (which have oftenbeen considered as the worst crisis years) there was, according to official statis-tics, actually a strong upswing in agricultural production (Table 1). Maize pro-duction rose by more than 26 per cent from the crop year 1982/83 to 1984/85,reaching a historical high of 2,093,000 tonnes, corresponding to 96 kg per capitaof the population, in the latter year. In the period 1984–86, both maize andpaddy production increased every year; maize production rose by an average of10.2 per cent per year, while paddy production increased by more than 16 percent per year (also Table 1).
The stagnation of agricultural production in the late 1970s and early 1980scontributed to Tanzania’s increasing dependency on large imports of the majorfood grains maize and rice. In the period 1972–86, Tanzania had net imports ofmaize in all years except in 1978 and 1979. Total net imports of maize over thewhole period amounted to 1,587,000 tonnes, i.e. an average of 105,800 tonnesper year. In the same 15-year period, Tanzania was a net importer of rice everyyear, amounting to 770,000 tonnes over the whole period, corresponding to anaverage of more than 51,000 tonnes per year (Bryceson 1993, 239). There canbe no doubt that these imports contributed to Tanzania’s mounting balance ofpayments crisis in the 1980s.
However, the large imports of food grains up to 1985 were not caused byproduction shortfalls alone. That is indicated by the fact that net grain importsrose even in the period 1983–85, in spite of large production increases. In 1985,
2 Maize and rice/paddy are the two most important staple foodstuffs both in terms of value andweight. In 1976/77, maize contributed 43.5 per cent to the total value and 40.2 per cent to the totalweight of consumption of staple foodstuffs. The corresponding figures for rice/paddy on secondplace were 13.7 and 6.3 per cent, respectively (Bryceson 1993, 219).
JOAC5_3C104 5/16/05, 11:16 PM335

336 Rune Skarstein
Table 1. Production of maize and paddy, ’000 tonnes, and growth rate of agriculturalGDP, 1976–98
Period Maize Paddy
Average annual Average Average annual Average annual
Annual growth,
production annual production growth (%)
agricultural
growth (%)
GDP (%) a
1976–79 1575 +5.9 327 −8.8 +1.11980–83 1718 −1.0 290 +7.5 +2.61984–86 2081 +10.2 443 +16.5 +4.71976–86 1873 +3.46b 356 +3.65b +2.71b
1986–89 2466 −1.8 620 +22.4 +1.61990–92 2261 −4.1 511 −20.0 +0.21993–95 2443 +8.9 659 +16.6 +4.11996–98 2631 −2.3 799 +18.7 +4.11986–98 2452 +1.12 c 622 +4.95 c +2.47 c
a For the period 1976–86, crop and animal husbandry at constant 1976 prices. For theperiod 1986–98, crop and animal husbandry at constant 1992 prices.b Trend growth rate (fitting a least-squares linear regression trend line to thelogarithmic annual values of the variable), 1976–86.c Trend growth rate, 1985–98.The crop data up to 1983 stem from various publications from the Ministry ofAgriculture. The data for the period 1983–85 are from the Crop Monitoring and EarlyWarning Unit (CMEW), while the data from 1986 onwards are from the AgriculturalStatistics Unit (ASU) within the Ministry of Agriculture. The data for 1976 refer to thecrop year 1975/76, and so on.Sources of data for the period 1976–86: BOS (1992, 8, Table 3.1), for agriculturalGDP. Tanzanian Economic Trends, vol. 7, nos. 1–2, 1994, Table 12, p. 99, forproduction of maize and rice.Sources of data for the period 1986–98: World Bank (2000, 77, 92), data from ASU/MAC. An argument for using ASU data, especially from 1993 onwards, is presented insection 3 below.
the very same year as Tanzania had a bumper harvest of maize (2,093,000 tonnes),net imports of maize also reached a historical high of 278,000 tonnes. The exp-lanation of this contradictory development is the growth of smuggling to neigh-bouring countries which accelerated after the war in Uganda in 1979. The increasedsmuggling was caused by factors on the demand side as well as the supply side.Due to disruptions caused by the war, there was grain shortage and correspond-ingly very high prices in Uganda. Also in Kenya, grain prices were high due tobad harvests. On the supply side, the Tanzanian government’s commandeeringof a large part of the transport fleet, spare parts and fuel for the war effort causeda severe disruption of the grain purchases of the National Milling Corporation(NMC). These factors combined prompted farmers to market their maize through
JOAC5_3C104 5/16/05, 11:16 PM336

Economic Liberalization and Smallholder Productivity in Tanzania 337
unofficial channels (Bryceson 1993, 95).3 It should also be noted that the averageannual level of maize production was 9 per cent higher in the ‘crisis years’ 1980–83 than in the preceding years 1976–79 (Table 1).
Against this background, to what extent the government could have pre-vented smuggling through a high-price policy may be questioned. After all, inthe years when smuggling was at its highest, from 1980 to 1983, the nominalproducer price of maize was increased by 120 per cent, while the real price(nominal price deflated by the NCPI) rose by 6.8 per cent. On the other hand,private traders smuggling maize from the granaries of the country – in particularfrom Njombe and Mbeya in the Southern Highlands and Arusha and Mbulu inthe northern part of the country – offered the peasants better producer prices andmore punctual collection of crops than the NMC. Most probably, this develop-ment was also to a considerable extent the result of the increasing inefficiency ofthe NMC, which charged high marketing margins while real producer priceswere stagnant. However, the NMC’s inefficiency was not only caused by itsdecaying internal organization. In the mid-1980s, approximately 75 per cent ofTanzania’s lorry fleet was in private hands, and for lack of sufficient own transportcapacity, the NMC had to hire private transporters at rapidly escalating costs(Bryceson 1993, 77, 98).
2. EXTERNAL VS INTERNAL CAUSES
The above considerations lead us to the heated debate on the ‘external’ vs ‘internal’causes of Tanzania’s crisis in the 1980s. In the early 1980s, Tanzanian researchersand politicians tended to emphasize external causes for the agricultural stagna-tion, in particular weak demand for agricultural export crops and correspond-ingly worsening terms of trade,4 rising interest rates in international credit markets,increased protectionism in industrialized countries, the oil price shocks in 1973/74 and 1979, the breakdown of the East African Community in 1977, the choleraepidemic in 1978, and the war with Uganda in 1979.
Among ‘external causes’ were also periods of bad weather conditions. In1979, poor weather was reported as the cause of a bad maize harvest, particularlyin Arusha, which was then one of the NMC’s major supply regions. A few yearslater, a drought which affected large areas in the crop year 1981/82 and floods inparts of the country in the following year, led to bad harvests with a productionof only about 1650 thousand tonnes in each of those years.
Another ‘external cause’ of Tanzania’s economic troubles in the early 1980s,which was far less highlighted, was the dramatic decline in foreign aid, including
3 For the crop years 1983/84 and 1984/85, the Marketing Development Bureau estimated that asmuch as 75 per cent of marketed maize and 80 per cent of marketed rice went through parallelmarkets (Bryceson 1993, 96). In my assessment, these figures are exaggerated.4 Indeed, in the period 1977–85, Tanzania’s commodity terms of trade declined by 50.8 per cent,while the income terms of trade declined by 64 per cent in the same period (Central Bank of Tanzania2001, 155).
JOAC5_3C104 5/16/05, 11:16 PM337
338 Rune Skarstein
concessional loans, which was reduced by more than 30 per cent, from US$701.9million in 1981 to US$486.9 million in 1985. This reduction of foreign aid byUS$215 million corresponded to 62 per cent of Tanzania’s merchandise exportsand was 3.2 times larger than the country’s merchandise trade deficit in 1986.The sharp reduction of foreign assistance compounded the crisis by leading to adrastic import compression, which had a profound negative effect on the supplyof implements and inputs to the agricultural sector.
The drop in foreign aid was mainly accounted for by The Federal Republic ofGermany, The United Kingdom, the Netherlands, Sweden and the World Bank(Havnevik et al. 1988, 124–7).5 These cuts were related to the fact that Tanzaniahad refused to conclude an agreement with the IMF (International MonetaryFund) on structural adjustment, i.e. a programme of economic liberalization. InOctober 1985 Nyerere left the presidency, refusing to stand for a new term,and in August 1986 the Tanzanian government signed an agreement withthe IMF for support to an Economic Recovery Programme (ERP). It is note-worthy that as soon as Tanzania had adopted the ERP, which was designedby the World Bank, the Bank increased its disbursements considerably. For 1986as a whole, World Bank disbursements totalled more than US$60 million,or more than twice the amount in 1985 (Havnevik et al. 1988, 127). In theperiod 1985–90, foreign aid to Tanzania increased considerably every year, andin 1992 the aid inflow reached a historical peak of US$1345.5 million, whichrepresented an increase of 176 per cent compared to 1985 (OECD 1990, 264;1995, 183). The aid inflow in 1992 also represented a historical peak of 33 percent of the country’s GDP and covered as much as 83.6 per cent of the importbill. Against this background, it is clear that foreign aid was used both as astick and a carrot to make the Tanzanian government embark upon the road ofeconomic liberalization.
On the other hand, without directly denying these external factors, manyforeign researchers, as well as the donor community and the international financialinstitutions (World Bank and IMF) increasingly tended to emphasize internalcauses. They argued ever more strongly that the stagnation of Tanzania’sagriculture was mainly caused by wrong policies and internal economic structuressuffocating the development of agriculture. Among the internal factors whichwere most often emphasized was the already noted inefficiency of agriculturalparastatals resulting in delayed or no payments to producers, high marketingmargins and correspondingly lower share of producer prices in the final prices(Ellis 1983, 1988).6 Other internal factors which were often referred to were
5 Both in absolute and percentage terms, the World Bank made the greatest cut in disbursements,from US$97.9 million in 1982 to US$28.5 million in 1985, corresponding to minus 71 per cent(Havnevik et al. 1988, 126).6 A serious limitation of Ellis’ studies in terms of explaining agricultural stagnation after 1970 isthat, in addition to dealing mainly with export crops, he does not provide data from before 1970.On the other hand, with reference to data collected by Odegaard, Deborah Bryceson (1993, 239) hasshown that, at least for food crops, the marketing margins, i.e. the difference between the consumerand producer price divided by the producer price, were considerably higher in the period 1964–72
JOAC5_3C104 5/16/05, 11:16 PM338

Economic Liberalization and Smallholder Productivity in Tanzania 339
nepotism and rent-seeking by corrupt bureaucrats in the state and the parastatalsector, ‘financial repression’ and controlled and panterritorial prices which led to‘price distortions’ discouraging agricultural producers from an efficient alloca-tion of resources, and the development of an industrial sector which stagnateddue to its inefficiency and import dependency and became increasingly unableto provide agricultural producers with incentive goods (e.g. Bevan et al. 1989;Collier and Gunning 1999).
It is noteworthy that the counterproductive effects of villagization, whichboth the World Bank and most bilateral donors had applauded in the mid-1970s,were more rarely referred to. However, several studies indicate that villagizationwas possibly the most important sole cause of agricultural stagnation in theperiod from the mid-1970s to the mid-1980s. Large numbers of peasants weredisrupted from their known productive environment and moved to areas wherethey did not know the quality and properties of the soil. In the old scatteredsettlements, shifting cultivation had ensured conservation of the soil. The newsettlements necessarily implied a more intensive pressure on land resources andsoil degradation.
After villagization, an increasingly intensive cultivation pattern developedaround the villages, which could count several thousand inhabitants.7 Theaverage fallow period declined rapidly, while the smallholders did not have thenecessary resources to conserve land by using chemical fertilizer, and walkingdistances to the fields increased as villagers tried to counterbalance the decline insoil fertility by cultivating areas more remote to the villages.8 One study of fivevillages in Mufindi district carried out in the early 1980s shows ‘a significantand continuing fall in output per hectare of maize during the three most recentpost-villagization years. This fall in productivity does not seem to have beencaused by climatic factors, because . . . the excess rainfall in 1983 did not seem tohave had adverse effects on crop productivity’ (Kikula 1997, 78). In the years1981–83, the average maize yield in the five villages was 18 per cent lower, andin 1983 as much as 25 per cent lower than the normal yield before villagization(Kikula 1997, 77–80).
than in the stagnation/crisis period 1973–84. For maize flour (sembe), the marketing margin was 309per cent in the former period and 85 per cent in the latter period. For rice, the corresponding figureswere 244 and 178 per cent, respectively, and for wheat 212 and 199 per cent, respectively. Neither forsembe nor rice was there any tendency of increasing marketing margins during the period 1973–84.Both for this reason and because the marketing margins of private traders are largely unknown, theclaim that ‘in the Tanzanian grain market, trading costs doubled during the period of controls, andfell by over 60 per cent once they were removed’ (Collier and Gunning 1999, 97) is, in my assessment,highly questionable.7 In 1979, there were on average about 1730 inhabitants in each of the more than 8000 villages (Ellis1982, 68). In this average are included villages with much larger populations. For example, the sevenvillages in the northern flood plain of Rufiji District had an average population of about 4570 in 1978(Havnevik 1993, 79), and several villages in the country have had populations of more than 10,000.8 As the area of cultivated land extended around the villages, so also the walking distance tofirewood tended to increase. According to an International Labour Organization study, the ruralhousehold distance to firewood rose from between 0.7 and 4.2 km in 1977, to between 2.5 and 5 kmin 1981 (ILO 1981, 230).
JOAC5_3C104 5/16/05, 11:16 PM339

340 Rune Skarstein
3. ECONOMIC LIBERALIZATION
Although internal and external causes were unequally emphasized by differentstudies, there was considerable agreement on the diagnosis of the crisis and theidentification of its main causes. There was no such agreement on a prescriptionas to how to overcome the crisis. On this question there was a gulf of disagree-ment mainly between two groups. On the one hand there was a group, mainlyresearchers, who argued that the crisis problems should be solved by reformingthe existing institutions and democratizing society through political mobilizationfrom below. They would retain a high degree of economic planning and stateintervention, but reform the whole public sector radically and also reduce itsbureaucracy. In particular, they argued for control of foreign trade and exchangecontrols, for protection of infant domestic industries, for the restrengthening orrevival of customary tenure rights in agriculture, for retaining panterritorial inputand producer prices, and for a profound democratization of the cooperatives, aswell as society as a whole (e.g. Boesen et al. 1986; Shivji 1986, 1998; Havnevik1987, 1993; Gibbon et al. 1993).
On the other hand, the IMF and the World Bank in particular, with more orless active support from virtually all bilateral donors, claimed that the only solu-tion to the crisis was less state and more market, which implied economic liber-alization, dismantling of a large number of parastatals and generally a dramaticreduction of the role of the government in the economy. In the view of the IMFand the World Bank, the Tanzanian system with heavy state involvement inthe economy had led to grave distortions in the pricing and incentive systems.Therefore, economic liberalization was considered necessary to liberate privateeconomic initiative and to ‘get the prices right’, so that they would reflect relativescarcities and ensure an optimal allocation of resources. Or, as the IMF phrased itin 1986 referring to the ERP,
partial attempts at correcting a fundamentally deteriorating economic andfinancial situation do not succeed . . . in the absence of appropriate pricesignals. . . . [T]he main emphasis of the programme is to provide to eco-nomic agents the appropriate pricing signals and to give them the necessaryopportunities to act on the basis of those signals. This should provideincentives toward economic efficiency and improved allocation of scarceresources. (IMF 1986, 3, 6–7)
What the IMF states here is that ‘appropriate pricing signals’ ensure staticefficiency, in the sense of allocating given ‘scarce resources’ so as to produce amaximum output in the short term. But the statement does not indicate whether‘appropriate pricing signals’ could also ensure dynamic efficiency, through an‘optimal path’ of technical progress and growth of land and labour productivityin the longer term, which is actually the crucial problem in Tanzanian agriculture.The World Bank’s structural adjustment programmes, which aim at improvinglong-term dynamic efficiency, also stress the objective of ‘getting the prices right’,
JOAC5_3C104 5/16/05, 11:16 PM340

Economic Liberalization and Smallholder Productivity in Tanzania 341
apparently by assuming that static efficiency will lead to long-term dynamicefficiency.9
The process of economic liberalization, which was ultimately carried out fromabove by the power of the international finance institutions (IFIs), had startedwell before Tanzania was compelled to sign an agreement with the IMF in 1986.In 1981, the government launched a National Economic Survival Programme(NESP) in an attempt to mobilize foreign exchange. In 1982 this was followedby a Structural Adjustment Programme (SAP), which apparently intended topartially meet the demands of the IMF by dealing with the economy’s structuralproblems. In the agricultural sector, SAP aimed at higher producer prices,improved input availability and more efficient marketing. And as a matter offact, in the 1984/85 budget, the government more than doubled agricultural exp-enditure, removed the subsidy on the consumer price of maize, and announceda substantial devaluation of the Tanzanian Shilling (Gibbon et al. 1993, 52–71).In October 1982, the government launched a document on national agriculturalpolicy (United Republic of Tanzania 1982), which contained rather detailed analy-ses of the development of agriculture and its subsectors, as well as agriculturalextension, credit and marketing in the period 1961–82. The recommendations inthe policy document could be read as a detailed follow-up of the section onagriculture in the SAP.
However, the IMF and the World Bank were still not content, and in August1986 Tanzania had to sign the Economic Recovery Programme (ERP) with theIMF. The election of the (in the IMF’s sense) more reform-friendly president AliHassan Mwinyi in 1985 helped to reach the agreement. The ERP and its follow-up, the ERPII: Economic and Social Action Programme (ERPII ESAP) in 1989,as well as the Tanzania Agricultural Adjustment Programme (TANAA) agreedwith the World Bank in 1990, and the Enhanced Structural Adjustment Facility(ESAF) agreed with the IMF in 1991, meant decisive further steps in the directionof economic liberalization.
By 1987, all weight restrictions on interregional food grain trade had beenabolished and legal private traders had started to compete with the NMC.Panterritorial pricing was abolished, and from the late 1980s onwards, primarysocieties and cooperative unions (created under the new Act of 1982) were allowedto sell directly to private traders. In 1990, individual farmers were also given thisoption, hence competition between the parastatal/cooperative system and theprivate sector had become fully legalized. To begin with, the role of the NMCwas reduced to a buyer of last resort and manager of the Strategic Grain Reserve(SGR). However, in 1990, the NMC was in practice abandoned, as the Govern-ment, through the Food Security Department in the Ministry of Agriculture, tookdirect control of the management of the SGR. The NMC ceased to buy cropsdirectly from the producers in 1991/92. The SGR is currently buying maize
9 ‘Getting the prices right’ is essential in the theory of technical change through ‘induced innovation’(e.g. Binswanger and Ruttan 1978). For critical discussion of this as well as static vs dynamicefficiency, see Bhaduri (1991) and Skarstein (2004).
JOAC5_3C104 5/16/05, 11:16 PM341

342 Rune Skarstein
both directly from producers and from private traders, who deliver the produceat its godowns (MAC/MDB 1995, 18–20). In 1986–87, 36 per cent of marketedmaize was still handled through the official market. In 1988–97, this share haddeclined to between 10 and 20 per cent, while private traders handled between80 and 90 per cent of all marketed maize (Temu and Ashimogo 1999, 142). In1994/95, the procurement and distribution of agricultural inputs were liberalized.Agricultural subsidies are seen by the World Bank to cause economic inefficiencies,and the Bank demanded that they should be abolished altogether. For example,as will be described in section 5.2, the subsidy on fertilizer was completelyremoved in 1994/95 (World Bank 1994, 85–92; Ponte 1999, 11, 14).
The transition from a single-tier to a multi-tier agricultural marketing systemhad been completed by 1990, when indicative prices for food crops were intro-duced. By 1992, the private sector had taken control of nearly the entire grainmarket (MAC/MDB 1995, 21–5). In sections 5.2 and 5.3, we will see that theimpact of these changes, including the withdrawal of input- and transport sub-sidies, was a sharp decline in the profitability of smallholder cultivation of maize,especially in the south-western part of the country. Maize production started toshift gradually back to the northern part of the country, where more fertile soilsallow cultivation with less dependence on chemical inputs and access to thenational markets is much easier. This, in turn, resulted in an agricultural depressionin the south-eastern highlands of Rukwa and Ruvuma.
In the view of the IMF and the World Bank, the rent-seeking character of thestate had become a major obstacle to economic development. The state thereforehad to be forced to withdraw in order to open up space for an entrepreneurialprivate sector starved of opportunities because of the all-embracing characterof the state. The government was further obliged to bring about balance in itsbudget which implied a dramatic reduction in its expenditures and less efforts tostrengthen its revenue side. At the same time, the credit system, foreign tradeand foreign exchange transactions were liberalized.
Finally, in 1995 Tanzania adopted a national land policy, which – despite thefact that all land should still be ‘vested in the President as trustee on behalf of allcitizens’ – opened the door ajar for commodification of land, through the state-ment that ‘Individuals should be allowed to obtain individual titles within an areanot designed for communal uses, land conservation and other specified village orcommunity projects’ (MLH 1995, 9, 21).
In 1992 – a year when production of the main food crops dropped by 3.3 percent and agricultural GDP rose by only 0.5 per cent (Delgado et al. 1999, 160) –the World Bank started to celebrate Tanzania’s economic liberalization by assertingthat ‘the economy is no longer in crisis’ (World Bank 1992, 1). And in 1995, theIMF stated that ‘With the support of the international community . . . theauthorities [of Tanzania] are transforming perhaps one of the most regulatedeconomies in Africa into one of the most liberalized. More could be done, but alot has been achieved’ (IMF 1995, 1). We will consider to what extent theseassertions can be defended by an actual upswing in Tanzanian agriculture in thewake of economic liberalization.
JOAC5_3C104 5/16/05, 11:16 PM342

Economic Liberalization and Smallholder Productivity in Tanzania 343
4. THE GROWTH PERFORMANCE OF TANZANIAN AGRICULTUREAFTER LIBERALIZATION
We have already referred to the optimistic predictions of the World Bank and theIMF: with economic liberalization, including ‘free prices’ and removal of inputand output subsidies, agricultural producers would respond to ‘price incentives’,and start to specialize, accumulate and innovate. And indeed, good agriculturalharvests – owing to good weather conditions – in 1987–89 allowed the IFIs, aswell as bilateral donors and the Tanzanian government, to proclaim that theirnew agricultural policy was a success, although maize production fell also inthat period compared to 1986. In the official rhetoric, the immediate positiveresponse of the agricultural producers was linked to the new marketing arrange-ments, especially for food crops, and the restored availability of incentive goods.However, from 1989 to 1994, production of the main food crop maize, as well asthe growth of agricultural GDP, suffered a serious setback (see Table 1).10
There are several, and partly conflicting, statistics on agricultural productionin Tanzania, issued by different government agencies. This has led to a discus-sion on which data source is the most reliable (for example, cf. Bhaduri et al.1993, 87–90; Ponte 1999, 15–21; Delgado et al. 1999, 99–106). It is beyond thescope of this paper to enter this discussion. Suffice it to say that the two mostimportant data sources are the Crop Monitoring and Early Warning Unit(CMEWU) and the Agricultural Statistical Unit (ASU), both within theMinistry of Agriculture and Cooperatives. The CMEWU figures are derived frompre-harvest forecasts, while the ASU figures are post-harvest estimates. On ayear-to-year basis, the difference between the series from these two sources hasbeen considerable for some years, but over the longer run they are almost equal.It should also be noted that until 1994 the two series relied on the same agricul-tural reporting system.11 However, I agree with Ponte, as well as Delgado et al.,that – since the mid-1990s – the data issued by ASU are the most reliable, and‘should be considered the “official” government estimates’ (Delgado et al. 1999,106). The statistics from ASU are therefore the basis of the production figures aswell as of the growth rates of agricultural GDP for the period 1986–98 presentedin Table 1.
As Table 1 shows, neither the average annual production of maize nor ricewas higher over the whole period 1986–98 than in the years 1986–89. Althoughpaddy production showed a clearly positive trend in the 1990s, it should be
10 As observed in footnote 1, maize is by far the most important staple food in Tanzania. In 1998,maize production was almost three times larger than the production of paddy measured in GDP-contribution. Maize accounted for 22.8 per cent of agricultural GDP, while paddy accounted for8 per cent, millet/sorghum contributed 4.6 per cent and wheat only 0.5 per cent (Delgado et al.1999, 145).11 I disagree with Ponte (1999, 18–19) when he, using data for 1986/87–1990/91, implies thatCMEWU has systematically overestimated production. As a matter of fact, the CMEWU data forthe period 1986–98 yields a trend growth rate for maize production of only 0.2 per cent per year,compared to 1.12 per cent per year derived from the ASU data (data in Delgado et al. 1999, 148 andTable 1 above).
JOAC5_3C104 5/16/05, 11:16 PM343

344 Rune Skarstein
noted that it was first of all marked by strong fluctuations mainly due to changesin rainfall and floods. For example, in 1985 it was only 276,000 tonnes, and thensoared by more the 50 per cent to 418,000 tonnes in the following year. In 1996,it reached 807,000 tonnes and then dropped by 32 per cent to 550,000 tonnesthe year afterwards (Delgado et al. 1999, 148). On the other hand, the growth ofproduction of the main food grain maize of only 1.12 per cent per year over theperiod 1985–98 was alarmingly low in view of a population growth of 3 per centper year in the same period according to FAO statistics (FAO 2000). In the years1993–95, the average annual maize production of 2,443,000 tonnes was only19.5 per cent higher than the estimated average production in the ‘crisis years’1983–86, of 1,945,000 tonnes, while population had grown by almost 30 percent between the two periods (Table 1 and Havnevik et al. 1988, 67).
In their report commissioned by the World Bank, Delgado et al. conclude:‘Overall agricultural performance in the post-reform period has been respectablebut not outstanding. We estimate that agricultural GDP grew 3.5 percent peryear over 1985–90 and 3.3 per cent over 1990–98, for an average rate of 3.3 percent over the entire period’ (Delgado et al. 1999, 134).12 In my assessment, thischaracterization is highly disputable. In their calculation of the growth rate ofagricultural GDP between 1985 and 1998, Delgado et al. use only two observa-tions. In their ‘base’ year 1985, agricultural GDP was exceptionally low (thereforethe increase from 1985 to 1986 was as much as 14.5 per cent), and in the end year1998 it was exceptionally high (with an increase from 1997 to 1998 of 15.3 percent) (Delgado et al. 1999, 160). This choice of endpoints gives an upward biasalso to the estimates for the sub-periods 1985–90 and 1990–98.
If, on the other hand, 1986 is chosen as ‘base year’, the average annual growthrate of agricultural GDP over the period 1986–98 turns out to be less than 2.5per cent per year. This demonstrates the arbitrariness of using only endpointswhen calculating growth rates. For this reason I have used all 14 observationsand estimated the annual trend growth rates of maize and paddy production andagricultural GDP from 1985 to 1998. As Table 1 shows, the trend growth rateof maize was only 1.1 per cent per year, while that of agricultural GDP was amodest 2.5 per cent per year, which means that in per capita terms, especiallymaize production, but also agricultural GDP declined considerably over theperiod, by 22.5 per cent and 5.5 per cent, respectively.13
It turns out that neither the growth rate of maize production nor the growthrate of the agricultural GDP was higher in the post-liberalization years than inthe ‘crisis years’ 1976–86 (Table 1). In other words, if ‘agricultural performancein the post-reform period has been respectable but not outstanding’, that charac-terization applies even better to the ‘crisis years’ 1976–86. This becomes evenclearer when we consider the development of agricultural productivity. Table 2below shows that labour productivity of maize production (measured in kgper economically active person in agriculture), as well as production per capita of
12 In June 2000, this report was published as a World Bank country study (World Bank 2000).13 The population growth rate over the period in question was 3.0 per cent per year (FAO 2000).
JOAC5_3C104 5/16/05, 11:16 PM344

Economic Liberalization and Smallholder Productivity in Tanzania 345
Table 2. Labour productivity and production per capita of maize and the five majorfood crops, 1976–98
Period Maize Five major food grains a
Labour Kg per capita Labour Kg per capitaproductivityb of total productivityb of total
population population
1976–79 203.9 91.6 343.2 154.21980–83 201.0 88.1 346.3 151.81984–86 218.9 95.6 372.2 162.5Growth 1976–86, % per year c +0.66 +0.25 +1.08 +0.66
1987–89 230.6 100.3 363.6 158.21990–92 198.7 85.8 313.6 135.41993–95 197.7 84.1 330.2 140.41996–98 200.3 83.8 320.7 134.1Growth 1985–98, % per year d −1.94 −2.35 −1.39 −1.80
a Maize, paddy, wheat, sorghum and millet, accounting for 71% of the value of totalstaple food consumption in 1976/77 and 55% of total food crops contribution to GDPin 1992 (Bryceson 1993, 219; Delgado et al. 1999, 145).b Production in kg per economically active person in agriculture.c Trend growth rate 1976–86 (fitting a least-squares linear regression trend line to thelogarithmic annual values of the variable), 11 observations.d Trend growth rate 1985–98, 14 observations.Sources of production figures: see Table 1.Source of population figures: FAO (2000).
the total population, was lower in all sub-periods of 1990–98 than in any of thesub-periods of 1976–86. Moreover, while the trend growth rates of these twoindicators were positive in the period 1976–86, 0.66 per cent and 0.25 per centper year, respectively, they were negative in the period 1986–98, by as much as−1.94 per cent and −2.35 per cent per year, respectively.
It may be argued that the productivity figures for maize could be misleadingbecause the crop composition of agricultural output may have changed aftereconomic liberalization. In Table 2, I have therefore also included figures for thefive major food grains which accounted for between 60 and 65 per cent of totalfood crop production in Tanzania in the last decades. But the picture remains thesame. In all sub-periods of 1990–98, labour productivity as well as productionper capita of the entire population was lower than in any of the sub-periods of1976–86. Moreover, for the five major food grains, the trend growth rate oflabour productivity was 1.08 per cent per year in the period 1976–86, but nega-tive, −1.39 per cent per year, in 1986–98. The trend growth rate of productionper capita of the total population was also negative in the latter period, −1.80 percent per year, as against +0.66 per cent per year in the period 1976–86 (Table 2).
JOAC5_3C104 5/16/05, 11:16 PM345

346 Rune Skarstein
Moreover, the decline in labour productivity for the five major food grains,as I have measured it in Table 2, cannot be entirely explained by a change in thecomposition of total food output. In 1985/86–87/88, the major five food grainsaccounted for an average of 61.4 per cent of the total tonnage of crops, whileother food crops (cassava, sweet potatoes and pulses) accounted for 33.9 percent, and export crops (tobacco, cotton, cashew and pyrethrum) 4.7 per cent.In 1995/96–97/98, the major five food grains accounted for 59.7 per cent, otherfood crops 35.2 per cent and export crops 5.1 per cent.14 Almost the wholechange in the composition of food crops was due to a strong rise of 83 per centin the production of sweet potatoes, from an annual average of 279,000 tonnes in1985/86–87/88 to 511.000 in 1996/97–97/98 (while the rest of the difference wasmade up by cassava). But this change may well be due to underreporting ofsweet potatoes as well as cassava in the former period. The conclusion is that interms of food grain production and productivity, the performance of Tanzanianagriculture has declined considerably after economic liberalization, and in all years1990–98 it was poorer than even in the ‘crisis years’ 1980–83.
An important aspect of technical progress in agriculture is improved or moreintensive use of land which leads to increased yields, i.e. increased productionper hectare of cropped area. However, an increase in land productivity will havea positive impact on labour productivity only to the extent that it is not neutral-ized or even outweighed by a declining land/labour ratio. A rise in land produc-tivity may be caused by increasing land shortage and a corresponding decline ofthe land/labour ratio, which compels the producers on small holdings to inten-sify cultivation, while their labour productivity falls. This is the central themeof the debate on the ‘inverse relationship’ between size of holdings and landproductivity (Boserup 1965; Bharadwaj 1974; Dyer 1991, 1998).
From Table 3, which shows estimated maize and wheat yields for the period1986–98, it appears that the trend of land productivity (yields) for maize is muchthe same as the trend of labour productivity shown in Table 2. Table 3 alsoshows that the average maize yield (ASU figures) was lower than in 1986–87in all subsequent periods except 1996–97. A comparison of the figures in Tables2 and 3 leads us to the conclusion that the declining labour productivity – at leastfor the major food crop maize – in Tanzanian agriculture is the combined resultof a declining land/labour ratio and declining land productivity.15 One probablereason for this development may be that owing to high population growth inrural areas, smallholders have been forced to cultivate increasingly less fertileland, while lacking the means to improve yields on those lands. However, thedecline of wheat yields (on parastatal NAFCO farms), which is also shown inTable 3, cannot be given such an explanation.14 Calculated from data in United Republic of Tanzania/MAC, Basic Data – Agriculture and LivestockSector, editions from 1990 and 2000. For lack of data, I have not included (cooking) bananas in otherfood crops, while tea has been excluded from export crops because it is a typical estate crop.15 Average labour productivity in agriculture can be expressed by the identity (Y/L) ≡ (Y/A) ⋅ (A/L),where Y is agricultural production, L is labour and A is cultivated area. Thus, a falling land/labourratio, A/L, will reinforce the fall in labour productivity, Y/L, caused by declining land productivity(yields), Y/A.
JOAC5_3C104 5/16/05, 11:16 PM346

Economic Liberalization and Smallholder Productivity in Tanzania 347
Table 3. Maize and wheat yields, 1986–98
Year(s)Crop area
Yields, kg per hectare
’000 hectares Maize Wheat
Maize Wheat ASU data CMEWU NAFCO(NAFCO) data data
1986–87 1530.2 24.2 1603.2 1496.1 1505.01988–89 1671.9 25.3 1480.8 1634.9 1830.01990–91 1739.9 26.4 1313.2 1380.3 1540.01992–93 1728.5 26.0 1312.5 1317.3 1500.01994–95 1687.8 26.3 1493.8 1396.7 983.21996–97 1650.7 26.4 1624.8 1400.1 1268.11998 2088.0 na 1285.9 1285.9 naGrowth, 1986–98, % per year a +1.01 +0.79 −0.31 −1.24 −4.14
a Trend growth rate (fitting a least-squares linear regression trend line to thelogarithmic annual values of the variable). For maize, 13 observations (1985/86–1997/98). For wheat, 12 observations (1985/86–1996/97). In the table, 1986–1987 refers to thecrop years 1985/86 and 1986/87, and so on.Estimates of cropped area for maize, which have been made by the Crop Monitoring andEarly Warning Unit within the Ministry of Agriculture, are probably rather inaccuratefor single years, but more reliable in showing trend over time. Source of crop areafigures for maize: United Republic of Tanzania/MAC (1992, 33; 1998, 16; 2000, 14).Source of production figures for maize, see Table 1.Source of cultivated area and yields for wheat (both for NAFCO farms): Kapunda(1998, Appendix B).
16 For a survey of the literature on this issue, see for example, Hella and Kamuzora (1999).
5. POSSIBLE CAUSES
5.1. Did Changing Rainfall Play a Role?
In Tanzania, only 6 per cent of the crop-growing holdings use irrigation, and only2 per cent of total planted area is under irrigation. Rivers are the most commonsource of irrigation, leading the water to the fields through furrows, practisedmainly in Kilimanjaro, Arusha, Mbeya and Tanga. Much of the irrigated landarea belongs to large-scale farms (United Republic of Tanzania/MAC 1999, 18;United Republic of Tanzania/MAC 2000, 44; United Republic of Tanzania 2001,4). In other words, almost all smallholder agriculture is rain-fed. Therefore, it isno surprise that several studies suggest that changing weather conditions are themajor cause of short-term fluctuations in agricultural output.16
We have already noted that a bad maize harvest in parts of Tanzania in 1979 wascaused by poor weather, while drought in large areas in the crop year 1981/82
JOAC5_3C104 5/16/05, 11:16 PM347
348 Rune Skarstein
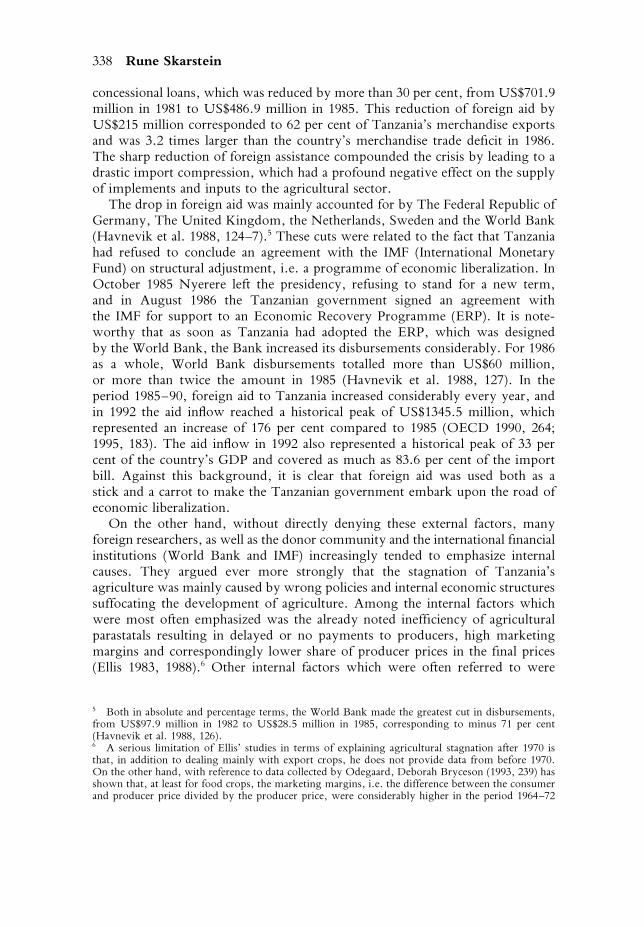
Table 4. Rainfall: Annual averages in millimetres and coefficients of variation (CV)
Name of station 1976–1986 1987–1998 1964–2000(region)
Mean CVa Mean CVa Mean CVa
Amani (Tanga) 1914.0 0.185 1789.6 0.229 1839.5 0.216Arusha 928.8 0.361 809.7 0.280 839.5 0.343Bukoba (Kagera) 2096.5 0.082 1972.5 0.112 2054.3 0.119Dodoma 547.9 0.171 603.2 0.218 568.3 0.216Kigoma 1039.6 0.138 919.6 0.138 975.3 0.184Mbeya 926.5 0.184 945.3 0.239 964.3 0.237Moshi (Kilimanjaro) 985.0 0.223 866.9 0.299 877.3 0.290Mtwara 1105.2 0.129 1034.0 0.274 1083.7 0.210Mwanza 1000.5 0.170 1151.3 0.198 1082.8 0.200Songea (Ruvuma) 1156.2 0.181 988.7 0.236 1113.2 0.210Tabora 958.2 0.202 851.5 0.323 917.1 0.243Total averagesb 1150.8 0.393 1084.8 0.386 1119.6 0.391
a Standard deviation divided by annual mean in the period.b Average of regional means and CV of regional means in each period.Source of data: Directorate of Meteorology, Ministry of Communications andTransport, Dar es Salaam. I am indebted to Dennis Rweyemamu at The Economic andSocial Research Foundation (ESRF), Dar es Salaam, for providing the data, as well as toProfessor Ashok Parikh at the University of East Anglia for having carried out thestatistical computations underlying this table.
followed by floods in parts of the country in the following year were reported tohave resulted in bad harvests. Also after economic liberalization, low agriculturalproduction in some years has been caused by bad weather. In the years 1992–93,drought and uneven rains in large parts of the country were probably an impor-tant cause of exceptionally low maize yields, down to an average of 1177 kg perha in 1992. However, such short-term variations do not indicate longer-term trendsover time. The question therefore remains, whether a declining trend of rainfallover time may have led to the fall in the growth rate of maize production from theperiod 1976–86 to 1986–98 (Table 1). In other words, may a long-term trend inrainfall explain why labour productivity in the production of maize as well as thefive major food grains rose modestly in the former period but declined consider-ably in the latter period (Table 2), and that maize yields declined over the entireperiod 1986–98 (Table 3).
Table 4 shows rainfall data from stations in eleven regions, covering theperiods 1976–86 (before liberalization), 1987–98 (liberalization period), as well asthe whole period from 1964 (when the Tanzanian Union was established) until2000. It appears from the table that average rainfall declined at eight of the elevenstations from 1976–86 to 1987–98. But only in Moshi was the change in rainfallbetween the two periods statistically significant at a 5 per cent level. Also the
JOAC5_3C104 5/16/05, 11:16 PM348

Economic Liberalization and Smallholder Productivity in Tanzania 349
Table 5. Rainfall trends over timea
Name of station (region) 1976–1986 1987–1998 1964–2000
Amani (Tanga) − + −Arusha − + −Bukoba (Kagera) + + − (8.85)Dodoma + − +Kigoma + + (15.04) −Mbeya + + −Moshi (Kilimanjaro) + + +Mtwara + (4.26) − −Mwanza − (24.93) − −Songea (Ruvuma) + + −Tabora + − − (6.98)
a Rainfall trends over time were estimated using ordinary least square (OLS) on thetime variable (year). Plus sign (+) means positive trend, minus sign (−) means negativetrend over the period in question. For trends that are statistically significant at a 5%level, the time coefficients (mm per year) are reported in parentheses. All the othertrends are statistically insignificant.I am indebted to Professor Ashok Parikh for having carried out the computations forthis table.
annual average of all the eleven stations declined slightly, by 66 mm or 5.7 percent, from 1976–86 to 1987–98. Table 4 shows that the annual average for thesub-period 1976–86 is above the average for the long period 1964–2000, whilethe average for 1987–1998 is slightly (3 per cent) below the long-period average.With regard to variability over time, Table 4 shows that for ten of the elevenstations, the coefficient of variation (CV) in the period 1987–98 is higher thanor equal to that of the preceding period. The exception is Arusha, where the CVdeclined significantly from 1976–86 to 1987–98. Finally, Table 4 shows thatthe CV between the stations was slightly higher in the former than in the latterperiod, which indicates that rainfall in Tanzania did not become more regionallyuneven from 1976–86 to 1987–98.
With regard to trend over time, a study covering the period 1960–96, basedon data from two meteorological stations in Morogoro and sixteen other stationsrandomly selected from all over the country (fifteen regions), found no signifi-cant change in rainfall either over time or between the regions. Also the numberof raindays in each year showed no trend over time (Hella and Kamuzora 1999).This finding is broadly confirmed by our own analysis (Table 5). For the period1976–86, a trend was statistically significant only for two regions, with positivetrend for Mtwara and negative trend for Mwanza. For the period 1987–98, therewas only one significant (positive) trend, for Kigoma.
The significant trends turn out to be rather unimportant, with low coefficients,except for the negative trend at the Mwanza station in 1976–86 (−24.93 mm per
JOAC5_3C104 5/16/05, 11:16 PM349

350 Rune Skarstein
year), and the positive trend for the Kigoma station in 1987–98 (+15.04 mm peryear). Only at the Mwanza station does there seem to have been a rather persist-ent decline in rainfall, since the trend is negative in both sub-periods 1976–86(significant) and 1987–98, as well as over the entire period 1964–2000. Finally, itmay be observed that more than half of the stations have positive trends in bothsub-periods, viz. eight in 1976–86 and seven in 1987–98.
The general conclusion from Tables 4 and 5 is that – with the possible excep-tion of the Mwanza station – there have been no noteworthy changes of rainfalleither over time or with respect to regional pattern. Therefore, we cannot expectrainfall to have caused the change in agricultural productivity from 1976–86 to1987–98. However, it is a bit surprising that regional data on maize yields for theyears 1985–89 (for which such data are available) showed no significant relationto rainfall in the corresponding regions and years.17
There are several possible reasons for these results. First, the rainfall datafrom the regional stations may not be representative for the regions as a whole.Second, the regional yield data may be erroneous.18 However, notwithstandingthese possible errors, the above results do not exclude the possibility that poorrainfall in combination with other inputs, in particular fertilizer use, may have hada negative impact on yields in the period 1985–98. Unfortunately, data on ferti-lizer use to control for this possibility are not available, but an experimentcarried out in Ikuwala and Llambiole districts in Iringa Region, 1995–98, mayillustrate the point.
That experiment showed that change of rainfall from about 500 to about1000 mm per year had no noteworthy effect on maize yields at a low useof fertilizer. For example, at Ikuwala, a use of nitrogen fertilizer of 40 kg perhectare resulted in about 2500 kg maize per ha at any rainfall between 600and 1000 mm per year. With soil and water conservation practices but no use offertilizer, the maize yield was 1800–2000 kg per ha at amounts of rainfall varyingfrom 600 to about 1000 mm per year (MacDonagh et al. 1999, esp. Figure 4a). Inother words, at a low use of fertilizer there seems to be hardly any substitutability,but only complementarity between fertilizer use and rainfall.
On the other hand, the Ikuwala experiment showed that the effect of anincrease in fertilizer use was quite significant at rainfalls between about 600 and1000 mm per year. An increase in nitrogen fertilizer use from 40 to 140 kg per haraised the maize yield from about 2500 to almost 4000 kg per ha (approximately50 per cent increase) at a rainfall of about 600 mm per year, and from about 2500to more than 5000 kg per ha (approximately 100 per cent increase) at a rainfall of
17 I am indebted to Professor Ashok Parikh for having carried out the statistical computations.Another study (Bilame 1996) gave a similar result, finding that good weather had a negative butentirely unimportant effect on total maize production in the period 1970/71–1983/84, but a smallpositive effect in the years 1984/85–1994/95 (Bilame 1996, 47ff.).18 The regional yield data have been collected by CMEWU within the Ministry of Agriculture andCooperatives on the basis of pre-harvest forecasts. As argued in section 4, these figures are assumedto be rather inaccurate, especially in the short run. (Source of data: United Republic of Tanzania/MAC, Basic Data – Agriculture and Livestock Sector, several editions.)
JOAC5_3C104 5/16/05, 11:16 PM350

Economic Liberalization and Smallholder Productivity in Tanzania 351
about 1000 mm per year (MacDonagh et al. 1999, Fig. 4a). Below an annualrainfall of 500 mm, the yield effect of increased fertilizer use became rapidlysmaller with less rainfall. This means that smallholders in marginal (semi-arid)areas are exposed to the risk that there may be little or no yield effect of fertilizeruse due to failing rains. Conversely, at rainfalls well above 500 mm per year, theeffect of a change in rainfall appears to be considerable only at fertilizer use thatis far above the levels in Tanzania after 1990.
5.2. Did Removal of Fertilizer Subsidy Play a Role?
In Tanzania, chemical fertilizer is used mostly in the growing of maize, tobacco,coffee and cotton, with more than 70 per cent of total fertilizer consumptionused on maize in 1994/95 (Hawassi et al. 1999, 76). The proportion of agricul-tural holdings using fertilizer reached a historical peak of 27 per cent in 1991/92,declining to approximately 15 per cent in 1994/95, and only about 10.5 per centin 1997/98. In the early 1990s, the average use was estimated at somewhat morethan 20 kg per ha of planted area (World Bank 1994, 77–8; 2000, 39; MAC/NBS2000, 21, 73). Only four regions – Ruvuma, Iringa, Mbeya and Tabora –accounted for more than half of total fertilizer use in Tanzania in 1997/98 (MAC/NBS 2000, 21, 74).
Fertilizer consumption has experienced two growth periods since the early1980s. From a low of about 80,000 tonnes in 1981/82, it increased every year to140,000 tonnes in 1986/87. In 1987/88 it dropped to less than 120,000 tonnes dueto insufficient supply, and then rose in the subsequent years to about 150,000tonnes in 1986/87 and further to almost 200,000 tonnes in 1994/95. There canbe little doubt that an important reason for this development was the heavysubsidy. In the period from 1976 to 1984, the subsidy reduced the final price byabout 50 per cent. After 1984, the World Bank has estimated that there was animplicit subsidy reaching almost 80 per cent of the final price in 1988/89 (WorldBank 1994, 79–80; Hawassi et al. 1999, 73).
As part of the structural adjustment programme, the government startedto phase out the subsidy in 1990/91 (70 per cent), reducing it to 55 per cent in1991/92, 40 per cent in 1992/93, 25 per cent in 1993/94, and zero in 1994/95and onwards (World Bank 1994, 79–80). Panterritorial input and output pricesas well as the fertilizer subsidy were removed on advice from the World Bank andthe IMF. The Bank’s main argument for abolishing the subsidy was: ‘Govern-ment interference in the fertilizer market constrains supply by both parastataland private sector suppliers’ (World Bank 1994, 91, my italics). In view of thisargument it is ironical that fertilizer use fell steeply after removal of the subsidy,to only 63,000 tonnes in 1998/99, which was lower than in any year since 1973,‘mostly because of decreased use on maize’ (World Bank 2000, 42; also MAC2000, 153).
That a high price is an important cause for decreasing fertilizer use was clearlyindicated by the Integrated Agricultural Survey 1997/98 (MAC/NBS 2000, 73)which reported that 89.5 per cent of all agricultural holdings in Mainland Tanzania
JOAC5_3C104 5/16/05, 11:16 PM351

352 Rune Skarstein
Table 6. Percentage share of holdings reporting reasons for not using fertilizer, 1997/98
Too expensive Not available Other reasons, incl. lack of credit
Mbeya Region 52.2 12.0 35.8Iringa Region 66.6 7.7 25.7Rukwa Region 48.2 28.2 23.6Ruvuma Region 67.4 15.1 17.5Tabora Region 41.1 36.6 22.3National average 39.1 35.9 25.0
Source: Estimated from data in MAC/NBS (2000, 73).
did not use fertilizer. Among these holdings, 75 per cent responded that thereason was either ‘too expensive’ fertilizer (39.1 per cent), or that fertilizer was‘not available’ (35.9 per cent) (Table 6). The survey showed interesting differencesbetween regions which deserve some further discussion.
The Southern Highlands (Iringa, Mbeya, Rukwa and Ruvuma regions)account for the major share of fertilizer use in Tanzania. This pattern of regionaldistribution of fertilizer use began to develop in the late 1970s. The combinationof stable rainfall and altitudes above 1500 metres made the Southern Highlandssuitable for hybrid maize, and within a decade a green revolution took placein these regions (Rasmussen 1986). The result was a steep increase of maizeproduction in the Southern Highlands, while production stagnated or declined inthe rest of the country. That the Southern Highlands became the ‘granary ofTanzania’ is indicated by the fact that the NMC’s purchases of maize from theseregions as a share of its total purchases rose from an average of 33 per cent in1974/75–75/76, to 86 per cent in 1982/83–83/84 (Rasmussen 1986, 202; Bryceson1993, 233–4).
When panterritorial pricing was the practice and subsidies were applied, TheSouthern Highlands consumed more than 50 per cent of all fertilizer in Tanzania.With the abandoning of these practices, the pattern of fertilizer consumptionchanged dramatically. The cooperatives had no longer any responsibility to sup-ply remote areas with fertilizer and give credit for such deliveries, while privatetraders found it too costly to transport fertilizer to those areas. Moreover, theprice of fertilizer in the more remote areas became so high that it was no longerprofitable to use it in maize production. For example, in 1998/99, the price ofammonia sulphate in Kilimanjaro was up to 12 per cent higher, while the priceof triple superphosphate was 65 per cent higher than in Tanga Region, althoughKilimanjaro cannot be considered a remote area. This is probably the reasonwhy, especially in the remote typical maize-producing areas, a higher proportionof holdings than the national average report ‘too expensive’ as reason for notusing fertilizer (see Table 6).
Table 6 shows that the highest shares of holdings reporting ‘too expensive’ arein regions where maize is the dominant crop, viz. Mbeya, Iringa and Ruvuma. It
JOAC5_3C104 5/16/05, 11:16 PM352

Economic Liberalization and Smallholder Productivity in Tanzania 353
is noteworthy that Ruvuma, which has been most specialized in maize produc-tion, had the highest share of 67.4 per cent. On the other hand, Rukwa, whereboth maize and tobacco are important, had a lower share of holdings reporting‘too expensive’, while Tabora, where tobacco growing is dominant, had thelowest share of the regions in the table, at about the national average. That highprice was the main reason for reduced or no use of fertilizer was confirmed by acomprehensive field study in Mbinga district in south-western Ruvuma, com-prising 150 smallholders randomly selected in fifteen villages. According to thatstudy, 87 per cent of the sampled farmers indicated high prices after subsidyremoval as the main reason for applying fertilizer below the recommended rates.In the study area, the average intensity of fertilizer application in the growingof maize was reduced from 74.96 kg nitrogen per ha in 1992 to 59.94 kg perha in 1996 (Hawassi et al. 1999, 77–9). In a field study in Songea, Stefano Ponteobserved a similar trend: average fertilizer use per acre in maize productiondeclined from 61 kg in 1986/87 to 44 kg in 1994/95 (Ponte 2002, 89).
Regional data on fertilizer consumption indicate that the intensity of use hascontinued to fall after 1996. Iringa and Ruvuma regions, which consumedalmost 65,000 tonnes of fertilizer in 1990/91, used a mere 20,000 tonnes in 1998/99. By contrast, Tabora’s fertilizer consumption rose from less than 18,000 tonnesin 1990/91 to 31,000 tonnes in 1998/99 (MAC 2000, 153). In other words, whiletotal fertilizer consumption in Tanzania has declined dramatically since the mid-1990s, there has also been a sharp change away from typical maize-growingregions to typical tobacco-growing areas, which implies a change in fertilizeruse away from maize, especially in the Southern Highlands, and towards usein tobacco growing.
The World Bank claims, without referring to any evidence, that the fall infertilizer consumption has not affected maize production negatively: ‘the impacton production of fertilizer-using crops has been negligible, suggesting eitherinadequate application or wastage in use’ (World Bank 2001, 53). This claimis not supported by available evidence. In particular, Bilame’s study showed asignificant and considerable negative correlation between the price of fertilizerand maize output in the period 1984/85–1994/95 (Bilame 1996).
Accordingly, there is reason to expect that the sharply reduced use of fertilizerin the growing of maize has already had a negative impact on overall maizeyields in Tanzania (Table 3), which signals the decline of the Southern Highlandsas the ‘granary of Tanzania’.19 This process is reinforced by the fact that privatetraders, due to high transport costs, do not find it profitable to collect maize inremote areas, especially in Mbeya, Rukwa and Ruvuma. Therefore, the WorldBank’s finding is not surprising: ‘The regional composition of maize productionshows that between 1987–89 and 1996–98 maize output has declined by 13–19
19 Against this background, it is not surprising that the Tanzanian government, against the adviceof the IMF and the World Bank, reintroduced transport subsidy on fertilizer (of TShs 2 billion) toRuvuma, Mbeya, Iringa and Rukwa regions in its budget for 2003/04 (paragraphs 70 –72 in theBudget Speech by the Minister of Agriculture for the Fiscal Year 2004/2005, in Swahili).
JOAC5_3C104 5/16/05, 11:16 PM353

354 Rune Skarstein
per cent in the three more remote regions of the southern highlands (Mbeya,Ruvuma, and Rukwa), while expanding in Iringa, Dodoma and other regionscloser to Dar’ (World Bank 2000, 53).
The Bank’s finding is consistent with the field study from Mbinga district,which provides ample evidence that complete removal of the fertilizer subsidyhad significantly reduced maize yields and output in the study area (Hawassiet al. 1999, 72, 80–1). Also the general trend in maize yields and production inTanzania suggests that the rise of fertilizer prices and the dramatic fall in fertilizeruse has had a negative impact which may be reinforced in the coming years assoil nutrients are being gradually depleted.
On the other hand, we may assume that marketed output of a crop dependsnot only on the fertilizer price, but rather on the ratio between the producerprice of the relevant crop and the fertilizer price. In Table 7, the development ofthis ratio from 1985 to 1998 is shown for the four most important food cropsin Tanzania.
Table 7 shows that the ratio of crop producer price to farmgate fertilizer pricehas declined by between 74 per cent for maize and 47 per cent for wheat from1985–89 to 1998. According to estimates made for the World Bank, the declinein the ratio of producer maize prices to inputs prices (seed, fertilizer, pesticides)led to a reduction of the real return per ‘man-day’ of maize production from 2496TShs at 1998/99 prices in 1992 to 501 TShs in 1998, in other words an 80 percent reduction (Delgado et al. 1999, 95).20 The field study in Mbinga districtin Ruvuma in 1996 found that it was not profitable to use any fertilizer at thecurrent fertilizer and maize prices, given the responsiveness of maize yieldto fertilizer input (Hawassi et al. 1999, 82). However, the declining ratio ofproducer price to fertilizer price was not only due to rising fertilizer price, butalso a relative stagnation in the producer prices for maize (as well as for otherfood crops).
Table 7. Ratios of average crop producer prices to farmgate fertilizer prices 1985–98
1985–89 1990–94 1995–98 1998 % change from1985–89 to 1998
Maize 1.40 0.83 0.37 0.36 −74.3Paddy 2.23 1.39 0.56 0.60 −73.1Wheat 1.58 1.87 0.92 0.84 −46.8Millet/sorghum 1.05 1.15 0.85 0.54 −48.6
Source: World Bank (2000, 46).
20 In a note to the table from which these figures are drawn, is the following clarification: ‘Assump-tions are: hand-hoe technology, involving 123 man-days of family labour, with a yield of 1500 kg/ha. . .’. It is well known that almost all hand-hoe work in Tanzanian agriculture is done by women.Therefore, ‘person-days’, or even ‘woman-days’, would be more appropriate terms than ‘man-days’.
JOAC5_3C104 5/16/05, 11:16 PM354

Economic Liberalization and Smallholder Productivity in Tanzania 355
Table 8. Real producer prices for main food crops, 1981–99. TShs per kg at 1998/99pricesa
Year Maize Paddy Wheat Millet Beans
1981–85b 140 232 195 117 3341986–90b 149 250 170 109 3691990/91 106 212 473 279 4711991/92 279 370 495 289 5081992/93 298 491 525 365 5331993/94 256 424 497 376 7121994/95 181 254 452 484 7971995/96 165 216 423 538 5711996/97 138 245 362 245 4751997/98 117 195 272 175 4311998/99 118 151 228 175 317
a Nominal prices deflated to constant 1998/99 prices using the National Consumer PriceIndex.b Official procurement prices (before deregulation of prices in July 1990).Reference is to fiscal years (1 July to 30 June) which largely coincide with crop years.Source: World Bank (2000, 26).
5.3. The Role of Deregulated Producer Prices
A main argument for economic liberalization was that deregulation of pricesand free competition in the marketing of inputs as well as crops would result in‘correct’ input prices, but also higher and ‘correct’ producer prices, which wouldin turn spur producers to increase efficiency, produce more and make invest-ments to raise land and labour productivity. Table 8 shows the development ofreal producer prices from 1981 to 1999.
For all crops reported in Table 8, there was a rise of the producer price inthe early 1990s, which peaked around 1993–94. But since the mid-1990s, the realproducer prices of all crops have declined. It is noteworthy that the by far mostimportant staple crops maize and rice have experienced the largest decline inproducer prices compared to the 1980s.
With regard to depressing marketed production, the short- to medium-termfluctuations of producer prices in a deregulated market are most probably at leastas important as the long-term trend. In Tanzania, as in other sub-Saharan coun-tries, the market demand for staple grains, in this case maize, is highly inelastic,with an (absolute) value of price elasticity considerably lower than unity. As aconsequence, without intervention in the market, rather modest changes in sup-ply lead to quite large price changes.21 Before the deregulation of prices in 1990,
21 The first to spell this out clearly was, as far as I know, Michal Kalecki in his article on ‘Costs andprices’ (1943), where he distinguished between cost-determined prices in industry and demand/supply-determined prices in primary production (Kalecki 1971, 43–61).
JOAC5_3C104 5/16/05, 11:16 PM355

356 Rune Skarstein
such variations were modified through the government’s price setting. The agri-cultural producers were informed at planting time on the procurement prices forthe next harvest. There could be considerable price changes from one year to thenext, but there was no uncertainty among smallholders about the producer pricesof the next harvest.
This may explain Bilame’s finding that before liberalization there was a posi-tive correlation between the real producer price and maize production, while thiscorrelation was found to be negative in the liberalization period (Bilame 1996).After liberalization, high price reflects a situation of deficient supply, while thelow price reflects a bumper harvest. Such price variations will, in turn, affect theproduction plans of surplus-producing smallholders. When prices are low in oneharvesting season, smallholders tend to make plans for lower marketed outputof the crop in question in the next season, and vice versa. This is supported byBilame’s finding of a negative correlation between maize production in one yearand production in the preceding year. Thus, in a deregulated agrarian economy,also the behaviour of producers will tend to reinforce the volatility of prices. Inthe absence of price stabilization measures, strong price volatility and stagnationof marketed output will therefore be a basic feature of the Tanzanian maizemarket, as well as of other deregulated sub-Saharan markets for food grains.
Before deregulation there was no change of producer prices during a part-icular crop year, implying that the smallholders would not make losses by sellingtheir crops immediately after harvest. By contrast, after deregulation, producerprices have shown a considerable seasonal variability, being lowest just after themain harvest (masika season) and highest before the next main harvest. As canbe seen in Table 9, in the years 1994–98, the highest monthly producer price of
Table 9. Highest and lowest monthly producer and consumer prices of maize
Year Producer prices (TShs per kg) Consumer prices (TShs per tin)a
Highest Lowest H:L Highest Lowest H:Lprice (H) price (L) price (H) price (L)
1992 58.30 44.91 1.30 1195.1 945.2 1.261993 66.01 39.98 1.65 1354.1 794.3 1.701994 128.95 49.90 2.58 1458.2 1104.5 1.321995 71.50 49.12 1.46 1695.2 1144.5 1.481996 101.76 54.11 1.88 2159.0 1259.5 1.711997 120.77 84.96 1.42 2531.3 1795.1 1.411998 116.70 61.04 1.91 2924.4 1471.4 1.99Average 1994–98 107.94 59.83 1.80 2153.6 1355.0 1.59
a One tin is approximately 20 kg.Source of producer prices: United Republic of Tanzania/MAC (2000, 39).I am indebted to Dennis Rweyemamu at The Economic and Social ResearchFoundation (ESRF) for having compiled for me the data on consumer prices from thefiles at the Marketing Development Bureau (MDB).
JOAC5_3C104 5/16/05, 11:16 PM356

Economic Liberalization and Smallholder Productivity in Tanzania 357
maize was on average 1.8 times higher than the lowest producer price in thesame year. The seasonal pattern of consumer prices is much the same, with thenotable exception of the year 1994.22 This is well in accordance with experiencefrom other sub-Saharan countries, where producer prices have been deregulated.For example, in Zambia and Malawi the producer prices before a new harvest aregenerally about twice as high or more than towards the end of the precedingharvest (Øygard et al. 2003).23
The low price elasticity of maize is the major cause of seasonal price vari-ability. However, in a deregulated market, the price variability is reinforced byspeculative behaviour among traders, as well as consumers. A rising price, whichmay be triggered by a bad harvest, will result in increased revenue both to eachindividual trader and the traders as a whole. Traders will therefore tend to with-hold grain from the market, i.e. postpone sales, when the price is rising. On theother hand, relatively wealthy consumers will tend to hoard staple grain in sucha situation, if they have the facilities to do so. The combined effect of these twobehaviours is a continued and reinforced price rise. Conversely, a declining price,which may be caused by a bumper harvest, will make traders reluctant to buycrops from the smallholders in expectation of even lower producer price, whileselling out their stocks in order to avoid losses. In such a situation, consumerswill postpone purchases as much as possible. Both behaviours will result in acontinued and reinforced fall of the price.
The seasonal price variability is reinforced by ‘forced commerce’ (e.g. Bhaduri1986). For lack of money as well as storing facilities – in other words because oftheir poverty – many smallholders, among them a large number of deficit pro-ducers, sell so much of their crop (at low prices) at harvesting time that they donot have enough food grain until the next harvest. Later on they therefore have tobuy food grain (at high prices) – often with expensive credit – in order to survive.24
Forced commerce implies a serious income loss to the smallholders and a corre-sponding income gain to private traders. Government control of producer prices
22 A main reason for the discrepancy in 1994 may be that domestic production covered only 71 percent of domestic demand in 1993/94, implying a gap of about 750,000 tonnes, or 39 per cent ofdomestic demand. Also in 1996/97, domestic demand exceeded production by 350,000 tonnes(Kapunda 1998, 52). It is unclear to me how and to what extent especially the gap in 1993/94 wascovered. According to the MDB, only 61,150 tonnes of maize were imported in 1994 (MAC/MDB1995, 30). On the other hand, The Strategic Grain Reserve reduced its stocks (which mainly includemaize) by only 57,000 tonnes from 1993/94 to 1994/95 (MAC 2000, 128). Probably, a considerableshare of maize imports in 1994 was in the form of flour and therefore categorized as food in the dataon imports. From 1992 to 1994, food imports rose by 61.9 per cent at constant 1994 prices (deflatedby the food component of the NCPI). As a consequence, food imports as a share of total importsrose from 3.3 per cent in 1992, to 6.2 per cent in 1993, and 8.5 per cent in 1994. From 1994 to 1995,food imports at constant prices declined by 69 per cent, reducing the share of food in total imports to2.9 per cent (Central Bank of Tanzania 1998, 64, 76). In any event, large imports of maize or maizeflour will affect domestic consumer prices strongly.23 On the other hand, I miss evidence for Colliers and Gunning’s claim that ‘The coefficient ofvariation of Tanzanian maize prices in regional centers doubled between 1964 and 1980, and sharplydeclined again once the market was liberalized’ (1999, 97).24 This is not at all a question of market efficiency, but a question of how a market necessarily workswithin a particular structure of production.
JOAC5_3C104 5/16/05, 11:16 PM357

358 Rune Skarstein
and public buffer stocks (buying above market prices at harvest time, selling belowmarket prices in the months before next harvest) have so far proved to be themost effective means to alleviate this problem (e.g. Gabre-Madhin et al. 2003).
However, so far there is no public storage system in Tanzania that can workas an effective buffer stock, and seasonal storage is largely left to the smallholdersthemselves. In 1997/98, about 60 per cent of all agricultural holdings reportedstorage of maize. Among those holdings which did store maize, 68 per centreported that the duration of storage was less than six months and 44 per centreported that the storage was in sacks at home (MAC/NBS 2000, 51, 75–6). Theirlack of adequate storage facilities forces the smallholders to sell the surplus oftheir crop at harvest time, when prices are at their lowest. Moreover, the privatestorages that do exist imply considerable losses, because much of the crops whichare stored on the holdings is eaten by rats or destroyed in other ways.
6. CONCLUDING REMARKS
The advocates of economic liberalization – in particular, the IMF and the WorldBank, but also bilateral donors – promised that economic liberalization wouldprovide a strong stimulus to Tanzanian agriculture, resulting in increasing yields,increased labour productivity, rising agricultural production and higher incomes.Available data show that, as far as food crop production is concerned, this pro-mise has not been fulfilled. Even compared to the ‘crisis years’ 1979–84, labourproductivity, yields and production per capita of food grains have stagnated ordeclined.25
The experience of liberalizing Tanzanian agriculture should indicate that in-troducing ‘free markets’ and ‘getting the prices right’ is not at all the right meansfor triggering transformation and growth in a predominantly pre-capitalistagriculture which is not even surrounded by a developed capitalist environment.Economic liberalization has not spurred Tanzanian smallholders to specialize,improve technology and increase land and labour productivity. By contrast, severalstudies have shown that, instead of fostering specialization, economic liberaliza-tion has increasingly forced the smallholders to seek income diversificationoutside their holdings in order to reduce risk and secure their livelihood, while atthe same time leading to ‘subsistence fallback’ (e.g. Seppälä 1998; Havnevik andHårsmar 1999; Bryceson 1999; Ponte 2002, 133–58).
The phenomena of ‘subsistence fallback’ and ‘income diversification’ are twosides of the same coin. On the one hand, the vagaries of the market, the decliningratio of crop prices to input costs, in many cases even lack of any marketingpossibility, have increasingly led smallholders to produce agricultural crops only
25 In the longer run, this, of course, leads to mounting food shortages. In late 2003, the Science andDevelopment Network reported that ‘Tanzania is facing a shortage of 350,000 tonnes of food thisfiscal year and has waived all import duties on food’ (Deodatus Balile, ‘Tanzanian parliament blocksgovernment on GM seeds’, 28 November 2003, http://www.scidev.net/). For comparison, Tanzania’sannual net imports of food grains averaged 321,000 tonnes in the ‘crisis’ years 1980–82 (Bryceson1993, 239).
JOAC5_3C104 5/16/05, 11:16 PM358

Economic Liberalization and Smallholder Productivity in Tanzania 359
for own consumption, i.e. subsistence fallback. On the other hand, agriculturalhouseholds seek cash incomes outside their holdings, in petty trade, petty trans-port, beer brewing, etc. Some neoclassical economists note that income diversi-fication is not consistent with specialization: ‘In diversifying to cope with shocks,the household sacrifices the gains of specialization in favour of spreading riskover multiple income generating activities’ (Collier and Gunning 1999, 77). Butthey do not acknowledge that the rising income diversification, as well assubsistence fallback, is the outcome of the economic liberalization they are adv-ocating. In other words, instead of fostering specialization in agriculture, as itsproponents promised, economic liberalization in Tanzania has resulted in exactlythe opposite.
As opposed to liberalization, prices of agricultural output and inputs shouldbe considered and used as policy instruments and not left to be determined solelyby market forces. The recent Asian experience points to the extensive role ofgovernment in both stabilizing and supporting prices as a means of encouragingand sustaining technology adoption among smallholders (Gabre-Madhinet al. 2003). As Gabre-Madhin et al. have emphasized: ‘The alternative to the freemarket-based transformation strategy is that of a market-based stabilization policyto support agricultural transformation. By placing the burden of ensuring stabilityon governments and not markets, it transfers risk away from producers, who areat least able to bear it’ (2003, 35).
In order to transform Tanzania’s smallholder agriculture, there is a strongneed for government involvement, among other things in the construction ofrural roads, irrigation systems and storage facilities, in the establishment ofinstitutions providing cheap agricultural credits, as well as an agricultural insur-ance system which can protect the smallholders in years of crop failure. Farmerscooperatives are needed first of all to give the smallholders bargaining power inthe input, output and credit markets. Government support appears to be neces-sary for facilitating the establishment of such cooperatives, and it is indispensablefor agricultural extension services, experiment stations and agricultural colleges,and not least for improved primary education. In other words, as the Asianexperience shows, what is needed is not state withdrawal from the market, butan accountable and determined developmental state. In my assessment, theseissues are not adequately addressed in the most recent government agriculturalpolicy document, which seems to believe that agricultural transformation can bepromoted by giving more room for private agribusiness, while the governmentemphasizes poverty reduction in smallholder agriculture.26
26 The Agricultural Sector Development Strategy ‘proposes further modifications to permit privateagribusiness to expand investments in primary production directly or through partnerships withsmallholders, input distribution, produce marketing, and agro-processing. . . . The overarchingGovernment objective is poverty reduction and this calls for strategies that are capable of raisingthe incomes and living standards of a large portion of the rural population in the relatively nearfuture. . . . At the same time, the macroeconomic reforms rule out the possibility of profligategovernment expenditure or subsidies and limit the role of the Government to policy formulation,the establishment of a regulatory framework, and the provision of public goods and safety nets forthe most vulnerable in society’ (United Republic of Tanzania 2001, vii).
JOAC5_3C104 5/16/05, 11:16 PM359

360 Rune Skarstein
REFERENCES
Bevan, D., P. Collier and J.W. Gunning, 1989. Peasants and Governments – An EconomicAnalysis. Oxford: Clarendon Press.
Bhaduri, Amit, 1986. ‘Forced Commerce and Agrarian Growth’. World Development, 14(2): 267–72.
Bhaduri, Amit, 1991. ‘Economic Power and Productive Efficiency in TraditionalAgriculture’. In Power and Economic Institutions, ed. Bo Gustafsson, 53–68. Hampshire:Edward Elgar Publishing.
Bhaduri, Amit, Laurean Rutayisire and Rune Skarstein, 1993. Evaluation of MacroeconomicImpacts of Import Support to Tanzania. Report no. 4/93. Norway: Centre for Environmentand Development, University of Trondheim.
Bharadwaj, Krishna, 1974. Production Conditions in Indian Agriculture. Cambridge:Cambridge University Press.
Bilame, O.S., 1996. ‘Performance of Maize Production during Structural AdjustmentProgrammes in Tanzania’. MA thesis, University of Dar es Salaam.
Binswanger, Hans P. and Wernon W. Ruttan, eds, 1978. Induced Innovation. Baltimore:John Hopkins University Press.
Boesen, Jannik, Kjell J. Havnevik, Juhani Koponen and Rie Odgaard, eds, 1986. Tanzania– Crisis and Struggle for Survival. Uppsala: Scandinavian Institute of African Studies.
BOS, 1992. Agriculture Statistics 1989. Dar es Salaam: Bureau of Statistics.Boserup, Ester, 1965. The Conditions of Agricultural Growth. Chicago: Aldine Publishing Co.Bryceson, Deborah Fahy, 1993. Liberalizing Tanzania’s Food Trade. London: James Currey.Bryceson, Deborah Fahy, 1999. ‘African Rural Labour, Income Diversification and
Livelihood Approaches: A Long-Term Development Perspective’. Review of AfricanPolitical Economy, 80: 171–89.
Central Bank of Tanzania, 1998. Economic Bulletin for the Quarter ended 31st December 1997.vol. 27, no. 4.
Central Bank of Tanzania, 2001. Economic and Operations Report for the Year ended 30thJune, 2001. Dar es Salaam, November.
Collier, Paul and Jan Willem Gunning, 1999. ‘Explaining African Economic Performance’.Journal of Economic Literature, 37: 64–111.
Delgado, Christopher L., Nicholas Minot and Claude Courbois, 1999. Agriculture inTanzania since 1986: Follower or Leader of Growth? Revised version, November. Washing-ton DC: International Food Research Institute.
Dyer, Graham, 1991. ‘Farm Size – Farm Productivity Re-Examined: Evidence from RuralEgypt’. Journal of Peasant Studies, 19 (1): 59–92.
Dyer, Graham, 1998. ‘Farm Size and Productivity – A New Look at the Old DebateRevisited’. Economic and Political Weekly, 33 (6): A113–16.
Ellis, Frank, 1982. ‘Prices and the Transformation of Peasant Agriculture: The TanzanianCase’. IDS Bulletin, 10 (4).
Ellis, Frank, 1983. ‘Agricultural Marketing and Peasant-State Transfers in Tanzania’. Journalof Peasant Studies, 10 (4): 214–42.
Ellis, Frank, 1988. ‘Tanzania’. In Agricultural Pricing Policy in Africa – Four Country CaseStudies, ed. Charles Harvey, 67–104. London: Macmillan.
FAO, 2000. The State of Food and Agriculture – Country Time Series. FAOSTAT Diskette.Rome: Food and Agriculture Organisation of the United Nations.
Gabre-Madhin, Eleni, Christopher B. Barret and Paul Dorosh, 2003. Technological Changeand Price Effects in Agriculture: Conceptual and Comparative Perspectives. MTID Discussionpaper no. 62, April. Washington DC: International Food Policy Research Institute.
JOAC5_3C104 5/16/05, 11:16 PM360

Economic Liberalization and Smallholder Productivity in Tanzania 361
Gibbon, Peter, Kjell J. Havnevik and Kenneth Hermele, 1993. A Blighted Harvest: TheWorld Bank and African Agriculture in the 1980s. London: James Currey.
Havnevik, Kjell J., ed. 1987. The IMF and the World Bank in Africa. Uppsala: ScandinavianInstitute of African Studies.
Havnevik, Kjell J., 1993. Tanzania: The Limits to Development from Above. Uppsala:Nordiska Afrikainstitutet and Dar es Salaam: Mkuki na Nyota Publishers.
Havnevik, Kjell J. and Mats Hårsmar, 1999. The Diversified Future – An InstitutionalApproach to Rural Development in Tanzania. Stockholm: Almquist & Wiksell International.
Havnevik, K.J., F. Kjærby, R. Meena, R. Skarstein and U. Vuorela, 1988. Tanzania –Country Study and Norwegian Aid Review. Bergen: Centre for Development Studies.
Hawassi, F.G.H., N.S.Y. Mdoe and F.M. Turuka, 1999. ‘Efficiency in Fertilizer Useamong Smallholder Farmers in Mbinga District’. AGREST Proceedings, SokoineUniversity of Agriculture, Morogoro, 72–86.
Hella, J.P. and F.T. Kamuzora, 1999. ‘Climate Change and Agricultural Planning beyondthe 21st Century: A Case Study of Morogoro District’. AGREST Proceedings, 203–215.
ILO, 1981. ‘Basic Needs in Danger’, draft report. Addis Ababa: International LabourOrganization.
IMF, 1986. ‘Statement by the IMF Representative’. Paper presented at the meeting of theTanzania Consultative Group, Paris, 10–11 June.
IMF, 1995. ‘Statement by the IMF Staff Representative’. Paper presented at the meetingof the Tanzania Consultative Group, Paris, 27–28 February.
Kalecki, Michal, 1971. Selected Essays on the Dynamics of the Capitalist Economy 1933–1970.Cambridge: Cambridge University Press.
Kapunda, Stephen, 1998. The Impact of Agricultural Parastatal Reform on Agricultural Devel-opment and Food Security in Tanzania. Revised Final Report of the FAO Sub-RegionalRepresentative for East and South Africa, Dar es Salaam, June.
Kikula, Idris, 1997. Policy Implications on Environment – The Case of Villagisation in Tanzania.Uppsala: The Nordic Africa Institute.
MacDonagh, J., R.H. Bernhard, J.R. Jensen, J.P. Møberg, N.E. Nielsen and E. Nordbo,1999. Productivity of Maize Based Cropping Systems under Various Soil-Water-NutrientManagement Strategies. Copenhagen: SASA Centre for Research on Sustainable Agricul-ture in Semi-Arid Africa, The Royal Veterinary and Agricultural University, November.
MAC, 2000. Tanzania Agriculture: Performance and Strategies for Sustainable Growth. Dar esSalaam: Ministry of Agriculture and Cooperatives, February.
MAC/MDB, 1995. 1993/94 Industry Review of Maize, Rice and Wheat. Dar es Salaam:Ministry of Agriculture and Cooperatives/Marketing Development Bureau.
MAC/NBS, 2000. Integrated Agricultural Survey 1997/98. Dar es Salaam: Ministry ofAgriculture and Cooperatives/National Bureau of Statistics, May.
MLH, 1995. National Land Policy. Dar es Salaam: Ministry of Lands, Housing and UrbanDevelopment.
OECD, 1990. Geographical Distribution of Financial Flows to Developing Countries 1985–1988. Paris: OECD.
OECD, 1995. Geographical Distribution of Financial Flows to Developing Countries 1989–1993. Paris: OECD.
Øygard, Ragnar, Atle G. Guttormsen, Roberto Garcia, Richard Kachule, AnthonyMwanaumo, Inyambo Mwanawina, Espen Sjaastad and Mette Wik, 2003. ‘TheMaze of Maize: Improving Input and Output Market Access for Poor Smallholders inSouthern Africa Region – The Experience of Zambia and Malawi’. Report No. 26,Department of Economics and Resource Management, Agricultural University ofNorway, Ås.
JOAC5_3C104 5/16/05, 11:16 PM361

362 Rune Skarstein
Ponte, Stefano, 1999. ‘Trading Images: Discourse and Statistical Evidence on AgriculturalAdjustment in Tanzania 1986–95’. In Agrarian Economy, State and Society in ContemporaryTanzania, eds Peter G. Forster and Sam Maghimbi, 3–25. Aldershot: Ashgate.
Ponte, Stefano, 2002. Farmers and Markets in Tanzania. Oxford: James Currey.Rasmussen, Torben, 1986. ‘The Green Revolution in the Southern Highlands’. In Tanzania
– Crisis and Struggle for Survival, eds Jannik Boesen, Kjell F. Havnevik, Juhani Koponenand Rie Odgaard, 191–205. Published for Scandinavian Institute of African Studies,Uppsala. Stockholm: Almquist and Wiksell International.
Seppälä, Pekka, 1998. Diversification and Accumulation in Rural Tanzania. Uppsala: NordiskaAfrikaintitutet.
Shivji, Issa G., ed., 1986. The State and the Working People in Tanzania. Dakar: CODESRIA.Shivji, Issa G., 1998. Not Yet Democracy: Reforming Land Tenure in Tanzania. IIED/
HAKIARDHI/Faculty of Law, University of Dar es Salaam.Skarstein, Rune, 2004. ‘Induced Innovation and Agricultural Productivity – A Critical
Review’. Draft typescript, Department of Economics, NTNU, November.Temu, A.E. and G.C. Ashimogo, 1999. ‘Economic Reform in Tanzania: Impacts on
Maize Production, Marketing, Prices and Food Security’. AGREST Proceedings, SokoineUniversity, Morogoro, 137–45.
United Republic of Tanzania, 1982. The Tanzania National Agricultural Policy. Dar esSalaam: Ministry of Agriculture and Cooperatives.
United Republic of Tanzania, 1996. National Sample Census of Agriculture 1994/95,Tanzania Mainland – Report Volume III: Planted Area, Crop Production, Yield Estimates,Agricultural Inputs and Related Characteristics. Dar es Salaam, April.
United Republic of Tanzania, 1997. The Census of Large Scale Farming 1994/95, TanzaniaMainland. Dar es Salaam, April.
United Republic of Tanzania, 2000. The Economic Survey 1999. Dar es Salaam: ThePlanning Commission, June.
United Republic of Tanzania, 2001. Agricultural Sector Development Strategy. Dar es Salaam:Government of Tanzania, October.
United Republic of Tanzania/MAC, 1992. Basic Data – Agriculture & Livestock Sector 1985/86–1990/91. Dar es Salaam: Ministry of Agriculture and Cooperatives.
United Republic of Tanzania/MAC, 1998. Basic Data – Agriculture and Livestock Sector1991/92–1997/98. Dar es Salaam: Ministry of Agriculture and Cooperatives.
United Republic of Tanzania/MAC, 1999. Expanded Survey of Agriculture 1995/96 –Tanzania Mainland. Main Report. Dar es Salaam: Ministry of Agriculture and Coopera-tives, March.
United Republic of Tanzania/MAC, 2000. Basic Data – Agriculture and Livestock Sector1992/93–1998/99. Dar es Salaam: Ministry of Agriculture and Cooperatives.
World Bank, 1992. ‘A Vision for Sustained Growth in Tanzania’. Paper presented at theTanzania Consultative Group Meeting, Paris, 29–30 June.
World Bank, 1994. Tanzania – Agriculture. A World Bank Country Study. WashingtonDC: World Bank.
World Bank, 2000. Agriculture in Tanzania since 1986 – Follower or leader in growth? WorldBank Report No. 20639. Washington DC: World Bank.
World Bank, 2001. Tanzania at the Turn of the Century – From Reforms to Sustained Growthand Poverty Reduction. A Country Study. Washington DC: World Bank.
JOAC5_3C104 5/16/05, 11:16 PM362