Embed Size (px)
Citation preview

BARRIERS TO TRADE FOR SMALLHOLDER FARMERS IN TANZANIA
A REVIEW AND ANALYSIS OF AGRICULTURAL RELATED MARKET POLICIES IN TANZANIA

ii Barriers to trade for smallholder farmers in Tanzania
BARRIERS TO TRADE FOR SMALLHOLDER FARMERS IN TANZANIA
A REVIEW AND ANALYSIS OF AGRICULTURAL RELATED MARKET POLICIES INTANZANIA
© PELUM Tanzania and ESAFF 2013
ISBN 978-9987-8956-2-5
Researcher: Damian M. Gabagambi (PhD) of Sokoine University of AgricultureEditors: Baruani Iddi Baruani, Donati Alex Senzia and Joe MzingaFinancial support: Ford FoundationPhotographs: PELUM Tanzania &ESAFF

iiiBarriers to trade for smallholder farmers in Tanzania
TABLE OF CONTENTS
LIST OF TABLES ............................................................................................................... v
LIST OF FIguRES AND BOXES....................................................................................... v
gLOSSARy .......................................................................................................................... vI
FOREWORDS ....................................................................................................................... vII
ACkNOWLEDgEMENT .................................................................................................... vIII
1. INTRODuCTION ...................................................................................................... 11.1. Background ....................................................................................................... 11.2 Objectives and Outputs of the Study .............................................................. 1
2. METHODOLOgy....................................................................................................... 2
3. FINDINgS.................................................................................................................... 3
3.1 Policy Documents and Small-scale Farmers................................................... 33.1.1 Policy Documents at Central Government Level ........................... 33.1.2 Local Government Priorities and Small-scale Farmers .................. 6
3.2 Opportunities and Challenges for Small-scale Farmers in the East Africa Common Market ................................................................................................ 73.2.1 Potential Benefits to Tanzanian’s SSF from the EAC Common
Market .................................................................................................... 83.2.2 Challenges of EAC Common Market to Tanzania’s
Smallholder Farmers ........................................................................... 103.2.2.1 Poor Market Orientation Mindset among Smallholder
Farmers in Tanzania ............................................................ 103.2.2.2 Overdependence on Rain Fed Agriculture ....................... 113.2.2.3 Poorly organised Producer Organisations ....................... 113.2.2.4 Inadequate Value Addition and other Infrastructure ...... 123.2.2.5 Poor Value Chain Development .......................................... 12
3.3 Tariff and Nontariff Barriers to Trade for Smallholder Farmers ................ 133.3.1 Tariff Barriers ....................................................................................... 13
3.3.1.1 Tax Institutional Framework at Central Government Level ........................................................................................ 13
3.3.1.2 Tax Institutional Framework at Local Government Level ........................................................................................ 14

3.3.2 Non-tariff Barriers ................................................................................ 183.3.2.1 Identification of Non-tariff Barriers ................................. 183.3.2.2 Awareness of EA Governments of the Existence of
NTBs........................................................................................ 213.3.2.3 Non-tariff Barriers in the Maize marketing
system in Kongwa/Kiteto Area ......................................... 213.3.2.4 Non-tariff Barriers in the Coffee Marketing System in
Karagwe District .................................................................. 22
4. AgRICuLTuRAL MARkET ACCESS ADvOCACy STRATEgy FOR TANZANIAN SSF ............................................................................................ 25
4.1 System Efficiency ............................................................................................... 25
4.2 Product Quality and Specifications ................................................................. 25
4.3 Product Differentiation (Competition) ............................................................ 25
4.4 Improve Social and Environmental Standards .............................................. 26
4.5 Enabling business environment ...................................................................... 26
5. CONCLuSION AND RECOMMENDATIONS................................................... 28
5.1 Conclusion ............................................................................................... 28
5.2 Policy and Advocacy Recommendations........................................................ 28
References .............................................................................................................................. 30
Appendices ............................................................................................................................ 31
Apindices 1: Names of people and institutions contacted for information......... 31
Apindices 2: NTBs to trade for three old EA States................................................. 32
iv Barriers to trade for smallholder farmers in Tanzania

vBarriers to trade for smallholder farmers in Tanzania
LIST OF TABLES
Table 1: Policy objectives relevant to small scale farmers’ interest ........................... 5
Table 2: Eastern Africa cross border trade flow 2007-2008.......................................... 10
Table 3: A matrix of taxes, levies and fees paid by different actors........................... 15
Table 4: Time for Documentation at Crossings ............................................................ 19
Table 5: Time for Border Post Procedures ..................................................................... 19
Table 6: Time for Registration and Licensing ............................................................... 20
Table 7: Responses on Road Blocks, Weighbridges and Standards........................... 20
Table 8: NTBs in the coffee marketing system Tanzania and Uganda compared ... 23
Table 9: Framework for market access strategy for smallholder farmers in Tanzania ............................................................................................................. 27
LIST OF FIguRES
Figure 1: Eastern Africa wholesale maize price trend 2008 for select capital cities.. 9
LIST OF BOXES
Box 1: One district one product would increase economies of scale ..................... 6Box 2: The way taxation eats initiatives in agriculture ........................................... 16

gLOSSARy
ACT Agricultural Council of TanzaniaALP Agriculture and Livestock Policy AMCOS Agriculture Market Cooperative SocietyAMP Agricultural Marketing Policy ASDP Agricultural Sector Development Program ASDPL Agricultural Sector Development Program for LivestockASDS Agricultural Sector Development Strategy CAG Controller and Auditor GeneralCSOs Civil Society Organizations CTA Technical Centre for Agricultural and Rural Cooperation DADPs District Agricultural Development Plans DASIP District Agricultural Sector Investment ProjectDED District Executive Director EABC East African Business Council EAC East African Community EACM East African Common MarketEAGC East African Grain Council ESAFF Eastern and Southern Africa Small Scale Farmers ForumESRF Economic and Social Research Foundation GMP Good Manufacturing Practices HIPIC Highly Indebted Poor Countries ILO International Labour Organization KADERES Karagwe Development Relief Services LGA Local Government AuthorityMAFSC Ministry of Agriculture Food Security and Cooperatives MIS Marketing Information SystemMITM Ministry of Industry, Trade & Marketing MLDF Ministry of Livestock Development and Fisheries MTEF Medium Term Expenditure Framework NTBs None Tariff BarriersPADEP Participatory Agricultural Development and Empowerment Project PELUM Participatory Ecological Land Use Management PRSP Poverty Reduction Strategy Paper RATIN Regional Agricultural Trade Intelligence Network RDS Rural Development Strategy SEZs Special Economic Zones SME Small and Medium scale Enterprise SMEDP Small and Medium Enterprises Development PolicySSF Small Scale FarmerTAMISEMI Tawala za Mikoa na Serikali za MitaaTCB Tanzania Coffee Board UCDA Uganda Coffee Development Authority
vi Barriers to trade for smallholder farmers in Tanzania

viiBarriers to trade for smallholder farmers in Tanzania
FOREWORDS
Market is one of the major factors determining the quantity of production of goods in aparticular period and particular place, its quality, taste and look. As it is in any otherproduction, agriculture produces also react to the market and stimulate producers (smallscale farmers) to produce more or produce less for the market.
As the world is moving closer towards the so called global village due to advanced meansof communications, dependence to one another and movements of people, goods andservices; the East Africa Community, made of five independent states, is moving closertowards a common market. This market is a great opportunity for farmers in Tanzania. Thecountry has the largest number (about 31 million rural agricultural smallholder households)of small scale farmers than any other country in community with the largest arable land andother natural resources to produce and feed other countries in the East Africa Community.
Small scale farmers will produce more, will produce of expected quality and will produce ina desired time, if reliable and fair market will exist. However, the opposite is the norm of theday. Small scale farmers are marginalised and squeezed in a corner and denied to enjoy thefreedom of selling their produce to lucrative markets not only within their countries but alsodenied to access lucrative market even in neighbouring districts within the same country.This study on “Tariff and None tariff barriers to Trade for Small Scale Farmers in Tanzania”, ismade to generate a public dialogue on how to address market issues from other angle. Thebottom line is to give freedom and information to small scale farmers to determine what tosell, where to sell and how to sell in the market within their districts, within their nationalboundaries and within the East African common market and wherever possible within theSouthern Africa Development Community (SADC).
Small scale farmers’ freedom of market access should be supported by good policies andpractises as well as good and reliable infrastructure on the ground. Rural developmentagenda is the key to ensure access to energy. Affordable energy will stimulate primaryprocessing industries which are key in value addition while access to information will enablefarmers decide where to sell, what to sell and at what time. Fair and profitable market willeventually stimulate the increase of investments and hence increase of production to ensurefood security and food sovereignty in the entire East African region.
Joe MzingaESAFF Regional Coordinator

ACkNOWLEDgEMENT
Developing this publication was a process that involved a number of PELUM and ESAFFpartners and stakeholders. We would like to acknowledge and thank wholeheartedly all ofour partners and stakeholders whose support and cooperation made this publicationpossible. We recognize PELUM Tanzania Country Secretariat and ESAFF Regional Officeteams for providing leadership and support to all processes that led to the development ofthis publication.
We are grateful to Dr. Damian M. Gabagambi of Sokoine University of Agriculture, Tanzania,a consultant and research for this agriculture market policy study, who provided an in depthanalysis of the agro-marketing related policies in Tanzania presented in this publication.
This publication would not be possible without the financial support of Ford Foundation.We are sincerely grateful for this great contribution.
Special gratitude to PELUM Uganda Country Secretariat Team under the coordination ofStella Grace Lutalo for coordinating the sub regional project on ‘empowering small holderfarmers in Eastern Africa to access agro-markets’ implemented in four Eastern Africacountries namely Uganda, Kenya, Tanzania and Rwanda and funded by Ford Foundation.The production of this publication is one of the outputs of this project and PELUM UgandaCountry Secretariat has shown its great capacity in coordinating such projects.
Last but not least, we are indebted to Baruani Iddi Baruani, Donati Alex Senzia and JoeMzinga for editing this publication.
viii Barriers to trade for smallholder farmers in Tanzania

1Barriers to trade for smallholder farmers in Tanzania
1. INTRODuCTION
1.1. Background
One of the biggest problems that countries in the transitional stage face is how to markettheir agricultural products, both in domestic and export markets. The aspect of professionalagricultural marketing is regarded as a way to overcome seasonal agricultural surpluses andshortages of food supply as a means of addressing food prices and also as a means ofgenerating more income to producers. The marketing of agricultural produce has its ownunique challenges and requires special attention due to the bulkiness and perishability natureof the products involved. Most of these products are basic foodstuffs, whose prices anddistribution are considered strategic by governments and thus the establishment of statutoryinstitutions is required within the marketing system of agricultural products.
Successful marketing of agricultural products depends on many factors including the moretraditional ones such as good infrastructure, post harvest handling technologies, transport,processing, packaging, retailing services, and information system. But provision of suchfacilities and services is not a sufficient condition to ensure smooth flow of agriculturalcommodities. This needs to be complemented by the creation of conducive policyenvironment that gives freedom to key actors to exploit emerging marketing opportunitiesin and outside the country, especially in East African Region.
It is on this background that the Participatory Ecological Land Use Management (PELUM)– Tanzania and the Eastern and Southern Africa Small Scale Farmers Forum (ESAFF) withsupport from Ford Foundation commissioned an in-country study on impeding marketpolicies to small scale farmers (SSFs) to inform advocacy work. The study focused onimpeding taxes, levy and cess, and non tariff barriers. It also examined existing policies thatfavour small scale farmers but are not implemented and identified policy gaps. The maintheme of the study was “Tariff and Non-tariff barriers to Trade for Smallholder Farmers inTanzania”.
1.2 Objectives and Outputs of the Study
The study mainly focused on: i. Identifying tariff and non-tariff policy issues impeding smallholder farmers in Tanzania
to access market for their commodities. ii. Recommending advocacy strategies on key observations. Specific outputs of this assignment have been stipulated as a comprehensive policy studyreport indicating, but not limited to the following:l Existing market policies that affect SSFsl Analysis of the policies to highlight strengths and gaps,l Highlight of the unimplemented policies/policies not in place,l Existing contradicting policies identified and their impact to small holder farmers,l Opportunities and challenges for Tanzanian smallholder farmers in the East African
Common Market,l Clearly inform of the existing tax-related and non-tax impediments in the production and
marketing system at both Local and Central Government level, and l Proposed agricultural market access advocacy strategy for Tanzanian smallholder farmers.

2. METHODOLOgy
In accomplishing this study, visits were made to Kongwa and Karagwe districts to collectinformation on maize and coffee marketing system respectively. Maize was selected torepresent food crops whereas coffee represented traditional export crops. Interview anddiscussions were held with key informants along the value chains of respective crops.
This was complemented by secondary data gathered from different sources such as Kibaigwamarket in Kongwa district, National Business Council (NBC), Ministry of Agriculture FoodSecurity and Cooperatives (MAFSC), Regional Administration and Local GovernmentAuthorities (TAMISEMI), Karagwe Development Relief Services (KADERES) in Karagwedistrict, The Sokoine National Agricultural Library (SNAL) at Sokoine University ofAgriculture (SUA) in Morogoro, Economic and Social Research Foundation (ESRF) andsurfing relevant websites in the internet.
A list of people and institutions contacted in the field is appended on this report as Appendix1. The data collection exercise was followed by synthesis of data collected to createinformation out of it, organizing and producing this report.
2 Barriers to trade for smallholder farmers in Tanzania

3Barriers to trade for smallholder farmers in Tanzania
3. FINDINgS
Background informationIt should be pointed out from the beginning that policy referred to in the context of this studyis public policies which are essentially an attempt by the Central and Local governments toaddress particular public issues by instituting actions pertinent to the problem at hand. Thatmeans, the meaning of policy in this case goes beyond the written policy documents andencompasses decisions made by officials with authority whose instructions establish thelegal “policy” environment in which markets operate and reflect public goals. These actionsand policies may take the form of legislation, administrative rules, district council by-laws,ordinances, or other official determinations.
Public policy[ies] can impact farmers positively, such as actions to create opportunities suchas warehouse receipt system, cooperatives, instructions that require producer’s price to beat least 60% of export or consumer’s price, input subsidy that increases marketable surplus,prevention of overfilling of bags colloquially known as lumbesa in Tanzania, and enforcementof quality standards in the system.
On other hand, policy[ies] can also create obstacles to the operation of markets, such asimposing ban on cross-border trade for food crops, banning inter-district trade on corn,forcing farmers to sell their commodity through a specified channel, and denying farmersfreedom to sell their commodities in the form customers want them.
3.1 Policy Documents and Small-scale Farmers
3.1.1 Policy Documents at Central government LevelReview of government documents reveals that Tanzania is rich in coded policy, strategy,programs and project documents. Fortunately policy statements and objectives in thesedocuments to a large extent favour the interest of small scale farmers. The problem hasalways been how to translate them into actions and lead to realisation of intended impact tothe beneficiaries. This section review selected government documents with the aim ofdemonstrating how they favour small scale farmers and some shortfalls noted in some ofthese documents.
Some of the key documents reviewed included the Constitution. The constitution of theUnited Republic of Tanzania implicitly proclaims the interest of small scale farmers. Through
In Tanzania for example, there have been cases where the government has instructed farmersnot to sell green maize or to use maize to make local brew despite the fact that if maize issold in these forms farmers double or triple income from their commodities. Even if thegovernment may have good intensions, imposing such bans/instructions discouragesaggressive small scale farmers in practising farming as a business.

Article 9, Sub article (i) and (j), the constitution asserts that the use of national wealth shouldplace emphasis on the development of the people and in particular be geared towards theeradication of poverty, ignorance and disease; and that economic activities are not conductedin a manner that may result in the concentration of wealth or the major means of productionin the hands of a few individuals. By this, it means all policies, strategies, and otherdevelopment initiatives should reflect this requirement of the constitution.
It is on this background that in an endeavour to transform the livelihood of the rural peopleand agriculture in general, Tanzania has come up with a chain of strategy papers and policyinitiatives whose main objective is to improve the livelihood of the poor people dwelling inrural areas.
The study noted that, small-scale farmers are placed at the centre of almost all agriculturalpolicies and strategies, ranging from the Vision 2025 to the National Strategy for economicGrowth and Reduction of Poverty (NSGRP) or in Kiswahili, MKUKUTA and individualpolicies and projects. Statements such a ensuring food self-sufficiency and food security;transformation from subsistence to commercial agriculture; improved structure, conduct andthe performance of agricultural marketing systems; producer empowerment and marketlinkages and improved rural marketing infrastructure development; reducing incomepoverty; improve standards of living in the rural areas; supplying raw materials, improvingproduction, marketing and processing technologies; introducing new technologies in orderto increase productivity of labour and land; etc are spotted in the government policy andstrategy documents. Table 1 below summarises statements from selected governmentdocuments that, in a way, aim at improving production and marketing of agriculturalcommodities for small scale farmers.
4 Barriers to trade for smallholder farmers in Tanzania

5Barriers to trade for smallholder farmers in Tanzania
Table 1: Policy objectives relevant to small scale farmers’ interest
S/N Policy/Strategy Issues relevant to small-scale farmers/poor
1 National VISION 2025 l Ensure food self-sufficiency and food security
2 Mini-Tiger plan 2020 l One village one product program (OVOP)l Scholarship tree planting – I million ha commercial forest projectl Cash crop Special Economic Zone program
3 National Strategy for Economic l Improved food availability and accessibility at household level in Growth and Reduction of urban and rural areas.Poverty (MKUKUTA)
4 Property and Business l Reduced individual household povertyFormalization Program l Improved living standard of the target groups(MKURABITA)
5 Agricultural Sector Development l Transformation from subsistence to commercial agricultureProgram (ASDP) l Reduced proportion of rural food poor (men and women) from 27%
in 2000/01 to 14% by 2010.l Productivity in crop and livestock enterprises increases by at
least 20%
8 Agricultural Marketing Systems l Increase incomes and food security of the rural poor in Northern andDevelopment Programme Southern Highlands agro-ecological and marketing zones of Tanzania.(AMSDP)
l Improved structure, conduct and the performance of agricultural marketing systems in the country
l Producer empowerment and market linkages and improved rural marketing infrastructure development
9 Rural Financial Services l To further empower poor rural households to benefit from ruralProgramme in Tanzania (RFSP) financial services.
10 Agriculture and Livestock policy l To improve standards of living in the rural areas through increased income generation from agricultural and livestock production, processing and marketing.
l To produce and supply raw materials, including industrial crops, livestock, by-products and residues for local industries, while also expanding the role of the sector as a market for industrial outputs through the application of improved production, marketing and processing technologies
11 Agricultural Marketing Policy l Farmers and agricultural marketing actors to be supported to negotiate and compete effectively in regional and international markets;
l Encourage producers to directly enter the markets instead of using middlemen.
l Promote adherence to quality, standards and grade in agricultural products to start with the domestic market;
l Enhance access to agricultural marketing finance
13 Cooperative Development Policy l Transform farmers from subsistence to commercial farmingl Enhance farmer’s income through processing of produces for value
addition
14 National Livestock Policy l Contribute towards national food security through increased production, processing and marketing of livestock products
l Increase the quantity and quality of livestock and livestock products as raw materials for local industry and export.
l Facilitating contractual linkage with commercial enterprises for the purpose of processing and marketing of milk.
Source: Composed from various government documents

Some documents have been implemented and some are in various stages of implementation withbillions of donor funds. In terms of chasing milestones most projects are successfully implemented,but in terms of transforming the beneficiaries there are no observable signs that this has been achieved.
For example, the objective of One Village One Product Program (OVOP) that is stipulated in the MiniTiger Plan 2020 has never been attempted, and not much is heard about it. Although neglected, OVOPor its modification is the most strategic intervention that carries seeds of revolutionalising thesmallholder farm sector. Of course implementing OVOP in its current form wouldn’t result intoadequate economies of scale, instead, the program could be modified to focus on the district ratherthan the village – one district one product program (ODOP). This would prevent the current practiceof spreading resources so thinly with no impact as observed by the Agriculture Non-state Actors’Forum 2009 (Box 1).
Box 1: One district one product would increase economies of scale
Source: ANSAF Forum Report 2009
3.1.2 Local government Priorities and Small-scale Farmers
The Local Government priorities are mirror emerges of policy documents highlighted in thisstudy. The District Agricultural Development Plans (DADPs) for many District Councils(DC) focus on improving the livelihood of the small scale farmers, for example increasedagricultural mechanization and irrigation, improvement of crop and livestock production,improvement of market infrastructure and cooperatives, and improvement of livestockinfrastructure.
LGAs do not have adequate resources to address each and every agricultural constraint. Assuch they should strategize their development interventions. Instead of spreading too thinlyby trying to make sure that everybody gets something, the money could be invested in amanner that has greater multiplier effect in the district and thus benefit the majority in anindirect way. For example, if an LGA in collaboration with other key stakeholders identified astrategic crop, say cassava or maize, it could construct one processing plant on a strategiclocation. Because construction of a processing factory is an expensive venture, DADP/ASDPyearly fund could be focussed on completing different phases of the factory instead of thecurrent situation where focuses are shifted nearly on yearly basis. Thereafter farmers could besensitized to grow cassava or maize in order to enhance capacity utilization of the plant. Thiswould in turn increase output of the selected crop. With such high level of output coupled withvalue chain development, it is possible to attract potential large scale buyers of eveninternational standards. Without this kind of specialisation there is no adequate output of anycrop to engage serious international buyers.
This approach was very successful in some regions such as Kagera and Kilimanjaro in the 1960sand 70s with coffee. Actually focusing on one crop as a growth strategy is commensurate tothe approach proposed in the Mini-tiger plan 2020 where a one-village-one product (OVOP)’strategy is proposed. The idea is also supported by KILIMO KWANZA vision.
6 Barriers to trade for smallholder farmers in Tanzania

7Barriers to trade for smallholder farmers in Tanzania
Analysis of DADPs carried out by Agriculture Non-State Actors Forum (ANSAF) in 2010 for5 Local Governments of Bukombe, Kahama, Tandahimba, Lindi, and Kibondo cast a pictureon how Local Government Authorities (LGAs) allocate funds in priority areas of interest tosmall scale farmers. It was noted that interventions directly related to marketing ofagricultural commodities such as market infrastructure and cooperatives were given littlepriority as compared to interventions related to production. Nevertheless improvedproduction is an important component to increased marketable surplus.
However, it is important to note that prioritising interventions or allocating fund is one thingand spending it as planned is another. It is very much likely that on paper the allocation isfine, but on the ground money ends up in the pockets of a few elites in what experts call‘elite capture”. This is not difficult to substantiate as annual reports released by the Controllerand Auditor General (CAG) reveal massive mismanagement of public fund in different formssuch as unauthorised expenditure, improperly vouchered or unvouchered expenditure,irregular payments, and payments not supported by proforma invoices. For example,between 2001 and 2006, fund amounting to TSh 14.5 billion was mismanaged.
Fund mismanagement is as well rampant at LGA level. As such, to accomplish the objectivesof this assignment a desk review was made of the district agricultural plans (DADPS) andbudgets. However the most appropriate documents that could have given more insightsabout public fund spending are the Local Authority Accounting Committee (LAAC) reportand the Medium Term Expenditure Framework (MTEF). But these documents are hard tocome by because LGA officials treat them with great confidentiality.
3.2 Opportunities and Challenges for Small-scale Farmers in the East Africa Common Market
The East African Community (EAC) currently (2012) comprises 5 member states: Tanzania,Burundi, Rwanda, Uganda and Kenya. The region has a population of about 138 millionpeople, with per capita Gross Domestic Product (GDP) of about US$ 560. The proposedEAC’s regional integration process included formation of a Free Trade Area; a CustomsUnion; a Common Market; a Monetary Union and further reaching a Political Federation.Currently, the region has reached implementation of a Common Market (CM) for which aprotocol came into effect on 1st July 2010.
A review of Tanzania Knowledge Network (TAKNET) discussions that were moderated bythe Economic and Social Research Foundation (ESRF) in mid 2011, revealed opportunitiesand challenges of EAC common market arrangements for Tanzania’s economic entitiesincluding those in the agricultural sector. The discussions covered 5 themes namely whatthe Tanzanian government (and citizens) should do in order to increase gains whileminimizing losses from the common market arrangement; the comparative advantage thatTanzania needs to capitalize on; opportunities available for Tanzania in the Common Marketarrangement; and effective of labour market in facilitating development for the EACeconomies. In that study, issues of interest to small-scale farmers are examined.

3.2.1 Potential Benefits to Tanzanian’s SSF from the EAC Common Market
General potential benefits relevant to smallholder farmers in the common market asidentified by TAKNET include availability of large tracts of arable land being able to absorbenterprising farmers from other East African countries (and thus help in raising farmproductivity through the demonstration effect and production partnership with small-scalefarmers; and free movement of goods and people which promotes cross border trading, andthus allowing Tanzanian farmers to get higher prices for agricultural products from thefarms, forests and waters.
A number of sectors and cross–cutting issues were highlighted in the EACM protocol asimportant facilitators of integration and cooperation. Agriculture has been singled out forleveraging food security in the region and for reaping on rising food prices worldwide,whereby Tanzania is seen by Tanzanians and the EAC partners as a potential surplus foodsupplier and is likely to exploit advantageously the new needs for bio-fuels. But the relativelygood soils and water sources have to be profitably exploited instead of being wasted(warning by Grant Stuart Simpson from South Africa).
The point of departure among the TAKNET contributors was whether to give policypreference to small farmers or to big farmers to boost agricultural production to realizeTanzania’s comparative and competitive advantage. The compromise advanced was in someform of partnership among the two farmer groups, as already witnessed in sugar, tea andsisal growing areas in respect of large estates working in partnership with small out growers.
Nevertheless, Tanzania seems to have a comparative advantage in the production of cerealsespecially maize. This is exemplified by strong demand of the crop from neighbouringcountries that has necessitated Tanzanian government ban on cross-border trade. Maize ishighly demanded in Kenya, Democratic Republic of Congo (DRC), South Sudan and Somaliawhere consumer prices are reported to be almost twice as much as local market prices.
Statistics from the East African Grain Council (EAGC) indicate that regional maize prices inthe Eastern Africa capital cities remain high. For example in January 2009, the indicativewholesale prices of maize ranged from US$ 260 per metric ton (MT) in Kampala to US$387/MT in Kigali. The shortfall in Kenya which has been occasioned by low production aswell as increased demand from Sudan due to the reconstruction, put pressure on the supplycausing price to rise. In comparison to January 2008, the wholesale prices in Kampala in 2009were almost US$ 90/MT higher.
It is important to learn from the bad experiences of Zimbabwe and Kenya where the smallscale farmers were marginalized at the risk of causing uprising by the landless. It is thereforeimportant to enforce equitable and fair share of resources. Indeed we were reminded thatin Tanzania there are already pressures for land grabbing to watch, from both domestic andforeign investors.
8 Barriers to trade for smallholder farmers in Tanzania

9Barriers to trade for smallholder farmers in Tanzania
During the same period, in Nairobi maize prices were on average US$ 305/MT while in Dares Salaam it was rela tively lower and stable at USD 287/MT. Figure 1 below shows the trendin maize prices in Kenya, Uganda, Tanzania and Rwanda for the year 2008. It could be notedthat Dar es Salaam prices were consistently lowest than other cities of Nairobi, Kigali, andKampala.
Figure 1: Eastern Africa wholesale maize price trend 2008 for select capital cities
Source: Ministries of Agriculture and RATIN price monitors
It is revealed that wholesale maize prices in Nairobi started rising in January 2008 until May2008 when it reached a peak price of USD 380/ MT. The prices eased a bit following inflowsfrom the neighbouring countries only to rise again in October 2008 when harvesting in thegrain basket was to start. Wholesale maize prices have been high since then and it is expectedthat they will remain so. This is due to the fact that maize prices are also high in the sourcemarkets. The import parity price of white maize imported duty free from South Africa orthe United States of America delivered Nairobi February – March 2009 was US$ 340/MThigher than the local price of US$ 305/MT.
Kenya had to rely on her neighbours, Tanzania and Uganda for maize to increase thedomestic stocks. Ordinarily, Kenya imports about 250,000MT (2.7 million 90kg bags) fromUganda and Tanzania during one production year, from July to June of the fol lowing year.Apart from Kenya, Zambia and Malawi were projected to be in deficit, and would turn toTanzania for supplies of maize. Sudan, Rwanda, Democratic Republic of Congo and Kenyawere predicted to rely on Uganda. Maize shortage situation in Kenya is also supported bythe Regional Agricultural Trade Intelligence Network (RATIN) border statistics presentedin Table 2 below.
Nairobi: KE
45040035030025020015010050
0
Kigali: RW
Kampala: UGDar es salaam: TZ
Jan
08
Price-USD/MT
Feb
08
Mar
08
Apr
08
May
08
Jun
08
Jul
08
Sep
08
Oct
08
Nov
08
Dec
08
Aug
08

Table 2: Eastern Africa cross border trade flow in tons (2007-2008)
Maize Beans Rice
2007 2008 2007 2008 2007 2008
Uganda-Rwanda 55,558 65,359 1,341 662
Rwanda-Uganda 260
Tanzania-Kenya 121,153 81,730 8,401 4,045 14,110 12,073
Kenya-Tanzania 3255
Uganda-Kenya 98,029 60,430 65,134 122,152
Tanzania-Uganda 495 1,116 3,036
Uganda-Tanzania 1,597 530 384
Source: EAGC/RATIN
It could be noted that Tanzania supply maize of various amount every year to Kenya. Inshort, there is huge potential for maize output from Tanzania. With its varied climate andvast land resources, often of rich soils, Tanzania can produce much more to satisfy its largelocal food demand. Taking advantage of economies of scale, the country can step upproduction to meet a significant demand from the neighbouring countries for unprocessedas well as processed food items. To minimise transport costs production could be promotedstrategically in border regions; this may explain why the government has decided to establishSpecial Economic Zones (SEZs) in those regions.
Although the information presented in table 2 above may look old, the situation has notchanged even in recent times. According to the East Africa Cross-border Trade Bulletin ofJuly-September 2011, Tanzania and Ethiopia were the main sources of staple foodcommodities traded in the region despite the existence of export bans imposed on cross-border trade on staple food (maize, sorghum, and beans) by the respective governments.Cross-border trade from Ethiopia and Tanzania was driven by increased demand from Kenyaand South Sudan, against a background of low supplies from Uganda, another keytraditional exporting country.
3.2.2 Challenges of EAC Common Market to Tanzania’s Smallholder Farmers
3.2.2.1 Poor Market Orientation Mindset among Smallholder Farmers in Tanzania
Despite the huge potential outlined in the previous section, there are several challenges aheadas identified in literature and amplified by stakeholders during TAKNET discussions. First,it has been observed that the domestic market is not yet saturated or fully exploited.Supermarkets are full of imported fresh and manufactured products such as spinach,tomatoes, ketchups, juices, water, etc from abroad that can be produced locally. But thissituation has professional explanation. Improved version of agricultural marketing definitionby Kohls and Uhl (1990) define agricultural marketing as a process of satisfying human needs
Source - Destination
10 Barriers to trade for smallholder farmers in Tanzania
11Barriers to trade for smallholder farmers in Tanzania
by bringing products to people at the proper time, place, quantity and form they want. Thelesson obtained from this definition it is that four elements namely time, place, quantity andform must be adhered to for sustainable marketing, especially for fresh agriculturalcommodities required by supermarkets. Tanzanian smallholder producers are unable to meetthese requirements because they operate without appreciable support from the government,and are in most cases stuck to production orientation.
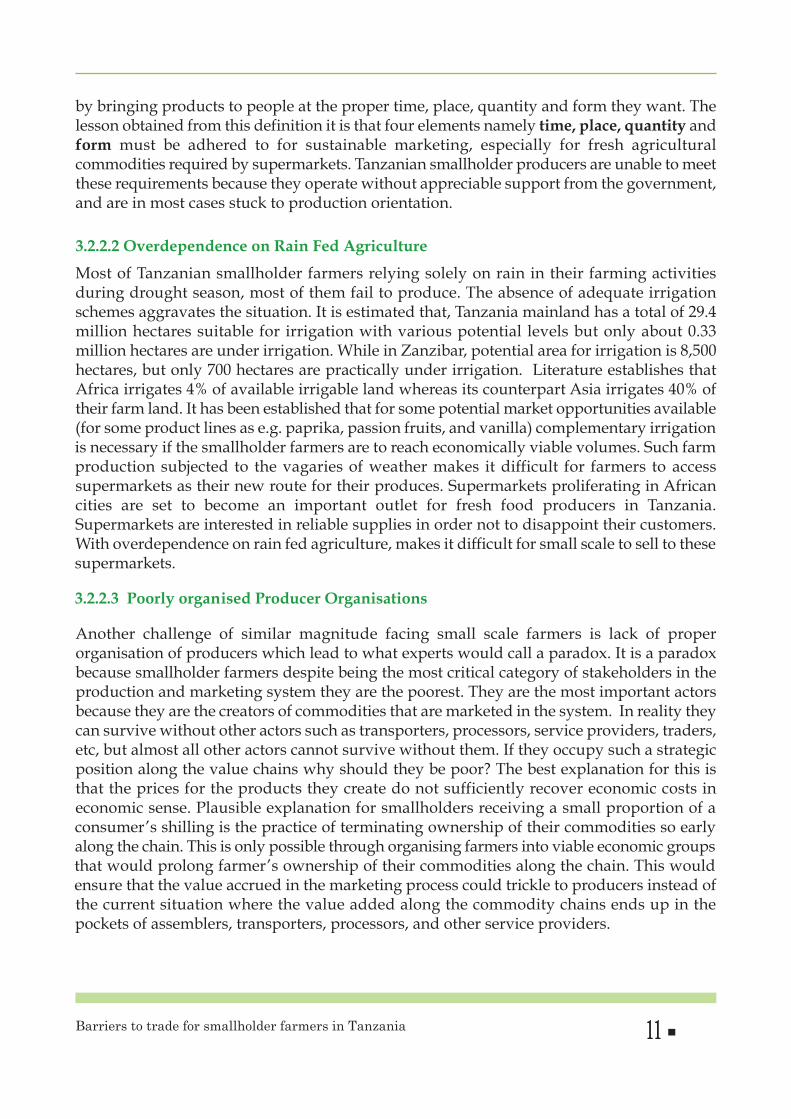
3.2.2.2 Overdependence on Rain Fed Agriculture
Most of Tanzanian smallholder farmers relying solely on rain in their farming activitiesduring drought season, most of them fail to produce. The absence of adequate irrigationschemes aggravates the situation. It is estimated that, Tanzania mainland has a total of 29.4million hectares suitable for irrigation with various potential levels but only about 0.33million hectares are under irrigation. While in Zanzibar, potential area for irrigation is 8,500hectares, but only 700 hectares are practically under irrigation. Literature establishes thatAfrica irrigates 4% of available irrigable land whereas its counterpart Asia irrigates 40% oftheir farm land. It has been established that for some potential market opportunities available(for some product lines as e.g. paprika, passion fruits, and vanilla) complementary irrigationis necessary if the smallholder farmers are to reach economically viable volumes. Such farmproduction subjected to the vagaries of weather makes it difficult for farmers to accesssupermarkets as their new route for their produces. Supermarkets proliferating in Africancities are set to become an important outlet for fresh food producers in Tanzania.Supermarkets are interested in reliable supplies in order not to disappoint their customers.With overdependence on rain fed agriculture, makes it difficult for small scale to sell to thesesupermarkets.
3.2.2.3 Poorly organised Producer Organisations
Another challenge of similar magnitude facing small scale farmers is lack of properorganisation of producers which lead to what experts would call a paradox. It is a paradoxbecause smallholder farmers despite being the most critical category of stakeholders in theproduction and marketing system they are the poorest. They are the most important actorsbecause they are the creators of commodities that are marketed in the system. In reality theycan survive without other actors such as transporters, processors, service providers, traders,etc, but almost all other actors cannot survive without them. If they occupy such a strategicposition along the value chains why should they be poor? The best explanation for this isthat the prices for the products they create do not sufficiently recover economic costs ineconomic sense. Plausible explanation for smallholders receiving a small proportion of aconsumer’s shilling is the practice of terminating ownership of their commodities so earlyalong the chain. This is only possible through organising farmers into viable economic groupsthat would prolong farmer’s ownership of their commodities along the chain. This wouldensure that the value accrued in the marketing process could trickle to producers instead ofthe current situation where the value added along the commodity chains ends up in thepockets of assemblers, transporters, processors, and other service providers.
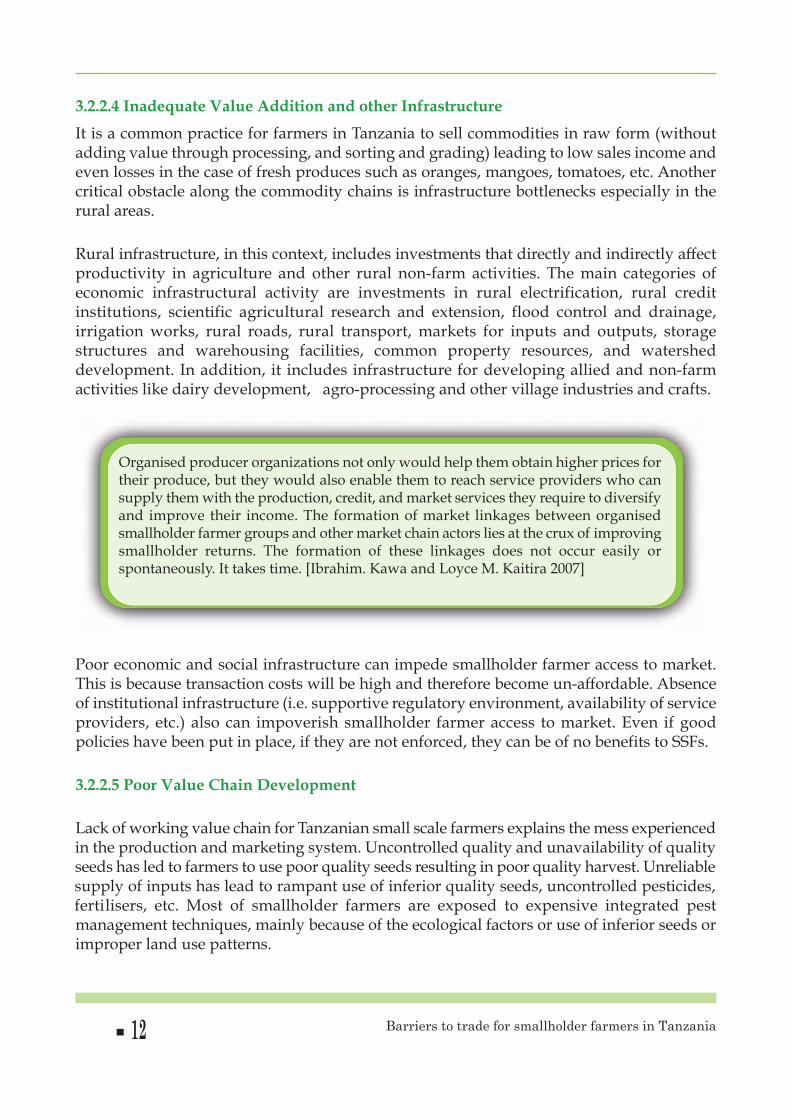
3.2.2.4 Inadequate value Addition and other Infrastructure
It is a common practice for farmers in Tanzania to sell commodities in raw form (withoutadding value through processing, and sorting and grading) leading to low sales income andeven losses in the case of fresh produces such as oranges, mangoes, tomatoes, etc. Anothercritical obstacle along the commodity chains is infrastructure bottlenecks especially in therural areas.
Rural infrastructure, in this context, includes investments that directly and indirectly affectproductivity in agriculture and other rural non-farm activities. The main categories ofeconomic infrastructural activity are investments in rural electrification, rural creditinstitutions, scientific agricultural research and extension, flood control and drainage,irrigation works, rural roads, rural transport, markets for inputs and outputs, storagestructures and warehousing facilities, common property resources, and watersheddevelopment. In addition, it includes infrastructure for developing allied and non-farmactivities like dairy development, agro-processing and other village industries and crafts.
Poor economic and social infrastructure can impede smallholder farmer access to market.This is because transaction costs will be high and therefore become un-affordable. Absenceof institutional infrastructure (i.e. supportive regulatory environment, availability of serviceproviders, etc.) also can impoverish smallholder farmer access to market. Even if goodpolicies have been put in place, if they are not enforced, they can be of no benefits to SSFs.
3.2.2.5 Poor value Chain Development
Lack of working value chain for Tanzanian small scale farmers explains the mess experiencedin the production and marketing system. Uncontrolled quality and unavailability of qualityseeds has led to farmers to use poor quality seeds resulting in poor quality harvest. Unreliablesupply of inputs has lead to rampant use of inferior quality seeds, uncontrolled pesticides,fertilisers, etc. Most of smallholder farmers are exposed to expensive integrated pestmanagement techniques, mainly because of the ecological factors or use of inferior seeds orimproper land use patterns.
Organised producer organizations not only would help them obtain higher prices fortheir produce, but they would also enable them to reach service providers who cansupply them with the production, credit, and market services they require to diversifyand improve their income. The formation of market linkages between organisedsmallholder farmer groups and other market chain actors lies at the crux of improvingsmallholder returns. The formation of these linkages does not occur easily orspontaneously. It takes time. [Ibrahim. Kawa and Loyce M. Kaitira 2007]
12 Barriers to trade for smallholder farmers in Tanzania

13Barriers to trade for smallholder farmers in Tanzania
On the other hand, there are less specialised extension service providers especially from thegovernment (i.e. agronomy skills, business skills, ‘process-specific’ abilities) in regard tonewly promoted high value crops, e.g. paprika, vanilla, hibiscus, speciality coffee as well asin mariculture e.g. hatcheries of prawns, fattening of mud crabs, to mention but a few. Insome cases for instance in Mbeya region buyers offer extension services themselves asspraying pesticides buying package.
If the value chain worked, most of the challenges facing smallholder farmers in productionand marketing of their commodities such as quality and standards requirements, unfair farm-gate prices, access to credit, postharvest losses, etc, would be resolved for mutual benefits ofkey actors along the commodity chains.
3.3 Tariff and Nontariff Barriers to Trade for Smallholder Farmers
3.3.1 Tariff Barriers
In the context of this study, tariff concept is expanded to include any statutory deductionsfrom farmer’s or trader’s income that are not related to production costs. As such the tariffissue in this study is examined in the light of the taxation system in Tanzania. Thus, itimperatively starts by exploring the institutional framework of the taxation system in thecountry.
3.3.1.1 Tax Institutional Framework at Central government Level
Usually three components of taxation system are referred to: the taxation policy, thelegislature or tax structure, and tax administration. The tax policy is formulated by theMinistry of Finance in conjunction with the Planning Commission. These two institutionsidentify new fiscal objectives attainable through taxation. They also identify the relevant taxbases, taxpaying units and formulate the tax levying strategy such as proposing tax ratesand the choice of the administrative agency. Finally they measure the effectiveness andefficiency of the taxation system in operation.
The tax structure in Tanzania is generally composed of direct and indirect taxes. For the directtaxes, the factors that produce the incomes are assumed to pay the associated taxes whilefor the indirect taxes, households or firms that consume the taxed items are assumed to paythe associated taxes. Direct taxes often include corporation tax, personal income tax (e.g.Pay-as-you-earn (PAYE)), withholding tax, rental income tax, tax on interest in banks, andpresumptive income tax. The indirect taxes include taxes on domestic goods and servicessuch as value added tax (VAT), and excise duty on demerit goods (e.g. on beer and cigarettes).Moreover, indirect taxes comprise taxes on international trade transactions such as importduty, VAT on imported goods and services, and excise duties on specific imported goodssuch as beer and cigarettes. The administration of central government taxes is undertakenby the Tanzania Revenue Authority (TRA), established in 1996. The TRA has considerableautonomy compared to the previous tax departments.

Generally, indirect taxes on goods and services are the major revenue bases for the country.However, direct taxes on income and wealth are important revenue bases in many poorcountries. In Tanzania direct taxes generate almost 40% of total tax revenues. Of these,corporate income taxes are most important, followed by pay-as you-earn (PAYE) taxes onformal sector employees. There are several general criteria against which any revenue schemeshould be judged. These include the ability to raise revenues, effects on economic efficiency,equity implications and administrative feasibility. Tax systems in many African countriesincluding Tanzania score low on most of these criteria.
3.3.1.2 Tax Institutional Framework at Local government Level
Local councils are responsible for the provision of public services including primaryeducation, primary health, local roads, potable water, sanitation, agricultural extension etc.The bulk of the funding for these services comes from central government. However theCentral Government has extended powers to Local Government Authorities (LGA) to collectrevenues and find other sources of revenue. Local government taxes, however, maycontribute 5% or less of total tax revenues in the country. There is no uniform rate at whichthe district councils are advised to charge agricultural outputs. Likewise the law does notspecify which agricultural products are liable for levy, tax or cess.
The district councils are given the authority to tax up to 5% of the value of the crop. The taxrates (specific or ad valorem) have to be determined in the by-laws, which have to bereconfirmed by the Prime Minister’s Office. The Prime Minister’s Office has no adequatemanpower with expertise to make a thorough evaluation of the proposed by-law and makea reasoned decision. As a result there are considerable variations in the rates and amountsof local taxes. Like the district councils, the village councils are allowed to look for sourcesof revenues within their villages, so as to assist them in fulfilling some administrativeactivities at the village level.
The administration of taxes is undertaken under the general supervision of the PermanentSecretary to the Treasury and the respective municipal and district councils. Widespread taxresistance is observed in many local authorities. Many local governments rely heavily onsimple physical coercion to ensure compliance. Roadblocks manned by the local militia orpolice and village-by-village invasions by collectors are frequently used as tools of taxenforcement. Moreover, harsh tax enforcement combined with poor service deliverycontributes to undermine the legitimacy of the local government and increases tax resistance.
Albeit the general description given above on taxation regime is based on the governmentview point; it may have little to do with the real situation on the ground. This is because thetaxation regime does not take into consideration heterogeneity among farmers. It is possiblethat it creates incentives to medium and large scale farmers and ignores the smallholderfarmers who form the majority of the farming community in Tanzania. Smallholder farmersare mainly affected by taxes, levies and fees at LGA level. A list of taxes, levies and feesapplicable for different actors along the agricultural value chains depending on the natureof business is give in Table 3 below.
14 Barriers to trade for smallholder farmers in Tanzania

15Barriers to trade for smallholder farmers in Tanzania
Table 3: A matrix of taxes, levies and fees paid by different actors
S/No Tax S/No Tax
1 Corporate Tax (30% of net profit) corporations 17 Education fund
2 Corporate Tax (25% of net profit) listed at DSE 18 District Development Levy
3 Value Added Tax (18%) 19 Village levies
4 Distribution Tax (10%) 20 Processing, buying and export license
5 Withholding Tax on Goods & Services (2%) 21 Board fee (1-3% f.o.b.)
6 Withholding Tax on Technical Services Fees (15%) 22 Stamp duty (1.2% f.o.b.)
7 Withholding Tax on Interest (10%) 23 Export duty (2-10% f.o.b.)
8 Withholding Tax on Royalties (15%) 24 Land rent
9 Withholding Tax on Rental Income (15%) 25 Property tax
10 Skills & Development Levy (6%) 26 Auction fees
11 National Social Security Fund (10%) 27 Primary society levy
12 Pay as you earn (PAYE) 28 Union levy
13 Import duty (10-25%) 29 Apex levy
14 Excise duty (7-30%) 30 Council levy
15 District Produce Cess (0-5%) 31 Research levy
16 Industrial cess (0.3%)
Source: Extracted from TRA tax guideline publications and crops Acts
Elaboration on how these taxes are charged in a practical sense could be provided in twooutlined ways:
(a) The Way Taxation Affects Initiative in agriculture
Agricultural Council of Tanzania (ACT), which is apparently the umbrella organization forthe agricultural private sector in Tanzania, once documented the way the taxation system inthe agricultural sector in Tanzania is such a huge burden, financially and administratively,that farmers and producers are deprived of initiative and engagement in productive activities(Box 2)

Box 2: The Way Taxation Eats Initiative in agriculture
Though the Government is reviewing the tax structure to rationalize it and make it businessfriendly to local and foreign investors, taxes are still duplicated on producers by centralgovernment and local government authorities. The multiplication of taxes also meansexpanded administrative burdens on tax payers.
From the huge selection of taxes put on agricultural producers, a number of them areespecially burdensome: The produce cess is based on the turnover rather than profit and isthus a special problem for farmers who often make losses. Moreover, this tax is 5% of theturnover, 17 times more than industrial producers have to pay. Produce Cess should berestricted to 0.3% of the farm price to be par with industrial producers or be removedaltogether. In the fisheries sub-sector, produce cess like landing fees, service levy and fishlevy are burdens for fishermen who can compare themselves with colleagues in Kenya andUganda who are charged only small or no levies.
In addition the produce cess is an object to different interpretations by different localauthorities. VAT on agricultural processed products should be removed and agriculturalprocessors exempted from paying VAT, believes ACT. The system of VAT makes it almostimpossible for small scale farmers to qualify for VAT registration and hence have VATrefunds.
Furthermore, some sub-sectors are especially affected by the VAT regime. For example,sugar-cane farmers are unlike their counterparts in other crops taxed on land preparation,cane cutting and transportation to factories. But usually the farmers can’t deduct the VATbecause they are too small to register. Also in the dairy industry, VAT such as on importeddairy processing equipment is putting a burden on the producers and is adding to theincrease of production costs. If producers didn’t have these comprehensive financial expensesthey could compete with counterparts in regional and international markets, believes ACT.
For producers who can be refunded, the system still means problems since processors haveto pay taxes and later claim them from TRA. But the procedure is so long that it often willslow down other operational procedures with economical losses as result, says ACT. The listof tax on agriculture producers doesn’t end here. Corporate tax is currently 30%. It shouldbe reduced to 10% like for instance in Malawi, believes ACT. Payroll levies should be reducedor abolished – now they are serious disincentives for producers to offer employment at atime with massive unemployment and underemployment. Fuel tax or exercise duty on fuelis real burden for farmers who have to pay a Road Tax of 60% even if they use the fuel ontheir farm. It should be reduced to a maximum of 10%, says ACT.
Land rent is currently 200 Tsh per acre after being reduced from 600 Tsh due to massiveprotests. But the reduction is not enough, thinks ACT. Big scale farmers suffer heavily underthis tax. A ranch with about 48.000 hectares has to pay 24,000,000 Tsh every year beforehaving sold anything. There is one tax ACT would like to welcome – the import duty ofcompeting products. In order to encourage local production, the Government should imposeimport tariff in imported products competing with locally available substitutes such as oilseeds, dairy and poultry products.
16 Barriers to trade for smallholder farmers in Tanzania

17Barriers to trade for smallholder farmers in Tanzania
(b) Taxes, Levies and Fees on Maize marketing system in kongwa/kiteto Area
To complement general issues on tariffs on agricultural commodities specific examinationof the taxes on maize was made in areas that supply Kibaigwa bulk maize market. About 75percent of the maize delivered at Kibaigwa market is from Kiteto district. As such the studyexamined the route that maize takes from the villages to Kibaigwa market to ascertain thelevies and other statutory deductions along the route.
It was observed that levies on maize from Kiteto district take three different forms namelyKongwa district cess, Kiteto district cess, and Kibaigwa market levy. When the marketstarted, Kongwa district cess (Ushuru wa Halmashauri) was 50 cents per kg but has beenincreasing over years to TSh 2.5 per kg. But with effect from January 2012, the rate will beTSh. 5 per kg. Although in absolute terms the cess has been increasing, but in relation to themaize price the levy seems to be more or less constant. Between 2004 and 2011 the levy hasranged between 0.4-0.7 percent of maize price.
Two important things could be noted:l Although it is assumed that the cess is paid by buyers, its incidence falls on farmers.
Buyers ensure that this extra cost is passed on to farmers in terms of paying lowerprice that they would otherwise pay without it,
l Levy paid by a maize farmer in Kiteto selling the crop at Kibaigwa market in 2011was found to be TSh 8,120 per 124 kg bag or about TSh 66 per kg. Although this maylook little amount of money not worth making noise about, but for a farmer whoseproducer price is already below production costs, any small deduction is burdensome.Computation of production costs indicates that, it costs TSh 273 to produce a kilo ofmaize. But the producer price per kilo is TSh 220 during peak season and TSh. 420during off-season. This implies that the profit margin per kilo of maize is negative(loss) TSh 52.8 during peak period and TSh. 147 during off-season.
(c) Taxes, Levies and Fees on coffee marketing system in karagwe district
In the case of coffee marketing system in Karagwe district, not many taxes, levies anddeductions were observed. The only levy charged to coffee buyers was found to be thedistrict cess of 3% of producer price. There were virtually no direct levies on the part ofsmallholder farmers. The following could be said about coffee marketing system in regardto levies:
l Buyers are charged a District cess of 3%. This seems to generate adequate revenue forthe LGA, that’s why no extra charges are demanded. For example during 2009/10financial year, Karagwe district council collected TSh 1.3 billion on cess from Coffee.
l The way produce cess is charged is disincentive to the effort because it is charged ongross revenue as per unit value (5% of price). Charging produce levy on per valuebasis penalises hard working farmers whose crop fetches premium prices.
l According to the Local Government Financial Act of 1987 LGAs have discretionarypowers to charge produce cess of 0 – 5% of farm gate price. However most districts

have resorted to the maximum allowable rate of 5%. However, in some localgovernments, for example Karagwe District it is currently 3%.
l It should be noted that the term “farm gate price” on which the cess is based is notdefined in the Act. The law was enacted when there was a clear distinction betweena producer and a buyer. But at the moment a producer can increase the ownership ofthe crop along the value chain until at the export point when he/she receives exportprice. But in charging the cess, this is treated as farm gate price!
l Communication with Tanzania Coffee Board (TCB) indicated that traders of coffee inaddition to the cess, they pay 0.75% of the total value as research fee, 0.005 US$/Kgas export permit fee & 0.0045 US$/Kg as exporter contribution to industry.
3.3.2 Non-tariff Barriers
Conducive business climate is good for growth of the economy, and barriers to trade aregenerally regarded as an indicator of a bad business climate. It is in this context that the EACcustoms union protocol, which commits the member states in the region to the eliminationof tariff barriers, was signed in February 2004. The expected practical impact of the protocolis expanded trade and cooperation of the partner states that offers the prospects of economicgrowth and prosperity for East Africans.
However, for this outcome to be realized, the business sector in East Africa had drawnspecific attention to the existence of non-tariff barriers (NTBs) and other business climatefactors that could act as impediments towards the realization of smooth trade and investmentin the region. This arose because the business community in East Africa had beenexperiencing many nontariff barriers (NTBs) in cross border business transaction in theregion.
3.3.2.1 Identification of Non-tariff Barriers
The major non-tariff barriers (NTBs) identified are in the area of business registration andlicensing; customs procedures; police road checks; road axle regulations and control; andstandards and certification requirements. The study was designed to identify factors whichwere driving the foregoing NTBs and business climate factors in the region. This analysisstarts by examining barriers at aggregate level by reviewing the findings of a study on Non-Tariff Barriers & Development of a Business Climate Index in the East Africa Region thatwas commissioned by the East African Business Council (EABC) in collaboration with theGTZ in 2005. Although the study is a bit old but its findings are still relevant today.
These results were averaged and aggregated by country as presented in appendix 2 of thispublication. The details on some specific NTBs are elaborated below.
(a) Time Taken for Documentation at Border Crossings
Non-tariff barriers related to border post procedures especially those related toDocumentation at crossings was found to takes more than 1 hour in the majority of cases.The situation was worst in Uganda where respondents indicated that in more than 50% of
18 Barriers to trade for smallholder farmers in Tanzania

19Barriers to trade for smallholder farmers in Tanzania
the cases, customs formalities took more than 2 hours. Since the procedures at customs,immigration and police checks are sequential, the total period could be more than 3 hours.This period is too long by any standards, and causes of delays have to be investigated andremoved (Table 4).
Table 4: Time for Documentation at Crossings
Source: TNBC/GTZ Report on NTBs 2005
(b) Time for Procedures at Border Posts
Pre-shipment inspection is completed within a day for at least 60% of the cases in Tanzaniaand Uganda, and in less than 20% of instances are these procedures delayed beyond a week.In Kenya on the other hand businesses experience the longest delay overall in completingthe clearance formalities (Table 5).
Table 5: Time for Border Post Procedures
Source: TNBC/GTZ Report on NTBs 2005
Procedure Country
KenyaTanzania
Tanzania
Tanzania
Uganda
Uganda
Uganda
Kenya
Kenya
Within 15minutes
15-60minutes
1 to2 hours
over 2 hours
Over 1 hours
Customs
Immigration
Police check
31%45%
45%49%
41%63%
52%
22%
37%47%
57%
17%
17%
13% 39%
29%
29%
25%
12%12%
12%
6%
4% 8%6%
6%
16%
16%
16% 12%
14%14%15%
15%
26%
25%
12%34%28%11%
10%
10%27%
77%
77%
Procedure
Pre-shipment inspection
Time to unload
Country
Kenya
Kenya
Tanzania
Tanzania
Uganda
Uganda
38% 38%
32% 51%
41%
63%
61%41%
17%13%9%
10% 24%
23% 27%
19%
19%
19%9% 18%10%
10%
20% 20%11%13%15%
22%
24%
59%
Within1 day
2 to 5days
6 to 10days
Over 10
daysOver
1 week

(c) Time for Business Registration and Licensing
In all the EA States, registration and licensing is completed within a week for the majority ofthem. Uganda experiences relatively higher level of delays considering one quarter of theenterprises indicated it takes more than 2 weeks to complete the registration and licensingformalities (Table 6).
Table 6: Time for Registration and Licensing
Source: TNBC/GTZ Report on NTBs 2005
(d) Road Blocks, Weighbridges and Standards
Overall, the majority of businesses in EA do not regard these three sets of NTBs asconstituting serious obstacles. In relative terms, Kenyan businesses appear to be moreaffected by these NTBs than the other 2 EA states (Tanzania & Uganda), especially in respectof police road blocks and weighbridges (Table 7).
Table 7: Responses on Road Blocks, Weighbridges and Standards
Source: TNBC/GTZ Report on NTBs 2005
Procedure
Home country
Other countries
Country
Kenya
Kenya
Tanzania
Tanzania
Uganda
Uganda
67%76%50%80%90%79%
14%7%25% 25%7%5%
5%
10%
13%12%
6%2% 4%3%
10%
19%
11%
13%
17%15%7%
7%
3%8%
1 to 5days
6 to 10days
11 to 30days
over 30days
over 2weeks
NTB Category
Police Road Blocks
Weighbridges
Standards & Certification
Country NoObstacle
MinorObstacle
ModerateObstacle
MajorObstacle
Kenya 31%
38%46%40%
48%52%
54%
56%
69%
62%
70%
77%
30%23%18%
24%19%
24%
18%
16%
18%
15%
12%
24%
18%17%23%
15%15%
13%
14%
8%
11%
9%
7%
25%
15%14%19%
13%13%
9%
12%
7%
8%
6%
4%
19%
Kenya
Kenya
Tanzania
Tanzania
Tanzania
Uganda
Uganda
Uganda
Overall EA
Overall EA
Overall EA
20 Barriers to trade for smallholder farmers in Tanzania
21Barriers to trade for smallholder farmers in Tanzania
3.3.2.2 Awareness of EA governments of the Existence of NTBs
The study under review noted that the three old EAC governments through officials whoparticipated in the survey, demonstrated awareness of the problem of NTBs, and their impacton smooth flow of commodities in the EA region. However they felt that critical NTBsimpacting negatively on the business climate were corruption, shortage of power (electricity),availability of skilled labour, access to land and tax administration, which they argued thatthe situation was that bad.
But this perception was not shared with stakeholders in the business sector who perceivedthese factors to be requiring urgent intervention by government. Such kind of perceptiondivergence creates grounds for meaningful policy dialogue between governments and thestakeholders in the business sector. Nevertheless, the fact that the governments acknowledgeexistence of NTBs is critical observation since governments are likely to be cooperative whenit comes to policy dialogues with the stakeholders on ways to reduce and/or eliminate NTBs.
Country variations in terms of perceptions of impact on the business climate occurred in thecase of access to finance where Ugandan government perceived the situation of access to bebad while in Kenya it was rated good and in Tanzania it rated merely good. Water supplywas rated positive in Uganda but negative in Tanzania.
3.3.2.3 Non-tariff Barriers in the Maize marketing system in kongwa/kiteto Area
A number of observations were made regarding NTBs in the flow of maize from Kitetodistrict to Kibagwa market in Kongwa district. The observations are summarised below.
l Levy is imposed immediately maize crosses the border of the ward where it has beenproduced. This does not take into consideration whether the maize is for householdconsumption or for commercial purposes.
l A common practice is for district councils to outsource the service of levy collection.Kiteto district council has outsourced AMCOS for the same purpose for 2011/12 financialyear. Normally the outsourced agent sets a series of road blocks and employswatchman/guards to ensure that every crop crossing the post has paid the levy.
l Road blocks are many. For example to move maize from Lukeli village to Kibaigwamarket there are 6 road blocks – at Lemenye, Mkulenda, Nati, Ngese, Ngomayi, andManyata. At each road block there is considerable delay. The farmer has to show a receiptbut sometimes the guard rejects the quantity of maize quoted on the receipt on guise ofunder-declaration. This sometimes necessitates offloading and recounting of bags fromtracks or tractors. If this is performed at every road block one could imagine the amountof time lost. Focus Group Discussions (FGD) with farmers and traders highlighted thatin some cases a delay at a road block may take up to 4 hours.

l To avoid such delays and related disturbances, some farmers resort to bribery. Theopportunity cost of offloading and reloading at a road block is too high to bear. TheFGDs established that bribery at a road block ranges between TSh. 3,000 – 5,000 for40-50 bags. If a farmer is not lucky he or she may have to pay at all road blocks (gates).
l Another NTB identified by stakeholders at Kibaigwa was the ban on cross-border tradeon cereals especially maize. This has reduced the number of buyers from outsideTanzania, especially Kenya. As a result the prices of maize have not been high enoughas expected by stakeholders.
l Another significant barrier that was observed in Kongwa/Kiteto area is the decision ofthe Kiteto LGA to evict maize farmers from the district who allegedly invaded a reservedarea in Kiteto. This decision threatens the sustainability of Kibaigwa as a glorious maizemarket in Tanzania. This is because about 70 percent of all the maize supplied atKibaigwa comes from the evicted area. Although the LGA decision is understandable;an endeavour to balance the compelling needs of biodiversity conservation andeconomic development, there is a need to consider the negative multiplier effect of suchdecision. The number of people that are deriving livelihood from Kibaigwa and the lossof revenue for Kongwa district council have to be factored in the equation.
3.3.2.4 Non-tariff Barriers in the Coffee Marketing System in karagwe District
A number of observations were made regarding NTBs in the flow of coffee in Karagwedistrict. Some of the obstacles could be understood when considered in relation to the coffeesector in the neighbouring country of Uganda. Such comparison is important because asignificant amount of coffee from Karagwe district is smuggled to Uganda. According to astudy on Kagera Coffee Marketing System carried out by the Ministry of Industry, Trade &Marketing (MITM) in 2006, about 60% of coffee produced in Kagera region is sold to Ugandain a black market. On this background it is imperative to present comparison betweenparameters of the marketing systems in the two countries (Table 8).
22 Barriers to trade for smallholder farmers in Tanzania

23Barriers to trade for smallholder farmers in Tanzania
Table 8: NTBs in the coffee marketing system Tanzania and uganda compared
S/N Service ugandan System Tanzanian System
1. Coffee procurement and A farmer has up to six buyers: Mostly through primary farm gate competition unregistered middlemen, society or contract buyer.
a processor, store operator, Very limited competitionexporter, farmer associations or export
2. Bagging material Buy jute bags that are cheaper Compelled to buy sisal bags that are expensive
3. Coffee processing Private coffee dealers have own Private coffee dealers facilities availability processing facilities. They buy have been discouraged to
raw, process and export it. own processors by single license system.
4. Turn over period Turn over period is 3 – 7 days Turn over period is 2 – 8 weeks
5. Availability of external They have and use them to make They do not have themmarkets’ associates them fluid limiting them the power
to buy and pay on time
6. Coffee market promotion Uganda Coffee Development TCB and Tanzania Authority (UCDA) and Uganda Government havegovernment assist to publicise managed to establish Ugandan coffee abroad. UCDA only one coffee bar in has established coffee bars in Japan.Denmark, Egypt and China
7. Marketing Structure Fully liberalized; the chain is Monopolistic, short and less costly long and high
institutional cost
8. Farmer payment Fast (3 – 7 days) Delayed (2-8 weeks)
9. In-put supply Accessible and used Not accessible
10. Coffee quality Low but compensated by High but results in lowefficient grading process volume
11. Financing services Available at various sources at Available through low interest rate 5-8% limited sources and at
high interest rate 14-20%
12. Processing facilitates Many and committed to quality Few and not committed of product to quality of product
13. External market Accessible by any coffee dealer Dependent on one outlet - TCB
14. Market Promotion Very aggressive and globalised Limited
15. Licensing procedure Simple and less bureaucratic Long and bureaucratic
16 Market information Well developed and have village Limited to TCB and fewinformation centres local coffee dealers
Source: Discussion with stakeholders

One thing that distinguishes Tanzania’s coffee marketing system and Uganda’s is the levelof liberalisation. Uganda’s system has been fully liberalised and thus competition,aggressiveness and innovativeness are common features in Uganda. As a result Uganda’scoffee marketing system is more efficient than Tanzania’s.
It was also observed that recently Karagwe District Council:• Has imposed restriction on buyers to load coffee into tracks from warehouse at
village level in the absence of LGA officer to verify the amount of coffee procured. Inmost cases it is difficult to get hold of these officers every time a buyer wants to goto the villages.
• After the officer has verified the amount of coffee loaded, the buyer has to go to thedistrict council to collect a permit from the District Executive Director (DED) thatallows him/her to transport coffee from the village. Sometimes DED is not in officeand the buyer has to wait until the DED is back in the office. All this means extra costas the buyer has to pay waiting charge to the transporter.
• Also, recently the District has decided that all coffee buyers in Karagwe district haveto contribute TSh. 500,000 to the recently launched campaign against coffeeracketeering to Uganda
24 Barriers to trade for smallholder farmers in Tanzania

25Barriers to trade for smallholder farmers in Tanzania
4. AgRICuLTuRAL MARkET ACCESS ADvOCACy STRATEgy FORTANZANIAN SSF
Based on the findings of the study and other experiences, it is suggested that the coreobjective of a strategy to enhance market access for smallholder farmers be to increase thequantity and quality of agricultural commodities sold to the East African Common Marketand even the market of developed economies of the world. This could be achieved throughvalue chain development (VCD) for selected crops. This implies improvement of cooperationbetween stakeholders of a particular sector and the coordination of their activities alongdifferent levels of a chain with the ultimate aim of satisfying the needs of the end customeror buyer. In order to achieve this, the following triggers must be addressed:
4.1 System EfficiencySystem economic efficiency describes the way in which a given target is achieved and thecosts that are related to this process. The less the costs needed to achieve a target, the moreefficient the production process is. It entails examining how stakeholders communicate witheach other; their relationship to each other; where in the chain it comes to unnecessary delaysand costs; how information and knowledge is passed down the chain; what kind of servicesare provided within the chain; the role of every value chain stakeholder; how reliable andflexible stakeholders react to orders etc.
4.2 Product Quality and Specifications If smallholders want to access and stay in the market, they need to make sure that theirproducts and services meet continuously changing market requirements and demandconditions. What counts, is the end product that the consumer receives, and the level ofsatisfaction that it creates. Apart from looking at how market requirements and demandconditions can be fulfilled, there is a need to know exactly, what these requirements,conditions and standards are. Standards like: ISO norms, Health standards such as HACCP(Hazard Analysis Critical Control Point), Good Agricultural Practices (GAP), GoodManufacturing Practices (GMP) etc.
4.3 Product Differentiation (Competition) Consumers are always demanding new products that require value chain partners to shareinformation and systems or provide unique specialized inputs (e.g. special varieties,trademarked processes, unique genetics, etc). These products often require consistently highquality, proof of adherence to protocols and legislated standards throughout the production,processing and marketing channels. Remaining competitive on the market requirescontinuous innovation. The product quality, design and specifications need to be updated;the production process, technology and methods should be upgraded; new raw materialsand input factors can be used to produce a product in a new quality; new markets are thereto be discovered; local enterprises can add value by taking in the next step in the value chain.Public Private Partnership is essential to help emerging smallholder farmers-based Smalland Medium scale Enterprise (SME) to develop differentiated products that are able tocompete with others on the market.

4.4 Improve Social and Environmental Standards Consumers are increasingly becoming more conscious of social and environmental standardsand are increasingly demanding products that fulfill these requirements. Such requirementsmay include abolishment of child labour, labour exploitation, organic products, highenvironmental standards, etc. If these standards are ignored, farmers would simply loosethe market to those competitors who do comply with social and environmental standards.Value chain actors should always seek information on what the demand conditions withregard to product quality, design and price are; whether their product fulfils the buyers’demand; presentation of the product; the kind of packaging used; and provision of sufficientcustomer service along with a product that they sell.
4.5 Enabling business environment Every value chain entity operates in a business environment that consists of mainly twodimensions: immediate environment and wider environment. Immediate environment isdetermined by the market conditions, existing regulations and administrative proceduresand interventions carried out by public service providers or development agencies – all ofwhich directly interact with other actors and affect system performance. On the other hand,the wider environment, does not directly interact with operators, but certainly has a greatinfluence on their ability to compete on local and international markets. The widerenvironment would include for example monetary and fiscal policies that determine stabilityof prices and the availability of low-interest credits; school education and vocational trainingwhich lays the foundation for a national economy to develop itself and compete with othercountries; infrastructure which greatly influences the availability of production factors,delivery times and costs.
In order to fulfil the ambitious goal of value chain development, PELUM and ESAFF incollaboration with other stakeholders should work towards the goals proposed in Table 9below, which implicitly address the 5 triggers outlined above.
26 Barriers to trade for smallholder farmers in Tanzania
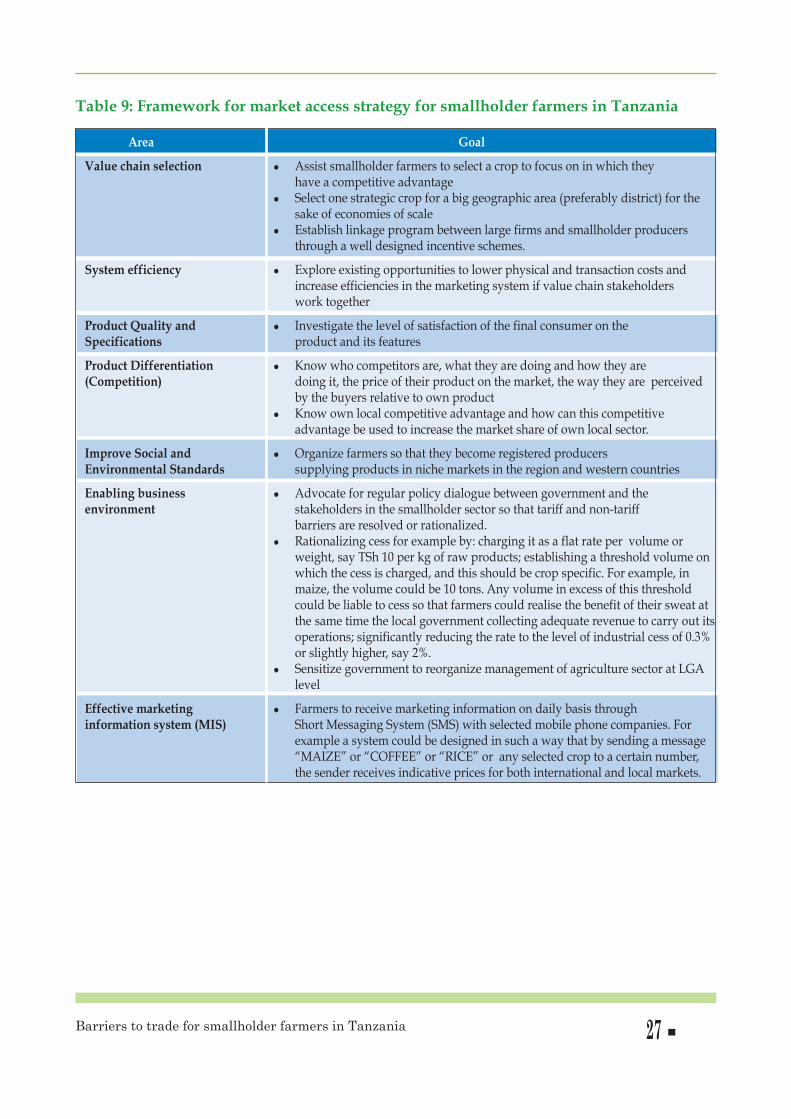
27Barriers to trade for smallholder farmers in Tanzania
Table 9: Framework for market access strategy for smallholder farmers in Tanzania
Area goal
value chain selection l Assist smallholder farmers to select a crop to focus on in which they have a competitive advantage
l Select one strategic crop for a big geographic area (preferably district) for the sake of economies of scale
l Establish linkage program between large firms and smallholder producers through a well designed incentive schemes.
System efficiency l Explore existing opportunities to lower physical and transaction costs and increase efficiencies in the marketing system if value chain stakeholders work together
Product Quality and l Investigate the level of satisfaction of the final consumer on the Specifications product and its features
Product Differentiation l Know who competitors are, what they are doing and how they are(Competition) doing it, the price of their product on the market, the way they are perceived
by the buyers relative to own productl Know own local competitive advantage and how can this competitive
advantage be used to increase the market share of own local sector.
Improve Social and l Organize farmers so that they become registered producers Environmental Standards supplying products in niche markets in the region and western countries
Enabling business l Advocate for regular policy dialogue between government and the environment stakeholders in the smallholder sector so that tariff and non-tariff
barriers are resolved or rationalized. l Rationalizing cess for example by: charging it as a flat rate per volume or
weight, say TSh 10 per kg of raw products; establishing a threshold volume on which the cess is charged, and this should be crop specific. For example, in maize, the volume could be 10 tons. Any volume in excess of this threshold could be liable to cess so that farmers could realise the benefit of their sweat at the same time the local government collecting adequate revenue to carry out its operations; significantly reducing the rate to the level of industrial cess of 0.3% or slightly higher, say 2%.
l Sensitize government to reorganize management of agriculture sector at LGA level
Effective marketing l Farmers to receive marketing information on daily basis through information system (MIS) Short Messaging System (SMS) with selected mobile phone companies. For
example a system could be designed in such a way that by sending a message “MAIZE” or “COFFEE” or “RICE” or any selected crop to a certain number, the sender receives indicative prices for both international and local markets.

5. CONCLuSION AND RECOMMENDATIONS
5.1 Conclusion
The study has explored a number of issues regarding impediments to trade for small-scalefarmers in Tanzania, and has culminated in this comprehensive report. It has beendemonstrated that Tanzania has huge potential to meet the local and regional food demand.Policies and strategies have been put in place to harness this potential and transform therural sector, but not much has been achieved in this regards. The main problem has beencited as a mismatch between policy documents and initiatives put in place to operationalizethe policies.
5.2 Policy and Advocacy Recommendations
Based on the findings of this study, recommendations on selected feasible aspects of marketaccess are made after taking into consideration all important issues:
i. PELUM and ESAFF in collaboration with other stakeholders should come up with acomprehensive strategy for enhancement of market access for smallholder farmers inTanzania. Inter alia, this should entail making Tanzania a centre of excellence inproduction of selected and well researched crops. The value chain developed should becarried out in which smallholder farmers are organized (for example through blockfarming) to effectively engage in the selected value chain.
ii. For effective transformation of small scale farmers from subsistence to commercialfarming the role of the government is paramount in terms of financing the sector. At themoment the billions of money spent on agriculture through Agricultural SectorDevelopment Program (ASDP) are spread thinly with no impact. The governmentshould be sensitised to use ASDP fund to support selected value chains preferably onecrop per district.
iii. The current management of agriculture at Local Government Level renders servicedelivery ineffective because of too much politicisation from councillors (madiwani). Thereis a need to convince the government to implement agricultural programs directly fromthe ministerial level.
iv. Policy dialogue between the government and Civil Society Organizations (CSOs)engaged in addressing interest of smallholder farmers should be established specificallyfor the purpose of addressing tariff and non-tariff barriers on a regular basis. Thisarrangement would be educative and informative on both sides (government and otherstakeholders). It would inform the government side of the impact of the barriers to tradeand would inform the stakeholders on the concerns of government.
28 Barriers to trade for smallholder farmers in Tanzania

29Barriers to trade for smallholder farmers in Tanzania
v. In Tanzania marketing information analysis and dissemination is inadequate, especiallyfor smallholder farmers in rural communities who are conceptually disconnected frommarkets. Farmers mainly depend on private traders for price information. There shouldbe a strategy to correct this anomaly. There is a need to establish an effective marketinginformation system (MIS) which could ensure that information is disseminated to targetstakeholders on timely basis.
vi. District crop cess rates should be rationalised to stop punishing aggressive farmers whoproduce quality commodities that fetch premium prices. Different alternative waysshould be sought in a participatory manner to achieve this.
vii. Small scale farmers should be organised into legal and viable economic groups not onlyfor pooling their resources together in order to satisfy the needs of the consumer butalso for prolonging the ownership of their commodities along the value chain. Thiswould ensure that the value accrued in the marketing process could trickle to producersinstead of the current situation where the value added along the commodity chains endsup in the hands of transporters, processors, and other service providers.

REFERENCES
Agriculture Non-state Actors Forum (2011). Budget Analysis for ASDP and DADP Funds inTanzania.
Budgets and progress reports for respective years for Bukombe, Kibondo, Kahama, andLindi District Council
Controller and Auditor General Report, June 2010
East African Business Council (EABC) (2005). A Study on Non-Tariff Barriers (NTBs) &Development of a Business Climate Index in the East Africa Region. GTZ Project of“Support of Regional Business Organizations in East Africa (SRBO-EA).
ESA-BMO Network (2009). Policy Advocacy Strategy: Improving SME Market Accessthrough Public and Private Procurement.
Food Security and Nutrition Working Group (FSNWG) (2011). East Africa Cross-borderTrade Bulletin: July-September 2011.
Herr, M. L. (2007). An operational guide to Local Value Chain Development CombiningLocal Economic Development (LED) with Value Chain Development (VCD) to strengthencompetitiveness and integration of SMEs into markets. International Labour Organisation(ILO) Enterprise for Pro-poor Growth (Enter-Growth), Colombo, Sri Lanka.
The East African Grain Council (EAGC): RATIN Regional Agricultural Trade IntelligenceNetwork; East Africa Food & Trade Bulletin, Jan ‘09 (No. 51)
The Economic and Social Research Foundation (ESRF) (2011). What Benefits can TanzaniaDerive From the East African Common Market (EACM) Arrangement? TanzaniaKnowledge Network (2011). TAKNET Policy Brief Series No. 17 – 2011
The Technical Centre for Agricultural and Rural Cooperation (CTA) (2002). MarketingStrategies for Small-Scale Farmers. Rural Radio Resource Pack: Sharing knowledge,improving rural livelihood.
United Republic Of Tanzania (2006). A Study on Kagera Coffee Marketing System. MinistryOf Industry, Trade & Marketing. BACAS-SUA.
United Republic of Tanzania (2012). National Sample Census of Agriculture 2007/2008: Small HolderAgriculture. Volume II: CROP SECTOR – NATIONAL REPORT.
VECO Tanzania (2006). National Stakeholders’ Workshop on Smallholder Farmers’ Accessto Markets in 2015. 22nd and 23rd March 2006 Dar es Salaam, Tanzania.
30 Barriers to trade for smallholder farmers in Tanzania

31Barriers to trade for smallholder farmers in Tanzania
APPENDICES
Appendix 1: Names of people and institutions contacted for information
S/N Names of the people Title of the person and the institution
1 Salvatory Kahama Accountant with KADERES
2 Jovin Bifabusha Marketing manager KADERES
3 Titus Tobia Itegereize General manager –Karagwe Estate
4 Titus Tobia Itegereize Managing Director Kibanda Farmers’ Association
5 Gabriel Bitama Executive Secretary NguvuMali Farmers Cooperatives Society Limited
6 Audax Rukonge Coordinator, ANSAF
7 Fortunatus Simbuta Market Board-Kibaigwa
8 Mr. Dalali Kibaigwa market manager
9 Mr. Said Kibaigwa market accountant
10 Julius Mtagwa Kibaigwa market statistician
11 Aulerian Mkucha Kiteto farmer
12 William Msume Kieteto farmer
13 Dicksom Nzogoni Kiteto farmer
14 Richard Kevela Kongwa farmer

Appendix 2: Non-tariff barriers to trade for three old EA states – responses frominterviewees
Parameters/Country kenya Tanzania ugandaNo. of respondents 195 140 249Overview-Admin 1.473 1.262 1.339
Customs 1.794 1.417 1.466Immigration 0.957 0.926 0.99Transiting 1.166 1.034 1.456Police checks 1.291 1.103 0.878Licensing 1.021 0.867 0.777Corruption 2.005 1.639 1.827Duty/Taxes 2.078 1.847 1.977Business registration & procedures 1.579 1.309 1.400
Business registration 1.09 0.912 0.917Business Licensing 1.138 0.999 0.955Admini procedures 1.709 1.343 1.39Customs regulations 1.739 1.509 1.503Customs operating hours 1.786 1.186 1.381Delay at borders 1.839 1.545 1.737Skills deficiency 1.548 1.38 1.496Failure to clarify 1.811 1.465 1.632Corruption 1.551 1.439 1.589Time at Border Posts 1.561 1.399 1.509
Customs 2.122 1.802 2.302Immigration 1.348 1.167 1.327Police checks 1.211 1.229 0.899Time for Customs Clearance 1.548 1.621 1.537Pre-shipment inspection 1.232 1.526 1.203Time to unload 1.864 1.717 1.872Registration & Licensing Time 1.458 1.045 1.127Home country 1.365 1.128 1.106Other countries 1.551 0.962 1.148Police and Road Blocks 1.534 1.164 1.299Too many road blocks 1.538 1.106 1.157Corruption 1.53 1.222 1.44Weighbridges 1.499 1.272 1.238
Weighbridge inaccuracy 1.487 1.335 1.098Inappropriate axle load limits 1.608 1.25 1.387Corruption 1.519 1.307 1.342
Source: Compiled from EABC/GTZ Report on NTBs 2005
32 Barriers to trade for smallholder farmers in Tanzania