Embed Size (px)
Citation preview

Measuring the Social and Economic Impact of Sport in England
Report 2: The Economic Importance of Sport and Physical Activity in England
This report was prepared by the Sport Industry Research Centre (SIRC) at Sheffield Hallam University for Sport England.

This report has been prepared by the Sport Industry Research Centre (SIRC) at Sheffield Hallam University. The report has been commissioned by, but does not necessarily represent the views of Sport England. The views expressed within this report represent those of the authors.
Dr Themis Kokolakakis Elizabeth Christy Dr Larissa Davies

Table of contents Executive summary........................................................................................................ i
1. Introduction .................................................................................................................. 1
1.1 Research overview .................................................................................................. 1
1.2 Report structure ...................................................................................................... 2
2. Methodology ................................................................................................................ 3
3. The sport economy in England .............................................................................. 7
3.1 Summary of key indicators ................................................................................. 7
3.2 Summary using constant 2016 prices ............................................................. 9
3.3 Consumer expenditure on sport ..................................................................... 10
3.3.1 Overall sport-related consumer expenditure on sport ................. 10
3.3.2 Community participation-related consumer expenditure on sport........................................................... 11
3.4 Sport-related GVA .............................................................................................. 14
3.4.1 Overall sport-related GVA ..................................................................... 14
3.4.2 Community sport participation-related GVA ................................. 15
3.5 Sport-related employment .............................................................................. 17
3.5.1 Overall sport-related employment ..................................................... 17
3.5.2 Community sport participation-related employment .................. 19
3.6 Summary of income and expenditure flows ............................................... 20
4. Conclusion ................................................................................................................. 21
4.1 The sport economy in context .......................................................................... 21
4.2 Summary ............................................................................................................... 22
5. References.................................................................................................................. 24
6. Appendices ................................................................................................................ 25
Appendix 1: Statistical sources ............................................................................... 25
Appendix 2: Model output ....................................................................................... 26
Appendix 3: Sources and methods ....................................................................... 37
Appendix 4: Definitions ............................................................................................. 43

List of tables
Table 3.1: Main sport-related indicators for England 7
Table 3.2: Consumer spending and GVA in constant 2016 prices 9
Table 3.3: Sport-related consumer spending in England (2017/18) 10
Table 3.4: Derivation of participation-related sport consumer spending in England 12
Table 3.5: Sport-related GVA in England (2017/18) 14
Table 3.6: Participation related sport GVA in England (2017/18) 16
Table 3.7: Sport-related employment in England (FTE) (2017/18) 17
Table 3.8 Participation related sport employment in England (2017/18) 19
Table 3.9: Sport-related income and expenditure flows (2017/18) 20
List of figures
Figure 3.1: Sport consumer expenditure in England (2017/18) 11
Figure 3.2: Sport employment in England (2017/18) 19
Figure 4.1: GVA England, selected industries, £m (2016 prices) 21

List of abbreviations
ABS Annual Business Survey
ASHE Annual Survey of Hours and Earnings
CPI Consumer Price Index
GDP Gross Domestic Product
GVA Gross Value Added
FES Family Expenditure Survey
FTE Full Time Equivalent
NES New Earnings Survey
NIA National Income Accounting
ONS Office for National Statistics
SIRC Sport Industry Research Centre
SROI Social Return on Investment
SSA Sport Satellite Account
VAT Value Added Tax
Glossary
Constant prices: Prices adjusted for inflation. In this report, the adjustment uses as basis the year 2016.
Current prices: Actual prices at a given time. They are also called market prices.
Gross Value Added: The difference between the value of sport-related goods and services produced and the costs involved in producing them. It roughly equates to wages/salaries and profits.

i
Executive summary
Over the last three years, Sport England has focused on bringing together evidence on the contribution of community sport and physical activity to the five outcomes identified in the UK Government strategy for sport. Building on this foundation and other previous work, Sport England commissioned the Sport Industry Research Centre (SIRC) at Sheffield Hallam University to quantify the financial, economic and social impact of sport and physical activity in England. This report presents part two of the research, which focuses on measuring the economic importance impact of sport and physical activity.
This report provides a 'snapshot' of the role and significance of sport and physical activity in England in 2017/18 and summarises the key sport-related indicators. These are consumer expenditure, Gross Value Added (GVA) and employment. The report applies the National Income Accounting methodology to derive, the main outputs without double counting. A comparison with the 2010 results is provided to illustrate the change in importance of sport to the English economy over a span of seven years. The report presents the key sport-related indicators for the overall sport and physical activity sector, and the community participation element of the sector.
In 2017/18, consumers in England spent £25,144m on sport and physical activity, of which 54% or £13,693m was related to community participation. Since 2010, this represents an increase of 24% (current prices) and 7% (constant prices). Consumer expenditure on sport in 2017/18 as a percentage of total expenditure in England was 2.4%. Important categories of sport-related consumer spending include sport gambling (21%), sport clothing and footwear (15%), subscriptions and fees (17%) and sport TV (12%). The remaining categories include a range of items such as boats and admissions to events.
Sport-related economic activity generated £23,894m GVA in 2017/18, of which 58% or £13,887m was related to community participation. Since 2010,

ii
the value of all sport-related GVA has increased 18% in current prices. This represents an increase of 2% in real terms (constant prices) over this period. The importance of sport, in terms of GVA, remained relatively stable from 1.7% of the national economy in 2010, to 1.6% in 2017/18. The small decline relates to the recession experienced in 2010 which did not affect sport proportionately, most likely because of the preparations of the London Olympics.
The sport economy in England generated 479,530 sport-related jobs (full time equivalent) in 2017/18, of which 60% or 287,874 was related to community participation. Sport-related employment accounts for 2.4% of total employment in England. It has increased by 9% since 2010. Sport-related employment was most heavily concentrated in the commercial non-sport sector (44%); followed by the commercial sport sector (25%), the public sector (22%) and the voluntary sector (9%). The share of sport-related employment has increased from 2.3% in 2010, to 2.4% in 2017/18.

iii

1
1. Introduction
Over the last three years, Sport England has focused on bringing together evidence on the contribution of community sport and physical activity to the five outcomes identified in the UK Government strategy for sport, Sporting Future - A New Strategy for an Active Nation (2015)1. These are physical wellbeing, mental wellbeing, individual development, social and community development and economic development. The aim of the Sport England review work was to assess the evidence base with a view to demonstrating the contribution of sport and physical activity to the government outcomes. Building on this foundation and other previous work, Sport England has commissioned the Sport Industry Research Centre (SIRC) at Sheffield Hallam University to quantify the financial, economic and social impact of sport and physical activity in England.
There are two complementary parts to the research. Part one focuses on the social impact of sport and physical activity using a Social Return on Investment (SROI) framework. Part two evaluates the economic importance of sport and physical activity using a National Income Accounting framework. This report is focused on part two of the research.
1.1 Research overview
The research presented in this report aims to provide a 'snapshot' of the role and significance of sport and physical activity in England in 2017/18. The research summarises the key indicators for the economic importance of sport and physical activity in England, which are: consumer spending, Gross Value added (GVA); and employment. The findings presented in this report identify the contribution of sport and physical activity to the economic development government outcome. In addition, the research presented in this report calculates for the first time the percentage of the sport economy that is explicitly associated with community participation. This has been derived in such a way that community sport-related GVA can be added to
1 HM Government. (2015). Sporting Future: A New Strategy for an Active Nation. [online]. https://www.gov.uk/government/publications/sporting-future-a-new-strategy-for-an-active-nation.

2
the social value of community participation from part one, to calculate an overall social and economic value for the sector. The combined value of sport and physical activity community participation is presented in the overarching summary report.
Previous studies have measured the value of sport in England in 2010 and in the English regions in 2008. This report will provide some comparative analysis with the 2010 results to illustrate the change in the importance of sport the English economy over a span of seven years. However, these comparisons are only indicative, due to methodological differences between the studies carried out in 2010 and 2017/182
1.2 Report structure
This report is structured as follows: Section 2 outlines the methodology; Section 3 presents the key indicators and Section 4 concludes with a discussion of the significance of sport and physical activity in England in comparison to other industrial sectors. The appendices in Section 5 provide more detailed information on the methodology used to construct the economic model, detailed tables per sector and data sources. Throughout the report 'sport' and 'sport economy' are used as overarching terms to include sport and physical activity.
2 For example the treatment of bicycles which is explained in the consumption section later.

3
2. Methodology
The SIRC model of economic impact assessment uses economic variables from official statistics as its basic input. Hence, with the sole exception of the voluntary sector, there is no need for collection of primary data.
The National Income Accounting (NIA) methodology provides the framework for this model, which is consistent with the UK National Accounts. The NIA methodology enables the sport economy to be disaggregated into seven sectors as outlined below.
• Consumers, including the personal or household sector. This sector shows sport-related expenditure by households, e.g. spending on sports clothing and footwear;
• Commercial sport, including spectator sport clubs, sport goods manufacturers and retailers. In this section, we include companies such as Nike, and professional football clubs. We also include the section of the media associated with sport TV, sport publications, gyms and keep fit centres under private ownership.
• Commercial non-sport, which includes suppliers involved in the production of sport-related goods and services. This sector includes commercial companies that do not provide a sport product, but which assist through the supply of inputs or revenue in its production. Examples include: a bank sponsoring a professional football club; the demand generated by the construction projects of sport clubs; utility requirements etc. In the case of sponsorship, the revenue received by the club represents a flow from the commercial non-sport sector to the commercial sport sector. Hotels serving sport-tourists are also classified in this sector;
• Voluntary, including non-profit making sport organisations such as amateur sports clubs run by their participants. Professional football clubs are not included in this category even if they are managed on a non-profit basis. In the report any employment associated with the voluntary sector is paid employment. It is true that this employment is supported by non paid labour; however the latter is not part of the

4
current economic analysis. Non-paid labour is included in the SROI study;
• Local government, including income from sport facilities, sport-related grants from central government and rates from the commercial and voluntary sector. The sector has expenses such as wages for labour (a flow towards consumers) and grants to the voluntary sector;
• Central government, including taxes, grants and wages on sport-related activities. For example, buying a ticket for a football match is recorded as two flows: one towards the government sector as Value Added Tax (VAT), and another towards the commercial sport sector for the remainder of the price;
• Outside the area sector, including all transactions with economies outside England.
We record income and expenditure flows between the seven sectors above. As a result we can draw up a set of income and expenditure accounts for each sector. The 'double entry' accounting principle is applied, so every expenditure flow from sector A to sector B is also an income flow in the sector B accounts. The income and expenditure accounts are then used to derive estimates for three economic indicators of the sport economy:
• Sport-related consumer expenditure; • Sport-related value added; and • Sport-related employment.
Sport-related consumer expenditure refers to the spending of households on sport. It does not include any spending by government, sport clubs or commercial companies. Examples of sport-related consumer expenditure include sport clothing and footwear (bought by households), bicycles, other sport equipment, admissions, fees spent on sport or leisure clubs etc. It does not include spending on sport advertising or investment in sport infrastructure by central or local government.
Sport-related value added is the most comprehensive statistic of economic value as it corresponds to the Gross Value Added (GVA) in the economy as a

5
whole. GVA is the difference between the value of sport-related goods and services produced and the costs involved in producing them. It shows the contribution of the sport industry to the economy. We measure it based on the sum of wages and profit surplus in the sector. Note that GVA is different to total turnover; the latter, using the terminology of the Annual Business Survey (ABS) is defined as:
Total turnover ≈ (Wages & salaries) + (Profits) + (Purchases of goods materials and services)
In other words GVA is equivalent to turnover minus any purchases of goods and services required in the production process. Typically all sport related economic activity considered in this report would be associated with the generation of sport value added, either in the form of wages or profits.
The NIA method used is consistent with the Office for National Statistics (ONS) estimates, as reported in the publication Consumer Trends3. Inflation adjustment has been used for comparisons of the year 2017/18 with past data. To do so we used the volume index of the ONS publication Consumer Trends. This includes a price index for sport services, but as we take a wider outlook we also use the price index of retail, TV services, gambling etc., creating an overall price index for the sport industry as defined here.
The sport-generated GVA, as percentage of the total product, is an important statistic to consider as it relates directly to the headline Gross Domestic Product (GDP) figure of the economy. Together with average wages per sector and profit margins, GVA also contributes towards producing estimates for sport-related employment.
To do so, average wages per sector (full time) were recorded using the Annual Survey of Hours and Earnings (ASHE). The resulting employment figures are therefore Full Time Equivalent (FTE) jobs, not a headcount of employees. Typically the number of FTE jobs would be all the full time jobs 3 ONS (2019). Consumer Trends, UK, Quarter 4 2018. [online]. https://www.ons.gov.uk/economy/nationalaccounts/satelliteaccounts/bulletins/consumertrends/previousReleases

6
added to half of the part time jobs. In most cases two part time jobs are equivalent to one full time job on the basis of hours worked. Beyond these statistical considerations, the two main components of GVA are wages and profits. The greater the wage part embedded within GVA, the greater the association between GVA and employment.
Further details on the data sources and methods used for deriving sport-related estimates; and the income and expenditure accounts and flows of the internal sports economy can be found in the appendices.

7
3. The sport economy in England
3.1 Summary of key indicators
Table 3.1 summarises the key sport-related indicators for England, namely consumer expenditure, GVA and employment for the years 2010, and 2017/18.
Table 3.1: Main sport-related indicators for England, market prices 2010 2017/18 Consumer expenditure on sport (£million) 20,280 25,143.91 Consumer expenditure, participation element (£million)
13,692.97
percentage of England total 2.5% 2.4% Sport-related GVA (£million) 20,300 23,894.15 Sport-related GVA, participation element (£million)
13,886,97
percentage of England total 1.7% 1.6% Sport-related employment (000) 440 479.53 Sport-related employment, participation element
287.87
percentage of England total 2.3% 2.4%
Key points:
• Consumer expenditure on sport-related goods and services in England in 2017/18 was £25,144m, or 2.4% of total consumers' expenditure in England. From this, £13,693m (or 54%) is associated explicitly with community sport participation. The table illustrates that since 2010, sport-related expenditure has grown in absolute terms, but as a proportion of overall expenditure in England it has recorded a very small decline from 2.5% to 2.4%.
• Sport-related value added to the English economy in 2017/18 was £23,894m, or 1.6% of total GVA in England. From this, £13,887m (or 58%) is associated with community sport participation. Sport-related economic activity has grown from £20,300 or 1.7% of English GVA in

8
2010. As with consumer expenditure, this represents a positive growth in absolute terms, but a small decline in relative terms.
• Employment in sport was 479,530, FTE in 2017/18, or 2.4% of all employment in England. From this, 287,870 jobs (or 60%) are associated with community sport participation. Sport-related employment has grown from 440,000 or 2.3% of English employment (FTE) in 2010. This represents a positive growth in absolute and relative terms.
By comparing GVA and employment, the strongest growth has been in employment, which is consistent with the European experience4. Employment generation in sport happens mainly through the network of sport clubs and from the commercial sector, which has a very high multiplier associated with sport services. For example, in the latest analytical input output tables5, the GVA multiplier of sport services is 2.3 compared to 2.0 in the case of construction.
As has been observed in most EU countries (SIRC and SportsEconAustria, 2018), the percentage of sport employment as a proportion of total employment is greater than the equivalent sport GVA. This reflects two things. First, the sports industry provides lower value jobs than average and second that it is more people based. i.e. jobs cannot easily be substituted by technology. The small decline in the sport share of GVA is largely due to the recession of the non-sport sectors in 2010; the sport sector did not experience the recession to the same degree, most likely due to the preparations for the Olympic Games6.
4 SIRC and SportsEconAustria (2018). Study on the economic impact of sport through sport satellite accounts. [online]. https://publications.europa.eu/en/publication-detail/-/publication/865ef44c-5ca1-11e8-ab41-01aa75ed71a1/language-en/format-PDF/source-71256399 5 https://www.ons.gov.uk/economy/nationalaccounts/supplyandusetables/datasets/ukinputoutputanalyticaltablesdetailed 6 This is supported by: a) The UK Sport Satellite Accounts, which show that the infrastructure spending on the Olympic Games was crucial to maintain the level of sport GVA; b) See the article by Kokolakakis, Lera-Lopez and Ramchandani (SMR, 2019) on changes in intensive participation around the Olympic Games. This implies further spending on sport equipment and services; c) This point is reiterated by the ONS statistics in the publication Consumer Spending (volumes): Between 2008 and 2011 total spending on goods reduced by 2% in real terms. At

9
3.2 Summary using constant 2016 prices
To understand the changes in sport related consumer spending and GVA without the influence of inflation we reestimate the numerical values of Table 3.1 using 2016 prices. The presentation of consumer expenditure and GVA in this way, in Table 3.2 below, enables spending and value added to be compared on a like for like basis without being influenced by inflation. The choice of the base year is consistent with the latest index used in the National Accounts (Consumer Price Index in Consumer Trends7). The price index used is equivalent to the ratio of consumption in current prices over consumption in constant 2016 prices. Finally Table 3.2 also shows the Consumer Price Index (CPI) for the years 2010 and 2017/18 when 2016=100.
Table 3.2 shows that from 2010 to 2017 prices increased by 16%. When this is taken into account, sport-related consumer spending increases by 7% in real terms from £22,993m in 2010 (2016 prices) to £24,650m in 2017/18 (2016 prices). Similarly, sport-related GVA increases by 2%, from £23,015m in 2010 (2016 prices) to £23,425m in 2017/18 (2016 prices). It can be seen that in real terms, during the period 2010 - 2017/18, the sport economy grew considerably both in terms of consumer spending and GVA.
Table 3.2: Consumer spending and GVA in constant 2016 prices: CPI of 2016=100
2010 2017/18 % change Consumer expenditure on sport (£million)
22,993 24,650 7%
Sport-related GVA (£million) 23,015 23,425 2% CPI 88.2 102 16%
the same time, spending (volumes) on sport equipment increased by 14.5% (code: XYJU). Going to the Olympics, in the four year period 2009-2012, spending on sport and recreation services increased by 8% (volume, code: ZAXK). 7 In our calculations volume= 100 * value / price.

10
3.3 Consumer expenditure on sport
3.3.1 Overall sport-related consumer expenditure on sport The estimates for total consumer expenditure in England were derived using Family Spending8 and Consumer Trends statistics. Table 3.3 indicates the major elements of consumers' expenditure on sport-related goods and services for 2017/18. The table shows that the total value of sport-related consumer spending was £25,144m, or 2.4% of total spending in 2017/18, representing an increase of 24% relative to 2010.
Table 3.3: Sport-related consumer spending in England (2017/18)
(£million) Sport clothing and footwear 3,883.25 Sports goods and bicycles 2,683.07 Participation subscriptions and fees
4,189.42
Admissions to events 616.09 Sport-related gambling 5,226.57 TV/video rental, cable and satellite subscriptions
2,894.68
Other sport-related spending 5,650.83 Total 25,143.91 Total 2010 20,280
A large part of consumer spending on sport is directed towards gambling
(£5.2bn). This is followed by participation and subscription fees (£4.2bn),
sport clothing and footwear (£3.9bn) and sport TV (£2.9bn). With the
exception of sport gambling and broadcasting, the market is driven by the
participation elements of sport, showing that a small change in participation
would have a strong impact on the economy.
8 Living Costs and Food Survey, ONS. Most statistics were derived from the detailed table A1. The less detailed regional table was used to distribute the overall figures to England.

11
Figure 3.1 shows the percentage distribution of sport-related consumer
spending in England in the year 2017/18. Among the categories presented,
the greatest share is attributed to sport-related gambling (21%), followed by
subscriptions and fees (17%), sport clothing and footwear (15%) and sport-
related TV (12%). The share of bicycles (5%) includes a wider definition than
previous studies as the total spending on bicycles for adult use was included
to align this research with similar projects in the UK and the EU9. Previous
studies adjusted spending according to statistics from the National Travel
Survey and excluded the element of commuting. However, active travel is
now included in the estimates presented in this report.
Figure 3.1: Sport consumer expenditure in England (2017/18)
3.3.2 Community participation-related consumer expenditure on sport
This section estimates the percentages of sport consumer expenditure that is associated with community sport participation. Table 3.7 below indicates the proportion of the major consumer expenditure categories that can be associated with sport participation in 2017/18. The table shows that the
9 The focus now is on physical activity, which includes spending on bicycles used for commuting. All the adult related market is included in the current estimate.
15%
6%
17%
2%
21%
12%
5%
11%
12%Clothing & footwear
Sports equipment
Subscriptions & fees
Admissions
Sport gambling
Sport TV
Bicycles
Travel and Skiing
Other

12
majority of sport-related spending (54%) relates to participation, representing £13,693m in value.
By definition, some of the categories considered explicitly in Table 3.7 relate
only to participation. For example, sport goods, bicycles and participation
subscriptions and fees are expenses that are incurred for the purpose of
participation and because of that they are 100% within the participation
category. On the other hand expenses such as admissions to events, sport-
related gambling and media expenses are associated with watching the
sport and do not relate directly to sport participation, although they may
inspire the latter to grow. For this reason these categories are fully placed
outside of the sport participation context (0% in Table 3.7).
Table 3.4: Derivation of participation-related sport consumer spending in
England (2017/18)
Total consumer spending (£m)
Participation %
Participation (£m)
Sport clothing and footwear
3,883.25 67% 2,604.55
Sports goods and bicycles 2,683.07 100% 2,683.07 Participation subscriptions and fees
4,189.42 100% 4,189.42
Admissions to events 616.09 0% 0 Sport-related gambling 5,226.57 0% 0 TV/video rental, cable and satellite subscriptions
2,894.68 0% 0
Other sport-related spending
5,650.83 75% 4,215.93
Total 25,143.91 54% 13,692.97
The remaining categories contain some elements of sport participation. In
sport clothing and footwear 67% of the expenses are associated with sport
participation whilst the remainder has its main motivation as fashion and

13
lifestyle10. Similarly the category 'other sport-related spending' contains
items such as boats (100% within participation), sport publications and
sport-related BBC license (0% of participation), etc. Overall, 75% of
consumer spending within this category is associated with participation.
The overall percentage of sport participation within sport expenditure is
calculated at 54%.
Finally note that this calculation largely depends on the definitional view we
take on sport participation spending. We tried to build our perspectives
using the Vilnius definition of sport, the discussion of the participation
element in the construction of the UK Sport Satellite Account (SSA)11 as well
as previous Sport England economic evaluations. However, there is not a
strictly right or wrong answer.
We generally expect the participation element to be an input in sport, while
on the other side sport gambling or sport TV use sport as an input. For
example, one needs sport equipment, sport subscriptions or sport footwear
to participate in sport (sport as output); on the other hand sport is required
to produce sport TV broadcasting or to bet on sport outcomes (sport as
input). In addition, we expect that the main consuming motivation should be
to participate and not just attend a sport event or watch sport on TV. Having
said that, a lot of sport TV and sport gambling expenses are invested back to
the existing sport infrastructure, helping clubs to grow and increase their
participation.
10 This is derived in a model built by SIRC on the basis of Mintel's findings. http://academic.mintel.com/display/859791/ 11 SIRC and SportsEconAustria (2018). Study on the economic impact of sport through sport satellite accounts. [online]. https://publications.europa.eu/en/publication-detail/-/publication/865ef44c-5ca1-11e8-ab41-01aa75ed71a1/language-en/format-PDF/source-71256399

14
3.4 Sport-related GVA
3.4.1 Overall sport-related GVA Sport-related GVA, or value added, can be described as the difference between the value of the sports-related goods and services produced and the costs involved in producing them. Value added is calculated as the sum of wages and profits generated within the sector. The value added to the English economy through the production of sports-related goods and services has significant implications for sport-related employment.
Table 3.4 shows the figures for GVA in the different sectors of the sports economy in current prices for the year 2017/18. In 2017/18, sport-related economic activity added £23,894m to the English economy, which represents an increase of 18% since 2010. The majority of this economic activity (£11,482m, 48%) is generated by the commercial non-sport sector12. The next largest sector is commercial sport (£5,483m, 23%). More than two thirds of the value added in this sector is attributable to professional football clubs and retailing. The latter includes sport-related clothing and footwear, equipment and publications. The voluntary and public sectors account for the remainder (£6,929m, 29%) of the sport-related economic activity in England. In each case, the ratios of wages and profits out of total turnover are calculated using the English section of the ABS and the Input Output Tables of the UK. Finally note that leisure centres and participation clubs are distributed among the voluntary sector, the local government sector (using CIPFA data) and the commercial sector.
Table 3.5: Sport-related GVA in England (2017/18)
(£million) Commercial sport 5,483.10 of which Spectator sports 2,093.06 Retailing 1,708.76 Commercial non-sport 11,482.21
12 All these data come from the analysis of the sport economy. Statistical sources appear in the appendix,

15
Voluntary sector 3,118.21 Public sector 3,810.63 Total 23,894.15 Total 2010 20,300
3.4.2 Community sport participation-related GVA As in the case of sport consumer expenditure, we can construct the percentage of sport-related GVA that is associated with community sport participation. Generally the participation-related categories of sport expenditure would lead to participation-related GVA. However, both GVA and employment include elements that are not related directly to consumer spending, such as sport construction, and these have to be analysed on their own rights. For example lottery grants on sport and skiing resorts are considered to be associated fully with participation. In addition most GVA generated in the public sector is associated either with sport education (100% participation) or with the administration of sport which is essential for the sport participation element. In addition, all economic activity around sport clubs in the voluntary sector is considered to be associated with participation.
Table 3.6 shows that 58% of sport GVA is associated with participation. As in the case of consumption, in the commercial sport sector, spectator sports are not associated with participation, whilst the majority of retailing (73%) is. The latter is derived from buying motivations: for example, all sport equipment companies are associated with participation, whilst only a part of sport footwear production is used primarily for participation. In trainers the fashion element (according to Mintel) can be up to 63%. Overall, the participation percentage of GVA in the commercial sport sector is 42%. Similarly the participation percentages associated with the commercial non-sport sector, the public sector and the voluntary sector are 41%, 98% and 100% correspondingly. The part of GVA that is associated with participation is estimated at £13,875m, representing a share of 58% of total sport GVA.

16
Table 3.6: Participation related sport GVA in England (2017/18)
Total GVA (£m)
Participation %
Participation (£m)
Commercial sport 5,483.10 42% 2,298.66 of which Spectator sports 2,093.06 0% Retailing 1,708.76 73% Commercial non-sport 11,482.21 41% 4,724.11 Voluntary sector 3,118.21 100% 3,118.21 Public sector 3,810.63 98% 3,745.93 Total 23,894.15 58% 13,886.97

17
3.5 Sport-related employment
3.5.1 Overall sport-related employment Sport-related employment estimates are derived from calculations based
on wage payments and average salaries per sector, as reported in the
Annual Survey of Hours and Earnings (ASHE). The latter has been adopted as
a basis of average wages per sector following the abolition of the New
Earnings Survey (NES) which was used in early economic studies. ASHE
introduced greater detail in the definition of economic sectors. Although the
GVA estimates were not affected by ASHE, employment estimates can now
be derived more reliably using GVA and wages because of the improved
data quality. All employment in sport and the national economy is
estimated as FTE jobs where, for example, two 0.5 part time jobs are
approximately equivalent to one full time job.
Table 3.5 provides estimates for sport-related employment in England.
Sport-related employment (FTE) grew from 440,000 in the year 2010 to
479,530 in 2017/18, representing an increase of 9% or 39,530 extra FTE jobs.
The 2017/18 level of employment in sport is the highest recorded in England,
both in absolute terms and relative to sport's share of total employment. As
a percentage of total employment, sport-related employment increased
from 2.3% in 2010, to 2.4% in 2017/18.
Table 3.7: Sport-related employment in England (FTE) (2017/18) (£'000) Commercial sport 117.51 of which Spectator sports 42.55 Retailing 29.09 Commercial non-sport 212.05 Voluntary sector 45.27 Public sector 104.70 Total 479.53 Total in 2010 440.0
18
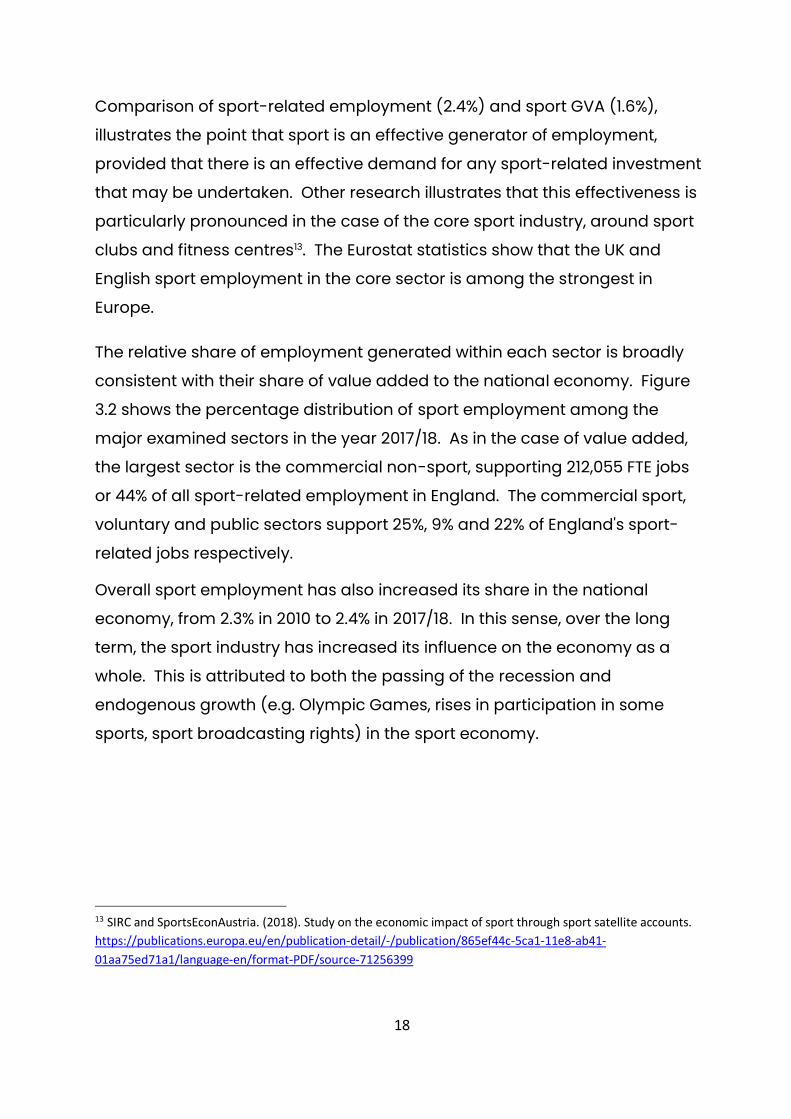
Comparison of sport-related employment (2.4%) and sport GVA (1.6%),
illustrates the point that sport is an effective generator of employment,
provided that there is an effective demand for any sport-related investment
that may be undertaken. Other research illustrates that this effectiveness is
particularly pronounced in the case of the core sport industry, around sport
clubs and fitness centres13. The Eurostat statistics show that the UK and
English sport employment in the core sector is among the strongest in
Europe.
The relative share of employment generated within each sector is broadly
consistent with their share of value added to the national economy. Figure
3.2 shows the percentage distribution of sport employment among the
major examined sectors in the year 2017/18. As in the case of value added,
the largest sector is the commercial non-sport, supporting 212,055 FTE jobs
or 44% of all sport-related employment in England. The commercial sport,
voluntary and public sectors support 25%, 9% and 22% of England's sport-
related jobs respectively.
Overall sport employment has also increased its share in the national
economy, from 2.3% in 2010 to 2.4% in 2017/18. In this sense, over the long
term, the sport industry has increased its influence on the economy as a
whole. This is attributed to both the passing of the recession and
endogenous growth (e.g. Olympic Games, rises in participation in some
sports, sport broadcasting rights) in the sport economy.
13 SIRC and SportsEconAustria. (2018). Study on the economic impact of sport through sport satellite accounts. https://publications.europa.eu/en/publication-detail/-/publication/865ef44c-5ca1-11e8-ab41-01aa75ed71a1/language-en/format-PDF/source-71256399

19
Figure 3.2: Sport employment in England (2017/18)
3.5.2 Community sport participation-related employment The participation insights behind GVA reflect exactly the methods used to
derive participation-related sport employment. However, whilst in the case
of GVA the participation rates were applied on the total value added, in the
case of employment are applied on the wages.
Table 3.9 below illustrates that 60% of sport employment is associated with
participation. In the case of the voluntary sector, by definition, all
employment generated (45,266 jobs) is associated with participation. As in
the case of GVA, 98% of the public sector sport jobs relate to participation,
corresponding to 102,896 jobs. The commercial sectors of sport and non-
sport are associated with participation shares of 45% and 41% respectively.
Table 3.8: Participation related sport employment in England (2017/18) Total employment
('000) Participation %
Participation ('000)
Commercial sport 117.51 45% 52.46 Commercial non-sport 212.05 41% 87.25 Voluntary sector 45.27 100% 45.27 Public sector 104.70 98% 102.90 Total 479.53 60% 287.87
25%
44%
9%
22%
Commercial sport sector
Commercial non-sportsector
Voluntary sector
Public sector

20
3.6 Summary of income and expenditure flows
This section gives a snapshot of the sources of generated income and
expenditure in the sport industry in England. Table 3.6 summarises the
income and expenditure flows for the seven sport-related sectors in 2017/18.
The majority of income is generated in the commercial non-sport sector,
accounting for £15,805m. This is followed by the commercial sport sector
(£12,858m) and the central government (£11,224m). Within the commercial
sport sector, £6,257m (49%) of the generated income comes from retailing.
This consists mainly of sport equipment, clothing, footwear, and sales of
sport-related books, magazines, and other media.
On the expenditure side, by far the most important category is the consumer
sector accounting for £25,144m of expenditure. This is followed by the
commercial non-sport (£15,201m) and commercial sport (£11,666m) sectors.
These results show that the main engine for spending on sport and physical
activity is people (consumers) rather than institutions. This has two
implications: firstly sport and physical activity provides significant benefit to
government finances through VAT and secondly it links to sport and physical
activity participation and sport attendance as two important elements in
growth in the sport economy.
Table 3.9 Sport-related income and expenditure flows (2017/18) Income (£m) Expenditure (£m) Consumer 10,072.47 25,143.91 Commercial sport 12,857.93 11,666.16 of which: Spectator sports 2,773.23 2,103.70 Participation sports 671.89 638.29 Retailing 6,256.89 5,374.41 Other 3,155.92 3,549.75 Voluntary (including net bar receipts) 4,830.44 3,098.27 Commercial non-sport 15,804.81 15,201.19 Central government 11,223.47 3,491.79 Local government 4,333.94 4,265.39 Outside the area 6,564.33 2,030.60

21
4. Conclusion
4.1 The sport economy in context
To place the sports economy in England into context, we have compared the
GVA of sport to the GVA produced by other industries in England. This
comparison is illustrated in Figure 4.1. The statistics are taken directly from
the English section of the latest ABS (2016). The sport bar indicting a GVA of
£23,426m is split into two parts; the one coloured red represents the
community participation element, generating a GVA of £13,887m.
Figure 4.1: GVA England, selected industries, £m (2016 prices)
We compared sport with the economic sectors: Wholesale and retail of
vehicles (code: 45); Textiles; Agriculture; Travel services; Accommodation
(including: hotels, holiday short stay accommodation, and camping
grounds); Telecommunications (including wired, wireless and satellite
telecommunication activities); Food and beverages, Electricity and Rental
and leasing services, all of which are identified in the 2016 ABS English tables
(regional supplement). A detailed definition of each sector can be found in
the Appendix 4. Note that this is a selection of economic sectors in England

22
to illustrate the comparative size of English sport economic performance.
For consistency we are using 2016 prices throughout. For the year 2017/18,
sport-related GVA was £23,426m (2016 prices). Among the selected
categories, only Wholesales, Telecommunications and Food and beverages
exceed Sport in terms of their generated GVA. Additionally, sport has greater
economic importance (in terms of GVA in 2017/18) than the sectors Rental
and leasing services, Electricity, Accommodation, Travel, Textiles and
Agriculture, underlying its relative strength within England14. The community
sport participation element on its own exceeds the GVA generated by each
of Accommodation, Travel and related services, Textiles and Agriculture.
4.2 Summary The results of this research demonstrate the importance of sport and physical activity to the English economy. This report shows that sport and physical activity generate significant consumer expenditure, GVA and employment for England. The importance of these indicators has continued to increase in real terms since 2010. Furthermore, sport-related employment has continued to grow at a faster rate than overall employment growth in England, and, since 2010, at a faster rate than sport GVA, underlining the role of sport and physical activity in generating and sustaining jobs and output. The following bullet points summarise the key findings presented in this report:
• The total value of sport-related consumer spending was £25,144m in
2017/18, representing an increase of 24% relative to 2010 (current prices),
and a 7% increase in real terms (constant prices). In comparison to
consumer spending for the UK as a whole, the sport economy has over
performed in relation to overall UK consumer spending;
• A large part of consumer spending on sport is directed towards
gambling (£5.2bn). This is followed by participation and subscription
fees (£4.2bn), sport clothing and footwear (£3.9bn) and sport TV
14 Note that sport may also be included in some of the other categories

23
(£2.9bn). Other than gambling and broadcasting, the market is driven
by the participation elements of sport.
• The sport economy of England has improved in terms of GVA and
employment since it was last measured in 2010;
• Sport-related GVA in 2017/18 was £23,894m. It has increased by 18%
since 2010 (current prices), and 2% in real terms (constant prices);
• In 2017/18, the level of employment in sport was the highest ever
recorded (479,530), both in absolute terms and relative to its share of
total employment (2.4%);
• The sport share in employment (2.4%) is greater than the sport-related
share in GVA (1.6%). This is consistent with the European experience,
showing that sport is an effective policy tool for generating
employment;
• The largest sector of sport-related employment in 2017/18 was
commercial non-sport, supporting 212,055 jobs or 44% of all sport-
related employment in England. The commercial sport, voluntary and
public sectors support 25%, 9% and 22% of England’s sport-related jobs
respectively.
• Community sport participation-related economic activity accounts for
more than half of all sport-related consumer spending (54%, £13,693m),
GVA (58%, £13,887m) and employment (60%, 287,874 FTE jobs) in
England.

24
5. References
HM Government (2015). Sporting Future: a new strategy for an active nation. [online]. https://www.gov.uk/government/publications/sporting-future-a-new-strategy-for-an-active-nation
Office for National Statistics (ONS) (2019). Consumer Trends UK, Quarter 4 2018 [online]. ONS. https://www.ons.gov.uk/economy/nationalaccounts/satelliteaccounts/bulletins/consumertrends/previousReleases
SIRC and SportsEconAustria (2018). Study on the economic impact of sport through sport satellite accounts. [online]. https://publications.europa.eu/en/publication-detail/-/publication/865ef44c-5ca1-11e8-ab41-01aa75ed71a1/language-en/format-PDF/source-71256399
SIRC (2011). Sport Market Forecasts, 2011-2015. SIRC
Sport England (2019). Our strategy. [online]. https://www.sportengland.org/active-nation/our-strategy/
Sport England (2019). A code for sports governance. [online]. https://www.sportengland.org/news-and-features/news/2017/december/20/high-compliance-with-new-governance-code/
Sport England (2018). Sport England annual report and accounts (2017/18). [online]. https://www.sportengland.org/media/13328/sport-england-2017-18-annual-report-and-accounts.pdf
Sport England (2016). Towards an active nation. [online]. https://www.sportengland.org/media/10629/sport-england-towards-an-active-nation.pdf

25
6. Appendices
Appendix 1: Statistical sources
Sources of data used in the model include the following publications: • Annual Business Survey
• Annual Survey of Hours and Earnings • BBC Annual Report and Accounts
• British Marine Federation statistics • BSkyB Annual Report
• Consumer Trends • Deloitte: Annual Review of Football Finance
• Family Spending • Financial Statement and Budget Report
• Gambling Commission Statistics • Government’s Expenditure Plans
• HM Customs and Excise Report • Horserace and Betting Levy Board Report
• Housing and Construction Statistics • Input Output Tables
• Labour Force Survey • Labour Trends
• Local Government Finance statistics • Monthly Digest of Statistics
• National Travel Survey • ONS data on number of households and population
• ONS: the Blue Book • PRODCOM Annual Industry Reports
• Regional Accounts • Sport England Accounts
• Travel Trends

26
Appendix 2: Model output
Consumer expenditure on sport-related goods & services, 2017/18 £ million Admissions 616.1 Sports goods 1,416.1 Bicycles 1,266.9 Boats 987.9 Participants sports subscriptions & fees 4,189.4 Clothing sales 2,524.2 Footwear sales 1,335.4 Repairs and laundry 23.7 Travel 925.2 Books and magazines 134.5 Newspapers 306.8 Video: purchase and rental 8.4 BBC licence 614.8
TV and video rental, cable & satellite subscriptions 2,894.7
Internet subscriptions 251.8 Skiing holidays 1,814.5 Independent schools 607.0 Gambling: football pools 27.2 Remote; on and off course sport betting 4,705.3 Raffles and gaming 494.1
Total 25,143.9

27
Commercial sport income, 2017/18 £ million Spectator clubs: Admissions 606.8 Sponsorship & advertising 338.8 Corporate entertainment 133.1 Horserace Betting Levy 79.5 Cost of the rights to top league matches 1,615.0 Participation clubs: Subscriptions & fees 671.9 Retailers (net of Vat): Equipment 2,572.8 Clothing and footwear 3,236.0 Books, newspapers and magazines & videos 448.0 Exports and manufacturers' sales of Clothing, footwear & equipment 1,788.1 TV and radio: BBC 614.8 Commercial 519.4 Exports -3.7 Internet subscriptions 209.8 Lottery awards 18.6 Lottery partnerships 9.0 Total income 12,857.9

28
Commercial sport expenditure, 2017/18 £ million Current factor expenditure Spectator clubs: Wages 1,481.6 Other inputs 622.1 Participation: Wages 335.9 Other inputs 302.3 Retailers: Wages 826.3 Other inputs 4,548.1 Manufacturers: Wages 685.4 Other inputs 983.4 TV and radio: Wages 464.3 Other inputs 380.5 Total factor expenditure Total wages 3,793.5 Total other inputs 6,836.6 Total factor surplus 1,672.7 Total value added 5,466.2 Current transfers Corporation tax 183.7 Rates 164.5 Capital expenditure Investment 687.9 Total expenditure leaving sector 11,666.2

29
Voluntary sector income, 2017/18 £ million Factor income (monetary) Players' subscriptions and match fees 2,346.1 Equipment 18.4 Sponsorship and advertising 167.6 Raffles and gaming machines 494.1 Bar receipts 3,026.1 Subtotal (factor income) 6,052.2 Other monetary income Grants 325.8 Foundation for sport and arts 50.9 Employers' subsidies 182.6 Interest 104.4 Lottery awards via Sports Council 106.2 Lottery partnerships 126.6 Total monetary income (excluding bar receipts) 3,922.6
Voluntary sector expenditure, 2017/18 £ million Factor expenditure Wages 1,544.7 Ground hire and rents 224.8 Equipment 19.2 Other 714.2 (Bar purchases) 2,118.3 Subtotal (factor expenditure) 4,621.1 Rates 143.1 Interest 33.5 Investment 418.8 Total monetary expenditure (excluding bar purchases)
3,098.3

30
Commercial non-sport income, 2017/18 £ million
Receipts net of tax from consumer spending: Travel 465.7 Gambling 4,246.6 Skiing 798.4 Independent schools 485.6 TV rental, cable & satellite subscriptions 2,315.7 Sales of current inputs to: Central government 154.4 Local government 206.7 Commercial sport 5,050.7 Voluntary sector 683.8 Interest from voluntary sector 33.5 Sales of capital inputs to: Local government 615.9 Commercial sport 412.8 Voluntary 335.0 Total income 15,804.8

31
Commercial non-sport expenditure, 2017/18 £ million Producers of inputs to sport: Wages 6,570.4 Imports 4,009.1 (factor surplus) 4,911.9 (value added) 11,482.2 Corporation tax 539.4 Rates 344.5 Purchases of inputs from sport: Sponsorship and advertising 670.7 ITV and radio advertising 519.4 Corporate entertainment at sports events 133.1 Employees' sports subsidies 122.2 Horserace Betting Levy 79.5 Interest payments to voluntary sector 104.4 Promotion expenditure for sponsorship: Cost of the rights to top league matches 1,615.0 Lottery awards via sports council 265.4 Lottery partnerships 228.4 Total expenditure leaving sector 15,201.2

32
Central government income, 2017/18 £ million Taxes: on expenditure 4,713.1 on incomes generated in: commercial sport 1,547.4 voluntary sector 609.4 commercial non-sport 3,262.9 local government 1,090.6 Total income 11,223.5 Lottery awards 39.8 Lottery partnerships 27.0
Central government expenditure, 2017/18 £ million Transfer payments Grants via sports councils 86.3
Grant support for local government expenditure on: Sport (net spending) 390.0 Education 1,794.2 Foundation for sports and arts 67.9 Subsidy to central government employees 60.4 Factor expenditure Sports Council: wages and other inputs 205.9 University education, wages 702.2 University education, surpluses 117.7 Prison service, MOD, royal parks: wages and other inputs 67.3 Total 3,491.8

33
Local government income, 2017/18 £ million Local authority sports facilities: Fees and charges 802.8 Sales of equipment 364.6 Ground hire 112.4 Grants from central government: to fund net expenditure on sport 390.0 sport education 1,794.2 via Sports council 12.9 via FSA 17.0 Rates: voluntary sector 143.1 commercial sport 164.5 commercial non-sport 344.5 Payments for policing 21.4 Lottery awards 100.8 Lottery partnerships 65.7 Total income 4,333.9
Local government expenditure, 2017/18 £ million Current expenditure Direct gross expenditure: Wages 487.5 Other current expenditure 415.3 Education: Wages 2,179.6 Research 63.2 Local transport and policing: Wages and other inputs 97.5 Grants to voluntary clubs 252.5 Capital expenditure Investment 769.9 Total expenditure 4,265.4

34
Outside the area income, 2017/18 £ million Sports, clothing, footwear and equipment 1,153.7 Import content of skiing 653.2 TV imports 96.5 Prize income 264.8 Import content of UK production of: Sport-related goods and services 387.1 Commercial non-sport sector output 4,009.1 Total income 6,564.3
Outside the area expenditure, 2017/18 £ million Sports, clothing, footwear and equipment 1,627.1 Admissions to sports events 142.4 TV exports -3.7 Prize income 264.8 Total expenditure 2,030.6
35
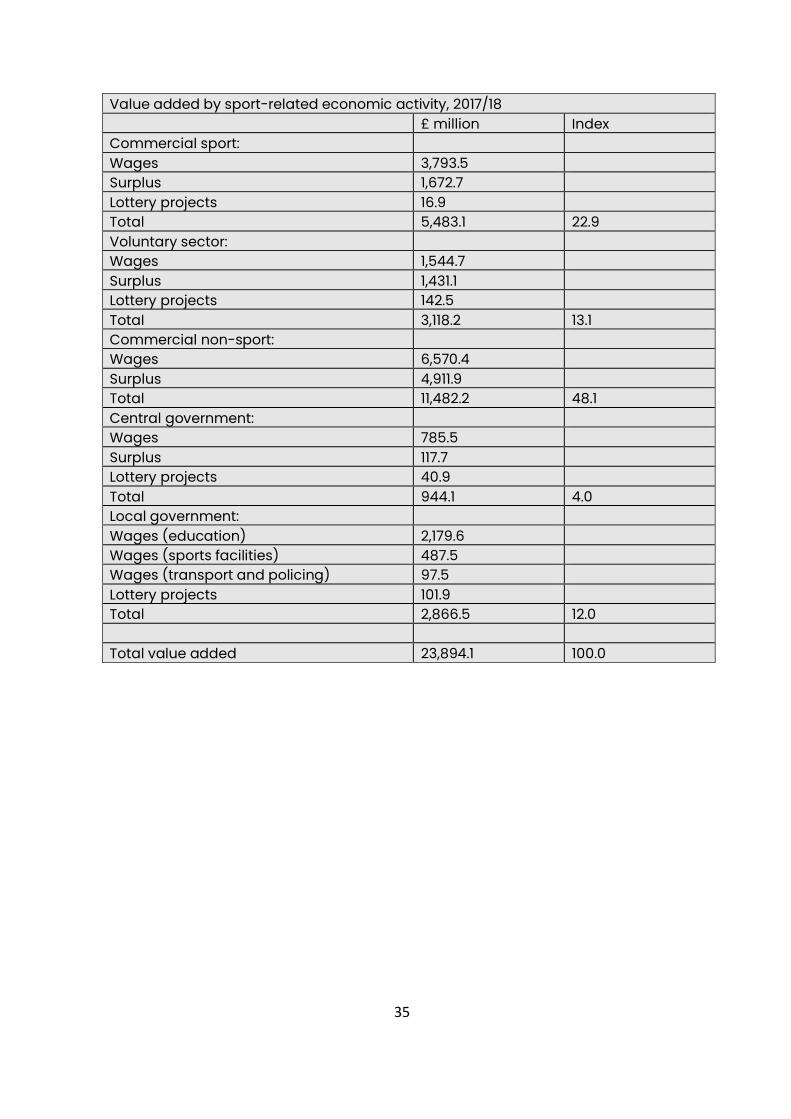
Value added by sport-related economic activity, 2017/18 £ million Index Commercial sport: Wages 3,793.5 Surplus 1,672.7 Lottery projects 16.9 Total 5,483.1 22.9 Voluntary sector: Wages 1,544.7 Surplus 1,431.1 Lottery projects 142.5 Total 3,118.2 13.1 Commercial non-sport: Wages 6,570.4 Surplus 4,911.9 Total 11,482.2 48.1 Central government: Wages 785.5 Surplus 117.7 Lottery projects 40.9 Total 944.1 4.0 Local government: Wages (education) 2,179.6 Wages (sports facilities) 487.5 Wages (transport and policing) 97.5 Lottery projects 101.9 Total 2,866.5 12.0 Total value added 23,894.1 100.0

36
Employment, (FTE) 2017/18
Employment ('000s)
Sector Commercial sport Spectator clubs 42.5 Participation clubs 9.6 Retailers 29.1 Manufacturing (exports) 26.0 TV and Radio 10.2 Subtotal 117.5 Voluntary sport 45.3 Commercial non-sport 212.1 Central government Administration 2.5 Education 20.8 Subtotal 23.3 Local government Sports facilities 14.0 Education 64.7 Transport/police 2.7 Subtotal 81.4 Total 479.5
The expenditure flows matrix, 2017/18 (£ million)
Flows to:
Flows from: CON CS VOL CNS CG LG OV Consumer sector 0.0 8,230.9 2,858.5 8,312.0 3,921.9 1,167.4 653.2 Commercial sport 2,297.0 0.0 0.0 5,463.5 1,817.8 185.9 1,902.0 Voluntary sector 935.3 15.3 0.0 1,052.3 839.8 255.5 0.0 Commercial non-sport 4,077.8 2,713.4 627.0 0.0 3,262.9 511.0 4,009.1 Central government 785.5 35.4 184.7 154.4 0.0 2,214.1 0.0 Local government 1,712.2 125.5 252.5 822.6 1,352.6 0.0 0.0 Overseas 264.8 1,737.4 0.0 0.0 28.5 0.0 0.0

37
Appendix 3: Sources and methods
This section explains how the estimates are derived. Many are generated through the flows in the model. The flows among the sectors in the SIRC model are based on a double entry principle between income and expenditure. Data sources mostly relate to the expenditure side, especially in the case of consumers. The Outside the Area sector is treated as residual in the flow system. No data exist to adequately describe the Voluntary sector; however the income and expenditure relationships suggested by the Survey of Sport Clubs (SRA) have been taken into account. Past studies and surveys have been used to link the Voluntary sector to the sport economy. The estimation of the remaining five sectors is explained below:
1. Consumer expenditure
Many items of sport-related consumer expenditure are detailed in the Family Expenditure Survey (FES) at UK level. Only broader categories of spending exist for UK regions. The latter are used to extract the relative statistics from the UK figures in a proportionate manner, or directly using the Essex Archives.
Admissions: They are estimated from FES. Data exist for 'Spectator sports - admission charges' for the UK as a whole and for 'Sports admissions and subscriptions' for the regions.
Sports goods: Expenditure is estimated from FES 'Sports and camping equipment' and annual reports of major sports companies.
Bicycles: The basis of the estimate comes from Consumer Trends. This is filtered regionally based on FES, and weighted according to adult use. Bicycles designed for children are excluded but those used for commuting were included.
Boats: The estimate is derived from a SIRC model for the sector based on statistics from the British Marine Federation.

38
Participant sports subscriptions and fees: Expenditure is estimated using the FES categories: 'participant sports excluding subscriptions' and 'subscriptions to sports and social clubs'.
Clothing and footwear sales: The estimate is based on a SIRC model, annual reports from sports companies and statistics from Consumer Trends and FES.
Sport-related travel: This is derived from a SIRC model based on NTS statistics and the publication Consumer Trends.
Books, magazines and newspapers: Statistics are based on FES and Consumer Trends.
Video and DVDs purchase and rental: Based on statistics from FES and the British Video Association.
BBC licence: Expenditure is derived from the sport-related content of the BBC licence. It is based on data from the BBC annual report, a SIRC model and the number of households.
TV rental, cable and satellite subscriptions: The basic estimate is derived from FES. Its sport-related element is derived by using BSkyB and BBC statistics.
Sport-related gambling: The basis of the estimates is the UK figure which is derived from official HM Customs and Excise data. A model by SIRC is used to ensure that the value of the overall gambling sector corresponds to the Consumer Trends statistics. Subsequently the regional element is derived by using FES and the number of households.
2a. Commercial sport income
Spectator club admissions: This is a flow of income coming from the domestic consumer sector and from overseas visitors to England. Data from

39
FES and HM Customs and Excise have been used. Income from tourists is estimated from Travel Trends.
Sponsorship: Most of this income comes from the commercial non sport sector. Various sources are used from the SIRC archive. We also assume that the sponsorship market is associated with the size of the spectator sports industry.
Horserace betting levy: These statistics are calculated using data from the Horserace Betting Levy Board Annual Report and population statistics from ONS.
Cost of the rights to top league matches: The basic estimate is derived from BSkyB statistics and media reports.
Subscriptions and fees: This is derived from the income and expenditure flows in the model.
Retailing: Income from retailing is associated with consumer expenditure on sport-related equipment, clothing, footwear, books, newspapers, magazines and DVDs. A part of this expenditure flows towards Local Authorities, whilst VAT reverts to central government.
Exports: Income from exports is estimated using trade assumptions based on Input-Output tables for wider (than sport) sections of the economy. These ratios are applied to sport-related consumer spending.
TV and radio: Income in the case of BBC comes directly from the licence fee. Only the sports-related component is included in our analysis.
2b. Commercial sport expenditure
Wages: The calculation of wages is based on the flow of income to the sector and the existing Annual Business Survey data that relate wages to total income. This method of calculating wages is repeated in all sectors of the sport economy.

40
Other inputs: In the case of spectator and participation clubs, an estimation of profits is required. Then ‘other inputs’ is the residual income after accounting for profits and wages. In the case of retailers, ‘other inputs’ can be estimated directly through statistics from the Input-Output tables and the ABS at regional level.
Investment: Investment is estimated as a ratio of the generated value added in each sub sector. We make some assumptions, based on Input Output Tables, so that we derive the best possible estimates given the existing information. For example, the share of investment within value added in the sport retail sector is assumed to be the same as in the retail sector as a whole.
3a. Commercial non-sport income
Income coming from consumer spending (net of tax): This is determined according to the flows of consumer expenditure. For example in the case of gambling, consumer spending flows to government as taxes and to the Commercial Non-Sport sector as income.
Sales of current inputs to other sectors: These are determined from the flows of the model. For example, in order to identify sales to the commercial sector we examine spending of commercial sport. The latter is directed either to the commercial non-sport sector or overseas, in a ratio dictated from the Input-Output Tables and the sector-specific statistics of regional ABS, deriving in this way the required sales estimate.
Sales of capital inputs to other sectors: They are related to the capital expenditure of the Local Government, Commercial and Voluntary sectors. Information is derived from ABS, the survey of sport clubs and Local Government accounts.
3b. Commercial non-sport expenditure
Wages: Spending on wages is calculated as a percentage of total income accruing to the sector. This income can be expressed as wages, profits, or

41
imports (before tax and investment decisions). The part of turnover allocated to wages is estimated from a SIRC model based on the Annual Business Survey (regional data).
Imports: These are estimated using the same method as above (wages).
Corporation tax: It is derived from the profits accruing to the sector (factor surplus, estimated as above) and the tax rate, estimated from the National Accounts (Blue Book).
Rates: The estimate is based on the value added generated in the sector and a model estimating rates as a percentage of value added for the two commercial sectors.
Sponsorship and advertising: They are estimated using non-official statistics and a SIRC model. Some independent information can be found in RTR sports and Mintel reports.
Lottery awards: They are estimated using data from DCMS and the Lottery Fund Accounts of Sport England.
4a. Central government income
Income accruing to the central government is mainly in the form of taxation. These estimates are determined from the tax rates and the flows within the model.
4b. Central government expenditure
Grants via Sport England: Data are provided by the Sport England annual accounts.
Wages: Estimates are provided from the Sport England annual accounts.
Support for local government expenditure: It is determined in the local government income below.
5a. Local government income

42
Fees and charges: The estimates are based on Local Government Financial Statistics and a SIRC model for the sector.
Sales of equipment: This is derived from consumer spending on sport equipment as detailed above.
Grants from central government: Using the HM Treasury Budget Report, an estimate of grants from central government as a percentage of Local Authority receipts is derived. This is then applied to local government expenditure categories.
Rates: This is tax income received from the voluntary, commercial sport and commercial non-sport sectors. The estimates are derived from the flows of the SIRC model.
5b. Local government expenditure
Total expenditure on sport services: This is derived from the Local Government Financial Statistics and a SIRC model for processing the data. This is then distributed into wages and other inputs.
Education: Spending on Education is derived from the Blue Book and the Government's Expenditure Plans (DES).
Capital expenditure: This is based on statistics from the Blue Book.

43
Appendix 4: Definitions
1. National Income Accounting
The concepts of National Income Accounting were developed for macro-economic analysis in the 1930s and 1940s. The basic principle is that there is accounting equality between total output, total income and total expenditure. The most common definitions of total output in the economy as a whole are the Gross Domestic Product (GDP) and Gross Value Added (GVA). For example, assume that the total output in a factory producing football boots is £100m. This is equivalent to the income generated as wages (say £60m) as profits (say £10m) and as flows to the companies selling inputs (£30m) required in the production. In this example, GVA is the sum of wages and profits. Further, total income will also be identical to total expenditure because output that is not sold in the current financial year is treated as investment expenditure.
2. Gross Value Added (GVA)
GVA is the difference between total output (based on wages and profits) and the cost of inputs used in the production process (raw materials and services). Alternatively, it can be expressed as:
GVA = GDP - taxes on products + subsidies on products.
GVA shows the contribution of the sports sector to the economy as a whole. Its basis is the sum of wages and profits in the economy.
3. Sport
We follow the definition employed in the publication Sport Market Forecasts15. Sport is divided into the following sectors: sport clothing and footwear, sport equipment, health and fitness, other participant sports, boats, spectator sports, sport gambling, sport TV and video, sport-related publications and sport-related travel.
4. Employment
This shows Full Time Equivalent (FTE) jobs, where for example two half-time jobs are regarded as being one FTE job. Employment is derived by dividing
15 SIRC (2011). Sport Market Forecasts, 2011-2015. SIRC.

44
the wage bill of a sector by the associated full time wage (excluding overtime) from ASHE.
5. Definitions of economic sectors
Wholesale and retail of vehicles
It includes the following:
• Sale of Motor vehicles; • Maintenance and repair of motor vehicles; • Sale of motor vehicle parts and accessories; • Sale, maintenance and repair of motorcycles and related parts and
accessories.
6. Textiles
It includes the following:
• Preparation of spinning of textile fibres; • Weaving of textiles; • Finishing of textiles; • Manufacture of other textiles.
7. Agriculture
It includes the following:
• Crop and animal production, hunting and related service activities; • Forestry and logging; • Fishing and aquaculture.
8. Travel services
It includes the following:
• Travel agency and tour operator activities; • Other reservation service and related activities.
9. Accommodation
It Includes the following:
• Hotels and similar accommodation; • Holiday and other short stay accommodation; • Camping grounds, recreational vehicle parks and trailer parks; • Other accommodation.
45
10. Telecommunications
It includes the following:
• Wired telecommunications activities; • Wireless telecommunications activities; • Satellite telecommunications activities; • Other telecommunications activities.
11. Food and beverages
It includes the following:
• Restaurants and mobile food service activities; • Event catering and other food service activities; • Beverage serving activities.
12. Electricity
It includes electric power generation, transmission and distribution.
13. Rental and leasing services
It includes the following:
• Renting and leasing of motor vehicles; • Renting and leasing of personal and household goods; • Renting and leasing of other machinery, equipment and tangible
goods; • Leasing and intellectual property and similar products, except
copyrighted works.