Embed Size (px)
Citation preview

Jason Leung-Wai and Kelly Dustow
September 2012
Jason Leung-Wai, Kelly Dustow and
Wilma Molano
Business and Economic Research Limited
October 2012
Economic Impact of Hosting 2015 Cricket World Cup Games in the Nelson-Tasman
Source: Telegraph, Getty Images
Final Report

2 2015 CWC Economic Impact on the Nelson-Tasman October 2012
Economic Impact of Hosting 2015 Cricket World Cup Games in
the Nelson-Tasman
Table of Contents
1. Summary ........................................................................................................ 3
2. Introduction ................................................................................................... 6
2.1 Method ............................................................................................................... 6
2.2 Report outline ..................................................................................................... 8
3. Direct Expenditure from CWC 2015 ............................................................ 9
3.1 Visitors to the Nelson-Tasman............................................................................ 9
3.2 Direct expenditure from visitors to CWC ........................................................... 13
4. Economic Impact Analysis......................................................................... 16
4.1 Economic Impact of Scenario 1 on the Nelson-Tasman region – high quality matches ............................................................................................................ 16
4.2 Economic Impact of Scenario 2 on the Nelson-Tasman region – low quality matches ............................................................................................................ 17
4.3 Scenario Comparison ....................................................................................... 19
5. Appendix – Multiplier Analysis .................................................................. 21
Tables
Table 1.1 Economic Impact of CWC scenarios on Nelson-Tasman ................................. 4
Table 3.1 Estimated number of spectators ....................................................................... 9
Table 3.2 Spectator analysis .......................................................................................... 10
Table 3.3 Profile of players, support staff and CWC officials .......................................... 11
Table 3.4 Profile of media ............................................................................................... 11
Table 3.5 Profile of a host team ...................................................................................... 12
Table 3.6 Expenditure patterns, New Zealand and international .................................... 12
Table 3.7 Spending projection for Scenario 1 – High ..................................................... 13
Table 3.8 Spending projection for Scenario 2 – Low ...................................................... 14
Table 4.1 Economic impact of Scenario 1 - high ............................................................ 16
Table 4.2 Economic impact of Scenario 1 + hosting ....................................................... 17
Table 4.3 Economic impact of Scenario 2 - low .............................................................. 17
Table 4.4 Economic impact of Scenario 2 + hosting ....................................................... 18
Table 4.5 Comparison of expenditure, GDP and employment for each scenario ........... 19

3 2015 CWC Economic Impact on the Nelson-Tasman October 2012
1. Summary
The Cricket World Cup (CWC) is one of the biggest international sporting events in one day test
cricket. Held every four years, the CWC attracts teams and audiences from 14 cricketing nations for
49 matches over 11 weeks.
Australia and New Zealand are co-hosting the CWC in 2015. The locations of the matches are yet to
be decided and will be split evenly between Australia and New Zealand.
The Nelson Regional Economic Development Agency (EDA) is exploring the value of bidding to host
games (two pool matches and two warm up games) as well as hosting a team for each game.
BERL was commissioned by the Nelson Regional EDA to undertake an economic impact analysis of
the 2015 CWC on the Nelson-Tasman region.
This report identifies the economic impact of hosting the four CWC games on the Nelson-Tasman
economy as well as the additional impact of hosting a team.
The impact of holding the games is highly linked to the number of spectators. The spectators
attending matches will be highly dependent on the world ranking of the team playing, with the most
popular teams such as New Zealand and Australia attracting larger crowd numbers than lower
ranked teams. Therefore, to assess the lowest and highest economic impact on Nelson-Tasman
hosting the four CWC games, we have measured the impacts under two scenarios:
Scenario 1 – High: This assumes that Nelson-Tasman receives four CWC games that
includes a top ranked or popular team.
Scenario 2 – Low: This assumes that Nelson-Tasman receives four CWC games that
include only lower ranked or unpopular team.
The economic impact analysis identifies additional spending (expenditure) directly generated by the
above scenarios.

4 2015 CWC Economic Impact on the Nelson-Tasman October 2012
CWC Economic Impact on Nelson-Tasman
The Table below shows the economic impact on the Nelson-Tasman economy of hosting four games
and then hosting a cricket team under both scenarios.
Table 1.1 Economic Impact of CWC scenarios on Nelson-Tasman
The impact of the additional expenditure generated by the four games and hosting a cricket team is
expressed in terms of GDP and employment.
Under Scenario 1 – High, where Nelson-Tasman hosts games that include a higher ranked or popular
team, it is estimated that there will be 5,620 out-of-region visitors spending a total of $2.8 million in
the Nelson Region due to the two pool and warm up matches. The additional expenditure of $2.8
million generates direct GDP and employment of $1.4 million and 30 FTEs for one year. Adding
indirect and induced effects increases GDP to $2.4 million and employment to 40 FTEs for one year.
If Nelson-Tasman also hosted a team, the number of out-of-region visitors increases to 5,647 people
and expenditure increases to $3.1 million. This additional expenditure generates direct GDP and
employment of $1.5 million and 33 FTEs for one year. Adding indirect and induced effects increases
GDP to $2.6 million and employment to 44 FTEs for one year.
Scenario 1 - high Direct Total
Expenditure ($m) 2.8 4.6
GDP ($m) 1.4 2.4
Employment (FTEs) 30 40
Scenario 1 + hosting Direct Total
Expenditure ($m) 3.1 5.1
GDP ($m) 1.5 2.6
Employment (FTEs) 33 44
Scenario 2 - low Direct Total
Expenditure ($m) 1.3 2.2
GDP ($m) 0.7 1.1
Employment (FTEs) 14 19
Scenario 2 + hosting Direct Total
Expenditure ($m) 1.6 2.7
GDP ($m) 0.8 1.3
Employment (FTEs) 17 23
Source: BERL

5 2015 CWC Economic Impact on the Nelson-Tasman October 2012
Under Scenario 2 – Low, where Nelson-Tasman hosts matches with lower ranked teams, it is
estimated that the 2,429 out-of-region visitors will spend a total of $1.3 million in the Nelson Region
due to the two pool and warm up matches. This additional expenditure generates direct GDP and
employment of $700,000 and 14 FTEs for one year. Adding indirect and induced effects increases
GDP to $1.1 million and employment to 19 FTEs for one year.
If Nelson-Tasman also hosted a team, the number of out-of-region visitors increases to 2,456 people
and expenditure increases to $1.6 million. This additional expenditure generates direct GDP and
employment of $800,000 and 17 FTEs for one year. Adding indirect and induced effects increases
GDP to $1.3 million and employment to 23 FTEs for one year.

6 2015 CWC Economic Impact on the Nelson-Tasman October 2012
2. Introduction
BERL was commissioned by the Nelson Regional Economic Development Agency (EDA) to provide an
economic impact analysis on the Nelson-Tasman regional economy from hosting Cricket World Cup
(CWC) 2015 warm up and pool games.1
The CWC is the premier international championship of men’s One Day International cricket
organised by the International Cricket Council. The CWC started in England in 1975 and is held every
four years.
The CWC has a total of 49 matches (excluding warm-ups) held over four stages:
Stage 1: The 14 teams are divided into two pools of seven. Each team will play six
games in its group.
Stage 2: The top four teams from each group play in the quarter finals.
Stage 3: The four top teams will play in the semi finals
Stage 4: Finals
The 11th
CWC is in 2015 and will be jointly hosted by Australia and New Zealand. There will be a total
of 14 international teams competing for the CWC over 11 weeks during February/March in 2015.
The location of the games will be evenly split between the two countries. 2
The Nelson Regional EDA has expressed its interest to bid for four games (two pool matches and two
warm up games) and has offered to host a team during stage 1 of the event.
2.1 Method
The CWC will attract spectators, cricket teams (players and support crews), match officials, CWC
officials, national delegates and media from around the world. These attendees will spend money
within the Nelson-Tasman. The additional expenditure generated as a result of the CWC is based on
those visiting from outside the Nelson-Tasman.
The level of attendance of these visitors at the two pool matches and two warm up matches held in
the region is highly dependent on the popularity/ranking of the team playing. The analysis explores
two scenarios to measure the likely impact of these matches on the Nelson-Tasman:
1 The Nelson-Tasman or Nelson-Tasman region consists of the Nelson City Council and the Tasman District Council. 2 This includes 10 Full Members (Australia, Bangladesh, England, India, New Zealand, Pakistan, South Africa, Sri Lanka, West Indies and Zimbabwe) who receive automatic qualification, and four qualifying associated or affiliated members.

7 2015 CWC Economic Impact on the Nelson-Tasman October 2012
Scenario 1 – High: the high scenario is based on a Tier One team playing.
Scenario 2 – Low: the low scenario is based on the games being played between second
tier teams (Tier Two).
A Tier One team, based on the International Cricket Council’s One Day International cricket rankings,
is likely to be one of the top eight ranked nations, such as Australia, South Africa, Pakistan, New
Zealand and India. Tier One also includes popular teams such as Ireland which are likely to attract a
greater number of visitors.
On top of these two scenarios, we have also measured the impact from the Nelson-Tasman hosting a
team during the CWC for both scenarios.
To measure the additional expenditure generated, as a result of the Nelson-Tasman hosting pool
matches and events under the above scenarios, BERL gathered existing information on the CWC and
used the economic impact assessments (EIAs) of two major sporting events already completed for
the Nelson-Tasman, the 2012 Rugby World Cup and the 2015 FIFA U20 World Cup.3
The information gathered from these sources were combined to provide information on the number
and type of people attending pool and warm up matches (i.e. participants, event organisers,
spectators, media), their likely expenditure and their length of stay in the region.
This expenditure was then analysed using a regional input-output model of the Nelson City. 4
This
model calculated the direct impact on the regional economy in terms of Gross Domestic Product
(GDP) and employment (FTEs).5
Multiplier analysis was then used to identify the indirect and induced activity generated as a result of
the initial expenditure. 6
Together, this information was used to determine the total impact of the
CWC on the Nelson-Tasman economy.
3 Nelson-Tasman RWC EIA completed by BERL in 2008 and the 2015 FIFA U20 World Cup EIA completed by John Cook & Associates in 2011. 4 BERL uses 2005/06 regional input-output tables and multipliers developed by Butcher and Associates. Although the multipliers are of the Nelson City, Nevertheless, we believe the multipliers used provide a valid reflection of the impact of the CWC on the Nelson-Tasman region. 5 The volume of employment is usually expressed in Full-Time Equivalent jobs (FTEs). For a given year, Full Time Equivalents are calculated by counting the number of full-time employees, working proprietors and one-third of the number of part-time employee. In other words, there are three part-time employees for every full-time employee. 6 Further information on multiplier analysis is provided in the Appendix.

8 2015 CWC Economic Impact on the Nelson-Tasman October 2012
2.2 Report outline
The remainder of this report is set out as follows: Section 3 details the key inputs used to estimate
the likely direct expenditure generated as a result of hosting CWC games (the scenarios) and hosting
a team. Section 4 then uses the direct expenditures identified in Section 3 to estimate the economic
impact of the scenarios. An appendix explaining multiplier analysis and the key economic terms is
included in section 5.

9 2015 CWC Economic Impact on the Nelson-Tasman October 2012
3. Direct Expenditure from CWC 2015
Under Scenario 1 – High, where the Nelson-Tasman receives highly ranked or popular teams, it is
estimated that there will be 5,620 out-of-region visitors spending a total of $2.8 million in the Nelson-
Tasman region due to the two pool and warm up matches. If Nelson-Tasman hosted a team, the
number of out-of-region visitors increases to 5,647 people and expenditure increases to $3.1 million.
Under Scenario 2 – Low, where Nelson-Tasman receives lower ranked or unpopular teams, it is
estimated that the 2,429 out-of-region visitors will spend a total of $1.3 million in the Nelson-Tasman
region due to the two pool and warm up matches. If Nelson-Tasman hosted a team, the number of
out-of-region visitors increases to 2,456 people and expenditure increases to $1.6 million.
This section details the key inputs used to determine the additional expenditure generated from:
Nelson-Tasman hosting two warm up games and two pool matches that include a Tier
One team (Scenario 1) or Tier Two team (Scenario 2); and
Hosting the above Tier One or Tier Two match plus hosting a CWC team under both
scenarios.
3.1 Visitors to the Nelson-Tasman
From hosting CWC games, there will be different types of visitors to the Nelson-Tasman, such as
spectators, media, officials, and players. These visitors will stay and spend different amounts of time
and money within the region.
The number, expenditures, and length of stay of these different types of visitors are described
separately below.
3.1.1 Spectators
Number of spectators
Table 3.1 below provides the estimated number of spectators at warm-up and pool matches under
each scenario as estimated by the Nelson Regional EDA.
Table 3.1 Estimated number of spectators
Spectators Number of games
Scenario 1high
Scenario 2low
Warm up match 2 3,000 1,000Pool match 2 6,000 4,000
Source: BERL
10 2015 CWC Economic Impact on the Nelson-Tasman October 2012
It is estimated that for the two warm up matches, there will be 1,000 spectators if the teams are Tier
Two (Scenario 2) and 3,000 spectators if the game is Tier One (Scenario 1).
For pool matches, it is estimated that the number of spectators could range from 4,000 if it is a Tier
Two match to 6,000 if it is a Tier One match.
Therefore in total, the games could attract between 5,000 (under Scenario 2) and 9,000 (under
Scenario 1) spectators depending on the quality of the teams.
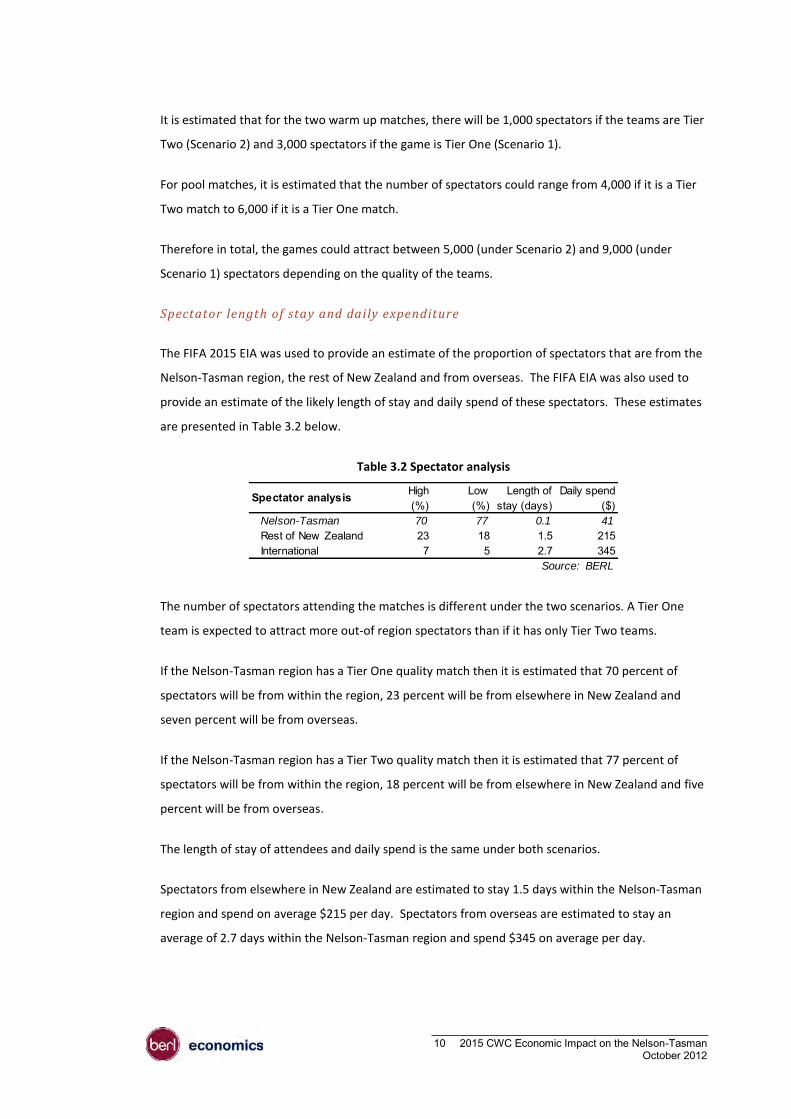
Spectator length of stay and daily expenditure
The FIFA 2015 EIA was used to provide an estimate of the proportion of spectators that are from the
Nelson-Tasman region, the rest of New Zealand and from overseas. The FIFA EIA was also used to
provide an estimate of the likely length of stay and daily spend of these spectators. These estimates
are presented in Table 3.2 below.
Table 3.2 Spectator analysis
The number of spectators attending the matches is different under the two scenarios. A Tier One
team is expected to attract more out-of region spectators than if it has only Tier Two teams.
If the Nelson-Tasman region has a Tier One quality match then it is estimated that 70 percent of
spectators will be from within the region, 23 percent will be from elsewhere in New Zealand and
seven percent will be from overseas.
If the Nelson-Tasman region has a Tier Two quality match then it is estimated that 77 percent of
spectators will be from within the region, 18 percent will be from elsewhere in New Zealand and five
percent will be from overseas.
The length of stay of attendees and daily spend is the same under both scenarios.
Spectators from elsewhere in New Zealand are estimated to stay 1.5 days within the Nelson-Tasman
region and spend on average $215 per day. Spectators from overseas are estimated to stay an
average of 2.7 days within the Nelson-Tasman region and spend $345 on average per day.
Spectator analysis High(%)
Low (%)
Length of stay (days)
Daily spend ($)
Nelson-Tasman 70 77 0.1 41
Rest of New Zealand 23 18 1.5 215International 7 5 2.7 345
Source: BERL

11 2015 CWC Economic Impact on the Nelson-Tasman October 2012
3.1.2 Teams, support crews, and match officials
Based on the FIFA 2015 EIA, Table 3.3 provides a breakdown of players, match officials and support
crews, as well as their length of stay and daily spend.
Table 3.3 Profile of players, support staff and CWC officials
The above table shows the range of people involved with the running of the two cricket matches and
two warm-up matches.
The number of players, support staff, match officials, inspection visitors, CWC officials, and national
delegates does not change under Scenario 1 and Scenario 2, and their length of stay and daily spend
does not vary under both scenarios.
It was estimated that a total of 67 players and associated officials and delegates will be in the
Nelson-Tasman region for each match. The length of stay varies by category from 1.5 days for
inspection visitors to three days for players and support staff, an average of 2.5 days. On average,
daily spend is estimated at $363.
3.1.3 Media
The number of media personnel present at the matches was estimated based on the FIFA 2015 EIA.
We have assumed that only half of the media present at a pool match would attend warm up
matches. Table 3.4 provides an estimate of the number of media personnel, their length of stay, and
their daily spend.
Table 3.4 Profile of media
CategoryTotal
number(high)
Total number(low )
Length of stay (days)
Daily spend ($)
Players 42 42 3 363Support staff 6 6 3 363Match officials 6 6 2 363Inspection visit 2 2 1.5 363CWC officials 5 5 2 363National delegates 6 6 2 363
Total 67 67 2.5 363Source: BERL
Media High Low Length of stay(days)
Daily spend($)
Media contingent (match) 30 20 1.9 363Media contingent (w arm up) 15 10 1.9 363
Source: BERL

12 2015 CWC Economic Impact on the Nelson-Tasman October 2012
It is estimated that media attending pool matches could be between 20 to 30 depending on the
quality of the match. The number of media personnel attending the two warm up matches in the
Nelson-Tasman region could vary between 10 and 20 personnel. For both pool and warm up
matches, media are estimated to stay on average 1.9 days and spend an average of $363 per day
within the Nelson-Tasman region.
3.1.4 The addition of hosting a team
The Nelson-Tasman could potentially host a team during pool play. The team and entourage
numbers are based on FIFA 2015 EIA estimates. Table 3.2 estimates the number of player and
support staff along with their length of stay and daily spend.
Table 3.5 Profile of a host team
Hosting a team is the same under both scenarios. It is estimated that hosted teams have 21 players
and six support staff staying 20 days (3 weeks) with a daily spend of $363.
3.1.5 Expenditure patterns for all visitors
The matches will attract people from outside the Nelson-Tasman region and New Zealand. These
people spend significant sums of money during their stay in hotels, restaurants, travel, and general
retail within the region. Table 3.6 shows the proportion of expenditure across eight broad categories
for all visitors to the Nelson-Tasman region.
Table 3.6 Expenditure patterns, New Zealand and international
Hosting a teamTotal number Length of
stay(days)
Daily spend($)
Players 21 20 363Support staff 6 20 363
Source: BERL
Expenditure Rest of New Zealand
International
Accomodation cost 15% 30%Food 37% 39%Local transport spend 6% 3%Fuel/petrol 9% 11%Retail spend 15% 8%Attractions 7% 3%Travel non-air 5% 3%Travel air 6% 3%
Total 100% 100%Source: BERL

13 2015 CWC Economic Impact on the Nelson-Tasman October 2012
The expenditure patterns are based on those from the Rugby World Cup 2011 EIA. Analysis of the
survey data revealed different spending patterns for those visiting the Nelson-Tasman region from
elsewhere in New Zealand and for those visiting the region from overseas.
It is estimated that visitors to the Nelson-Tasman region from elsewhere in New Zealand spend most
of their money on food (37 percent) followed by accommodation (15 percent), and retail (15
percent). For international visitors to the Nelson-Tasman region, the large expenditure areas are
food (39 percent), accommodation (30 percent) and fuel (11 percent).
3.2 Direct expenditure from visitors to CWC
The total additional expenditure is calculated by identifying the number of people attracted to the
region for the event and then identifying their daily expenditure and multiplying this by the number
of days they stay. Expenditure by local residents (i.e. from the Nelson-Tasman region) is excluded as
it is considered a recycling of money that is already present within the local economy.
3.2.1 Scenario 1– High: Out-of-region expenditure
Table 3.7 shows the estimated number of people, length of stay, daily spend and total expenditure
of visitors to both pool and warm up matches. It also shows the additional expenditure generated
from the Nelson-Tasman region hosting a team.
Table 3.7 Spending projection for Scenario 1 – High
Based on the assumptions made in the previous section, it is estimated that there will be a total of
18,100 visitors to pool and warm up matches. Of these visitors, 12,000 are estimated to come to the
Number of visitors
Length of stay
(days)
Daily spend
($)
Expenditure($)
Number of visitors
Length of stay
(days)
Daily spend
($)
Expenditure($)
SpectatorsNelson-Tasman 8,348 0.1 41 4,174 0.1 41
Rest of New Zealand 2,817 1.5 215 908,609 1,409 1.5 215 454,304 1,362,913International 840 2.7 345 782,460 420 2.7 345 391,230 1,173,690
Sub-total spectators 12,005 1,691,069 6,003 845,534 2,536,603
Players, VIP and mediaPlayers 84 3 363 91,476 84 3 363 91,476 182,952Support staff 12 3 363 13,068 12 3 363 13,068 26,136Match off icials 12 2 363 8,712 12 2 363 8,712 17,424Inspection visit 4 1.5 363 2,178 4 1.5 363 2,178 4,356CWC officials 10 2 363 7,260 10 2 363 7,260 14,520National delegates 12 2 363 8,712 12 2 363 8,712 17,424
Sub-total players, VIP, media 134 131,406 134 131,406 262,812
Scenario 1: total expenditure 12,139 1,822,475 6,137 976,940 2,799,415
Scenario 1a: hosting a teamPlayers 21 20 363 152,460 21 20 363 152,460 304,920Support staff 6 20 363 43,560 6 20 363 43,560 87,120Less players/support staff -52,272 -52,272 -104,544
Sub-total for hosting a team 143,748 143,748 287,496
Scenario 1a : Total expenditure 1,966,223 1,120,688 3,086,911Source: BERL
Scenario 1 - Tier One team (high)Total
expenditure ($)
Pool matches (X2) Warm up matches (X2)

14 2015 CWC Economic Impact on the Nelson-Tasman October 2012
two pool matches and 6,000 to the two warm up matches. In total, 5,600 out-of-region visitors
(3,800 for pool matches and 1,800 for warm up matches) are expected to attend.
The majority of visitors will be spectators, 12,000 for pool matches and 6,000 for warm up matches.
Players, VIP and media remain the same at 130 people at pool and warm up matches.
It is estimated that the 5,600 out-of-region visitors will spend a total of $2.8 million in the Nelson-
Tasman region due to the two pool and warm up matches. This is new expenditure spent directly
within the region as a result of the pool and warm up matches and is used to assess the economic
impact.
If the Nelson-Tasman hosted a team, the number of out-of-region visitors increases to 5,650 people
and expenditure increases to $3.1 million.
3.2.2 Scenario 2 – Low: Out-of-region expenditure
Table 3.8 shows the estimated number of people, length of stay, daily spend and total expenditure
of visitors to both the pool and warm up matches. It also shows the additional expenditure
generated from the Nelson-Tasman region hosting a team.
Table 3.8 Spending projection for Scenario 2 – Low
Based on the assumptions made in the previous section, it is estimated that there will be a total of
10,100 visitors to pool and warm up matches. Of these visitors, 8,100 are estimated to come to the
two pool matches and 2,000 to the two warm up matches. In total, there were 2,400 out-of-region
visitors (1,970 for pool matches and 460 for warm up matches).
Number of visitors
Length of stay
(days)
Daily spend($)
Expenditure($)
Number of visitors
Length of stay
(days)
Daily spend($)
Expenditure($)
SpectatorsNelson-Tasman 6,154 0.1 36 1,538 0.1 36
Rest of New Zealand 1,436 1.5 216 465,231 359 1.5 216 116,308 581,538International 400 2.7 348 375,840 100 2.7 348 93,960 469,800
Sub-total spectators 7,990 841,071 1,997 210,268 1,051,338
Players, VIP and mediaPlayers 84 3 363 91,476 84 3 363 91,476 182,952Support staff 12 3 363 13,068 12 3 363 13,068 26,136Match off icials 12 2 363 8,712 12 2 363 8,712 17,424Inspection visit 4 1.5 363 2,178 4 1.5 363 2,178 4,356CWC officials 10 2 363 7,260 10 2 363 7,260 14,520National delegates 12 2 363 8,712 12 2 363 8,712
Sub-total players, VIP, media 134 131,406 134 131,406 262,812
Scenario 2: total expenditure 8,124 972,477 341,674 1,314,150
Scenario 2a: hosting a teamPlayers 21 20 363 152,460 21 20 363 152,460 304,920Support staff 6 20 363 43,560 6 20 363 43,560 87,120Less players/support staff -52,272 -52,272
Sub-total for hosting a team 143,748 143,748 287,496Scenario 2a : Total expenditure 1,116,225 485,422 1,601,646
Source: BERL
Pool matches (X2) Warm up matches (X2)
Scenario 2 - Tier One team (low)Total
expenditure ($)

15 2015 CWC Economic Impact on the Nelson-Tasman October 2012
The majority of visitors are from spectators 8,000 for pool matches and 2,000 for warm up matches.
Players, VIP and media remain the same at 134 people at pool matches and warm up matches.
It is estimated that the 2,400 out-of-region visitors will spend a total of $1.3 million in the Nelson-
Tasman region due to the two pool and warm up matches. This is new expenditure spent directly
within the region as a result of the pool and warm up matches and is used to assess the economic
impact.
If the Nelson-Tasman hosted a team, the number of out-of-region visitors increases to 2,460 people
and expenditure increases to $1.6 million.
16 2015 CWC Economic Impact on the Nelson-Tasman October 2012
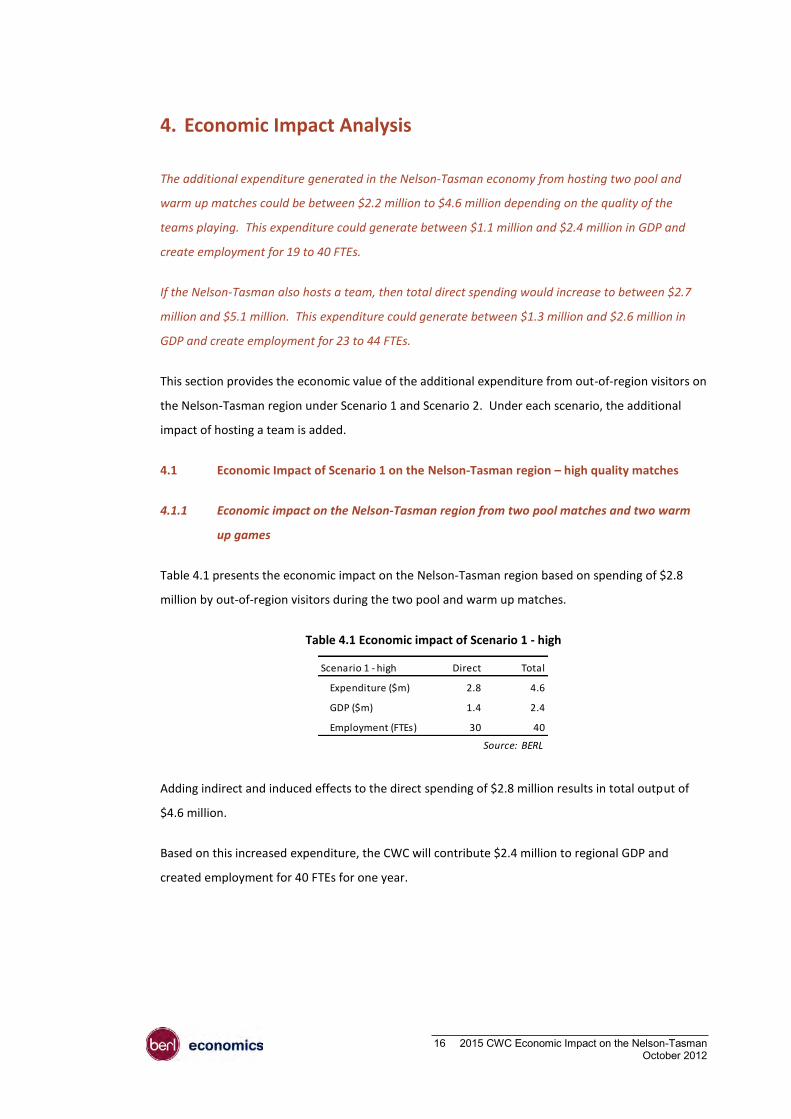
4. Economic Impact Analysis
The additional expenditure generated in the Nelson-Tasman economy from hosting two pool and
warm up matches could be between $2.2 million to $4.6 million depending on the quality of the
teams playing. This expenditure could generate between $1.1 million and $2.4 million in GDP and
create employment for 19 to 40 FTEs.
If the Nelson-Tasman also hosts a team, then total direct spending would increase to between $2.7
million and $5.1 million. This expenditure could generate between $1.3 million and $2.6 million in
GDP and create employment for 23 to 44 FTEs.
This section provides the economic value of the additional expenditure from out-of-region visitors on
the Nelson-Tasman region under Scenario 1 and Scenario 2. Under each scenario, the additional
impact of hosting a team is added.
4.1 Economic Impact of Scenario 1 on the Nelson-Tasman region – high quality matches
4.1.1 Economic impact on the Nelson-Tasman region from two pool matches and two warm
up games
Table 4.1 presents the economic impact on the Nelson-Tasman region based on spending of $2.8
million by out-of-region visitors during the two pool and warm up matches.
Table 4.1 Economic impact of Scenario 1 - high
Adding indirect and induced effects to the direct spending of $2.8 million results in total output of
$4.6 million.
Based on this increased expenditure, the CWC will contribute $2.4 million to regional GDP and
created employment for 40 FTEs for one year.
Scenario 1 - high Direct Total
Expenditure ($m) 2.8 4.6
GDP ($m) 1.4 2.4
Employment (FTEs) 30 40
Source: BERL

17 2015 CWC Economic Impact on the Nelson-Tasman October 2012
4.1.2 Scenario 1 plus hosting a cricket team
Table 4.2 presents the economic impact on the Nelson-Tasman region based on spending of $3.1
million by out-of-region visitors if the Nelson-Tasman hosted a team on top of holding two pool and
warm up matches.
Table 4.2 Economic impact of Scenario 1 + hosting
Adding indirect and induced effects to the direct spending of $3.1 million results in total output of
$5.1 million.
Based on this increased expenditure, the CWC will contribute $2.6 million to regional GDP and create
employment for 44 FTEs for one year.
4.2 Economic Impact of Scenario 2 on the Nelson-Tasman region – low quality matches
4.2.1 Economic impact on the Nelson-Tasman region from holding two pool matches and two
warm up games
Table 4.3 presents the economic impact on the Nelson-Tasman region based on spending of $1.3
million by out-of-region visitors during the two pool and warm up matches.
Table 4.3 Economic impact of Scenario 2 - low
Adding indirect and induced effects to the direct spending of $1.3 million results in total output of
$2.2 million.
Based on this increased expenditure, the CWC will contribute $1.1 million to regional GDP and create
employment for 19 FTEs for one year.
Scenario 1 + hosting Direct Total
Expenditure ($m) 3.1 5.1
GDP ($m) 1.5 2.6
Employment (FTEs) 33 44
Source: BERL
Scenario 2 - low Direct Total
Expenditure ($m) 1.3 2.2
GDP ($m) 0.7 1.1
Employment (FTEs) 14 19
Source: BERL

18 2015 CWC Economic Impact on the Nelson-Tasman October 2012
4.2.2 Scenario 2 plus hosting a cricket team
Table 4.2 presents the economic impact on the Nelson-Tasman region based on spending of $1.6
million by out-of-region visitors if the Nelson-Tasman hosted a team on top of holding two pool and
warm up matches.
Table 4.4 Economic impact of Scenario 2 + hosting
Adding indirect and induced effects to the direct spending of $1.6 million results in total output of
$2.7 million.
Based on this increased expenditure, the CWC will contribute $1.3 million to regional GDP and create
employment for 23 FTEs for one year.
Scenario 2 + hosting Direct Total
Expenditure ($m) 1.6 2.7
GDP ($m) 0.8 1.3
Employment (FTEs) 17 23
Source: BERL

19 2015 CWC Economic Impact on the Nelson-Tasman October 2012
4.3 Scenario Comparison
Table 4.5 compares the economic impact of the two scenarios with the addition of hosting. The
economic impact is expressed in terms of expenditure, GDP and employment.
Table 4.5 Comparison of expenditure, GDP and employment for each scenario
Under Scenario 1 – High, the additional expenditure of $2.8 million generates direct GDP and
employment of $1.4 million and 30 FTEs for one year. Adding indirect and induced effects increases
GDP to $2.4 million and employment to 40 FTEs for one year. Including hosting sees additional
expenditure of $3.1 million generate direct GDP and employment of $1.5 million and 33 FTEs for one
year. Adding indirect and induced effects increases GDP to $2.6 million and employment to 44 FTEs
for one year.
Under Scenario 2 – Low, the additional expenditure of $1.3 million generates direct GDP and
employment of $700,000 and 14 FTEs for one year. Adding indirect and induced effects increases
GDP to $1.1 million and employment to 19 FTEs for one year. Including hosting sees additional
expenditure of $1.6 million generate direct GDP and employment of $800,000 and 17 FTEs for one
year. Adding indirect and induced effects increases GDP to $1.3 million and employment to 23 FTEs
for one year.
Expenditure ($m) Direct Total
Scenario 1 - high 2.8 4.6
Scenario 1 - high + hosting 3.1 5.1
Scenario 2 - low 1.3 2.2
Scenario 2 - low + hosting 1.6 2.7
GDP ($m) Direct Total
Scenario 1 - high 1.4 2.4
Scenario 1 - high + hosting 1.5 2.6
Scenario 2 - low 0.7 1.1
Scenario 2 - low + hosting 0.8 1.3
Employment (FTEs) Direct Total
Scenario 1 - high 30 40
Scenario 1 - high + hosting 33 44
Scenario 2 - low 14 19
Scenario 2 - low + hosting 17 23
Source: BERL

20 2015 CWC Economic Impact on the Nelson-Tasman October 2012
In hosting a team under the two scenarios, there is an additional expenditure of $300,000 (i.e. on top
of the added expenditure of having the four games), which generates an additional $100,000 in GDP
and 3 FTEs.

21 2015 CWC Economic Impact on the Nelson-Tasman October 2012
5. Appendix – Multiplier Analysis
This multiplier analysis uses multipliers derived from inter-industry input-output tables. These input-
output tables are purchased from Butcher Partners, Canterbury – a recognised source for regional
input-output tables and multipliers.
Multipliers allowed us to identify the direct, indirect and induced effects in terms of output (GDP)
and Full Time Equivalent (FTE) employment.
5.1.1 Measures
5.0.1 Gross Output Multipliers
Gross output is the value of production, built up through the national accounts as a measure, in most
industries, of gross sales or turnover. This is expressed in $ million at constant prices. Gross output
is made up of the sum of:
compensation of employees (i.e. salaries and wages)
income from self employment
depreciation
profits
indirect taxes less subsidies
intermediate purchases of goods (other than stock in trade)
intermediate purchases of services.
5.0.2 Value added (GDP) multipliers
Value added multipliers measure the increase in output generated along the production chain,
which, in aggregate, totals Gross Domestic Product (GDP). Value added is made up of the sum of:
compensation of employees (i.e. salaries and wages)
income from self employment
depreciation
profits
indirect taxes less subsidies.
5.0.3 Employment Impact multipliers
Employment impact multipliers determine the number of FTE roles that are created for every $1
million spent in an industry for one year. It provides a measure of total labour demand associated

22 2015 CWC Economic Impact on the Nelson-Tasman October 2012
with Gross Output. An FTE is the percentage of time an employee works represented as a decimal.
A full-time position is 1.00; a part-time position is 0.50.
5.1.2 Direct, indirect and induced effects
The underlying logic of multiplier analysis is relatively straightforward. An initial expenditure (direct
effect) in an industry creates flows of expenditures that are magnified, or “multiplied”, as they flow
on to the wider economy. This occurs in two ways:
The industry purchases materials and services from supplier firms, who in turn make further
purchases from their suppliers. This generates an indirect effect.
Persons employed in the direct development and in firms supplying services earn income (mostly
from wages and salaries, but also from profits) which, after tax is deducted, is then spent on
consumption. There is also an allowance for some savings. These are the induced effects. Hence,
for any amount spent in an area (direct effect), the actual output generated from that spend is
greater once the flow on activity generated (indirect and induced effects) is taken into account.
5.1.3 Limitations of multiplier analysis
5.0.1 Partial equilibrium analysis
Multiplier analysis is only a “partial equilibrium” analysis, assessing the direct and indirect effects of
the development being considered, without analysing the effects of the resources used on the wider
national economy. In particular, it assumes that the supply of capital, productive inputs and labour
can expand to meet the additional demand called forth by the initial injection and the flow on
multiplier effects, without leading to resource constraints in other industries. These constraints
would lead to price rises and resulting changes in overall patterns of production between industries.
To assess inter-industry impacts in full would require economic modelling within a “general
equilibrium” framework. Applying such models becomes more relevant where the particular
development is considered significant within the overall economy.
5.0.2 Additionality
Related to partial equilibrium, using multipliers for economic impact assessments assumes that the
event is something that would not have been undertaken anyway and that it will not displace
existing activity. That is, the event is additional to existing activity. If it does either of the above,
then the economic impact is less than that determined by the multiplier and it would be necessary to
subtract both the activity that would have occurred anyway and the displacement effect.

23 2015 CWC Economic Impact on the Nelson-Tasman October 2012
5.0.3 Impact
Again related to “partial equilibrium”, multiplier analysis assumes that an event will not have an
impact on relative prices. However, in a dynamic environment, it can be assumed that a large event
would have an impact on demand and supply and hence prices. Hence, the larger the event and the
more concentrated it is in a single industry or region, the more likely it is that the multipliers would
give an inaccurate analysis of impacts. For example, if multiplier analysis was used to determine the
effect of residential building construction nationally it would likely be inaccurate as residential
building construction accounts for over 6 percent of GDP.
5.0.4 Aggregation
Industries outlined in input-output tables are aggregates of smaller sub-industries. Each sub-
industry has unique inputs and outputs. The higher the level of aggregation the less accurate these
inputs and outputs become. Thus, if determining the multiplier effect of a very specific event using
highly aggregated data, there will be a lower level of accuracy. Similarly, if an event encompasses a
range of industries and multipliers from a single
All work is done, and services rendered at the request of, and for the purposes of the client only. Neither BERL nor any of its
employees accepts any responsibility on any grounds whatsoever, including negligence, to any other person.
While every effort is made by BERL to ensure that the information, opinions and forecasts provided to the client are accurate
and reliable, BERL shall not be liable for any adverse consequences of the client’s decisions made in reliance of any report
provided by BERL, nor shall BERL be held to have given or implied any warranty as to whether any report provided by BERL will
assist in the performance of the client’s functions.