Embed Size (px)
Citation preview

9081VGJlr
AMVM8Il ONn.:l-)lNV8 lNIOr
Economic Geography of the Russian Federation
(Volume II: Data Tables)
Country Department III Europe and Central Asia Region June 1994
Pub
lic D
iscl
osur
e A
utho
rized
Pub
lic D
iscl
osur
e A
utho
rized
Pub
lic D
iscl
osur
e A
utho
rized
Pub
lic D
iscl
osur
e A
utho
rized
Pub
lic D
iscl
osur
e A
utho
rized
Pub
lic D
iscl
osur
e A
utho
rized
Pub
lic D
iscl
osur
e A
utho
rized
Pub
lic D
iscl
osur
e A
utho
rized

#

Economic Geography of the Russian Federation
(Volume II: Data Tables)
:l i ",
)::10.' j ;)
""0 ~ ::QJ i -0: ~ G
,I', ::I - \) '"", ;;.' ,S; ~ -<
'Tl c :::> 0.,
Country Department III Europe and Central Asia Region June 1994


Economic Geography of the Russian Federation
Table of Contents
Volume II: (Data Source) Page No.
I. Ethnic Composition of Autonomous Areas .......................................................... 1
II Regional Statistics .......................................................................... 3 Industrial ............................................................................. 3 Population ............................................................................ 7 Nationality ........................................................................... 11 Unemployment ........................................................................ 11 State Sector Employment .................................................................. 15 Wages ............................................................................. 19 Income and Expenditures .................................................................. 19 Budgetary Data ........................................................................ 23 Privatization Indicators ................................................................... 23


Page I
Ethnic Composition of Autonomous Areas in Russia, 1989
Percent Status Total Titular Percent titular at 1989
Region Population Russians nationality Russian nationality census
RUSSIAN FEDERATION 147,022 119,866 119,866 81.5 81.5
Northern region 6,124 5,017 81.9
Karelia Republic 790 582 79 73.6 10.0 ASSR
Komi Republic 1,251 722 292 57.7 23.3 ASSR
NenetsAOkr 54 35 6 65.8 11.9 AOkr
Northwestern region 8,241 7,461 90.5
Central region 28,544 26,631 93.3
Volgo-Vyatsk region 8,464 6,353 75.1
Mariy EI Republic 749 356 324 47.5 43.3 ASSR Mordvinia Republic 964 586 313 60.8 32.5 ASSR Chuvashia Republic 1,338 357 907 26.7 67.8 ASSR
Central Chernozem region 7,733 7,363 95.2
Povolzhkiy region 16,397 12,052 73.5
Kalmykia Republic 323 122 146 37.7 45.4 ASSR
Tatarstan Republic 3,642 1,575 1,765 43.3 48.5 ASSR
North-Caucasus region 16,629 11,234 67.6 Adygea Republic 432 294 95 68.0 22.1 AO Dagestan Republic 1,802 166 1,445 9.2 80.2 ASSR Kabardino-Balkaria Republic 754 241 434 31.9 57.6 ASSR Karachay-Cherkessia Republic 415 176 170 42.4 40.9 AO North Ossetia Republic 632 189 335 29.9 53.0 ASSR Chechenia and Ingushetia Republics 1,270 294 898 23.1 70.7 ASSR
Urals region 20,239 14,769 73.0 Bashkortostan Republic 3,943 1,548 864 39.3 21.9 ASSR Udmurtia Republic 1,606 945 497 58.9 30.9 ASSR Komi-Permyat AOkr 159 57 95 36.1 60.2 AOkr
West Siberian region 15,013 12,749 84.9 Altay Republic 191 115 59 60.4 31.0 AO


Page 2
Ethnic Composition of Autonomous Areas in Russia, 1989
Percent Status Total Titular Percent titular at 1989
Region Population Russians nationality Russian nationality census
Khanty-Mansi AOkr 1,282 850 18 66.3 1.4 AOkr Yamalo-Nenets AOkr 495 293 21 59.2 0.4 AOkr
East Siberian region 9,153 7,652 83.6 Buryatia Republic 1,038 726 250 69.9 24.0 ASSR Tuva Republic 309 99 198 32.0 64.3 ASSR Khakassia Republic 567 450 63 79.5 11.1 AO Taymyr AOkr 56 37 7 67.1 10.7 AOkr Evenki AOkr 25 17 3 67.5 14.0 AOkr Ust-Orda Buryat AOkr 136 77 49 56.5 36.3 AOkr AgaAOkr 77 31 42 40.8 54.9
Far Eastern region 7,950 6,347 79.8 Sakha Republic 1,094 550 365 50.3 33.4 ASSR Birobijan AO 214 178 9 83.2 4.2 AO KoryakAOkr 40 25 7 62.0 16.5 AOkr Chukotka AOkr 164 108 12 66.1 7.3 AOkr


Page 3
Regional Statistics for Russia
Branch Structure of Industry, Percent of Total Industrial Personnel Decline in
Output, 1991 working industrial Oblast Former Machine in private production,
Former Center or Center or building industrial January-
Region Republic Capital and metal Heavy Energy enterprises, September
Region Name Capital Name working industries industries 1992 1993
RUSSIAN FEDERATION 23.9 63.0 9.9 14.0 83.5
Northern region 13.3 72.7 8.1 8.1 88.0 Karelia Republic Karelia ASSR Petrozavodsk 16.4 79.7 2.7 8l.l Komi Republic Komi ASSR Syktyvkar 6.7 79.6 32.8 7.3 89.2
Arkhangel'sk Oblast Arkhangel'sk 26.1 74.9 3.0 2.4 89.0 NenetsAOkr Other Arkhangel'sk Oblast Vologda Oblast Vologda 8.9 71.3 1.3 22.5 93.6 Murmansk Oblast Murmansk 8.8 61.8 7.0 5.4 84.5
Northwestern region 33.0 66.0 5.7 14.2 83.6 Leningrad St. Petersburg Leningrad St.Petersburg city Leningrad 37.6 64.9 1.7 15.4 83.2 Leningrad Oblast 14.1 75.7 23.0 10.5 85.3
Novgorod Oblast Novgorod 41.0 72.3 1.5 1.6 86.7 Pskov Oblast Pskov 34.7 46.3 0.4 28.0 81.3
Central region 23.6 49.8 4.0 17.4 83.5 Bryansk Oblast Bryansk 29.2 46.4 2.1 14.0 76.9 Vladimir Oblast Vladimir 29.8 46.1 0.7 22.0 83.7 Ivanovo Oblast Ivanovo 4.4 8.3 0.5 14.8 76.3 Kaluga Oblast Kaluga 42.5 60.3 0.3 17.3 76.6 Kostroma Oblast Kostroma 15.0 59.0 8.0 10.7 84.9 Moscow Moscow Moscow city 26.9 58.6 4.2 17.4 87.1 Moscow Oblast 21.9 51.6 1.5 9.7 82.7
OrelOblast Ore! 36.7 59.6 1.2 59.7 81.8 Ryazan' Oblast Ryazan' 26.7 63.4 18.8 8.5 84.0 Smolensk Oblast Smolensk 26.2 51.3 7.6 36.4 87.0 Tver' Oblast Kalinin Oblast Tver' Kalinin 20.3 45.2 5.8 17.2 85.9 Tula Oblast Tula 29.0 71.5 5.7 16.7 84.4 Yaroslavl' Oblast Yaroslavl' 32.1 66.0 Il.l 20.2 83.6


Page 4
RegionarStatistics for Russia
Branch Structure of Industry, Percent of Total Industrial Personnel Decline in
Output, 1991 working industrial Oblast Former Machine in private production,
Former Center or Center or building industrial January-Region Republic Capital and metal Heavy Energy enterprises, September
Region Name Capital Name working industries industries 1992 1993
Volgo-Vyatsk region 36.3 64.7 5.0 14.6 93.2 Marly EI Republic MariyASSR Yoshkar-Ola 36.7 60.4 1.3 11.2 85.0 Mordvinia Republic Mordovinia ASSR Saransk 46.7 64.9 1.3 52.5 86.8 Chuvashia Republic Chuvash ASSR Cheboksary 33.8 53.3 2.9 22.0 85.6 Kirov Oblast Kirov 21.6 57.4 2.8 8.5 85.3 Nizhegorod Oblast Gorkiy Oblast Nizhny Novgorod Goddy 40.3 71.2 7.6 7.9 98.3
Central Chernozem region 24.6 53.0 2.4 21.7 88.2 Be1gorod Oblast Belgorod 19.4 53.3 0.4 21.7 97.8 Voronezh Oblast Voronezh 35.0 56.0 2.5 21.8 84.5 Kursk Oblast Kursk 20.3 47.4 5.9 29.5 83.1 Lipetsk Oblast Lipetsk 23.4 67.0 1.8 5.1 87.4 Tambov Oblast Tambov 19.8 38.5 1.0 32.3 88.9
Povolzhkiy region 33.9 67.5 10.6 10.8 86.9 Kalmykia Republic KalmykASSR Elista 15.4 31.8 7.3 73.5 Tatarstan Republic Tatar ASSR Kazan' 34.4 74.3 11.9 21.8 85.0 Astrakhan Oblast Astrakan' 14.5 39.6 10.4 8.7 94.5 Volgograd Oblast Volgorad 23.4 66.8 9.4 0.5 80.3 Penza Oblast Penza 39.7 54.2 2.2 3.4 89.0 Samara Oblast Kuybyshev Oblast Samara Kuybyshev 42.3 80.3 16.5 7.5 87.4 Saratov Oblast Saratov 30.0 64.2 10.3 11.1 89.8 Ul'yanovsk Oblast Ul'yanovsk Simbirsk 38.6 48.4 1.6 16.0 99.4
North-Caucasus region 20.6 46.4 5.9 14.1 78.7 Adygea Republic Adyge A. Oblast Maykop 10.9 33.8 1.0 28.9 83.7 Dagestan RepUblic Dagestan ASSR Makhachkala 23.9 46.9 3.9 1.7 71.9 Kabardino-Balkaria Republic Kabardino-Balkar ASSR Nal'chik 27.7 56.0 0.1 7.8 89.4 Karachay-Cherkessia Republic Karachay-Cherkess A. Oblast Cherkessk 22.9 4.1 68.9 North Ossetia Republic North Ossetia ASSR Grozny 24.1 63.1 0.3 3.8 71.9 Chechenia and lngushetia Republics Checheno-lngush ASSR 12.9 72.9 45.1 4.9 37.6 Krasnodar Kray Krasnodar ]2.2 31.2 2.9 18.8 86.0 Slavropol' Kray Slavropol' 16.2 36.0 5.3 20.3 83.9 Rostov Oblast Rostov-na-Donu 30.3 58.0 5.2 14.5 83.2


Page 5
Regional Statistics for Russia
Branch Structure of Industry, Percent of Total Industrial Personnel Decline in
Output, 1991 working industrial Oblast Former Machine in private production,
Former Center or Center or building industrial January-Region Republic Capital and metal Heavy Energy enterprises, September
Region Name Capital Name working industries industries 1992 1993
Urals region 27.2 77.8 10.8 15.7 83.8
Bashkortostan Republic Bashkir ASSR Ufa 23.9 73.5 22.4 18.3 82.9
Udmurtia Republic UdmurtASSR Izhevsk 56.2 77.6 5.4 6.0 86.2
Kurgan Oblast Kurgan 42.3 54.4 1.0 30.9 90.0
Orenburg Oblast Orenburg 18.2 67.8 28.0 5.5 92.7 Perm' Oblast Perm' 25.5 78.1 15.0 27.9 83.3
Komi-Permyat AOkr Other Perm' Oblast
Sverdlovsk Oblast Yekaterinburg Sverdlovsk 21.8 83.2 3.7 2.6 83.9
Chelyabinsk Oblast Chelyabinsk 30.0 82.7 3.2 27.5 80.6
West Siberian region 17.6 74.7 32.4 10.2 85.4 Altay Republic Gorno Altay A. Oblast Gorno-Altaysk 4.6 35.0 0.2 17.2 87.9 AltayKray Bamual 31.3 58.2 1.6 3.9 76.0 Kemerovo Oblast Kemerovo 13.1 75.7 20.3 15.7 87.3
Novosibirsk Oblast Novosibirsk 32.3 68.2 3.2 4.8 85.0
Omsk Oblast Omsk 25.1 63.9 16.9 16.4 85.9 Tomsk Oblast Tomsk 20.5 79.5 11.5 12.2 97.7 Tyurnen' Oblast Tyurnen' 4.6 87.1 74.8 5.7 85.4 Khanty-Mansi AOkr
Yamalo-Nenets AOkr Other Tyurnen' Oblast


Page 6
Regional Statistics for Russia
Branch Structure of Industry, Percent of Total Industrial Personnel Decline in
Output, 1991 working industrial
Oblast Former Machine in private production,
Former Center or Center or building industrial January-
Region Republic Capital and metal Heavy Energy enterprises, September
Region Name Capital Name working industries industries 1992 1993
East Siberian region 10.7 71.2 13.2 15.7 83.6
Buryatia Republic BuryatASSR Ulan-Ude 19.5 52.7 4.6 8.8 87.3
Tuva Republic Tuvinsk ASSR Kyzl 5.1 45.4 6.8 90.2
Khakassia Republic Khakass A. Oblast Abakan 4.7 39.1 11.6 39.8 94.9
Krasnoyarsk Kray Krasnoyarsk 10.8 78.7 10.1 9.6 79.4
Taymyr AOkr
EvenkiAOkr Other Krasnoyarsk Kray Irkutsk Oblast Irkutsk 11.3 81.7 21.2 16.8 88.4
Ust-Orda Buryat AOkr
Other Irkutsk Oblast Chita Oblast Chita 7.4 48.9 5.6 29.0 73.7
AgaAOkr Other Chita Oblast
Far Eastern region 15.3 62.1 7.3 2.7 84.2
Sakha Republic YakutASSR Yakutsk 2.2 86.2 9.3 0.7 95.5
Primor Kray Vladivostok 21.0 47.7 3.5 1.4 83.0
Khabarovsk Kray Khabarovsk 28.7 71.1 9.7 1.0 79.3
Birobijan AO 69.8
Other Khabarovsk Kray
AmurOblast Vladoveshchensk l3.6 56.2 9.4 84.9
Kamchatka Oblast Petropavlovsk-Kamchat 8.5 24.1 4.8 12.9 82.9
Koryak AOkr 115.0
Other Kamchatka Oblast Magadan Oblast Magadan 6.1 81.0 7.2 0.4 86.0
Chukotka AOkr Chukcho A. Okrug 84.9
Other Magadan Oblast Sakhalin Oblast Y uzhno-Sakhalinsk 4.6 50.5 7.6 11.4 85.5
Kaliningrad Oblast Kaliningrad 20.9 48.7 1.8 4.5 76.0


Page 7 Regional Statistics for Russia
Population Statistics Share of Net
population Share of Share of migration Area Total younger population population Net 1992
(thousand Population, than the in the older than Population Urban migration (percent square 1992 working working the working density Population 1992 of total
Region kilometers) (thousands) ages ages ages 1993 1993 (thousands) population) RUSSIAN FEDERATION 17,075.4 148,704 24.3 56.7 19.0 8.7 73.3 176.1 0.1
Northern region 1,466.3 6,136 26.1 59.1 14.8 4.2 75.6 -45.6 -0.7 Karelia Republic 172.4 800 25.3 58.0 16.7 4.6 73.9 0.9 0.1 Komi Republic 415.9 1,255 27.5 61.8 10.6 3.0 75.0 -11. 9 -0.9 ArkhangeJ'sk Oblast 587.4 1,571 26.4 57.7 15.9 2.7 73.2 -7.6 -0.5 NenetsAOkr 176.7 54 0.3 61.5 Other Arkhangel'sk Oblast 410.7 1,517 3.7 73.6 Vologda Oblast 145.7 1,362 24.5 54.7 20.8 9.3 66.1 4.1 0.3 Munnansk Oblast 144.9 1,148 26.5 64.0 9.5 7.7 92.5 -31.1 -2.7
Northwestern region 196.5 8,270 20.8 57.7 21.5 41.8 86.8 -3.9 0.0 Leningrad 85.9 6,677 20.6 58.5 20.8 77.1 91.4 -12.7 -0.2 St.Petersburg city 5,004 19.7 59.4 20.9 100.0 -22.8 -0.5 Leningrad Oblast 85.9 1,673 23.3 56.1 20.6 19.5 66.1 10.1 0.6
Novgorod Oblast 55.3 752 22.4 54.5 23.1 13.6 70.6 3.6 0.5 Pskov Oblast 55.3 841 21.2 53.9 24.9 15.2 64.5 5.2 0.6
Central region 485.1 30,383 20.8 56.5 22.7 62.4 82.9 61.6 0.2 Bryansk Oblast 34.9 1,464 22.9 53.2 23.9 42.1 68.5 8.8 0.6 Vladimir Oblast 29.0 1,656 22.1 55.9 22.0 57.0 79.9 4.7 0.3 Ivanovo Oblast 23.9 1,312 21.1 54.8 24.2 54.7 81.7 4.0 0.3 Kaluga Oblast 29.9 1,081 22.2 56.3 21.6 36.3 73.6 9.0 0.8 Kostroma Oblast 60.1 812 22.7 54.1 23.2 13.5 65.8 3.4 0.4 Moscow 47.0 15,664 20.2 58.1 21.7 331.1 91.2 -12.1 -0.1 Moscow city 8,957 19.8 58.3 21.9 100.0 -23.5 -0.3 Moscow Oblast 47.0 6,707 20.7 57.9 21.4 142.2 79.6 11.4 0.2
OrelOblast 24.7 903 21.2 55.4 23.4 36.8 62.8 9.1 1.0 Ryazan' Oblast 39.6 1,344 20.4 55.1 24.5 33.9 66.8 5.2 0.4 Smolensk Oblast 49.8 1,163 22.2 54.6 23.2 23.4 69.2 7.7 0.7 Tva Oblast 84.1 1,668 21.0 53.6 25.3 19.8 72.0 8.0 0.5 Tula Oblast 25.7 1,844 19.6 54.7 25.7 71.6 81.5 9.3 0.5 Yaroslavl' Oblast 36.4 1,472 21.2 55.9 22.9 40.3 81.3 4.5 0.3


Page 8
Regional Statistics for Russia
Population Statistics Share of Net
population Share of Share of migration
Area Total younger population population Net 1992 (thousand Population, than the in the older than Population Urban migration (percent
square 1992 working working the working density Population 1992 of total Region kilometers) (thousands) ages ages ages 1993 1993 (thousands) population)
Volgo-Vyatsk region 263.3 8,483 23.6 55.2 21.3 32.2 69.8 22.1 0.3 Mariy El Republic 23.2 762 27.2 55.1 17.8 32.9 61.9 1.3 0.2 Mordvinia Republic 26.2 964 23.6 55.3 21.2 36.8 58.2 2.3 0.2 Chuvashia Republic 18.3 1,353 26.7 55.0 18.2 743 59.9 3.5 0.3 Kirov Oblast 120.8 1,700 24.0 54.8 21.2 14.1 70.6 5.1 0.3 Nizhegorod Oblast 74.8 3,704 21.5 55.4 23.1 49.4 77.7 9.9 0.3
Central Chernozem region 167.7 7,762 21.5 54.3 24.2 46.6 61.3 80.1 1.0 Belgorod Oblast 27.1 1,408 22.9 54.2 22.9 52.5 64.4 19.3 1.4 Voronezh Oblast 52.4 2,475 20.8 54.1 25.1 47.5 61.5 25.0 1.0 Kursk Oblast 29.8 1,335 21.6 53.8 24.6 45.0 59.6 12.3 0.9 Lipetsk Oblast 24.1 1,234 21.7 55.6 22.7 51.5 63.2 11.9 1.0 Tambov Oblast 34.3 1,310 21.2 53.8 25.0 38.3 57.3 11.6 0.9
Povolzhkiy region 536.4 16,641 24.0 56.6 19.4 31.2 73.1 104.4 0.6 Kalmykia Republic 76.1 327 32.3 55.9 11.7 4.2 37.0 -8.1 -2.5 Tatarstan Republic 68.0 3,6% 25.4 56.2 18.5 54.8 73.5 211 0.6 Astrakhan Oblast 44.1 1,010 26.1 56.1 17.8 23.0 67.1 1.8 0.2 Volgograd Oblast 113.9 2,643 23.2 56.0 20.8 23.4 74.8 20.8 0.8 Penza Oblast 43.2 1,514 22.5 55.6 22.0 35.2 62.7 11.5 0.8 Samara Oblast 53.6 3,296 23.1 57.9 19.0 61.8 80.7 22.0 0.7 Saratov Oblast 100.2 2,711 23.2 57.0 19.8 27.2 74.2 16.2 0.6 Ul'yanovsk Oblast 37.3 1,444 24.3 56.5 19.2 39.2 72.2 19.1 1.3
North-Caucasus region 355.1 17,246 26.3 54.7 19.1 49.0 56.5 103.1 0.6 Adygea Republic 7.6 442 58.8 53.9 5.5 1.2 Dagestan Republic 50.3 1,890 35.9 51.3 12.7 38.3 43.0 3.1 0.2 Kabardino-Balkaria Republic 12.5 784 29.8 55.3 15.0 62.9 60.1 -5.1 -0.7 Karachay-Cherkessia Republic 14.1 431 30.8 47.9 0.7 0.2 North Ossetia Republic 8.0 695 26.8 54.7 18.5 81.4 69.6 -46.8 -6.7 Chechenia and lngushetia Republics 19.3 1,308 33.8 52.5 13.6 67.7 43.6 -19.6 -1.5 Krasnodar Kray 76.0 4,797 23.6 54.5 21.9 64.2 54.3 94.1 2.0 Stavropol' Kray 66.5 2,536 25.7 55.1 19.2 38.8 53.9 40.9 1.6 Rostov Oblast 100.8 4,363 22.7 56.5 20.8 43.5 68.8 30.3 0.7


Page 9
Regional Statistics for Russia
Population Statistics Share of Net
population Share of Share of migration Area Total younger population population Net 1992
(thousand Population, than the in the older than Population Urban migration (percent square 1992 working working the working density Population 1992 of total
Region kilometers) (thousands) ages ages ages 1993 1993 (thousands) population)
Urals region 824.0 20,430 25.4 56.1 18.4 24.8 74.5 36.6 0.2
Bashkortostan Republic 143.6 4,008 26.7 55.1 18.2 28.1 64.5 23.1 0.6
Udmurtia Republic 42.1 1,637 27.0 56.3 16.6 39.0 69.9 3.3 0.2
Kurgan Oblast 71.0 1,115 25.5 54.9 19.6 15.7 54.6 3.3 0.3
Orenburg Oblast 124.0 2,204 26.5 55.6 17.9 17.9 64.8 11.9 0.5
Penn' Oblast 160,6 3,109 25.1 56.7 18.1 19.3 77.1 2.0 0.1
Komi-Pennyat AOkr 32.9 160 4.9 29,8
Other Penn' Oblast 127.7 2,949 23.1 79,7
Sverdlovsk Oblast 194,8 4,719 24.1 56.7 19.2 24.1 87.2 -6,9 -0.1
Chelyabinsk Oblast 87,9 3,638 24.7 56.5 18.9 41.3 81.0 -0.1 0.0
West Siberian region 2,427,2 15,167 26.6 57.4 16.1 6.2 71.3 -8.2 -0.1
Altay Republic 92.6 198 2.1 26,4 -1.5 -0.8
Altay Kray 169.1 2,666 25,9 55.4 18.7 15.9 52.4 19.4 0.7
Kemerovo Oblast 95,5 3,181 25.0 56.6 18.4 33.3 87.3 4.6 0.1
Novosibirsk Oblast 178.2 2,803 24.6 56.9 18.6 15.7 74.4 3.0 0.1
OmskOblast 139.7 2,170 27.1 56,1 16.8 15.6 67.6 1.0 0.0
Tomsk Oblast 316.9 1,012 26.4 58,7 14.9 3.2 63.4 -3,6 -0.4
Tyumen' Oblast 1,435.2 3,137 30.1 61.0 8.9 2.2 76.4 -31.1 -1.0
Khanty-Mansi AOkr 523.1 1,305 2.5 91.8
Yamalo-Nenets AOkr 750.3 479 0.6 82.6 Other Tyumen' Oblast 161.8 1,353 8.4 59.5


Page 10
Regional Statistics for Russia
Population Statistics Share of Net
population Share of Share of migration Area Total younger population population Net 1992
(thousand Population, than the in the older than Population Urban migration (percent square 1992 working working the working density Population 1992 of total
Region kilometers) (thousands) ages ages ages 1993 1993 (thousands) population)
East Siberian region 4,122,8 9,260 28.5 57.5 14.0 2.2 71.3 -36,2 -0.4 Buryatia Republic 351.3 1,059 31.3 55.6 13.1 3,0 59,2 -6.6 -0.6 Tuva Republic 170,5 306 37.1 54,3 8.6 1.8 48.0 -3.9 -1.3 Khakassia Republic 61.9 581 9.4 72.4 2.2 0.4 Krasnoyarsk Kray 2,339.7 3,051 26.8 58.4 14.8 1.3 72.4 -4.0 -0.1 Taymyr AOler 862.1 53 0.1 66.7 Evenki AOler 767.6 25 0,0 29,2
Other Krasnoyarsk Kray 710.0 2,973 4,2 72,8
Irkutsk Oblast 767.9 2,872 27,9 57,9 14,2 3.7 79,7 -3.1 -0.1 Ust-Orda Buryat AOler 22.4 140 6.3 Other Irkutsk Oblast 745.5 2,732 3.7 83,8
Chita Oblast 431.5 1,391 30.4 56.4 13,2 3.2 65,0 -20,8 -1.5 AgaAOler 19.0 79 4,2 32,9
Other Chita Oblast 412,5 1,312 3,} 67,0
Far Eastern region 6,215.9 8,032 27.6 61.4 11.0 1.3 75.9 -150.4 -1.9 Sakha Republic 3,103,2 1,093 32.1 60.8 7,1 0,3 65,6 -27.9 -2,6
PrimorKray 165,9 2,309 25,8 60,9 13.3 13.9 77.6 -7,9 -0.3 Khabarovsk Kray 788,6 1,855 26,9 60.3 12.8 2,1 80.7 -13.7 -0,8
Birobijan AO 36,0 221 6,1 65,8 -2,6 -1.2 Other Khabarovsk Kray 1,634
AmurOblast 363,7 1,075 28.4 59,0 12,6 2,9 65,8 -15.2 -1.4 Kamchatka Oblast 472,3 472 27,3 66,8 6,0 1.0 81.6 -16.6 -3.5 KoryakAOler 301.5 39 0.1 36.8 Other Kamchatka Oblast 170.8 433 2.4 85.6
Magadan Oblast 461.4 509 28,5 67.1 4.4 0.7 85,6 -60.3 -11,8
Chukotka AOler 737,7 146 0.2 71.8 Other Magadan Oblast 363 Sakhalin Oblast 87,1 719 26.5 62,7 10,7 8.2 85,3 -6.2 -0,9
Kaliningrad Oblast 15,1 894 23.1 59,2 17,7 60.0 78.5 12.5 1.4


Page II Regional Statistics for Russia
Unemployment Statistics Nationality Statistics Ratio of
Percent Percent Percent registered Russian non-Russian titular Number of Number of unemployment of total of total population in persons registered to working-
population, population, autonomous not working undemployed, age population Region 1989 1989 areas, 1993 August 1993 August 1993 June 1993 RUSSIAN FEDERATION 81.5 18.5 978,801 713,877 1.2
Northern region 81.9 18.l 74,398 50,556 2.1
Karelia Republic 73.6 26.4 10.0 11,020 6,104 2.4
Komi Republic 57.7 42.3 23.3 10,713 9,709 1.4
Arkhangel'sk Oblast 92.1 7.9 29,557 18,985 3.3 NenetsAOkr 65.8 34.2 11.9 548 384
Other Arkhange1'sk Oblast 93.1 6.9 29,009 18,601 Vologda Oblast 96.5 3.5 10,574 5,903 1.4 Murmansk Oblast 82.9 17.1 12,534 9,855 1.7
Northwestern region 90.5 9.5 69,634 63,352 1.5 Leningrad 89.6 10.4 49,008 46,553 1.3 St.Petersburg city 89.1 10.9 32,691 32,626 1.1
Leningrad Oblast 90.9 9,1 16,317 13,927 1.7
Novgorod Oblast 94,7 5,3 6,407 3,478 1.6 Pskov Oblast 94,3 5.7 14,219 13,321 3.1
Central region 93,3 6.7 221,599 169,865 1.3 Bryansk Oblast 96.0 4.0 9,226 8,417 1.2 Vladimir Oblast 95,8 4.2 23,354 22,484 2.5 Ivanovo Oblast 95.8 4.2 29,272 27,857 4.1 Kaluga Oblast 93.8 6.2 4,080 3,389 0,7
Kostroma Oblast 96.3 3.7 15,341 14,024 3.5 Moscow 91.3 8.7 73,283 40,952 0.8 Moscow city 89.7 10.3 36,299 15,146 0.7 Moscow Oblast 93,5 6,5 36,984 25,806 1.0 OrelOblast 96.9 3.1 4,348 3,583 0.9 Ryazan' Oblast 96.1 3.9 4,564 4,316 0.6 Smolensk Oblast 94,1 5,9 2,840 1,694 0.4 Tver' Oblast 93,5 6.5 7,539 6,147 0.8 Tula Oblast 95.4 4.6 5,864 4,571 0,6 Yaroslavl' Oblast 96.4 3,6 41,888 32,431 5,1


Page 12
Regional Statistics for Russia
Unemployment Statistics Nationality Statistics Ratio of
Percent Percent Percent registered Russian non-Russian titular Number of Number of unemployment of total of total population in persons registered to working-
population, population, autonomous not working undemployed, age population Region 1989 1989 areas, 1993 August 1993 August 1993 June 1993
Voigo-Vyatsk region 75.1 24.9 91,033 74,106 1.9
Marly El Republic 47.5 52.5 43.3 9,150 7,198 2.2
Mordvinia Republic 60.8 39.2 32.5 14,660 12,668 2.8
Chuvashia Republic 26.7 73.3 67.8 19,400 17,553 2.6
Kirov Oblast 90.4 9.6 19,088 16,900 2.0
Nizhegorod Oblast 94.7 5.3 28,735 19,787 1.4
Central Chernozem region 95.2 4.8 33,704 21,113 0.8
Belgorod Oblast 92.9 7.1 4,630 1,858 0.6
Voronezh Oblast 93.4 6.6 6,838 4,990 0.5
Kursk Oblast 96.9 3.1 5,194 2,512 0.7
Lipetsk Oblast 97.4 2.6 4,421 3,122 0.6
Tambov Oblast 97.2 2.8 12,621 8,631 1.8
Povolzhkiy region 73.5 26.5 75,504 52,197 0.8
Kalmykia Republic 37.7 62.3 45.4 4,057 3,466 2.2
Tatarstan Republic 43.3 56.7 48.5 12,242 3,634 0.6
Astrakhan Oblast 72.0 28.0 7,420 6,101 1.3 Volgograd Oblast 89.1 10.9 4,407 3,502 0.3
Penza Oblast 86.1 13.9 14,439 12,409 1.7
Samara Oblast 83.4 16.6 8,668 4,364 0.5
Saratov Oblast 85.6 14.4 17,386 13,794 1.1 Ul'yanovsk Oblast 72.8 27.2 6,885 4,927 0.8
North-Caucasus region 67.6 32.4 105,601 75,140 1.1 Adygea Republic 68.0 32.0 22.1 4,351 4,112
Dagestan Republic 9.2 90.8 80.2 36,031 30,119 3.7
Kabardino-Ba1karia Republic 31.9 68.1 57.6 3,819 3,119 0.9
Karachay-Cherkessia Republic 42.4 57.6 40.9 948 842
North Ossetia RepUblic 29.9 70.1 53.0 8,822 4,819 2.3
Chechenia and Ingushetia Republics 23.1 76.9 70.7 12,504 7,716 1.8 Krasnodar Kray 86.7 13.3 20,734 12,077 0.8 Stavropol' Kray 84.0 16.0 7,553 4,537 0.5 Rostov Oblast 89.6 10.4 10,839 7,799 0.4


Page 13 Regional Statistics for Russia
Unemployment Statistics Nationality Statistics Ratio of
Percent Percent Percent registered Russian non-Russian titular Number of Number of unemployment of total of total population in persons registered to working-
population, population, autonomous not working undempJoyed, age population Region 1989 1989 areas, 1993 August 1993 August 1993 June 1993
Urals region 73.0 27.0 110,747 90,697 1.0 Bashkortostan Republic 39.3 60.7 21.9 10,209 8,353 0.5 Udmurtia Republic 58.9 41.1 30.9 20,167 17,548 2.2 Kurgan Oblast 91.4 8.6 8,821 7,189 1.4 Orenburg Oblast 72.3 27.7 3,688 3,113 0.3 Perm' Oblast 83.9 16.1 20,873 13,481 1.2 Komi-Permyat AOkr 36.1 63.9 60.2 2,408 2,208 Other Perm' Oblast 86.4 13.6 18,465 11,273
Sverdlovsk Oblast 88.7 11.3 27,558 23,971 1.0 Chelyabinsk Oblast 81.0 19.0 19,431 17,042 0.9
West Siberian region 84.9 15.1 78,714 48,118 0.9 Altay Republic 60.4 39.6 31.0 2,372 606 AltayKray 89.5 10.5 24,124 13,695 1.6 Kemerovo Oblast 90.5 9.5 12,398 7,114 0.7 Novosibirsk Oblast 92.0 8.0 17,551 11,635 1.1
Omsk Oblast 80.3 19.7 6,095 4,517 0.5 Tomsk Oblast 88.2 11.8 5,729 4,100 1.0 Tyumen' Oblast 72.6 27.4 10,445 6,451 0.5 Khanty-Mansi AOkr 66.3 33.7 1.4 4,080 2,586 Yamalo-Nenets AOkr 59.2 40.8 0.4 2,280 1,397 Other Tyumen' Oblast 83.7 16.3 4,085 2,468

Page 14
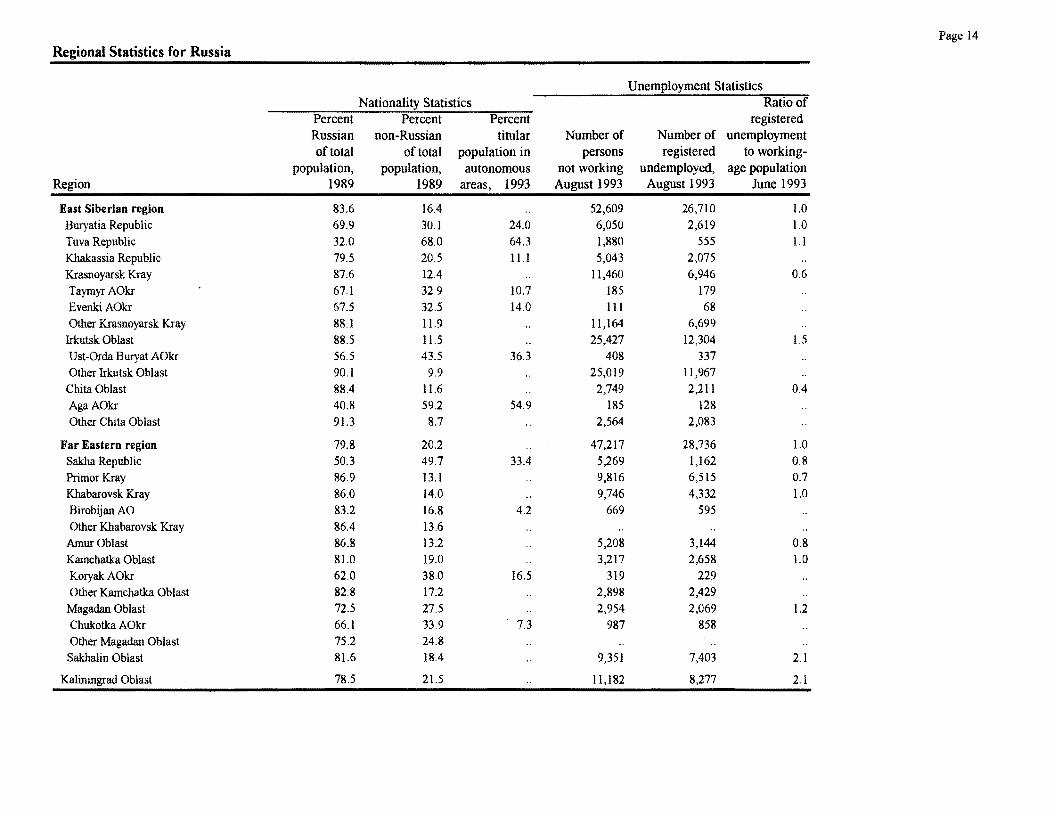
Regional Statistics for Russia
Unemployment Statistics Nationality Statistics Ratio of
Percent Percent Percent registered Russian non-Russian titular Number of Number of unemployment of total of total population in persons registered to working-
population, population, autonomous not working undemployed, age population Region 1989 1989 areas, 1993 August 1993 August 1993 June 1993
East Siberian region 83.6 16.4 52,609 26,710 1.0
Buryatia Republic 69.9 30.1 24.0 6,050 2,619 1.0
Tuva Republic 32.0 68.0 64.3 1,880 555 1.1
Khakassia Republic 79.5 20.5 Il.l 5,043 2,075
Krasnoyarsk Kray 87.6 12.4 11,460 6,946 0.6
Taymyr AOkr 67.1 32.9 to.7 185 179
EvenkiAOkr 67.5 32.5 14.0 III 68
Other Krasnoyarsk Kray 88.1 11.9 11,164 6,699
Irkutsk Oblast 88.5 11.5 25,427 12,304 1.5
Ust-Orda Buryat AOkr 56.5 43.5 36.3 408 337
Other Irkutsk Oblast 90.1 9.9 25,019 11,967
Chita Oblast 88.4 11.6 2,749 2,211 OA AgaAOkr 40.8 59.2 54.9 185 128
Other Chita Oblast 91.3 8.7 2,564 2,083
Far Eastern region 79.8 20.2 47,217 28,736 1.0
Sakha Republic 50.3 49.7 33.4 5,269 1,162 0.8
PrimorKray 86.9 13.1 9,816 6,515 0.7
Khabarovsk Kray 86.0 14.0 9,746 4,332 1.0
Birobijan AO 83.2 16.8 4.2 669 595
Other Khabarovsk Kray 86.4 13.6
AmurOblast 86.8 13.2 5,208 3,144 0.8
Kamchatka Oblast 81.0 19.0 3,217 2,658 1.0
KoryakAOkr 62.0 38.0 16.5 319 229
Other Kamchatka Oblast 82.8 17.2 2,898 2,429
Magadan Oblast 72.5 27.5 2,954 2,069 1.2
Chukotka AOkr 66.1 33.9 7.3 987 858
Other Magadan Oblast 75.2 24.8
Sakhalin Oblast 81.6 18.4 9,351 7,403 2.1
Kaliningrad Oblast 78.5 21.5 11,182 8,277 2.1


Page 15 Regional Statistics for Russia
Percent Distribution of State Sector Employment, 1991 Trade
and public
Region Industry Agriculture Transportation Construction dining Housing Health Education Science Other RUSSIAN FEDERATION 33 8 8 II 9 5 6 9 4 7
Northern region 33 6 10 12 9 5 6 10 2 7 Karelia Republic 34 6 9 10 9 5 7 10 8 Komi Republic 30 6 10 15 9 6 5 10 2 7 Arkhangel'sk Oblast 34 7 II 8 9 5 6 10 2 7 NenetsAOkr Other Arkhangel'sk Oblast Vologda Oblast 35 9 8 12 9 4 6 9 8 Murmansk Oblast 32 3 10 12 II 6 7 9 3 7
Northwestern region 34 5 8 10 8 6 6 8 10 6 Leningrad StPetersburg city 33 9 10 8 6 6 7 14 6 Leningrad Oblast 34 14 6 9 8 6 6 8 2 7 Novgorod Oblast 38 II 5 10 8 5 6 8 1 8 Pskov Oblast 33 12 7 10 8 4 6 8 9
Central region 34 6 6 10 8 5 6 8 10 8 Bryansk Oblast 38 10 7 9 8 4 6 9 I 7 Vladimir Oblast 48 7 5 7 7 4 5 7 5 6 Ivanovo Oblast 43 8 5 7 9 4 6 9 2 6 Kaluga Oblast 38 10 5 9 7 4 5 8 6 8 Kostroma Oblast 33 8 7 II 9 5 6 10 9 Moscow Moscow city 24 7 11 10 5 6 7 20 9 Moscow Oblast 38 7 5 8 7 6 7 7 II 5 OrelOblast 36 12 6 12 8 4 6 8 8 Ryazan' Oblast 36 11 6 10 8 4 6 9 3 8 Smolensk Oblast 34 13 6 II 8 4 6 9 1 8 Tver' Oblast 36 10 6 10 8 4 6 8 3 9 Tula Oblast 42 8 5 10 8 5 5 7 4 6 Yaroslavl' Oblast 44 6 6 9 8 4 5 8 3 7


Regional Statistics for Russia
Region
Volgo-Vyatsk region
Mariy EI Republic Mordvinia Republic Chuvashia Republic Kirov Oblast Nizhegorod Oblast
Central Chernozem region
Belgorod Oblast Voronezh Oblast Kursk Oblast Lipetsk Oblast Tambov Oblast
Povolzhkiy region
Kalmykia Republic Tatarstan Republic Astrakhan Oblast Volgograd Oblast Penza Oblast Samara Oblast Saratov Oblast m'yanovsk Oblast
North-Caucasus region
Adygea Republic Dagestan Republic Kabardino-Balkaria Republic Karachay-Cherkessia Republic North Ossetia Republic Chechenia and Jngushetia Republics Krasnodar Kray Stavropol' Kray Rostov Oblast
Percent Distribution of State Sector Employment, 1991 Trade
and public
Industry Agriculture Transportation Construction dining Housing Health Education Science Other
40
35 37 38
36 43
33 30 34 34 34 31
34 12 36 25
31 35 39
32 39
28 29 22 30 41 34 22 24 24 35
8 11 8
10 II 6
11 10 9 8
14 14
10 27
7
10 12 15 6
11 10
13
11 21 10 19
6 14 12 15 II
6 5
6 4
7
7
7 7 8 7
6 7
8 5
7
10 8 6 8 8 6
8 7
6
6 2
5
8 IO 7
7
IO II 12 11 10 9
12 15 9
12 12 11
12 13 13 15 13 9
11 12 10
11 8 9
10
11 9
13 10 13
10
8 8 8 8 9
8
9
9 9 9
9 9
8
8 8 9 9 8 8
8 8
9 10 8 9 9
9
9 II 10 9
4 4 4 4 4 4
4 4 4 4 4 3
5 3 4 5 5 4 5 4 4
5 4 4 4 5 4 4 5 5 4
6 6
6 7 6
5
6 6 7 6
6
6
6 7 5 8
6 5 6 6
5
8 9 8
10
9 7
9 8 6
9 11 10 11 9
8
9
10 9
10 8 9
9
12 10 9
8 8 8
8 9
10 12 15 12 4
12 12 9 9
8
2 I
4
2
4
2 1 3 2 4
3 4 3
2
2
2
1 2 2 2 2 3
7
8 8 7 8 6
8 8 7
9 7
8
6 II 6 6 7 7 6 7
7
7 9
8 8 7 9
8 8 7
6
Page 16


Page 17
Regional Statistics for Russia
Percent Distribution of State Sector Employment, 1991 Trade
and public
Region Industry Agriculture Transportation Construction dining Housing Health Education Science Other
Urals region 38 8 7 10 8 4 6 10 2 7 Bashkortostan Republic 34 8 6 12 8 4 6 II 2 8 Udmurtia Republic 43 7 5 7 8 4 7 10 2 6 Kurgan Oblast 30 15 7 10 9 4 6 10 8 Orenburg Oblast 30 11 9 11 9 4 6 10 7 Penn' Oblast 38 6 8 10 8 5 6 10 3 7 Komi-Pennyat AOkr Other Penn' Oblast Sverdlovsk Oblast 42 6 6 10 8 5 6 9 3 6 Chelyabinsk Oblast 41 9 7 9 8 4 6 9 2 6
West Siberian region 29 10 9 14 9 4 6 9 3 7 Altay Republic 15 26 5 4 11 3 2 16 4 14 Altay Kray 30 17 6 9 9 4 6 10 8 Kemerovo Oblast 39 6 9 11 8 5 6 8 6 Novosibirsk Oblast 30 11 8 10 8 4 6 9 6 7 OmskOblast 29 14 8 11 8 4 6 10 3 6 Tomsk Oblast 27 9 9 11 9 4 6 II 6 9 Tyumen' Oblast 18 6 14 24 10 5 5 8 2 8 Khanty-Mansi AOkr Yamalo-Nenets AOkr Other Tyumen' Oblast


Page 18
Regional Statistics for Russia
Percent Distribution of State Sector Employment, 1991 Trade
and public
Region Industry Agriculture Transportation Construction dining Housing Health Education Science Other
East Siberian region 29 9 9 13 9 5 6 11 2 8
Buryatia Republic 25 II 9 12 9 4 6 13 2 9
Tuva Republic 12 22 5 10 9 4 9 16 II Khakassia Republic 30 14 8 11 8 4 6 10 I 8
Krasnoyarsk Kray 31 9 9 13 9 5 6 9 3 7 Taymyr AOkr
EvenkiAOkr
Other Krasnoyarsk Kray
Irkutsk Oblast 32 6 10 13 9 5 6 10 2 7 Ust-Orda Buryat AOkr
Other Irkutsk Oblast
Chita Oblast 20 11 12 11 10 5 7 12 2 10 AgaAOkr
Other Chita Oblast
Far Eastern region 26 8 11 12 10 5 6 10 3 8
Sakha Republic 17 II 10 14 10 6 6 12 4 10
PrimorKray 31 8 12 11 9 5 6 9 2 7 Khabarovsk Kray 30 5 10 13 10 5 7 10 2 8 Birobijan AO
Other Khabarovsk Kray
Amur Oblast 20 II 13 15 10 5 6 10 2 8
Kamchatka Oblast 25 6 II II 10 6 7 9 4 10 KoryakAOkr
Other Kamchatka Oblast
Magadan Oblast 25 6 11 11 11 5 6 8 5 10 Chukotka AOkr
Other Magadan Oblast
Sakhalin Oblast 28 5 11 II 12 6 7 9 3 9
Kaliningrad Oblast 32 10 9 8 10 5 7 9 3 8

Page 19
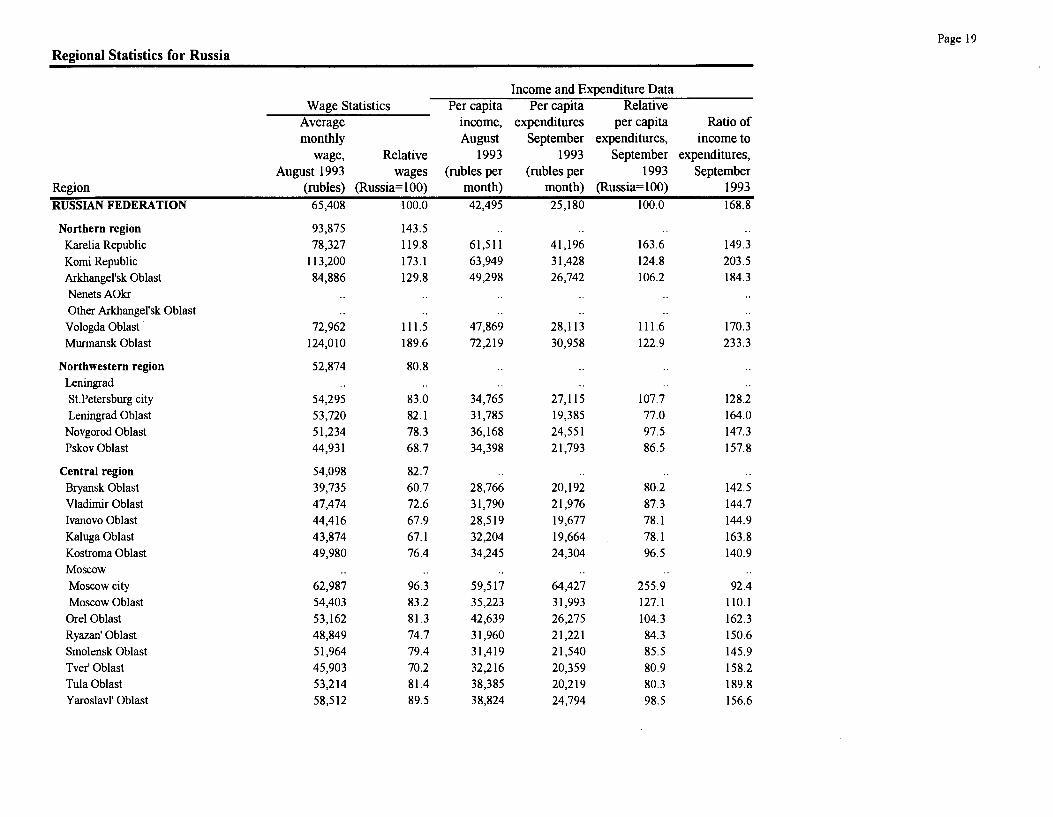
Regional Statistics for Russia
Income and Expenditure Data Wage Statistics Per capita Per capita Relative
Average income, expenditures per capita Ratio of monthly August September expenditures, income to
wage, Relative 1993 1993 September expenditures,
August 1993 wages (rubles per (rubles per 1993 September Region (rubles) (Russia=lOO) month) month) (Russia=lOO) 1993
RUSSIAN FEDERA nON 65,408 100.0 42,495 25,180 100.0 168.8
Northern region 93,875 143.5 Karelia Republic 78,327 119.8 61,511 41,196 163.6 149.3
Komi Republic 113,200 173.1 63,949 31,428 124.8 203.5 Arkhangel'sk Oblast 84,886 129.8 49,298 26,742 106.2 184.3
Nenets AOkr Other Arkhangel'sk Oblast Vologda Oblast 72,962 111.5 47,869 28,113 111.6 170.3 Murrnansk Oblast 124,010 189.6 72,219 30,958 122.9 233.3
Northwestern region 52,874 80.8 Leningrad St.Petersburg city 54,295 83.0 34,765 27,115 107.7 128.2 Leningrad Oblast 53,720 82.1 31,785 19,385 77.0 164.0
Novgorod Oblast 51,234 78.3 36,168 24,551 97.5 147.3 Pskov Oblast 44,931 68.7 34,398 21,793 86.5 157.8
Central region 54,098 82.7 Bryansk Oblast 39,735 60.7 28,766 20,192 80.2 142.5 Vladimir Oblast 47,474 72.6 31,790 21,976 87.3 144.7 Ivanovo Oblast 44,416 67.9 28,519 19,677 78.1 144.9 Kaluga Oblast 43,874 67.1 32,204 19,664 78.1 163.8 Kostroma Oblast 49,980 76.4 34,245 24,304 96.5 140.9 Moscow Moscow city 62,987 96.3 59,517 64,427 255.9 92.4 Moscow Oblast 54,403 83.2 35,223 31,993 127.1 110.1
OrelOblast 53,162 81.3 42,639 26,275 104.3 162.3 Ryazan' Oblast 48,849 74.7 31,960 21,221 84.3 150.6 Smolensk Oblast 51,964 79.4 31,419 21,540 85.5 145.9 Tver' Oblast 45,903 70.2 32,216 20,359 80.9 158.2 TulaOblast 53,214 81.4 38,385 20,219 80.3 189.8 Yaroslavl' Oblast 58,512 89.5 38,824 24,794 98.5 156.6

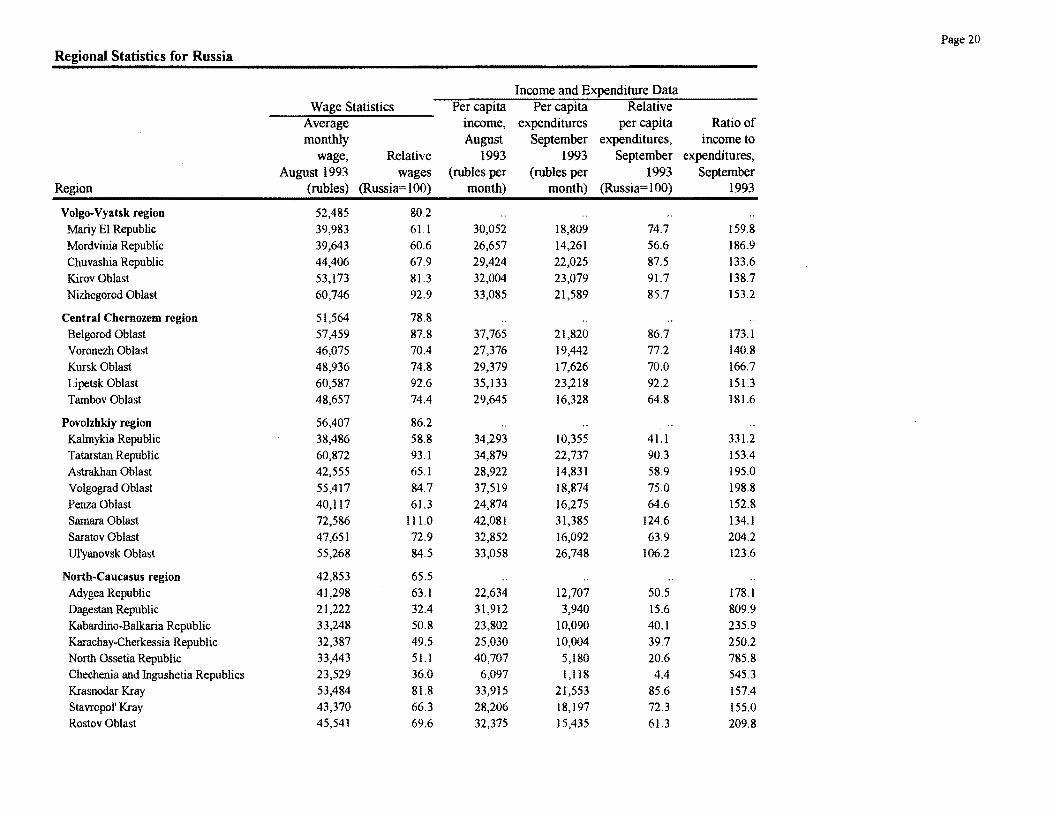
Page 20
Regional Statistics for Russia
Income and Expenditure Data Wage Statistics Per capita Per capita Relative
Average income, expenditures per capita Ratio of monthly August September expenditures, income to
wage, Relative 1993 1993 September expenditures,
August 1993 wages (rubles per (rubles per 1993 September Region (rubles) (Russia= 100) month) month) (Russia= 100) 1993
Volgo.Vyatsk region 52,485 80.2 Mariy EI Republic 39,983 611 30,052 18,809 74.7 159.8
Mordvinia Republic 39,643 60.6 26,657 14,261 56.6 186.9 Chuvashia Republic 44,406 67.9 29,424 22,025 87.5 133.6 Kirov Oblast 53,173 81.3 32,004 23,079 91.7 138.7
Nizhegorod Oblast 60,746 92.9 33,085 21,589 85.7 153.2
Central Chemozem region 51,564 78.8 Belgorod Oblast 57,459 87.8 37,765 21,820 86.7 173.1 Voronezh Oblast 46,075 70.4 27,376 19,442 77.2 140.8
Kursk Oblast 48,936 74.8 29,379 17,626 70.0 166.7 Lipetsk Oblast 60,587 92.6 35,133 23,218 92.2 151.3 Tambov Oblast 48,657 74.4 29,645 16,328 64.8 181.6
Povolzhkiy region 56,407 86.2 Kalmykia Republic 38,486 58.8 34,293 10,355 41.1 331.2 Tatarstan Republic 60,872 93.1 34,879 22,737 90.3 153.4
Astrakhan Oblast 42,555 65.1 28,922 14,831 58.9 195.0 Volgograd Oblast 55,417 84.7 37,519 18,874 75.0 198.8 Penza Oblast 40,117 61.3 24,874 16,275 64.6 152.8 Samara Oblast 72,586 111.0 42,081 31,385 124.6 134.1 Saratov Oblast 47,651 72.9 32,852 16,092 63.9 204.2 Ul'yanovsk Oblast 55,268 845 33,058 26,748 106.2 123.6
North-Caucasus region 42,853 65.5 Adygea Republic 41,298 63.1 22,634 12,707 50.5 178.1 Dagestan Republic 21,222 32.4 31,912 3,940 15.6 809.9 Kabardino-Balkaria Republic 33,248 50.8 23,802 10,090 40.1 235.9 Karachay-Cherkessia Republic 32,387 495 25,030 10,004 39.7 250.2 North Ossetia Republic 33,443 51.1 40,707 5,180 20.6 785.8 Chechenia and Ingushetia Republics 23,529 36.0 6,097 1,118 4.4 545.3 Krasnodar Kray 53,484 81.8 33,915 21,553 85.6 157.4 Stavropol' Kray 43,370 66.3 28,206 18,197 72.3 155.0 Rostov Oblast 45,541 69.6 32,375 15,435 61.3 209.8


Page 21
Regional Statistics for Russia
Income and Expenditure Data Wage Statistics Per capita Per capita Relative
Average income, expenditures per capita Ratio of monthly August September expendi tures, income to
wage, Relative 1993 1993 September expenditures, August 1993 wages (rubles per (rubles per 1993 September
Region (rubles) (Russia=100) month) month) (Russia=100) 1993
Urals region 65,037 99.4 Bashkortostan Republic 63,967 97.8 41,161 26,068 103.5 157.9 Udmurtia Republic 51,367 78.5 33,556 23,925 95.0 140.3 Kurgan Oblast 52,496 80.3 32,389 16,622 66.0 194.9 Orenburg Oblast 64,207 98.2 37,723 17,020 67.6 221.6 Perm' Oblast 66,972 102.4 38,931 20,967 83.3 185.7 Komi-Permyat AOkr Other Perm' Oblast
Sverdlovsk Oblast 69,781 106.7 46,170 26,924 106.9 171.5 Chelyabinsk Oblast 69,461 106.2 43,369 21,593 85.8 200.8
West Siberian region 94,942 145.2 Altay Republic 44,598 68.2 38,411 15,734 62.5 244.1 Altay Kray 54,153 82.8 35,166 17,443 69.3 201.6 Kemerovo Oblast 105,561 161.4 58,360 19,675 78.1 296.6 Novosibirsk Oblast 55,720 85.2 29,296 20,092 79.8 145.8 Omsk Oblast 61,939 94.7 36,647 21,778 86.5 168.3 T omsk Oblast 77,746 118.9 51,247 21,734 86.3 235.8 Tyumen' Oblast 170,849 261.2 105,069 28,157 111.8 373.2 Khanty-Mansi AOkr Yamalo-Nenets AOkr Other Tyumen' Oblast


Page 22 Regional Statistics for Russia
Income and Expenditure Data Wage Statistics Per capita Per capita Relative
Average income, expenditures per capita Ratio of monthly August September expenditures, income to
wage, Relative 1993 1993 September expenditures, August 1993 wages (rubles per (rubles per 1993 September
Region (rubles) (Russia=I00) month) month) (Russia= 100) 1993
East Siberian region 84,168 128.7 Buryatia Republic 70,326 107.5 32,973 20,509 81.4 160.8 Tuva Republic 44,224 67.6 30,638 13,620 54.1 224.9 Khakassia Republic 79,072 120.9 50,872 30,319 120.4 167.8 Krasnoyarsk Kray 95,321 145.7 48,400 22,893 90.9 211A Taymyr AOkr Evenki AOkr Other Krasnoyarsk Kray Irkutsk Oblast 87,885 134.4 45,079 24,018 95A 187.7 Ust-Orda Buryat AOkr Other Irkutsk Oblast
Chita Oblast 65,971 100.9 31,311 17,028 67.6 183.9 AgaAOkr Other Chita Oblast
Far Eastern region 114,450 175.0 Sakha Republic 121,252 185.4 113,658 39,626 157.4 286.8 PrimorKray 97,977 149.8 50,211 29,745 118.1 168.8 Khabarovsk Kray 114,672 175.3 53,086 32,272 128.2 164.5 Birobijan AO 75,353 115.2 Other Khabarovsk Kray
AmurOblast 86,426 132.1 48,395 33,600 133.4 144.0 Kamchatka Oblast 153,238 234.3 83,045 37,576 149.2 221.0 KoryakAOkr Other Kamchatka Oblast Magadan Oblast 192,686 294.6 142,872 42,160 167.4 338.9 Chukotka AOkr 224,992 344.0
Other Magadan Oblast Sakhalin Oblast 115,348 176.4 72,354 33,958 134.9 213.1
Kaliningrad Oblast 53,398 81.6 34,903 29,701 118.0 117.5


Page 23
Regional Statistics for Russia
Privatization Indicators Budgetary Data State and Retail trade
Revenues, Per capita Expenditures, Per capita Balances, collective and catering 1992 revenues, 1992 expenditures, 1992 Apartments farms, enterprises
(million 1992 (million 1992 (million September January September Region rubles) (rubles) rubles) (rubles) rubles) 1993 1993 1993 RUSSIAN FEDERA nON 2,280,364 15,335 2,253,382 15,153 26,982 20.9 35.0 32.9
Northern region 106,939 17,428 114,965 18,736 -8,026 13.2 18.0 30.7 Karelia Republic 15,028 18,784 21,150 26,438 -6,123 15.5 38.0 29.4 Komi Republic 26,906 21,439 26,403 21,038 503 12.2 83.0 33.0 Arkhangel'sk Oblast 19,023 12,109 22,015 14,013 -2,992 10.1 10.0 27.8 NenetsAOkr 642 11,882 2,656 49,188 -2,015 Other Arkhangel'sk Oblast 18,382 12,117 19,359 12,761 -977 Vologda Oblast 20,305 14,908 20,464 15,025 -158 13.1 19.0 46.4 Murrnansk Oblast 25,677 22,367 24,933 21,719 743 16.8 12.4
Northwestern region 96,632 11,685 106,415 12,868 -9,783 14.7 17.0 52.7 Leningrad St.Petersburg city 60,240 12,038 62,953 12,581 -2,713 13.6 74.8 Leningrad Oblast 20,487 12,246 19,934 11,915 553 15.8 1.0 0.3 Novgorod Oblast 8,684 11,548 11,560 15,372 -2,876 16.5 23.0 33.6 Pskov Oblast 7,220 8,585 11,967 14,230 -4,747 18.6 24.0 24.8
Central region 425,363 14,000 401,277 13,207 24,087 22.7 23.0 46.6 Bryansk Oblast 12,049 8,230 13,529 9,241 -1,480 13.5 22.0 26.8 Vladimir Oblast 21,086 12,733 17,933 10,829 3,153 20.2 5.0 27.2 Ivanovo Oblast 14,317 10,912 14,131 10,771 185 18.9 63.0 47.2 Kaluga Oblast 8,887 8,221 9,905 9,163 -1,018 20.5 20.0 29.9 Kostrorna Oblast 8,896 10,955 10,339 12,732 -1,443 19.6 16.0 23.2 Moscow Moscow city 183,387 20,474 178,165 19,891 5,222 30.4 65.1 Moscow Oblast 74,632 11,128 61,206 9,126 13,426 15.3 12.0 24.6
Orel0blast 9,016 9,985 11,349 12,568 -2,333 14.7 8.0 30.5 Ryazan' Oblast 15,802 11,757 14,393 10,709 1,409 14.1 25.0 38.6 Smolensk Oblast 13,005 11,182 12,694 10,914 311 24.4 9.0 41.8 Tver Oblast 15,892 9,527 15,185 9,104 707 22.4 51.0 32.2 Tula Oblast 22,059 11,963 19,050 10,331 3,009 26.1 16.0 7.9 Yaroslavl' Oblast 26,336 17,891 23,398 15,895 2,938 16.9 33.0 33.5


Page 24
Regional Statistics for Russia
Privatization Indicators Budgetary Data State and Retail trade
Revenues, Per capita Expenditures, Per capita Balances, collective and catering 1992 revenues, 1992 expenditures, 1992 Apartments farms, enterprises
(million 1992 (million 1992 (million September January September Region rubles) (rubles) rubles) (rubles) rubles) 1993 1993 1993
Volgo.Vyatsk region 98,562 11,619 107,847 12,713 ·9,285 14.3 47.0 24.3 Mariy El Republic 5,019 6,586 10,250 13,452 ·5,232 20.8 30.0 19.8 Mordvinia Republic 7,676 7,962 13,280 13,776 -5,604 9.0 51.0 12.4 Chuvashia Republic 10,717 7,921 15,889 11,743 -5,172 11.3 33.0 23.7 Kirov Oblast 18,904 11,120 19,088 11,228 ·185 lOA 71.0 25.1 Nizhegorod Oblast 56,247 15,185 49,339 13,321 6,907 16.9 32.0 27.1
Central Chernozem region 91,436 11,780 88,867 1l,449 2,568 20.1 30.0 31.2 Belgorod Oblast 20,992 14,909 20,675 14,684 317 27.2 29,0 42.5 Voronezh Oblast 23,000 9,293 23,046 9,311 -45 17.5 30.0 7.4 Kursk Oblast 17,521 13,124 15,225 11,405 2,295 22.3 18.0 33.7 Lipetsk Oblast 18,386 14,899 16,403 13,293 1,983 17.8 16.0 43.8 Tambov Oblast 11,537 8,807 13,518 10,319 -1,981 17.3 54.0 43.6
Povolzhkiy region 277,512 16,676 247,739 14,887 29,772 15,0 46.0 19.2 Kalmykia Republic 1,953 5,972 5,619 17,184 -3,666 35.0 67.0 8.7 Tatarstan Republic 104,649 28,314 82,187 22,237 22,462 0,7 96,0 4.7 Astrakhan Oblast 7,930 7,852 10,762 10,655 ·2,831 25.3 32.0 15.0 Volgograd Oblast 35,586 13,464 33,099 12,523 2,487 31.4 21.0 16.6 Penza Ob1ast 11,341 7,491 12,902 8,522 -1,561 25.3 15.0 40.9 Samara Oblast 69,519 21,092 58,668 17,800 10,851 13.4 63.0 28.7 Saratov Oblast 28,149 10,383 26,564 9,799 1,585 14.0 24.0 19.0 Ul'yanovsk Oblast 18,384 12,732 17,938 12,423 446 6.2 25.0 24.2
North·Caucasus region 139,220 8,073 162,377 9,415 -23,156 33.2 40.0 23.8 Adygea Republic 3,544 8,018 4,828 10,924 -1,284 44.2 64.0 25.6 Dagestan Republic 4,795 2,537 21,239 11,238 ·16,444 31.4 92.0 40.9 Kabardino.Balkaria Republic 4,610 5,880 7,790 9,936 -3,180 31.9 63.0 18.7 Karachay·Cherkessia Republic 2,775 6,438 4,217 9,785 -1,443 41.2 12.0 9.4 North Ossetia Republic 5,160 7,425 9,690 13,942 -4,529 31.4 no 0.6 Chechenia and Ingushetia Republics 4,977 3,805 6,640 5,077 -1,663 17.0 0.2 Krasnodar Kray 47,389 9,879 45,626 9,5 II 1,763 33.5 18.0 24.1 Stavropol' Kray 18,520 7,303 18,468 7,282 52 40.7 10.0 39.5 Rostov Oblast 47,450 10,876 43,878 10,057 3,572 31.3 28.0 11.2

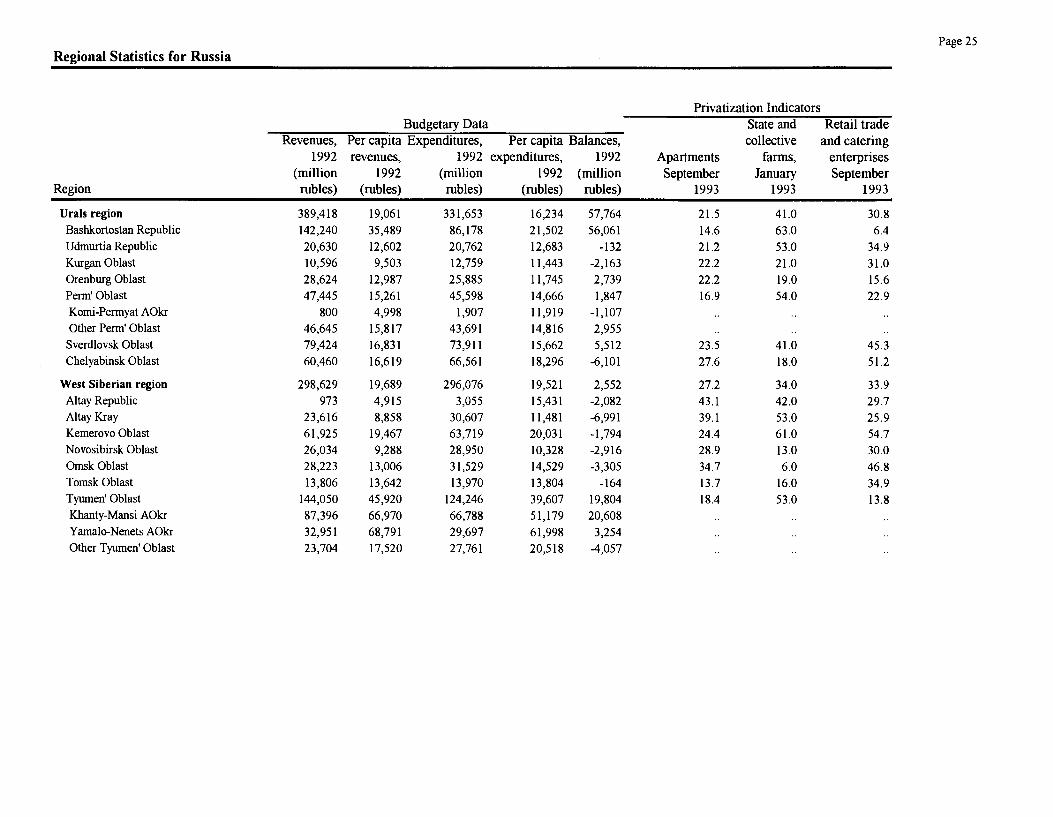
Page 25 Regional Statistics for Russia
Privatization Indicators Budgetary Data State and Retail trade
Revenues, Per capita Expenditures, Per capita Balances, collective and catering 1992 revenues, 1992 expenditures, 1992 Apartments farms, enterprises
(million 1992 (million 1992 (million September January September Region rubles) (rubles) rubles) (rubles) rubles) 1993 1993 1993
U rats region 389,418 19,061 331,653 16,234 57,764 21.5 41.0 30.8 Bashkortostan Republic 142,240 35,489 86,178 21,502 56,061 14.6 63.0 6.4 Udmurtia Republic 20,630 12,602 20,762 12,683 -132 21.2 53.0 34.9 Kurgan Oblast 10,596 9,503 12,759 11,443 -2,163 22.2 21.0 31.0 Orenburg Oblast 28,624 12,987 25,885 11,745 2,739 22.2 19.0 15.6 Penn' Oblast 47,445 15,261 45,598 14,666 1,847 16.9 54.0 22.9 Komi-Pennyat AOler 800 4,998 1,907 11,919 -1,107 Other Penn' Oblast 46,645 15,817 43,691 14,816 2,955
Sverdlovsk Oblast 79,424 16,831 73,911 15,662 5,512 23.5 41.0 45.3 Chelyabinsk Oblast 60,460 16,619 66,561 18,296 -6,101 27.6 18.0 51.2
West Siberian region 298,629 19,689 296,076 19,521 2,552 27.2 34.0 33.9 Altay Republic 973 4,915 3,055 15,431 -2,082 43.1 42.0 29.7 Altay Kray 23,616 8,858 30,607 11,481 -6,991 39.1 53.0 25.9 Kemerovo Oblast 61,925 19,467 63,719 20,031 -1,794 24.4 61.0 54.7 Novosibirsk Oblast 26,034 9,288 28,950 10,328 -2,916 28.9 13.0 30.0 Omsk Oblast 28,223 13,006 31,529 14,529 -3,305 34.7 6.0 46.8 Tomsk Oblast 13,806 13,642 13,970 13,804 -164 13.7 16.0 34.9 Tyumen' Oblast 144,050 45,920 124,246 39,607 19,804 18.4 53.0 13.8 Khanty-Mansi AOler 87,396 66,970 66,788 51,179 20,608 Yamalo-Nenets AOler 32,951 68,791 29,697 61,998 3,254 Other Tyumen' Oblast 23,704 17,520 27,761 20,518 -4,057


Page 26
Regional Statistics for Russia
Privatization Indicators Budgetary Data State and Retail trade
Revenues, Per capita Expenditures, Per capita Balances, collective and catering 1992 revenues, 1992 expenditures, 1992 Apartments farms, enterprises
(million 1992 (million 1992 (million September January September Region rubles) (rubles) rubles) (rubles) rubles) 1993 1993 1993
East Siberian region 141,447 15,275 156,520 16,903 -15,073 20A 48.0 32.0
Buryatia Republic 9,112 8,605 16,199 15,296 -7,087 26A 56.0 23.9
Tuva Republic 1,083 3,541 6,575 21,487 -5,492 26.6 71.0 17.6
Khakassia Republic 7,530 12,961 7,460 12,841 70 30.7 13.0 51.5
Krasnoyarsk Kray 60,900 19,961 55,989 18,351 4,910 21.0 31.0 31.1
TaymyrAOkr 1,168 22,036 1,971 37,186 -803
EvenkiAOkr 330 13,213 1,018 40,738 -688
Other Krasnoyarsk Kray 59,401 19,980 53,000 17,827 6,401
Irkutsk Oblast 50,732 17,664 52,448 18,262 -1,716 17.7 90.0 322
Ust-Orda Buryat AOkr 509 3,635 2,029 14,494 -1,520
Other Irkutsk Oblast 50,223 18,383 50,418 18,455 -195
Chita Oblast 12,089 8,691 17,848 12,831 -5,759 14.3 32.0 33.3
AgaAOkr 210 2,664 1,680 21,264 -1,469
Other Chita Oblast 11,879 9,054 16,169 12,324 -4,290
Far Eastern region 205,896 25,634 229,517 28,575 -23,621 18.5 26.0 17.9
Sakha Republic 96,579 88,361 91,446 83,665 5,133 4A 27.0 23.6
PrimorKray 29,269 12,676 31,790 13,768 -2,521 23.1 13.0 15.9
Khabarovsk Kray 30,274 16,320 33,596 18,111 -3,322 21.3 29.0 12.0
Birobijan AO 1,867 8,448 3,300 14,931 -1,433 18.5 25.0
Other Khabarovsk Kray 28,407 17,385 30,296 18,541 -1,889
AmurOblast 12,428 11,561 14,471 13,462 -2,043 22.9 14.0 27.9
Kamchatka Oblast 7,237 15,333 14,723 31,192 -7,486 18.1 79.0 3.6
KoryakAOkr 439 11,254 3,157 80,948 -2,718
Other Kamchatka Ob1ast 6,798 15,700 11,566 26,711 -4,768
Magadan Oblast 17,402 34,188 24,333 47,805 -6,931 14.6 80.0 24.5
Chukotka AOkr 4,461 30,555 9,955 68,182 -5,494 11.7 7.5
Other Magadan Oblast 12,941 35,649 14,378 39,609 -1,437
Sakhalin Oblast 12,706 17,672 19,157 26,644 -6,451 12.2 32.0 16.8
Kaliningrad Oblast 9,311 10,415 10,130 11,331 -819 19.1 4.0 17.5