Embed Size (px)
Citation preview

San Gabriel Valley Economic Partnershipcohosting withCal Poly Pomona
College of Business Administration
ECONOMIC FORECAST SUMMIT
San Gabriel Valley: SoCAL’s NEW GLOBAL FORCE

TABLE OF CONTENTSTHE UNITED STATES ECONOMY 2
THE CALIFORNIA ECONOMY 7
THE LOS ANGELES COUNTYECONOMY 14
SAN GABRIEL VALLEY ECONOMIC INDICATORS
Demographics 18Employment and Unemployment 21Income and Wages 22Business Establishments 23Foreign Direct Investment 24Business Sales and Revenues 24
INDUSTRIES OF THE SAN GABRIEL VALLEY
Health Care 26Higher Education 27International Trade and Goods Movement 28Manufacturing 28Professional and Business Services 29Residential Real Estate 29Nonresidential Real Estate 30Retail Trade 32Tourism and Hospitality 32
In this report, the San Gabriel Valley includes the following incorporated cities and communities:
AlhambraArcadiaAzusaBaldwin ParkBradburyClaremontCovina
Diamond BarDuarteEl MonteGlendoraIndustryIrwindaleLa Cañada FlintridgeLa PuenteLa VerneMonroviaMontebelloMonterey Park
PasadenaPomonaRosemeadSan DimasSan GabrielSan MarinoSierra MadreSouth El MonteSouth PasadenaTemple CityWalnutWest Covina
Report prepared for the Cal Poly Pomona College of Business Administration and the San Gabriel Valley Economic Partnership by the Los Angeles County Economic Development Corporation

EXECUTIVE SUMMARY
The San Gabriel Valley is a thriving region east of the City of Los Angeles and covers about 200
square miles. The name derives from the San Gabriel River, named for Spanish Mission San Gabriel Archangel, built in 1771. Originally agricultural, the Valley is now wholly urbanized encompassing 31 cities and five unincorporated areas in Los Angeles County.
This report offers a snapshot of the region’s resources, tracks its recent economic performance, and summarizes the economic outlook over the forecast period of 2018 and 2019. The findings contained in this report serve as a valuable tool for business people, government officials and households as they make spending and investment decisions for the forecast period and beyond.
Over the course of 2017, as the national and local economies continued to expand, the San Gabriel Valley economy also made notable progress as measured across a number of key indicators. Although challenges remain, including housing availability, stagnant wage growth and the specter of automation, the valley’s growing economy reflects many of the improvements taking place across Los Angeles County.
The ethnic composition of the San
Gabriel Valley’s population has undergone significant diversification over the past two decades, and it has experienced stable growth in terms of total numbers. Since 2010, the valley’s population has grown by about 2.8%. Population growth rates of 0.5% is forecasted for this year and next.
Continued population growth last year was accompanied by gains in wage and salary employment and payrolls. In 2017, San Gabriel Valley employment increased an estimated 2.0% to 691,143 payroll jobs. That number was over 2008’s pre-recession peak.. With additional improvements anticipated, job counts are expected to reach 704,093 in 2019, further exceeding the pre-recession peak. Likewise, wage and salary payrolls in 2017 totaled an estimated $39.1 billion, up by 4.5% from 2016. Most growth was the result of higher job counts as opposed to wage increases which, with the exception of some high- demand occupations, have been relatively at in real terms. Total nonfarm payroll is projected to increase by 3.2% to $35.9 billion in 2018 and climb to $37.0 billion in 2019.
The San Gabriel Valley housing market has improved, but obstacles remain. Median prices for existing homes continue to rise in response to limited supply and increased demand, but after
seven years of price increases and anemic real wage growth, affordability continues to be an issue for many would-be home buyers. At the same time, an incremental increase in mortgage rates are expected as inflation picks up, making home loans more restrictive. New home construction has been even slower to recover, but rising median prices and a lack of inventory are finally providing builders with incentive to initiate new development projects. Residential building are expected to increase by 8.0% by 2019 to 4,262 units.
The San Gabriel Valley economy should benefit from a moderate but steady pace of growth in 2018 and 2019. The trajectory of the valley’s economy will depend largely on the performance of the wider regional economy. Overall, the fundamentals are strong and growth should remain consistent if modest.
Despite remaining challenges, the San Gabriel Valley has assets to move forward: a diverse pool of human capital; world-class institutions of higher learning and research facilities; respected arts and cultural organizations; and a well-developed trade network. Forward momentum will come primarily from the private sector, but the public sector is also showing consistent strength, growing by over 5.3% in 2017 in a fourth consecutive year of growth.

ENVIRONMENT
The economy of the San Gabriel Valley responds to the ebbs and flows of the overall economy, not
just locally and statewide, but nationally as well. This section briefly summarizes the national, state and Los Angeles County economies in order to provide a framework within which to view current and anticipated economic conditions in the San Gabriel Valley.
A number of factors are at play in impacting the national economy. These include a bullish financial market which had augmented growth but is now experiencing volatility and stock value losses, the new Tax Cuts and Jobs Act altering the national corporate and income tax structure, a new chair at the helm of the U.S. Federal Reserve and expected increases in interest rates as consumer spending and inflation continues to rise, a controversial budget
shifting of funding away from some federal entities and into others and giving rise to concerns over the budget deficit.
The name of the game, then, is cautious optimism: the national economy continues to show unsung health and modest annual growth. Even in the face of regulatory and political uncertainty, economic fundamentals remain strong. Though not likely to get to the bullish 3.0 some policymakers predict, the U.S. economy is predicted to grow steadily over the next two years. Combined with concerns and assumptions presented here, the prediction is that the economy will growth 2.3 percent in 2018 and 2.1 percent in 2019.
Domestic consumption naturally bottomed out at the peak of the Great Recession in 2009, but since then domestic consumption has grown, albeit inconsistently. In 2017, consumption increased by 2.7 percent, compensating not only for the low contribution of investment and government expenditure to growth, but also the continued trade deficit.
ECONOMIC
2 ECONOMIC FORECAST SUMMIT
5.04.03.02.01.00.0
-1.0-2.0-3.0-4.0
2002
2003
2004
2005
2006
2007
2008
2009
2010
2011
2012
2013
2014
2015
2016
2017
2018
f20
19f
Growth in Real GDP(Annual % change)
Source: BEA; forecast by LAEDC
1.82.8
3.83.3
2.7
1.8
2.51.6
2.11.5
2.7 2.61.9
2.4 2.3 2.1
-0.3
-2.8
The U.S. Economy
Consumer Sector

Bank of America Merrill Lynch is proud to support the San
Gabriel Valley Economic Partnership.
Contact Alex Eng at [email protected]
bofaml.com/businessbanking
Bank of America Merrill Lynch” is the marketing name for the global banking and global markets businesses of Bank of America Corporation. Lending, derivatives, and other commercial banking activities are performed globally by banking affiliates of Bank of America Corporation, including Bank of America, N.A., Member FDIC. Securities, strategic advisory, and other investment banking activities are performed globally by investment banking affiliates of Bank of America Corporation (“Investment Banking Affiliates”), including, in the United States, Merrill Lynch, Pierce, Fenner & Smith Incorporated and Merrill Lynch Professional Clearing Corp., both of which are registered broker-dealers and Members of SIPC, and, in other jurisdictions, by locally registered entities. Merrill Lynch, Pierce, Fenner & Smith Incorporated and Merrill Lynch Professional Clearing Corp. are registered as futures commission merchants with the CFTC and are members of the NFA. Investment products offered by Investment Banking Affiliates: Are Not FDIC Insured • May Lose Value • Are Not Bank Guaranteed. ©2018 Bank of America Corporation. GBAM-103-AD ARHPBW6S
“

Providing consumers respond to the tax overhaul with confidence and indeed see increased annual after-tax earnings, domestic consumption should be expected to increase in the near term. However, concerns over political gridlock and policy uncertainty might temper this growth.
U.S. unemployment continues to dive lower than the golden 5.0 percent conventional economic wisdom touts as full employment. Indeed, current unemployment sits at 4.4 and is predicted to fall to 3.9 percent by 2019. Moreover, the U.S. economy is forecasted to add roughly 2.37 jobs in 2018 and 2.28 jobs in 2019, indicating residual labor market flexibility beyond the traditional benchmarks. The last time unemployment was this low was in 2000, just before the Dotcom bubble burst and the economy went into the first recession of the 21st century. Thus, like recent record stock market gains followed by intense losses, this low unemployment and continued expansion of the labor market should be viewed cautiously.
Moreover, the diminution of unemployment indicates a continued contraction of the U.S. labor supply,
meaning real wages should continue to increase and drive up inflation though consumer spending. Therefore, change in employment might fall in the medium term given a likely contraction of credit with higher interest rates. The threat of automation and machine takeover of many service industry jobs will also likely erode the continued addition of new jobs.
Having shrunk by 0.6 percent in 2016, non-residential business investment rebounded in 2017 with 4.7, likely due to investor confidence in the financial markets and general health of the American economy. Moreover, the price of crude oil and interest rates on 3-month Treasuries rose over the course of 2017, further strengthening the case for investor confidence.
Non-residential investment is predicted to grow again in 2018 and 2019, though at modest rates of 3.3 and 2.3, respectively.
By 2019, investment growth will mirror GDP growth more closely.
The boom in housing construction between 2012 and 2016 appears to have ended as of 2017 with a mere 0.017 percent growth in housing construction. As the long term employment effects of the Great Recession, especially as Millennials struggle with debt burdens and, depending on education, lack of employment opportunities, the supply of new homes has clearly heeded the lack of demand. As more Americans move to dense urban areas, the number of new residential developments will also likely fall as apartment complexes and condominiums replace suburban single-family homes as the dominant form of domicile.
The anemic growth in new housing is predicted to continue in 2018 and 2019, each year seeing only about 0.02 growth
1 ECONOMIC ENVIRONMENT
Labor Markets
Unemployment Rate
Source: BEA; estimates and forecast by LAEDC
14.0%
12.0%
10.0%
8.0%
6.0%
4.0%
2.0%
0.0%
2000
2001
2002
2003
2004
2005
2006
2007
2008
2009
2010
2011
2012
2013
2014
2015
2016
2017
2018
f20
19f
4.0%
4.7%5.8%
6.0%
5.5%5.1%
4.6%
4.6%5.8%
9.3%
9.6%
8.9%8.1%
7.4%6.2%
5.3%4.9%
4.4%
4.0%
39%
15%10%5%0%
-5%-10%-15%-20%-25%
2000
2001
2002
2003
2004
2005
2006
2007
2008
2009
2010
2011
2012
2013
2014
2015
2016
2017
2018
f20
19f
Growth in Real Residential Construction
Business Investment
Business in Residential Housing

Top 2% in the Nation
SafeCare 100 HospitalsThree years in a row for patient safety, quality and efficiency
Five-Star Rating From Medicare for Overall Hospital Quality
Physician Referral 888-388-2838www.methodisthospital.org

in residential housing construction. The housing market is also likely suffering from the seemingly diminished power of investment to drive growth and an investment market likely still leery of housing and real estate as an investment vehicle. Moreover, broader employment trends, especially the hollowing out of middle skill employment niches in many sectors, means fewer people with the financial means to take out a home loan. Should interest rates rise in the near term as expected, this problem will only be exacerbated.
Due to the inability to pass a comprehensive budget in 2017, government expenditures increased by only 0.001 percent last year. However, government spending at the federal level is predicted to increase modestly in the near term. This likely due in part to non-discretionary spending on many federal entitlements, such as Medicare and Social Security, increase as a proportion of federal outlays to meet the challenges of an aging population. The new
administration also appears poised to increase spending in the areas of defense, homeland security and veterans’ affairs.
Annual percent changes in the value of imports and exports are rather volatile and highly dependent on relative currency valuations and economic conditions of our trading partners.
Though peaking relative to previous years in late 2016, the U.S. dollar remains strong vis-à-vis other world currencies. This makes goods, especially in developing economies, cheaper to purchase, meaning U.S. firms will continue to reduce supply chain costs by purchasing materials, labor and finished goods from abroad.
Owing to this strength, imports grew by 4 percent in 2017. However, exports grew by 3.3 percent, indicating that despite the purchasing strength of dollar relative to 2008 and 2010, foreign consumers are demanding U.S. goods in sufficient quantity to close the gap
between import and export growth. This trend is predicted to continue
Both exports and imports are expected to growth again in 2018, but 3.2 percent and 3.6 percent respectively. For the first time since 2013, exports are expected to exceed imports in growth by 2.8 to 2.2 percent. Given the withdrawal of the U.S. from the Trans Pacific Partnership and the renegotiation of NAFTA, due to end in 2019, the diminution of imports might be as much policy-driven as a change of economic forces.
Prices, interest rates and financial returns can be among the most difficult indicators to predict, resting as they do on varying levels of investor and consumer confidence as market fundamentals. The annual percent change in the CPI, often the gold standard measure of inflation, finally exceeded the benchmark 2.0 percent in 2017. As such, the continued trend of Federal Reserve interest rate hikes is expected to continue into 2018 at least.
While wages have not performed as expected since the recovery, the overall employment cost index (ECI) across all workers has been on a generally upward trajectory, increasing by 2.2 percent in 2016 and 2.5 percent in 2017. This index measures all employment costs, including wages and benefits, and may be a better measure of employee compensation than wages as employers attempt to reallocate compensation from wage gains to increasingly costly benefits. The ECI is expected to continue to grow by 2.4 and 2.3 percent in 2018 and 2019.
Similarly, inflation is expected to continue apace at 2.4 and 2.2 percent in the next two years, perhaps indicating wages have at last started to perform more in accord with the still tightening labor market.
1 ECONOMIC ENVIRONMENT
5 ECONOMIC FORECAST SUMMIT
Government Purchases
International Trade
Prices

© 2018 Southern California Gas Company. All trademarks are property of their respective owners. All rights reserved. N18B0025A 0218
Businesses are cornerstones of our community and their owners are local heroes. They create jobs, provide goods and services and make a difference every day. SoCalGas® recognizes the San Gabriel Valley Economic Partnership for its dedication to opening new doors for businesses and creating new possibilities for our communities.
TOGETHER IN
ECONOMIC DEVELOPMENT

In 2017, California’s economy grew at an estimated rate of 2.5 percent, faster than the nation as a whole
which grew at 2.4 percent, but a continued slowdown from the 3.3 percent in 2016, and from 2014 and 2015 when growth raced along at over 4 percent. California currently accounts for 14.1 percent of the nation’s GDP, far more than any other state, and is expected to expand by 2.7 percent in 2018 and 2.6 percent in 2019, again outpacing the nation.
In 2017, California’s unemployment rate averaged 4.8 percent, the lowest from 2000 onward. It is expected to decline further, though slowly over the next two years, reaching 4.2 percent in 2019 as we reach full employment.
Nonfarm employment was up over the year by 295,500 wage and salary jobs, reaching a total of 16.8 million jobs, an increase of 1.8 percent over 2016.
Over the course of 2017, nearly all major industry sectors in California added jobs except for two sectors that continued shedding jobs. Manufacturing continued
its long-term sectoral decline in jobs by shedding 6,900 jobs last year, and natural resources lost 1,600 jobs.
Looking ahead, the rate of job creation will rise slightly to 1.8 percent annually in 2018 and fall back to 1.7 percent in 2019. This equates to 324,700 new jobs this year and 311,800 jobs in 2019.
The sectors expected to add the largest number of jobs over the two years are administrative and support services (137,400 jobs), and health care and social assistance (100,300 new jobs).
Along with employment growth, California’s residents experienced gains in personal income. Total real personal income in the state increased by 3.9 percent to almost $2.3 trillion due to higher levels of employment and rising wages. Per capita income was $58,063 in 2017. Over the next two years, additional gains of 2.9 percent and 2.8 percent are expected.
California’s technology sector includes firms in the computer and electronic product, aerospace and pharmaceutical manufacturing industries as well as software publishers, data processing, computer systems design, management, scientific and technical consulting, and scientific research and development services. Approximately two-thirds of California’s technology workers are employed by service-providing firms as opposed to manufacturing firms.
Technology employment in California reached just over 1.15 million workers in 2017, growing past the previous peak
CALIFORNIA ECONOMYTHE
7 ECONOMIC FORECAST SUMMIT
6.0%
4.0%
2.0%
0.0%
-2.0%
-4.0%
2002
2003
2004
2005
2006
2007
2008
2009
2010
2011
2012
2013
2014
2015
2016
2017
2018
f20
19f
Growth in Real GDP(Annual % change)
2.6
4.55
4.23.4
1.2
-0.3
-4.11.3 1.4
2.5
4.2 4.43.3
2.5 2.7 2.62.6
Source: BEA; forecast by LAEDC
Major IndustriesHigh Technology

CALIFORNIA ECONOMYof 1.14 million reached in 2016 by 1.5 percent (17,300 jobs). While overall employment was up last year, job growth was concentrated almost entirely in technology service-providing industries. Over one third of new technology jobs created were in computer systems design (5,900 jobs). Employment also rose in management, scientific and technical
consulting (700 jobs), and in scientific R&D services (1,000 jobs). Electronic product manufacturing employment grew by 700 jobs, while aerospace product and parts manufacturing jobs declined by 1,100 workers. Pharmaceutical and medicine manufacturing employment rose with a gain of 1,400 jobs.
California is the nation’s leading producer of fruits, vegetables, nuts and dairy products, and a major exporter of agricultural products. The state’s highest value commodities are milk, grapes, almonds and nursery plants. The value of agricultural real gross product in California accounted for about 1.2
Agriculture

percent of the state’s $2.4 trillion gross product in 2017. The number of farm workers in California rose to 431,700 (an increase of 1.2 percent compared with 2016), and accounted for 2.5 percent of its civilian employment.
In 2016, the latest year for which data is available, California’s farms and ranches generated cash receipts of $45.3 billion (inflation-adjusted), more than any other state in the nation, accounting for 13 percent of the national total. Still, this was a decline of 4 percent compared with 2015. The dairy industry is the leading commodity in cash receipts followed by almonds and grapes.
The health care and social assistance industry is California’s largest industry sector and one of the fastest growing, providing jobs across a wide range of skill and income levels. Jobs in health care are found in doctors’ and dentists’ offices, hospitals, outpatient centers, laboratories, nursing facilities, and organizations that provide social services like child daycare, vocational rehabilitation and family services.
With over 2.2 million workers, health care accounts for slightly more than 13 percent of the state’s 16.8 million nonfarm wage and salary jobs. Over the course of 2017, the health care sector added 62,300 jobs, an annual growth rate of 2.9 percent. Over the next two years, health care employment will continue to increase, but the rate is expected to slow to 2.5 percent this year and to 1.9 percent in 2019.
Total visitor counts in California were up by an estimated 2.1 percent on an annual basis in 2017, slowing from a stronger growth rate of 2.2 percent in 2016. The industry projects an increase of 2.5 percent in total visits in 2018, with domestic travel projected to increase by 2.3 percent and international travel to decline by 0.9 percent.
Health Care
Leisure and Hospitality
proud sponsorof
2018 economicforecast summit
www.upperdistrict.org
UPPER SAN GABRIEL VALLEYMUNICIPAL WATER DISTRICT
10ECONOMIC FORECAST SUMMIT
Expenditures by business and leisure travelers to the state totaled $130.3 billion in 2017, an increase of 3.2 percent compared with 2016.
In 2017, leisure and hospitality jobs accounted for about 11.6 percent of nonfarm wage and salary jobs in California. While some of leisure and hospitality activity is associated with tourism, many of these jobs serve the local population more so than the region’s tourists and business travelers. Jobs in this industry include lodging, food services, the performing arts, museums, amusement parks and gambling establishments. Leisure and
hospitality employment grew by 2.5 percent in 2017 to 1.9 million jobs, with an additional expected gain of 2.7 percent in 2018 and 1.0 percent the following year.
Construction activity and employment in 2017 posted another increase after struggling in the years during and immediately following the recession. The value of nonresidential construction permits in 2017 rose by 8.5 percent to $29.9 billion. The strongest gains by sector were retail and new industrial buildings, while office and hotels and motels declined over the year. New
residential construction also showed a moderate gain in 2017 but remains at historically low levels.
Construction employment saw substantial growth in 2017, rising by 5.3 percent to 815,200 jobs. Employment gains in recent years have partially offset the jobs lost during the recession, but construction job counts were still down almost 119,000. Construction employment is expected to grow by an additional 4.8 percent this year with an additional 4.4 percent gain projected for 2019, bringing California construction employment to within almost 5 percent of the pre-recession peak.
Construction
1 ECONOMIC ENVIRONMENT

THE LOS ANGELES
COUNTY
ECONOMY
Growth in Real GDP Los Angeles County
(Annual % change)
Source: BEA; estimates and forecast by LAEDC
7.0
5.0
3.0
1.0
-1.0
-3.0
-5.0
2002
2003
2004
2005
2006
2007
2008
2009
2010
2011
2012
2013
2014
2015
2016
2017
2018
f20
19f
3.0 3.4 3.72.3
4.1
1.8 1.70.6
2.91.9
3.94.7
2.13.2
2.4 2.21.2
-4.4

13191 Crossroads Parkway North, Sixth Floor, City of Industry, CA 91746-3497
Tel: 562.692.9581 • www.MajesticRealty.com • R.E. License #00255328 (CA)
L O S A N G E L E S | A T L A N T A | B E T H L E H E M | D A L L A S | D E N V E R | F O R T W O R T H | L A R E D O | L A S V E G A S | P H O E N I X | P O R T L A N D
There is nothing better for your businessthan a Majestic address!
Majestic Realty Co. has been a leader in real estate development since 1948with a portfolio of nearly 78 million square feet
19482018
We are proud to call theSan Gabriel Valley our home...
A thriving and vibrant metropolis, Los Angeles County is home to more than 10 million residents
and boasts a workforce of more than 5.1 million today. It has one of the largest manufacturing centers in the nation, is a global gateway for trade and tourism, and draws entrepreneurs and risk-takers from around the world.
In 2017, real GDP in Los Angeles County grew 3.2 percent, an uptick from last year’s 2.1 percent. However, this year’s growth was slower than the national rate of growth. Real GDP growth is expected to be 2.4 percent for this year and 2.2 for the next, also outpacing the nation.
In 2017, the average unemployment rate in Los Angeles County reached 4.6
percent, the lowest unemployment rate since 2000 and almost a third of the peak rate of 12.5 percent reached in 2010. It is expected to decline slowly over the
next two years, falling to 4.3 percent in 2018 reaching 4.1 percent in 2019 as the county reaches full employment.
15ECONOMIC FORECAST SUMMIT

Job growth has been positive since 2011, averaging 2.5 percent annually since 2012. This is expected to slow to 1.9 percent for the next two years as there are fewer jobs needed to be added and as the labor market tightens.
Nonfarm employment was up over the year by 56,900 wage and salary jobs to reach just over 4.4 million jobs, an increase of 1.3 percent over 2016.
As the rate of job creation slows, the number of jobs added will also decline, with 47,800 jobs expected to be added in 2018 and 34,300 in 2019.
Personal income in Los Angeles County has been rising, posting consecutive year-over-year increases since 2013. In 2016, personal income totaled $563.9 billion, is predicted to reach $585.5 billion in
2017, and is forecast to continue its growth pattern reaching $619.7 billion in 2019.
In addition to total personal income, real per capita income has also been rising, reaching $48,790 in 2016, predicted at $50,650 in 2017, and forecast to increase to $52,080 in 2019.
In 2017, the number of permits issued for new home construction in Los Angeles County increased over the year by 8.9 percent to 22,010 units permitted. New home construction peaked in Los Angeles County in 2004 at 26,935 units permitted before falling to a low of 5,653 units in 2009. Since then, new home construction has increased at a gradual pace, with the exception of 2016.
One notable change in new residential construction in Los Angeles County that has occurred in the aftermath of the recession is the rising share of permits for multi-family homes relative to new single-family construction. Between 2000 and 2005, the average share of single-family permits averaged 46 percent of total new home construction. Since then, the share has steadily declined, falling to just 25 percent in 2017.
In 2017, the median home price in Los Angeles County increased over the year by 8.0 percent to an estimated $560,860. The median price fell to a low of $321,390 in this cycle after reaching a peak of $532,281 in 2007. The median home price in Los Angeles County has increased by 75 percent since bottoming out in 2011, and ended last year 5.4 percent above its former peak.
Housing
1 ECONOMIC ENVIRONMENT

17ECONOMIC FORECAST SUMMIT
The San Gabriel Valley is an area uniquely distinct from greater Los Angeles County, in terms
of demographic composition, industry employment, wages and income and industry concentration of business establishments. These indicators are explored here.
Demographics of the resident populations provide context into the strengths and challenges of the region.
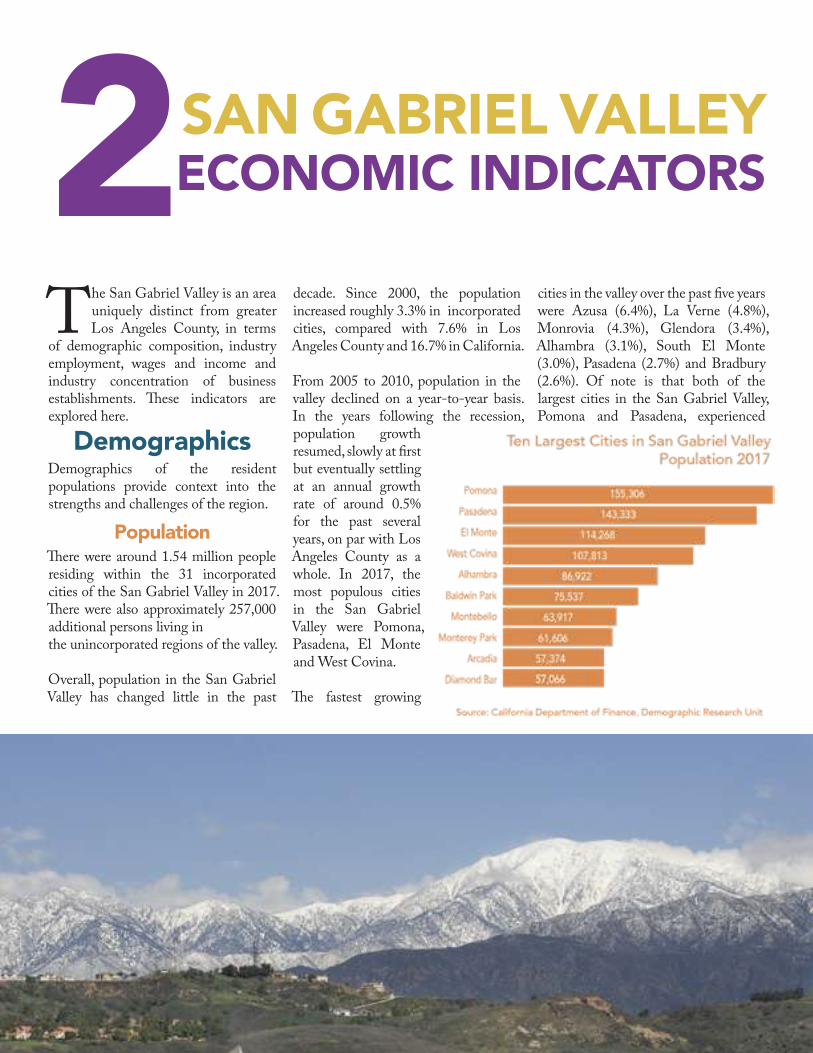
There were around 1.54 million people residing within the 31 incorporated cities of the San Gabriel Valley in 2017. There were also approximately 257,000 additional persons living inthe unincorporated regions of the valley.
Overall, population in the San Gabriel Valley has changed little in the past
decade. Since 2000, the population increased roughly 3.3% in incorporated cities, compared with 7.6% in Los Angeles County and 16.7% in California.
From 2005 to 2010, population in the valley declined on a year-to-year basis. In the years following the recession, population growth resumed, slowly at first but eventually settling at an annual growth rate of around 0.5% for the past several years, on par with Los Angeles County as a whole. In 2017, the most populous cities in the San Gabriel Valley were Pomona, Pasadena, El Monte and West Covina.
The fastest growing
cities in the valley over the past five years were Azusa (6.4%), La Verne (4.8%), Monrovia (4.3%), Glendora (3.4%), Alhambra (3.1%), South El Monte (3.0%), Pasadena (2.7%) and Bradbury (2.6%). Of note is that both of the largest cities in the San Gabriel Valley, Pomona and Pasadena, experienced
ECONOMIC INDICATORS2SAN GABRIEL VALLEY
Demographics
Population

Suppor&ngtheSanGabrielValleywith3,000Businesses&
67,000Jobs
FindoutmoreatCityofIndustry.org
60 YEARS Jobs, Enterprise & Regional Infrastructure
significant population growth over the past five years. Only one city posted a decline in population over the five-year period, Baldwin Park (-0.1), although others have undergone very little growth.
The San Gabriel Valley’s population is diverse in race and ethnicity, even more so than Los Angeles County.
Hispanics/Latinos make up the largest ethnic group with a total population of 695,000. There are ten cities (out of 31) where Hispanics constitute the majority of the population, and while they are most heavily concentrated in Irwindale, La Puente, South El Monte, Montebello and Baldwin Park, Hispanics and Latinos are well represented in most communities throughout the region.
Asians are the next largest ethnic group
in the San Gabriel Valley with a total population of 456,000. There is a large ethnic Chinese population that began with an influx of Taiwanese in the 1970s
and more recently, mainland Chinese. There are nine cities in the San Gabriel Valley where Asians are a majority, including Monterey Park, Walnut, San
19ECONOMIC FORECAST SUMMIT
Race and Ethnicity

Gabriel and Rosemead. The number of Asian residents in the valley distinguishes it from the rest of Los Angeles, which has roughly half the proportion of Asian residents with respect to the larger Angeleno population.
Whites made up the third largest group in the valley with 300,000, followed by African Americans (49,000). The balance of population (37,000) includes Native Americans, Hawaiians/Pacific Islanders, and persons who identified as
“other” or of two or more races.
The San Gabriel Valley is home to many highly-educated workers. Excellent higher education is provided by numerous institutions including Caltech, the Claremont Colleges, Cal Poly
Pomona, California State University Los Angeles and the region’s community colleges. However, there are a number of communities where educational attainment is more challenged.
The overall level of educational attainment in the San Gabriel Valley is slightly higher than that of Los Angeles County. For the valley as a whole, 80.2% of the population (25 years and older) has a high school diploma (or equivalent) and 32.3% has earned a Bachelor’s degree or higher.
The cities with the largest percentage of adults holding a Bachelor’s degree or higher are La Cañada Flintridge (75.3%), San Marino (71.7%), Sierra Madre (65.1%), South Pasadena (61.5%), and Bradbury (59.1%).
At the other end of the spectrum, there are eleven cities where the percentage of the adult population with a high school diploma is less than average for the valley as a whole. In both El Monte and South El Monte, less than 60% of the adult population has a high school diploma.
Worker commuting patterns show that the majority of residents of the San Gabriel Valley (aged 16 and older) worked somewhere in Los Angeles County – 85% versus 15% who commuted to work outside the county.
Travel times to work for San Gabriel Valley residents are very similar to the distribution of commute times found in Los Angeles County as a whole.
20 ECONOMIC FORECAST SUMMIT
Educational Attainment
Commuting Patterns
The average one-way commute to work for people living in the San Gabriel Valley was 31.0 minutes, while the average commute time nationally was 26.1 minutes. Similarly, 14.2% of residents in San Gabriel Valley spent at least one hour commuting to work, while countywide 13.1% did; the national share was lower at 8.7%.
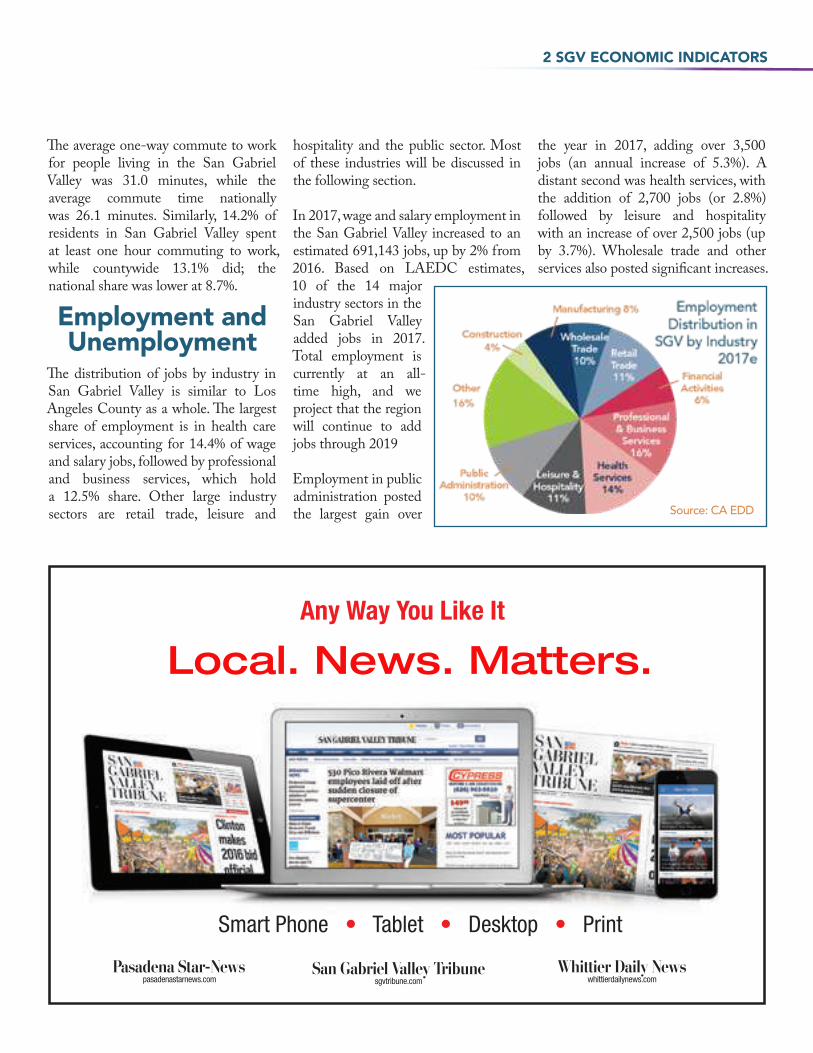
The distribution of jobs by industry in San Gabriel Valley is similar to Los Angeles County as a whole. The largest share of employment is in health care services, accounting for 14.4% of wage and salary jobs, followed by professional and business services, which hold a 12.5% share. Other large industry sectors are retail trade, leisure and
hospitality and the public sector. Most of these industries will be discussed in the following section.
In 2017, wage and salary employment in the San Gabriel Valley increased to an estimated 691,143 jobs, up by 2% from 2016. Based on LAEDC estimates, 10 of the 14 major industry sectors in the San Gabriel Valley added jobs in 2017. Total employment is currently at an all-time high, and we project that the region will continue to add jobs through 2019
Employment in public administration posted the largest gain over
the year in 2017, adding over 3,500 jobs (an annual increase of 5.3%). A distant second was health services, with the addition of 2,700 jobs (or 2.8%) followed by leisure and hospitality with an increase of over 2,500 jobs (up by 3.7%). Wholesale trade and other services also posted significant increases.
Any Way You Like It
Local. News. Matters.
San Gabriel Valley Tribunesgvtribune.com
Pasadena Star-Newspasadenastarnews.com
Whittier Daily Newswhittierdailynews.com
Smart Phone • Tablet • Desktop • Print
2 SGV ECONOMIC INDICATORS
Employment and Unemployment

Total employment in the San Gabriel Valley is expected to reach to 698,676 jobs this year, equivalent to a 1.1% annual gain, and with an additional gain of 0.8% in 2019 bringing total wage and salary employment up to 704,093 jobs.
There were three sectors that recorded
declines in employment over the year: retail trade (840 jobs); manufacturing (500 jobs); and construction (20 jobs). The contraction in the manufacturing sector reflects countywide and national trends, while the pull-back in retail trade reflects national competition from ecommerce which threatens local retail jobs and a broader shift in consumption patterns.
Unemployment rates in the San Gabriel Valley, as across the county and state, have been falling. The
current rate of unemployment in the San Gabriel Valley is 4.2%, compared to 4.6% for Los Angeles County.
San Gabriel Valley cities enjoying the lowest unemployment Rates are San Marino (1.7%), Industry (1.7%), South
El Monte (2.4%) and Arcadia (2.6%).
Cities with the highest unemployment rates are Baldwin Park (6.1%), Irwindale (6.1%), El Monte (5.7%), West Covina (5.7%) and Covina (5.5%).
Unemployment is projected to continue to decrease over the next year as job gains are absorbed by the labor market, dropping to 3.9% in 2018 and 3.8% the following year.
Professional and business services account for the largest single share of payroll, equaling 16.6% of all payrolls paid in San Gabriel Valley. However, just behind it is the Health Services sector at 15.5%, reflecting the increasing
2 SGV ECONOMIC INDICATORS
Income and Wages

importance of workers in the healthcare industry to the San Gabriel economy.
The total value of wage and salary payrolls in the San Gabriel Valley reached an estimated $34.8 billion in 2017, up by 4.5%, or $1.5 billion from 2016. Given the slow wage growth in the United States since the end of the recession, it is likely a large part of growth in the San Gabriel Valley is coming from higher job counts as opposed to rising wages. Total payrolls are projected to increase 3.2% to $35.9 billion in 2018, a combination of both rising wages, with the labor market tightening, and higher levels of employment.
The average annual wage in 2016 (the latest year annual data was available) in the San Gabriel Valley was $52,597.
Average wages in the San Gabriel Valley remain lower than Los Angeles County as a whole in nearly all industries. The only exceptions was in the construction industry where they were marginally higher.
The average annual wage in the construction sector was 2.3% higher in the San Gabriel Valley than the county average. There was a wide divergence in wages for natural resources & mining, information, financial activities, manufacturing and leisure & hospitality.
There were 73,337 business establishments in the San Gabriel Valley in 2016, equivalent to 16.6% of the county’s 442,171 establishments. Health services ranked first in terms of
Serving the Pomona, Walnut and Eastern San Gabriel Valleys since 1950.
threevalleys.com
Three Valleys Municipal Water District is proud to have partnered with the San Gabriel Valley Economic Partnership since 2007
23ECONOMIC FORECAST SUMMIT

establishments by industry, with 20.1% of all establishments, not including home health care providers. In addition to hospitals and clinics, there are numerous physicians’ and dental offices, nursing and residential care facilities, and social assistance/child welfare facilities in the San Gabriel Valley. The next largest, in a distant second, was professional and business services with 15.6% of all establishments. The sector includes accountants, architects, engineers, lawyers, consultants, temporary employment services and janitorial services.
Several San Gabriel industries account for a sizeable percentage of all establishments in Los Angeles County. The San Gabriel Valley was home to 4,809 wholesale trade establishments in 2016, or 24.5% of the Los Angeles County total. San Gabriel Valley manufacturing and retail trade establishments represent 18.5%
and 18.4%, respectively, of the total establishments in those industries in Los Angeles County. The construction industry in the San Gabriel Valley has 19.3% of the county’s total construction Industry business establishments.
One notable difference between the business establishments in the San Gabriel Valley and those in the broader Los Angeles County is that the companies in the valley have a vastly more diverse group of owners. Businesses in the broader county are majority owned by white owners, whereas in the valley Asians own the most businesses as a demographic group, and a much more equal share of ownership between the Hispanic and White communities. This difference in ownership is reflective of the broader diversity of the San Gabriel Valley, as well as the uniquely important Asian-American population.
Behind only New York City, Los Angeles is one of the largest recipients of foreign direct investment in the country. In particular, strong ties between the Asian-American community in the region with our major trading partners in East Asia results in a heavy degree of business investment by major international firms.
The three largest contributors of foreign direct investment, in terms of number of establishments, are Japan at 18.3%, China at 15.6% and Taiwan at 8.2%, for a combined share of 42.1% of all firms. In terms of industries, foreign direct investment appears to be heavily weighted towards trade and manufacturing with Wholesale Trade, Retail Trade and Manufacturing accounting for a full 55.3% of all firms. There is also a significant presence of foreign investment in finance and insurance establishments.
A new Economic Census, consisting of data from 2017 is scheduled to come out later in 2018, however despite being slightly dated, the most recent data from 2012 still gives insight into the structure and success of businesses in the San Gabriel Valley. Only focusing on employment data to measure the strength of an industry can be wildly misleading as it can easily mask important information about productivity shifts and capital investment that are key to the success and health of our industries moving forward.
24 ECONOMIC FORECAST SUMMIT
Business Sales and Revenues

San G abriel Basin
Celebrating 25 Years of Cleaning up Groundwater for Future Generation
www.wqa.com
The 2012 Economic Census provided information on: Administrative support and waste management services; Health care and social assistance services; Leisure and hospitality; Manufacturing; Other services; Professional, Scientific and technical services; Real estate services; Retail trade; Transportation; Wholesale trade.
Based on these ten sectors, total business revenues for the San Gabriel Valley in 2012 were $98.6 billion. The highest revenue figures were found in wholesale and retail trade, and manufacturing, which represented 69% of the total for the San Gabriel Valley. The next most prominent sectors were health care, professional scientific and technical services, and leisure and hospitality.
The City of Industry had the highest
business revenues $27.1 billion) of all cities in the San Gabriel Valley in 2012. Not surprisingly, wholesale trade and manufacturing were the two leading sectors in the City of Industry. Pasadena was a distant second with total business revenues of $14.1 billion, coming mainly from professional, scientific and technical services. Together, these two cities (with about 9.0% of the total population) represented 42% of total business revenues in the San Gabriel Valley. Irwindale, Arcadia, El Monte, Montebello, Alhambra, West Covina and Azusa led amongst the remaining cities in the Valley.
The reader is cautioned that while this is the most recent data available on shipments by industry, changes in industry composition of each city may have had significant impacts on these relative positions since 2012.
25ECONOMIC FORECAST SUMMIT
2 SGV ECONOMIC INDICATORS

ww
The San Gabriel Valley has a number of significant economic drivers including: health
care, higher education, international trade, manufacturing, professional and business services, retail trade and tourism. These industries are the foundation of the San Gabriel Valley’s economic growth, drawing in dollars from outside the region, fostering innovation and creating wealth.
Housing and commercial real estate are also important components of the region’s economy. Additionally, the San Gabriel Valley has a considerable number of people employed in public administration jobs.
Health care is a large industry in the U.S. In 2017, national health care expenditures increased by 4.3% to
$10,348 per person ($3.3 trillion in total) and accounted for 17.9% of GDP. Between 2017 and 2026, health care expenditures are projected to grow at an average rate of 5.5% per year. Efforts to contain costs are colliding with increased demand for health care services and a number of ongoing public health crises. Fiscal pressures, sweeping regulatory changes under the Affordable Care Act and more empowered consumers are creating a new health care economy.
In Los Angeles County, the health care industry employed over 673,000 workers in 2017. Over the last several years, health care employment has expanded at a rapid pace, increasing by an estimated 2.6% last year. Job counts have increased at hospitals, physicians’ offices, and nursing and residential care facilities.
In the San Gabriel Valley, there were just
short of 100,000 individuals employed in the health care sector in 2017, not including those involved in services for the elderly and disabled, making health care by far the largest employment sector in the valley. The average annual wage in the health care sector is $52,863, as opposed to $56,638 for Los Angeles County as a whole.
Employment is expected to increase this year and again in 2019. This trend is being driven by demographics (population growth, an aging population, retiring baby boomers and increased life expectancy), employment growth (health care is a consumer good) and healthcare reform, which has expanded the number of individuals with access to health insurance coverage.
While the many medical professionals in the region serve the local population, facilities such as the City of Hope and
INDUSTRIES OF THE SAN GABRIEL VALLEY3
26 ECONOMIC FORECAST SUMMIT
Health Care

ww
Huntington Memorial also attract patients from outside the area (i.e. medical tourism). In addition to providing treatment, other important related sources of economic activity are medical research and the production of medical instruments/devices.
The San Gabriel Valley’s universities and community colleges are among the region’s most valuable assets and figure prominently in the valley’s nonprofit sector. The San Gabriel Valley is home to a number of educational institutions (public and private) that play a central role in creating the next generation of skilled workers, professionals and entrepreneurs. This sector also includes a number of highly regarded community colleges that provide a stepping stone to four-year
universities or vocational training. In this age of rapidly evolving technology, where ideas play a key role in growing the economy, education and skills acquisition are essential to bringing new ideas to life and transforming them into commercial applications.
Four-year postsecondary institutions include the California Institute of Technology (Caltech), Harvey Mudd College, University of La Verne, Azusa Pacific University, California State Polytechnic University Pomona, California State University Los Angeles and the Claremont Colleges. The Art Center College of Design in Pasadena has an international reputation for automotive design and is strong in other creative disciplines as well. There are three community colleges in the valley (Citrus College, Mt. San Antonio College and Pasadena
City College) offering academic and vocational training programs.
The presence of major centers of learning and research in the valley creates opportunities for business start-ups, many of which stay in the area. Research and development activities support aerospace, technology, medical device and biomedical firms. Spin-offs, particularly from Caltech and Cal Poly Pomona, have made important contributions to the “green” economy in areas of technology that include batteries, electric car charging stations, solar panels and nanotechnology.
In 2017, employment at private educational institutions increased by 2.2% after a series of declines in the previous few years. Payrolls are expected to increase slightly in 2018 and 2019. The outlook for the region’s
Serving the cities of
Arcadia, Duarte, Monrovia, Sierra Madre,
South Pasadena, and Pasadena
Job Seekers acquire the tools that match today’s labor market demands
Businesses receive access to qualified employees and incentives for success and sustainability
Communities grow with economic vitality throughout the region
For any information please visit our website at www.fwdbworks.org or contact us at 626.796.5627
Keeping Good Company
INDUSTRIES OF THE SAN GABRIEL VALLEY Higher Education

publicly-funded and nonprofit schools is also improving. California’s financial footing is much stronger and more funds for higher education have been allocated in the current state budget, easing (but not eliminating) the financial strain on CSU Los Angeles and the region’s community colleges.
Similar to both Los Angeles County as a whole, and the neighboring Inland Empire, the San Gabriel Valley economy depends in large part on domestic and international trade flows. Trade-related employment includes occupations in the wholesale trade, transportation, logistics and distribution services.
In 2017, the wholesale trade industry in the San Gabriel Valley employed an estimated 45,675 workers and an additional 24,411 workers in transportation, warehousing and utilities. Additionally, the San Gabriel Valley has a higher concentration of workers employed in wholesale trade than Los Angeles County overall – 6.6% versus 3.5%.
About forty percent of the nation’s imported containers enter the United States through the San Pedro Bay ports. Los Angeles and Long Beach rank number one and two,
respectively, in total container throughput of any port in the Western Hemisphere. In 2017, the Ports of Los Angeles and Long Beach handled 16.8 million containers, an increase of 7.7% compared with 2016. On an individual port basis, the total loaded cargo volume at the Port of Los Angeles was up by 5.7% last year, and the Port of Long Beach was up a significant 11.4% after a lackluster 2016.
The Los Angeles Customs District (LACD) maintained its top position in the U.S. in 2017, posting a substantial 8.4% increase in the value of two-way trade over the year to $431.4 billion. In addition to the two ports, the LACD also includes international airport cargo passing through both LAX and Ontario International Airport. Air cargo generally consists of small, lightweight, high-value products that require quick delivery. Freight tonnage transiting through LAX increased by 9.0% last year, while at Ontario freight tonnage increased by 15.0% over the same period.
We expect US export growth to continue on the back of an expanding world economy. Meanwhile, U.S. import growth should continue on the back of strong increases in domestic consumption. We expect import growth to increase faster than exports, driving an increase in trade and goods movement related employment.
The San Gabriel Valley is home to a diverse set of manufacturing sectors including computer and electronic products, plastics and rubber products, transportation equipment, chemicals, and furniture. In addition, the valley has a large contingent of fabricated metal products manufacturing firms. These
are primarily small machine shops employing on average 20 people doing contract work for aerospace, medical device and defense industries.
Since 2002, total manufacturing employment in the San Gabriel Valley has been steadily trending down, although since 2010 it has stabilized at around 58,000 jobs. In 2017, an estimated 57,505 workers were employed by the valley’s manufacturing firms, a decline of 0.9% compared with 2016. Manufacturing employment throughout Los Angeles County has seen similar declines. The average annual wage in the valley’s manufacturing sector was $54,195 in 2016 (the latest year for which annual data are available) versus the county-wide average of $68,221.
Although companies moving production overseas or to other states accounts for some of the employment decline, automated capital is increasingly replacing labor, while the remaining labor itself has become more productive. The result is that even as manufacturing employment levels have fallen throughout the county, the value of manufacturing output has increased.
There are a number of advantages for manufacturing firms in the San Gabriel Valley. One is the sheer size and diversity of the local market. In addition, high quality educational facilities and workforce development programs are a source for businesses looking for skilled workers. Finally, served by the region’s freeways, rail and air links, the San Gabriel Valley functions as a major gateway to the local ports and the broader Southern California region.
Professional and Business Services
28 ECONOMIC FORECAST SUMMIT
International Trade and Goods
Movement
Manufacturing

The professional and business services sector includes a diverse set of industries including professional, scientific and technical services; management of companies and enterprises (corporate headquarters); and administrative, support and waste services.
In the San Gabriel Valley, this industry employed the second largest number of workers in 2017 (behind health services) with an estimated 86,265 payroll jobs, an increase of 2.6% compared with 2016.
Although wage and salary employment in business and professional services has increased since 2011, the industry has not regained all of the jobs lost during the recession and is currently about 8.7% below the peak employment level reached in 2006.
The average annual salary in 2016 (the latest for which actual annual data is available) in professional and business services was $65,199. This was about 7.0% less than the county-wide average of $70,073.
Residential Real Estate
In 2017, Southern California’s housing markets made notable progress and are poised for stronger gains in 2018. Contributing to improvements expected this year are job and income growth, new home construction, an increase in the number of homeowners with positive equity, and low mortgage interest rates.
Obstacles remain, however. Mortgage availability and housing affordability
have kept progress in check. Although mortgage lending standards have shown a slight easing, they remain tighter than historical norms. Another hurdle for many potential buyers is the sharp appreciation of home prices, in part the result of persistently low inventories. Median home prices in California have outpaced wage gains significantly,
especially in California’s large metro areas where job growth is concentrated. After years of steadily rising prices, affordability is rapidly declining and many traditional and first-time buyers (already at historically low shares) have been priced out of the market. Finally, credit may start to tighten as inflation increases and interest rates rise.
3 INDUSTRIES OF SVG
Professional and Business Services
Median home prices have risen significantly throughout the San Gabriel Valley, boosted by strong demand and lean inventories. An influx of wealthy foreign investors has also exerted upward pressure on prices. The double digit percentage gains recorded in many San Gabriel Valley cities in 2013 and 2014 have largely given way to more moderate price increases, but some areas (La Canada Flintridge, Hacienda Heights, South El Monte, San Marino, and Altadena) posted double-digit year-over-year gains in 2015. Last year, all of the valley’s 31 cities reached new peak prices, although others continue to lag. The median price in several cities throughout the valley is still below prerecession peak prices including in Pomona, La Puente and Baldwin Park.
New home construction is still at very low levels but the next two years should bring a moderate acceleration of building activity. Beginning in 2013 and continuing through 2015, new home construction in the San Gabriel Valley began to tilt towards multi-family homes, primarily apartments. Last year, there was a roughly 50/50 split between construction the two. The reversal of the long-run trend (of an industrial
focus on single family over multifamily residential construction) is attributed to the diminishing supply of land available for new home construction and changing consumer preferences for centralized urban environments.
Last year, the total number of permits issued for new residential construction in the San Gabriel Valley declined by 13% to 1,965 units permitted. This is likely due to countrywide declines in investment due to an uncertain economic and regulatory environment, as well as typical California-specific high construction costs.
LAEDC forecasts that homebuilders will pull permits for 2,043 new single and multi-family units in the San Gabriel Valley this year, roughly in line with the number in 2017, while an increase to 2,219 units is anticipated for 2019.
The San Gabriel Valley’s housing market is undergoing the same overheating that the county as a whole is experiencing, and due to insufficient new construction it is unlikely to abate in the near future. In the long run, expect to see more dense construction to take advantage of the demand and high prices, as well as a continued shift to multi-family units and more urban living.
The fundamentals of commercial (offices, retail and hotel) and industrial real estate are strong, supported by employment growth and stronger economic activity. Nationally, investment in nonresidential structures took a slight step back in 2017, declining by an estimated 0.3% over the year after increasing by 4.3% in 2016, but is expected to rise by between 2 and 3% this year and next.
As a major gateway market for consumer and business goods, Southern California’s industrial real estate markets have seen years of steady improvement. The region is a hub for manufacturing, international trade and logistics, and entertainment, all of which use industrial space. Right now, the primary concern for the region’s industrial market is not demand, but supply.
By the end of 2017, the San Gabriel Valley’s industrial real estate market had ended its streak of consistent growth since the recession and saw a slight uptick in vacancy rates from its streak of historic lows. However with a vacancy rate of around 1.4% the market remains one of the tightest in Los Angeles County, and very near to its all-time low.
Overall warehousing and distribution asking rents maintained at a rate of $.71 per square foot, the same as last year. In contrast manufacturing asking rents fell from $.83 to $.53. Rental rates should fall as constant demand is met with significant new construction.
Leasing activity in 2017 in San Gabriel Valley totaled 5.3 million square feet, significantly less than the 6.2 million square feet in 2016. By the end of 2017, there were over 2,539,000 square feet of new product in the pipeline, as well as roughly 2,000,000 square feet of new completed industrial construction. Although demand is very high, the Los Angeles industrial market is constrained by exceptionally low availability. Robust demand has kept pressure on developers to deliver new product to the market. Fortunately, developers did responded and are producing large amounts of new industrial square footage, which has begun to balance out the high demand.
30 ECONOMIC FORECAST SUMMIT
New ConstructionNonresidential Real
Estate

Office occupancy across Los Angeles had been on a consistent, if slow, upward trend up until the end of 2015, at which point it began to stagnate and rise again. In the fourth quarter of 2017 the overall vacancy rate in Los Angeles was 15.1%, an increase from 14.1% in 2016. Total leasing activity Net absorption (occupancy gains) was 1.8 million square feet, a significant drop from 2.5 million the year prior. Across the region, the average direct class A asking rent increased 8.1% compared with the final quarter of 2016 to $3.58 per square foot.
Office market fundamentals in the San Gabriel Valley, had been stronger than the county as a whole up to 2016, however they have suffered a much worse increase in vacancy over the past two years. From a low of 10.8% at the end of 2015, the vacancy rate spiked sharply to a high of 16.7% mid 2017 before settling back to 14.8%. The countywide office vacancy rate at the end of 2017 was 15.1%. Class A asking rents in the San Gabriel Valley decreased from $2.40 per square foot in the final quarter of 2016 to $2.36 per square foot during the fourth quarter of 2017, a decrease of 1.7%.
With lower at the beginning of the year, leasing activity declined to 642,244 square feet in 2017, 13.6% lower than the 743,272 square feet leased in 2016. Although leasing activity was down, fewer move-outs meant 177,049 square feet of office space was absorbed last year, not so far from the than the 205,640 square feet absorbed in 2016.
Moreover, due lower prices per square foot and a greater supply in vacant space, corresponding market demand should precipitate an increase in office leasing activity in the short term.
Nonresidential construction experienced a relatively strong year of growth. The value of total nonresidential construction permits in the San Gabriel Valley rose slightly to $552.9 million in 2017, maintaining the steady construction of the past few years.
Prior to the recession (1990 to 2007) the
annual average was $400.2 million. Most of the new construction permits appear to be for alterations to existing structures, but strong demand for state-of-the-art warehouse and distribution facilities is prompting new development. Stronger employment growth and the lack of new construction over the last several years will help drive the region’s eventual office market recovery. The outlook for
3 INDUSTRIES OF SVG

industrial space is more positive, but ongoing improvements will depend on expanding trade, e-commerce and manufacturing activity.
The retail sector occupies a prominent place in the economy at both the national and local levels. Because such a large portion of U.S. economic activity depends on consumer spending, sales of retail goods and services is an important economic indicator. Retailers also generate a large number of jobs that provide employment for individuals across a wide range of skill and income levels. Additionally, retail sales and use taxes are an important source of local government revenues.
Retailers have reason to be feeling more optimistic. Right now, the American consumer is doing most of the heavy
lifting when it comes to economic growth. In 2017, total U.S. retail sales were up by 4.4% compared with 2016. The best performing sectors were restaurants and bars, automobiles, and e-commerce. Total personal consumption expenditures increased by 4.5% over 2016 and expectations are for additional gains in 2018 and 2019 with Southern California tracking the national trend.
Measured by job counts, the retail sector was the San Gabriel Valley’s fourth largest industry in 2017, employing over 76,717 workers. The San Gabriel Valley has a marginally higher concentration of retail workers than the county as a whole – about 11.1% of wage and salary jobs versus 10.6% for all of Los Angeles County. At the same time, the average annual wage of retail trade workers in the San Gabriel Valley was $31,488 in 2016 (the latest year for which actual annual data are available), 9.7% lower than the county average of $34,554.
The retail sector in the San Gabriel Valley has improved steadily since 2009 when taxable sales fell to their lowest point in the current economic cycle. While a handful of cities in the valley surpassed their prerecession taxable sales peak in 2016 (most current annual data available), It is estimated that about two thirds of the San Gabriel Valley’s incorporated cities reached new peak levels in 2017. Overall, 2017 estimates of total taxable sales, at $22.6 billion, are above the previous pre-recession peak set in 2007. In 2018, taxable sales in the San Gabriel Valley are forecast to reach $22.9 billion, and $23.1 billion in 2019.
The share of taxable sales in the valley relative to the county as a whole has been on a declining trend. In 2002 (when the LAEDC began tracking this data), the share was 17.5%. In 2016 (latest for which actual annual data is available), the region accounted for 15.0% of total
taxable sales in Los Angeles County. At the same time the share of population has declined more moderately, from 15.5% to 15.0% over the same period.
Tourism and hospitality is one of Southern California’s largest, most visible and valuable industry sectors, employing thousands of people and generating billions of dollars in economic activity. While a significant part of leisure and hospitality activity is associated with tourism, many of these jobs serve the local population more so than the region’s tourists and business travelers. Jobs in this industry include lodging, food services, the performing arts, museums, amusement parks and gambling establishments.
Employment in leisure and hospitality industries is expected to reach 78,764 in 2017, making it the third largest industry supersector in the San Gabriel Valley. There are a large number of low wage occupations in these industries, such as food preparation and servers, which pulls the average annual wage in the supersector below the San Gabriel Valley average. The average annual wage for leisure and hospitality industries in San Gabriel Valley in 2017 is $21,685, less than half the average annual wage in San Gabriel Valley across all industries ($52,597). It is helpful to note that many of these jobs are also part time, and annual earnings are based on less than full time work.
The San Gabriel Valley has a similar concentration of leisure and hospitality workers to the county as a whole – about 11.4% of wage and salary jobs versus 11.0% for all of Los Angeles County.
Driving domestic demand for travel-related goods and services last year
3 INDUSTRIES OF SVG
Retail Trade Tourism and Hospitality

33ECONOMIC FORECAST SUMMIT
Together We’re Generating More Than ElectricitySouthern California Edison is proud to support the
San Gabriel Valley Economic Partnership
Econonic Forecast Summit

were gains in the U.S. labor markets and stronger personal income growth, both of which point to an increase in consumer spending. In spite of a weak global economy, international visitation is expected to remain strong in 2016.
In 2017, Los Angeles County hosted a record 48.3 million visitors (day and overnight), an increase of 2.2% over the previous year and the seventh consecutive year in which Los Angeles County achieved record breaking visitor volume. In 2017, visitation is expected to come in at just over 49.2 million.
International visitation is especially strong in Los Angeles County. In 2017, 7.1 million international visitors arrived in Los Angeles, nearly 15% of total visitation, and a 0.9% uptick over 2014. To put this in context, for California overall, international visitors comprise only 6.5% of total state visitation. While Mexico sent the largest number of international visitors, China (excluding Hong Kong) was Los Angeles County’s number one overseas market, up to over 1.7 million visitors. China is also the region’s fastest-growing market, with consistent double digit year-over-year growth in recent years. Rounding out the top five international visitor markets for Los Angeles County were: Canada, Australia and the United Kingdom.
The Los Angeles Tourism and Convention Board reports that business and leisure travelers spent $21.9 billion in 2016 (latest available data) while visiting Los Angeles, up 6.3% from 2015 and a new record high. Of this, U.S. origin visitors spent $15.0 billion or 68% of the total, while international visitors spent $6.9 billion. This was more than double the corresponding 15% international share of visitor volume,
showing the importance of international visitors to the market.
The San Gabriel Valley attracts a large number of these visitors. Chinese tourists in particular are drawn to the region due to the large ethnic Chinese population that has settled in the valley since the 1970s. The average Chinese visitor to California spends on average $1,550 per trip. This benefits every corner of the San Gabriel Valley’s tourism industry.
The lodging market in the valley is supported by strong fundamentals. The region houses world-renowned cultural attractions, a wide range of entertainment options and a number of large and influential corporations. Transient-occupancy taxes are also a significant revenue source for local governments.
The metrics used to measure the health of the lodging market indicate a healthy and expanding industry, continuing to achieve record high levels in occupancy rates and daily room rates. The average hotel occupancy rate for the San Gabriel Valley in 2017 was an estimated 77.4%, which was down from 80.1% in 2016. The average daily room rate increased to $164.65 from $158.80 in 2016, part of a continued strengthening of the market following a post-recession bottom of $118.54. The most critical measure to hoteliers is revenue per available room (RevPAR). In 2017, this was a record high estimated $127.45.
Looking ahead, the San Gabriel Valley lodging sector will continue to benefit from stronger corporate spending, personal income growth and international visitation. Rising demand, together a lack of new hotel
construction, have helped improve lodging fundamentals to the point where a number of new hotel properties are finally in development throughout the Los Angeles region. Transient occupancy taxes, an important revenue source for local government, will also correspondingly increase.
3 INDUSTRIES OF SVG
34 ECONOMIC FORECAST SUMMIT
FULL REPORT:
OUR THANKS:
Accommodation
The LAEDC report in its entirety will be available following the 2018 SGV
Economic Forecast Summit at:
The San Gabriel Valley Economic Partnership and College of Business
Administration would like to thank:Bank of America
Metlife - SGV Corporate CampusSan Gabriel Basin Water Quality Authority
Sanitation Districts of LA CountyThree Valleys MWD
City of IndustrySan Gabriel Valley Newspaper GroupUpper SGV Municipal Water District
SoCalGasMajestic Realty
Methodist HospitalSo.Cal EdisonHahn & Hahn
K-12 Foothill ConsortiumiDream Space
Foothill Workforce
cba.cpp.edu

Bank of America Merrill Lynch” is the marketing name for the global banking and global markets businesses of Bank of America Corporation. Lending, derivatives, and other commercial banking activities are performed globally by banking affiliates of Bank of America Corporation, including Bank of America, N.A., Member FDIC. Securities, strategic advisory, and other investment banking activities are performed globally by investment banking affiliates of Bank of America Corporation (”Investment Banking Affiliates”), including, in the United States, Merrill Lynch, Pierce, Fenner & Smith Incorporated and Merrill Lynch Professional Clearing Corp., both of which are registered broker-dealers and Members of SIPC, and, in other jurisdictions, by locally registered entities. Merrill Lynch, Pierce, Fenner & Smith, Incorporated and Merrill Lynch Professional Clearing Corp. are registered as futures commission merchants with the CFTC and are members of the NFA. Investment products offered by Investment Banking Affiliates: Are Not FDIC Insured • May Lose Value • Are Not Bank Guaranteed. ©2017 Bank of America Corporation. GCB-156-AD ARTKWCKC
“
Contact Alex Eng at [email protected]
bofaml.com/businessbanking
Helping your business grow here and anywhere.ur business grow here and anywhere.

Global & National Forecast
ChrisAinsworthU.S. Trust
State,County &
Forecast
SomjitaMitra, Ph.D.LAEDC
FeaturedSpeakerMichaelWooCal Poly Pomona
FeaturedSpeakerJudithIbarra-
Tetra Tech
Breakout SessionsCalifornia’s Housing Crunchpresented by Dr. Gerd Welke,Cal Poly Pomona’s Real Estate ResearchCouncil & Dr. Oscar Wei, CaliforniaAssociation of Realtors, C.A.R.
The Future of Workpresented by Dr. Bill Scroggins, President, Mt. San Antonio College
Bianchetta
The SGV