Embed Size (px)
Citation preview

Economic contribution
of the New Zealand
music industry 2014
A report for the New Zealand music industry
Estimating the direct
and indirect economic
impacts of the New
Zealand music industry
October 2015
PricewaterhouseCoopers New Zealand, 188 Quay Street, Private Bag 92162, Auckland 1142, New Zealand T +64 9 355 8000 F +64 9 355 8024 www.pwc.com/nz
Damian Vaughan
Recorded Music New Zealand
Private Bag 78 850
Grey Lynn
Auckland 1245
27 October 2015
Dear Damian
Economic contribution of the New Zealand music industry
In accordance with our terms of engagement dated 15 June 2015, we are pleased to attach our
report on the economic contribution of the New Zealand music industry.
This report should be read in conjunction with the Restrictions in Appendix B.
If you require any clarification or further information, please feel free to contact either one of us.
Yours sincerely
Craig Rice Gareth Stiven
Partner Director
T: (09) 355 8641 T: (09) 355 8608
M: 021 624 462 M: 027 490 3445
1. Executive summary .......................................................................................................................... 4
2. Introduction ...................................................................................................................................... 6
Purpose and scope of this report .................................................................................................... 6
Defining the music industry ............................................................................................................ 7
3. Economic impact of the New Zealand music industry .................................................................. 11
The industry as a whole .................................................................................................................. 11
Music retail ..................................................................................................................................... 13
Communication and public performance .................................................................................... 16
Music radio broadcasting ............................................................................................................. 18
Live performance subsector .......................................................................................................... 20
Synchronisation subsector ............................................................................................................ 22
4. Overseas Earnings .......................................................................................................................... 23
5. Glossary ........................................................................................................................................... 24
Appendix A: Approach and methodology ............................................................................................. 26
Measures of economic impact ....................................................................................................... 26
Data sources ................................................................................................................................... 28
Multiplier analysis ......................................................................................................................... 28
Approaches followed for individual subsectors ........................................................................... 30
Appendix B: Restrictions........................................................................................................................ 34
Table of contents
1. Executive summary
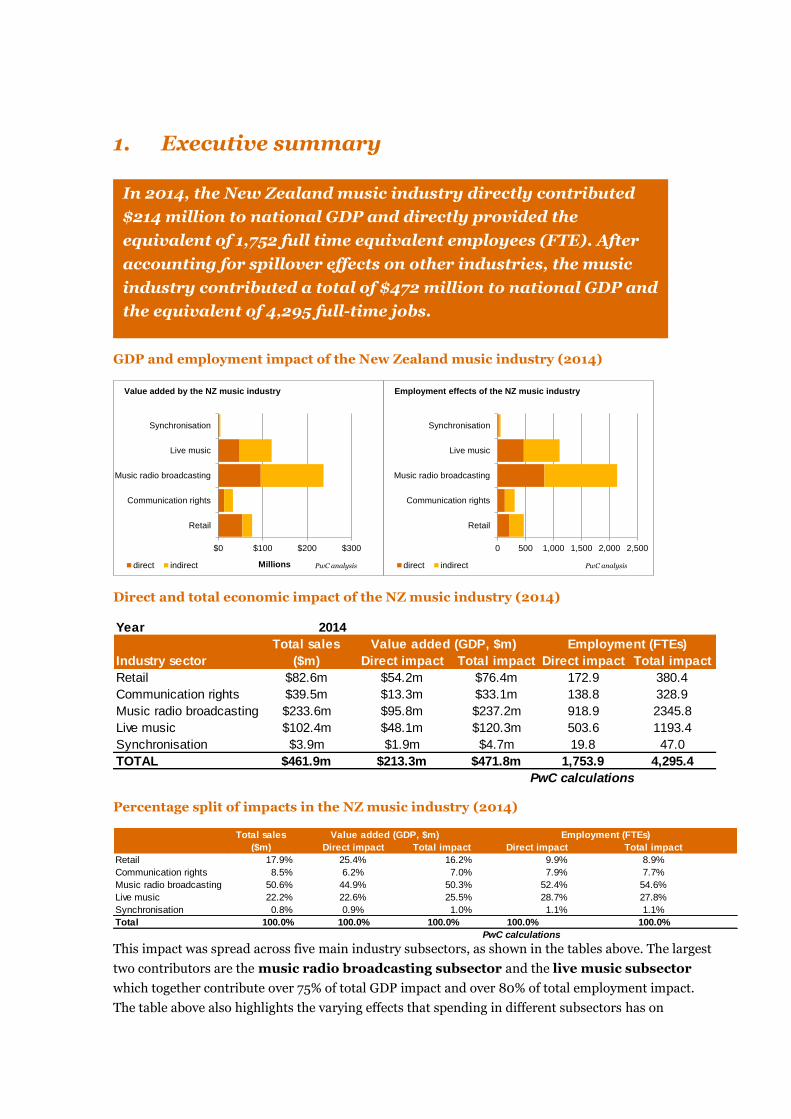
GDP and employment impact of the New Zealand music industry (2014)
Direct and total economic impact of the NZ music industry (2014)
Percentage split of impacts in the NZ music industry (2014)
This impact was spread across five main industry subsectors, as shown in the tables above. The largest
two contributors are the music radio broadcasting subsector and the live music subsector
which together contribute over 75% of total GDP impact and over 80% of total employment impact.
The table above also highlights the varying effects that spending in different subsectors has on
$0 $100 $200 $300
Retail
Communication rights
Music radio broadcasting
Live music
Synchronisation
Millions
Value added by the NZ music industry
direct indirect PwC analysis
0 500 1,000 1,500 2,000 2,500
Retail
Communication rights
Music radio broadcasting
Live music
Synchronisation
Employment effects of the NZ music industry
direct indirect PwC analysis
Year 2014
Industry sector Direct impact Total impact Direct impact Total impact
Retail $82.6m $54.2m $76.4m 172.9 380.4
Communication rights $39.5m $13.3m $33.1m 138.8 328.9
Music radio broadcasting $233.6m $95.8m $237.2m 918.9 2345.8
Live music $102.4m $48.1m $120.3m 503.6 1193.4
Synchronisation $3.9m $1.9m $4.7m 19.8 47.0
TOTAL $461.9m $213.3m $471.8m 1,753.9 4,295.4
PwC calculations
Total sales
($m)
Employment (FTEs)Value added (GDP, $m)
Direct impact Total impact Direct impact Total impact
Retail 17.9% 25.4% 16.2% 9.9% 8.9%
Communication rights 8.5% 6.2% 7.0% 7.9% 7.7%
Music radio broadcasting 50.6% 44.9% 50.3% 52.4% 54.6%
Live music 22.2% 22.6% 25.5% 28.7% 27.8%
Synchronisation 0.8% 0.9% 1.0% 1.1% 1.1%
Total 100.0% 100.0% 100.0% 100.0% 100.0%
PwC calculations
Value added (GDP, $m) Employment (FTEs)Total sales
($m)
In 2014, the New Zealand music industry directly contributed
$214 million to national GDP and directly provided the
equivalent of 1,752 full time equivalent employees (FTE). After
accounting for spillover effects on other industries, the music
industry contributed a total of $472 million to national GDP and
the equivalent of 4,295 full-time jobs.
5
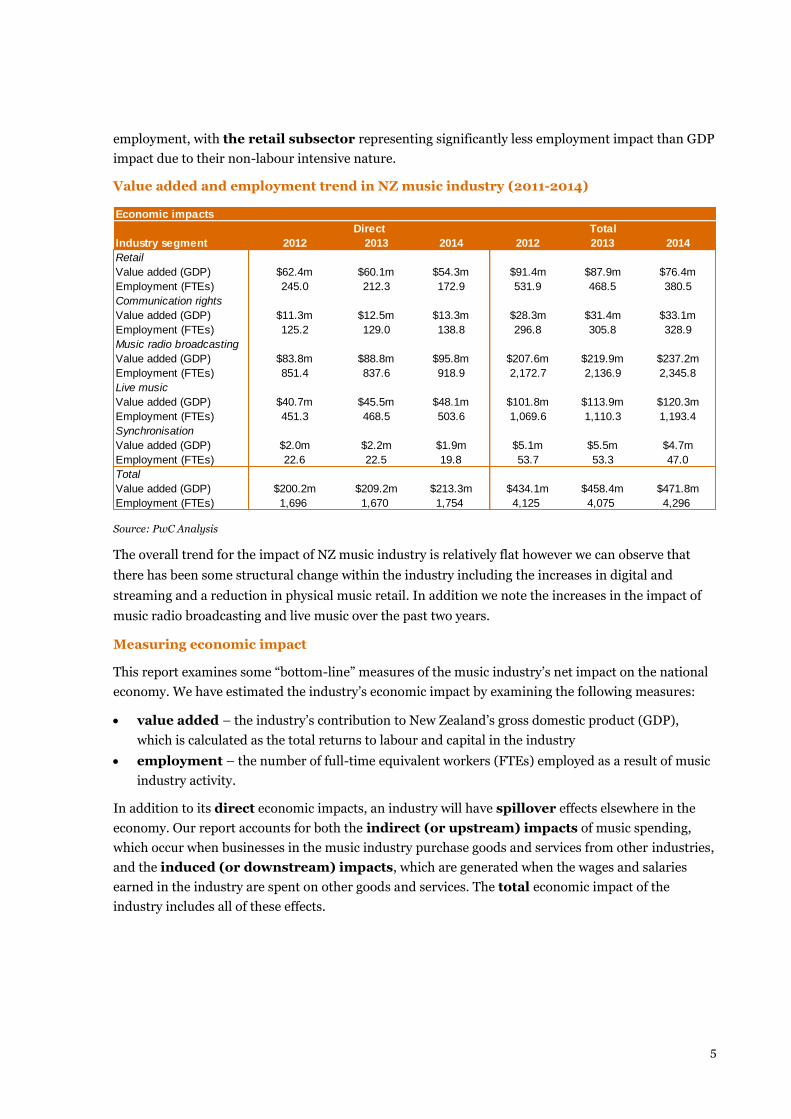
employment, with the retail subsector representing significantly less employment impact than GDP
impact due to their non-labour intensive nature.
Value added and employment trend in NZ music industry (2011-2014)
Source: PwC Analysis
The overall trend for the impact of NZ music industry is relatively flat however we can observe that
there has been some structural change within the industry including the increases in digital and
streaming and a reduction in physical music retail. In addition we note the increases in the impact of
music radio broadcasting and live music over the past two years.
Measuring economic impact
This report examines some “bottom-line” measures of the music industry’s net impact on the national
economy. We have estimated the industry’s economic impact by examining the following measures:
value added – the industry’s contribution to New Zealand’s gross domestic product (GDP),
which is calculated as the total returns to labour and capital in the industry
employment – the number of full-time equivalent workers (FTEs) employed as a result of music
industry activity.
In addition to its direct economic impacts, an industry will have spillover effects elsewhere in the
economy. Our report accounts for both the indirect (or upstream) impacts of music spending,
which occur when businesses in the music industry purchase goods and services from other industries,
and the induced (or downstream) impacts, which are generated when the wages and salaries
earned in the industry are spent on other goods and services. The total economic impact of the
industry includes all of these effects.
Economic impacts
Industry segment 2012 2013 2014 2012 2013 2014
Retail
Value added (GDP) $62.4m $60.1m $54.3m $91.4m $87.9m $76.4m
Employment (FTEs) 245.0 212.3 172.9 531.9 468.5 380.5
Communication rights
Value added (GDP) $11.3m $12.5m $13.3m $28.3m $31.4m $33.1m
Employment (FTEs) 125.2 129.0 138.8 296.8 305.8 328.9
Music radio broadcasting
Value added (GDP) $83.8m $88.8m $95.8m $207.6m $219.9m $237.2m
Employment (FTEs) 851.4 837.6 918.9 2,172.7 2,136.9 2,345.8
Live music
Value added (GDP) $40.7m $45.5m $48.1m $101.8m $113.9m $120.3m
Employment (FTEs) 451.3 468.5 503.6 1,069.6 1,110.3 1,193.4
Synchronisation
Value added (GDP) $2.0m $2.2m $1.9m $5.1m $5.5m $4.7m
Employment (FTEs) 22.6 22.5 19.8 53.7 53.3 47.0
Total
Value added (GDP) $200.2m $209.2m $213.3m $434.1m $458.4m $471.8m
Employment (FTEs) 1,696 1,670 1,754 4,125 4,075 4,296
TotalDirect
6
2. Introduction
The purpose of this study is to estimate the contribution of the music industry to the New Zealand
economy. It provides a snapshot of the industry using data for the 2014 calendar year.
In addition the report provides some broad insight on the trends occurring in New Zealand’s music
industry that are affecting the impact of the industry on New Zealand’s economy.
This report has been commissioned by Recorded Music New Zealand supported with funding from its
project partners, the Australasian Performing Right Association/Australasian Mechanical Copyright
Owners Society (APRA|AMCOS), New Zealand Music Commission, NZ On Air Te Mangai Paho and
Creative New Zealand in order to better understand the economic role of the New Zealand music
industry. It should be read in conjunction with the Restrictions in Appendix B.
Purpose and scope of this report
This report examines some “bottom-line” measures of the music industry’s impact on the
national economy. In this respect, it differs from other analyses that focus on the total revenue
earned by the industry (eg sales of recorded music or royalties related to communication rights),
a “top-line” measure that does not account for factors such as intermediate inputs purchased
from other industries or imported from overseas.
By estimating bottom-line measures, this report enables comparisons between the music
industry, other industries, and the economy as a whole. It is intended to provide industry
participants and policymakers with a robust basis for understanding the importance of the
industry to the New Zealand economy.
We have estimated three measures of the New Zealand music industry’s economic contribution:
gross output – the total sales of all music industry participants, provided by industry
bodies
value added – the industry’s contribution to New Zealand’s GDP, which is calculated as
the total returns to labour and capital in the industry
employment – the number of full-time equivalent workers (FTEs) employed as a result of
music industry activity.
In addition to its direct economic impacts, an industry will have spillover effects elsewhere in
the economy. In order to do business, firms must purchase inputs from other industries, while
the wages and salaries that they pay will subsequently be spent elsewhere in the economy. These
effects fall into two categories:
Indirect (or upstream) impacts occur when businesses in the music industry purchase
goods and services from other industries in order to record and produce a song, market an
album, or put on a concert.
Induced (or downstream) impacts are generated when the wages and salaries paid out
by the music industry are spent on goods and services, thereby stimulating further economic
activity.
7
The total economic impact of the industry is equal to the sum of its direct, indirect, and
induced impacts. In order to estimate the direct and total economic impacts of the New Zealand
music industry, we have used multiplier analysis based on national input-output tables1. We
have described our application of multiplier analysis in Appendix A: Approach and
methodology.
Although this report focuses on estimating the contribution of the New Zealand music industry to
employment and GDP, we emphasise that the industry has a broader cultural and social role to play.
Music contributes to New Zealand in a number of other ways that are not measured in GDP. The
enjoyment, or utility, that New Zealanders derive from consuming and producing music is likely to be
considerable but is not easily quantified. We have not included these effects as they are not easily
quantifiable.
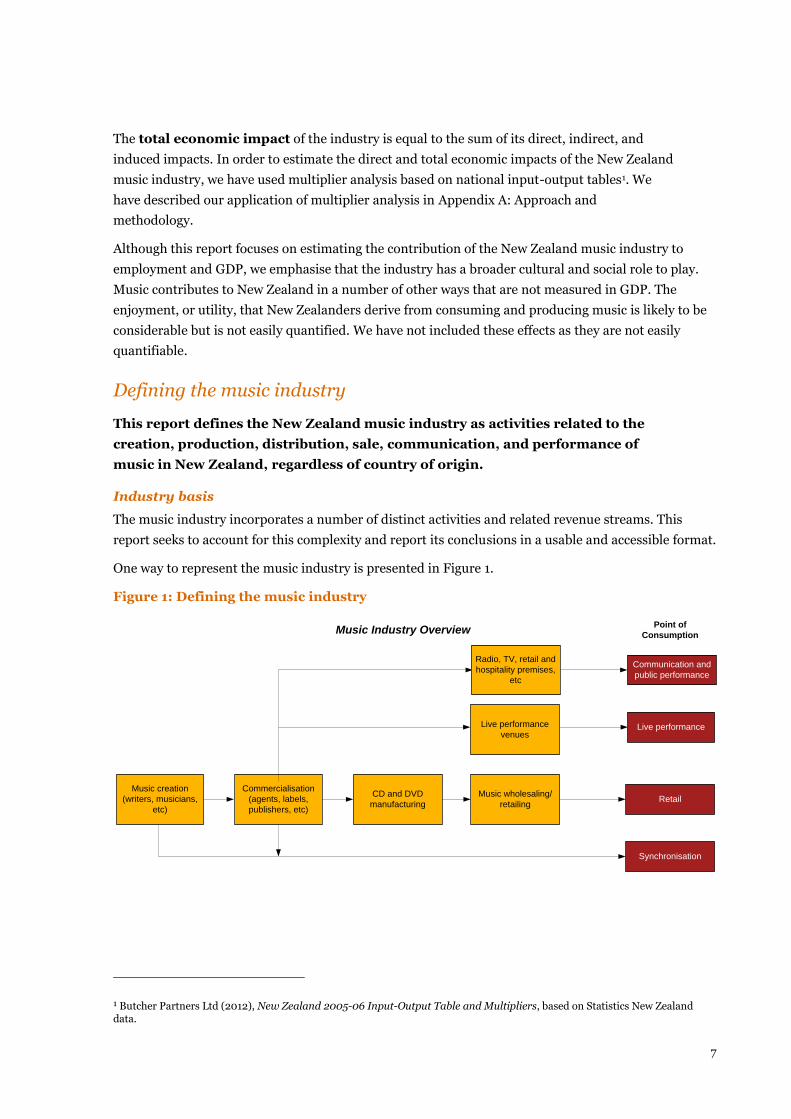
Defining the music industry
This report defines the New Zealand music industry as activities related to the
creation, production, distribution, sale, communication, and performance of
music in New Zealand, regardless of country of origin.
Industry basis
The music industry incorporates a number of distinct activities and related revenue streams. This
report seeks to account for this complexity and report its conclusions in a usable and accessible format.
One way to represent the music industry is presented in Figure 1.
Figure 1: Defining the music industry
1 Butcher Partners Ltd (2012), New Zealand 2005-06 Input-Output Table and Multipliers, based on Statistics New Zealand data.
Music creation
(writers, musicians,
etc)
Commercialisation
(agents, labels,
publishers, etc)
CD and DVD
manufacturing
Music wholesaling/
retailingRetail
Synchronisation
Communication and
public performance
Live performance
Point of
ConsumptionMusic Industry Overview
Live performance
venues
Radio, TV, retail and
hospitality premises,
etc
8
This study examines the five main revenue streams accruing to the industry. These include both sales
revenue and royalty payments for the use of music2:
Physical and digital retail sales of music, including traditional store-based retailing, online
stores, and the recently introduced payments received for access to music via on-demand
streaming services. We refer to this subsector as retail.
Revenue from communication of music played on radio, television, and the internet, and for
the public performance of music in premises such as but not limited to retailers, hospitality
outlets (bars and cafes), educational institutions, and gyms. We refer to this subsector as
communication and public performance. Given the size of the radio component of
communication and public performance we have included that component separately in our
reported tables.
Live performances of music, whether in concerts, festivals, or music venues. We refer to this
subsector as live performance.
Royalties earned from licensing music for use in advertisements, games, films, and television
programmes. We refer to this subsector as synchronisation.
These revenue streams are all associated with the consumption of music in different forms or
through different channels. But before music can be brought to the consumer, it must be
created, commercialised, manufactured, and distributed. Some of these activities are considered
to be part of the core music industry, while others are defined as intermediate inputs purchased
from other industries.
We also consider the following upstream activities to be part of the music industry:
Music creation, including songwriters, musicians, recording studios, etc.
The activities of record companies and music publishing companies, including the recording
and commercialisation of music
The manufacture of physical carriers of music (eg CDs, DVDs) and the aggregation of digital
music files for retail
Venue operation for live performances.
Our definition of the core music industry excludes some peripherally-related industries, such as
instrument manufacture and retailing as well as music teaching. Where activities in these industries
support the production or consumption of music in New Zealand, we are likely to capture the effects in
our estimates of spillover effects.
Music expenditures also have an economic impact on other industries. As we have described above,
businesses in the music industry must purchase inputs from other industries, while the wages and
salaries that they pay will subsequently be spent elsewhere in the economy. Consequently, the total
impact of the music industry will include:
2 There are two royalty streams associated with the commercial exploitation of music. One represents songwriter royalties, stemming from the actual writing of the song. These rights are administered by music publishers and songwriters’ collecting societies (eg APRA|AMCOS). The second stream relates to sound recordings. These rights are administered by record companies and record company collecting societies (eg Recorded Music NZ). Through this report we use data provided by APRA|AMCOS and Recorded Music NZ.
9
Purchases of intermediate inputs from sectors that are not directly linked to music, such as
advertising and marketing, transport services, plastics manufacturing (such as for CDs),
accounting and legal services, sound and lighting, and equipment hire
Additional consumer spending in other industries, such as food and beverage retailing,
housing, and recreation, resulting from employment within the music industry and supplier
industries.
Geographic location
This report aims to account for all economic impacts that take place in New Zealand. In order to
do so, we have adopted an approach that is consistent with the GDP national accounts statistics
produced by Statistics New Zealand and overseas statistics bureaus. As we discuss in more
depth in Appendix A: Approach and methodology, this approach measures the total value of
goods and services produced in New Zealand, rather than the net income of all businesses
and individuals located within New Zealand.
In other words, we account for the domestic consumption of music of any origin from New Zealand-
based channels. For instance, our measures of economic impact will:
Include activities related to the physical sale of overseas-originated music to a consumer in
New Zealand, but exclude the (relatively minor) cost of importing the physical product.
Include income earned by overseas musicians touring in New Zealand, as it was earned in New
Zealand regardless of whether it is ultimately repatriated elsewhere.
Exclude payments paid to New Zealand recording artists and songwriters from overseas
sources, as they are difficult to quantify due to lack of comprehensive data. While excluded
from our calculations, we have separately estimated these payments for completeness.
We have chosen to use a GDP measure, rather than a different measure that accounts for such
inclusions and exclusions, for two reasons. First, GDP impact is the most commonly used measure
of total economic impact. It is used by Statistics New Zealand when reporting on the size of the New
Zealand economy and in many other economic impact studies. Second, while some data on overseas
touring revenues and public performance and communication royalties by APRA songwriters earned
from overseas does exist, it is not considered comprehensive enough to base robust quantitative
analysis of total revenue on.
Treatment of the economic effects of illegal music use
The illegal use of music is beyond the scope of this report. Discussions with industry stakeholders have
indicated that it is a significant challenge facing the industry. It has had a significant economic effect,
depressing physical music sales and catalysing rapid growth in legal options for the digital sale and
access of recorded music.
This report is intended to provide a snapshot of the industry’s actual economic impact at a point in
time and as a result does not discuss revenue foregone due to the illegal use of music. However, a
natural extension of this work would be to estimate the net economic losses to the music industry as a
result of illegal use. This could be based on an analysis of trends in sales volumes pre- and post-illegal
use of music. In order to do so, it would be necessary to specify a robust counterfactual scenario for
sales volume growth in the absence of the illegal use of music.

10
Furthermore, it may also be necessary to consider the extent to which the illegal use of music
represents an economic loss and the extent to which it reflects a redistribution of surplus from music
producers to music consumers (and potentially an associated reallocation of consumer expenditures
from music to other cultural goods).
11
3. Economic impact of the New Zealand music industry
This section summarises the total direct and indirect economic impact of the New Zealand music
industry. It estimates the industry’s overall contribution to New Zealand’s GDP and employment and
allocates economic impacts between the five main subsectors of the industry: retail, communication
and public performance, music radio broadcasting, live performance, and synchronisation.
The industry as a whole
Table 1 summarises estimates of the overall economic impact of the music industry.
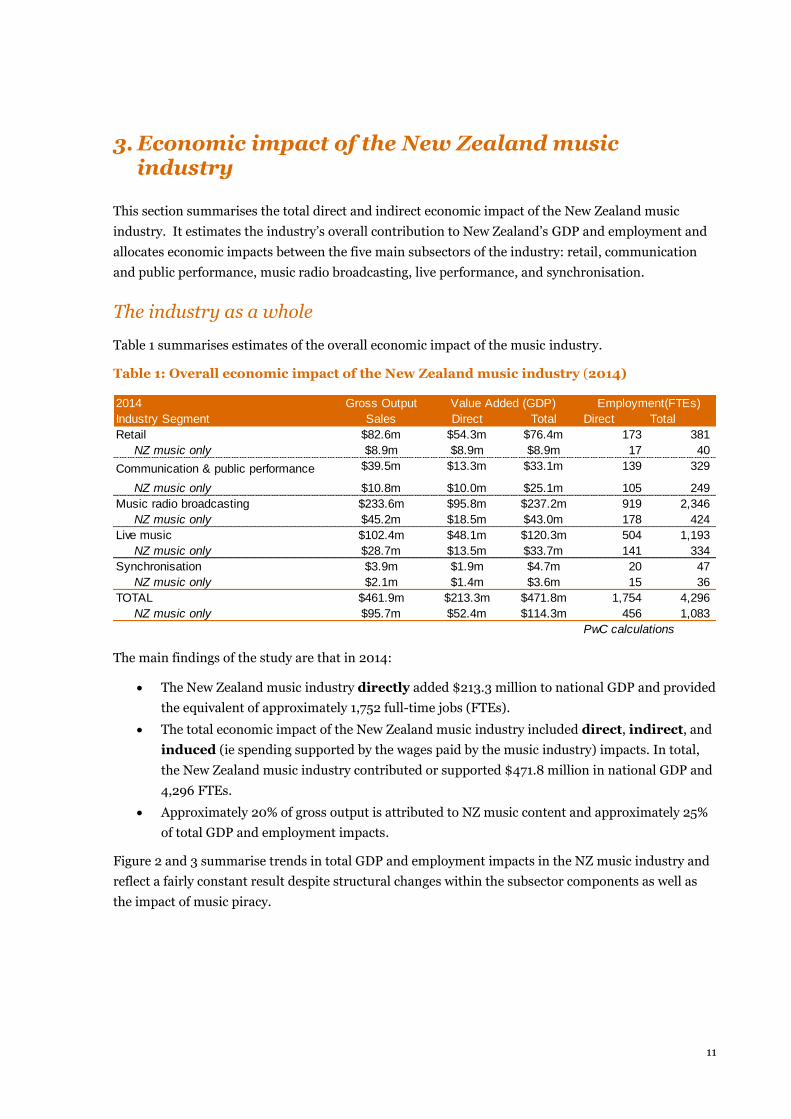
Table 1: Overall economic impact of the New Zealand music industry (2014)
The main findings of the study are that in 2014:
The New Zealand music industry directly added $213.3 million to national GDP and provided
the equivalent of approximately 1,752 full-time jobs (FTEs).
The total economic impact of the New Zealand music industry included direct, indirect, and
induced (ie spending supported by the wages paid by the music industry) impacts. In total,
the New Zealand music industry contributed or supported $471.8 million in national GDP and
4,296 FTEs.
Approximately 20% of gross output is attributed to NZ music content and approximately 25%
of total GDP and employment impacts.
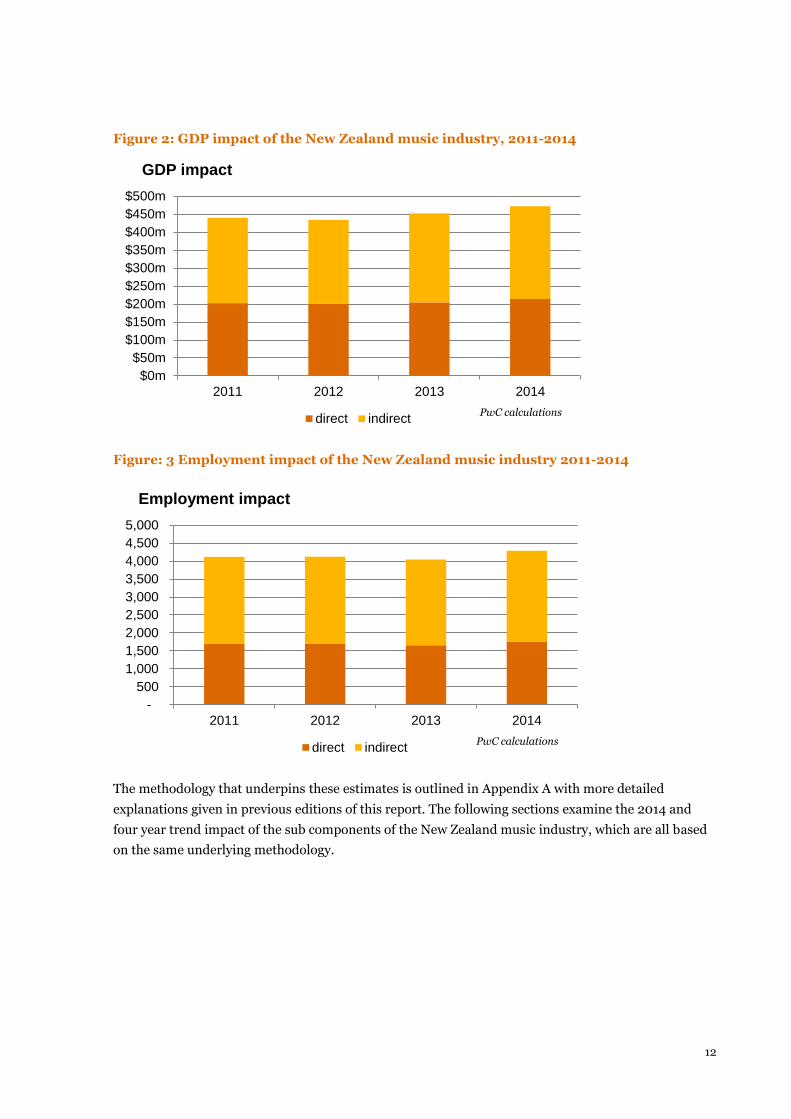
Figure 2 and 3 summarise trends in total GDP and employment impacts in the NZ music industry and
reflect a fairly constant result despite structural changes within the subsector components as well as
the impact of music piracy.
2014 Gross Output
Industry Segment Sales Direct Total Direct Total
Retail $82.6m $54.3m $76.4m 173 381
NZ music only $8.9m $8.9m $8.9m 17 40
Communication & public performance $39.5m $13.3m $33.1m 139 329
NZ music only $10.8m $10.0m $25.1m 105 249
Music radio broadcasting $233.6m $95.8m $237.2m 919 2,346
NZ music only $45.2m $18.5m $43.0m 178 424
Live music $102.4m $48.1m $120.3m 504 1,193
NZ music only $28.7m $13.5m $33.7m 141 334
Synchronisation $3.9m $1.9m $4.7m 20 47
NZ music only $2.1m $1.4m $3.6m 15 36
TOTAL $461.9m $213.3m $471.8m 1,754 4,296
NZ music only $95.7m $52.4m $114.3m 456 1,083
PwC calculations
Value Added (GDP) Employment(FTEs)
12
Figure 2: GDP impact of the New Zealand music industry, 2011-2014
Figure: 3 Employment impact of the New Zealand music industry 2011-2014
The methodology that underpins these estimates is outlined in Appendix A with more detailed
explanations given in previous editions of this report. The following sections examine the 2014 and
four year trend impact of the sub components of the New Zealand music industry, which are all based
on the same underlying methodology.
$0m
$50m
$100m
$150m
$200m
$250m
$300m
$350m
$400m
$450m
$500m
2011 2012 2013 2014
GDP impact
direct indirectPwC calculations
-
500
1,000
1,500
2,000
2,500
3,000
3,500
4,000
4,500
5,000
2011 2012 2013 2014
Employment impact
direct indirectPwC calculations
13
Music retail
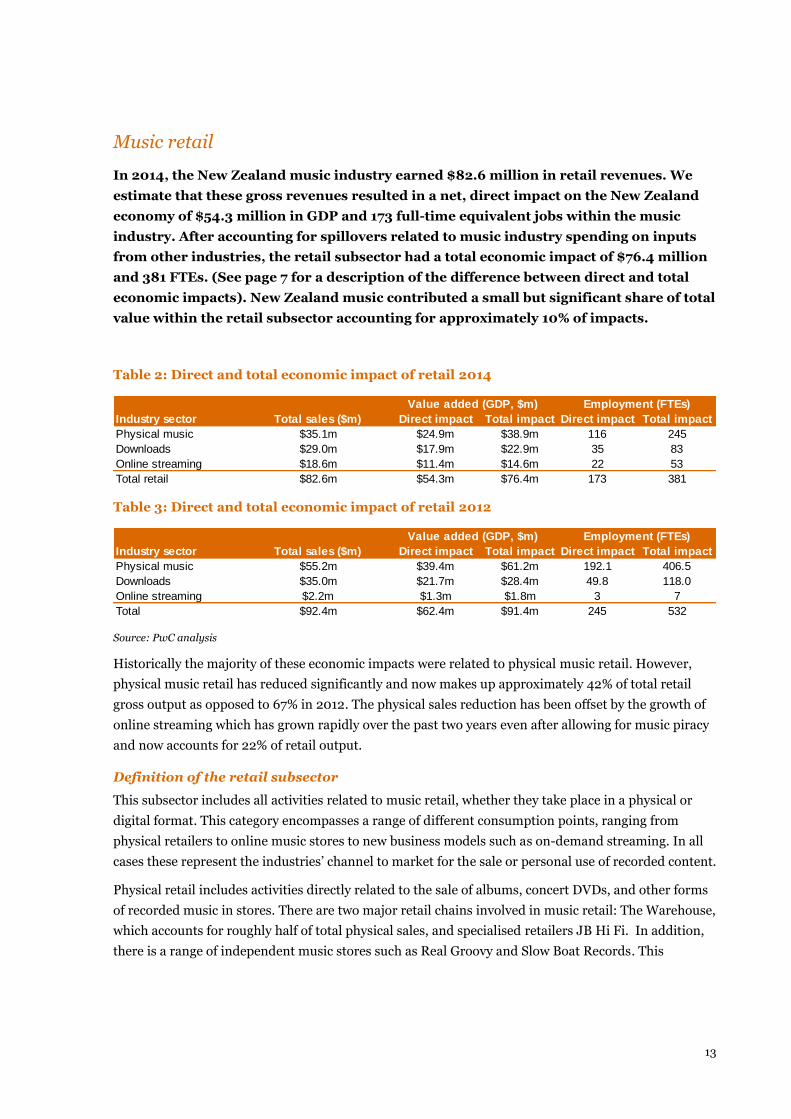
In 2014, the New Zealand music industry earned $82.6 million in retail revenues. We
estimate that these gross revenues resulted in a net, direct impact on the New Zealand
economy of $54.3 million in GDP and 173 full-time equivalent jobs within the music
industry. After accounting for spillovers related to music industry spending on inputs
from other industries, the retail subsector had a total economic impact of $76.4 million
and 381 FTEs. (See page 7 for a description of the difference between direct and total
economic impacts). New Zealand music contributed a small but significant share of total
value within the retail subsector accounting for approximately 10% of impacts.
Table 2: Direct and total economic impact of retail 2014
Table 3: Direct and total economic impact of retail 2012
Source: PwC analysis
Historically the majority of these economic impacts were related to physical music retail. However,
physical music retail has reduced significantly and now makes up approximately 42% of total retail
gross output as opposed to 67% in 2012. The physical sales reduction has been offset by the growth of
online streaming which has grown rapidly over the past two years even after allowing for music piracy
and now accounts for 22% of retail output.
Definition of the retail subsector
This subsector includes all activities related to music retail, whether they take place in a physical or
digital format. This category encompasses a range of different consumption points, ranging from
physical retailers to online music stores to new business models such as on-demand streaming. In all
cases these represent the industries’ channel to market for the sale or personal use of recorded content.
Physical retail includes activities directly related to the sale of albums, concert DVDs, and other forms
of recorded music in stores. There are two major retail chains involved in music retail: The Warehouse,
which accounts for roughly half of total physical sales, and specialised retailers JB Hi Fi. In addition,
there is a range of independent music stores such as Real Groovy and Slow Boat Records. This
Industry sector Direct impact Total impact Direct impact Total impact
Physical music $35.1m $24.9m $38.9m 116 245
Downloads $29.0m $17.9m $22.9m 35 83
Online streaming $18.6m $11.4m $14.6m 22 53
Total retail $82.6m $54.3m $76.4m 173 381
Total sales ($m)
Employment (FTEs)Value added (GDP, $m)
Industry sector Direct impact Total impact Direct impact Total impact
Physical music $55.2m $39.4m $61.2m 192.1 406.5
Downloads $35.0m $21.7m $28.4m 49.8 118.0
Online streaming $2.2m $1.3m $1.8m 3 7
Total $92.4m $62.4m $91.4m 245 532
Total sales ($m)
Value added (GDP, $m) Employment (FTEs)
14
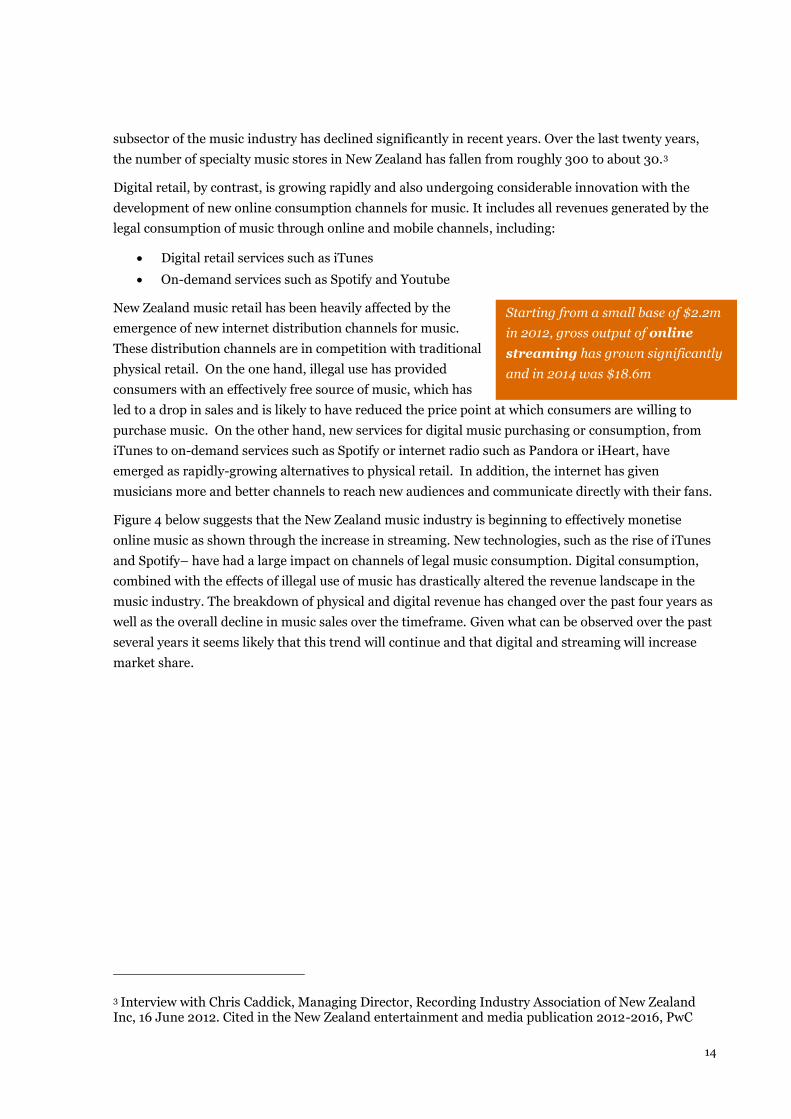
Starting from a small base of $2.2m
in 2012, gross output of online
streaming has grown significantly
and in 2014 was $18.6m
subsector of the music industry has declined significantly in recent years. Over the last twenty years,
the number of specialty music stores in New Zealand has fallen from roughly 300 to about 30.3
Digital retail, by contrast, is growing rapidly and also undergoing considerable innovation with the
development of new online consumption channels for music. It includes all revenues generated by the
legal consumption of music through online and mobile channels, including:
Digital retail services such as iTunes
On-demand services such as Spotify and Youtube
New Zealand music retail has been heavily affected by the
emergence of new internet distribution channels for music.
These distribution channels are in competition with traditional
physical retail. On the one hand, illegal use has provided
consumers with an effectively free source of music, which has
led to a drop in sales and is likely to have reduced the price point at which consumers are willing to
purchase music. On the other hand, new services for digital music purchasing or consumption, from
iTunes to on-demand services such as Spotify or internet radio such as Pandora or iHeart, have
emerged as rapidly-growing alternatives to physical retail. In addition, the internet has given
musicians more and better channels to reach new audiences and communicate directly with their fans.
Figure 4 below suggests that the New Zealand music industry is beginning to effectively monetise
online music as shown through the increase in streaming. New technologies, such as the rise of iTunes
and Spotify– have had a large impact on channels of legal music consumption. Digital consumption,
combined with the effects of illegal use of music has drastically altered the revenue landscape in the
music industry. The breakdown of physical and digital revenue has changed over the past four years as
well as the overall decline in music sales over the timeframe. Given what can be observed over the past
several years it seems likely that this trend will continue and that digital and streaming will increase
market share.
3 Interview with Chris Caddick, Managing Director, Recording Industry Association of New Zealand Inc, 16 June 2012. Cited in the New Zealand entertainment and media publication 2012-2016, PwC
15
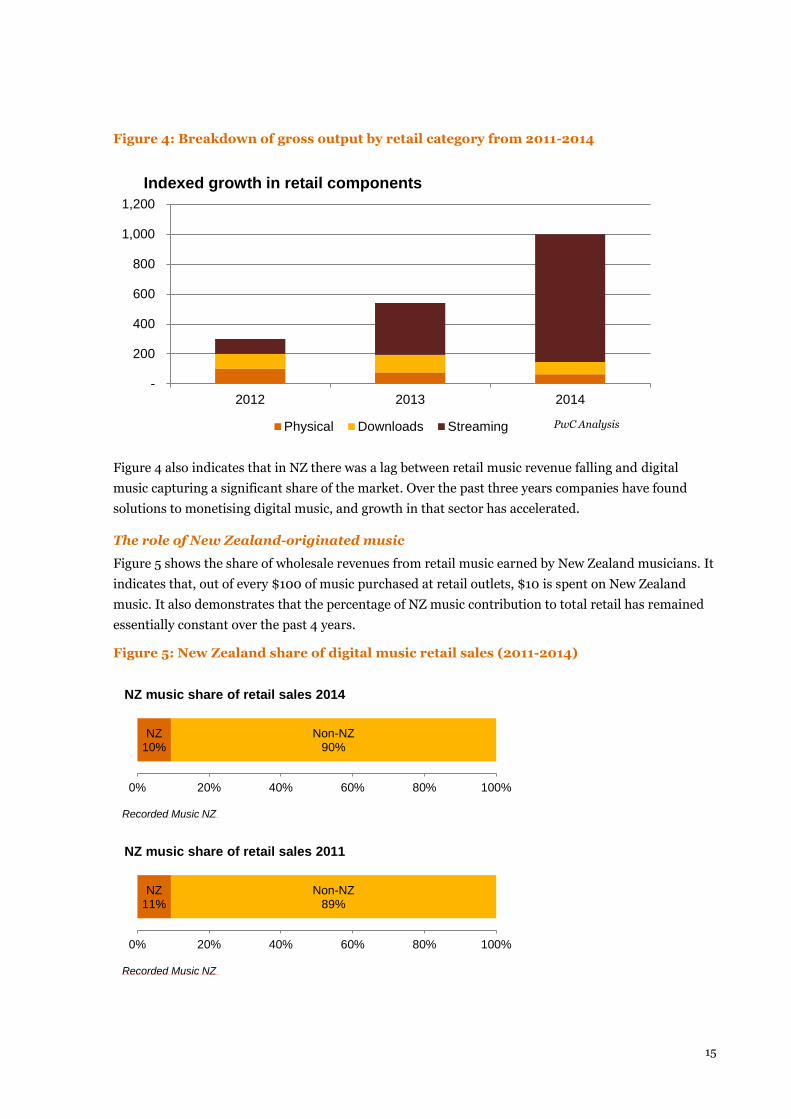
Figure 4: Breakdown of gross output by retail category from 2011-2014
Figure 4 also indicates that in NZ there was a lag between retail music revenue falling and digital
music capturing a significant share of the market. Over the past three years companies have found
solutions to monetising digital music, and growth in that sector has accelerated.
The role of New Zealand-originated music
Figure 5 shows the share of wholesale revenues from retail music earned by New Zealand musicians. It
indicates that, out of every $100 of music purchased at retail outlets, $10 is spent on New Zealand
music. It also demonstrates that the percentage of NZ music contribution to total retail has remained
essentially constant over the past 4 years.
Figure 5: New Zealand share of digital music retail sales (2011-2014)
-
200
400
600
800
1,000
1,200
2012 2013 2014
Indexed growth in retail components
Physical Downloads Streaming PwC Analysis
NZ 10%
Non-NZ 90%
0% 20% 40% 60% 80% 100%
NZ music share of retail sales 2014
Recorded Music NZ
NZ 11%
Non-NZ 89%
0% 20% 40% 60% 80% 100%
NZ music share of retail sales 2011
Recorded Music NZ
16
Communication and public performance
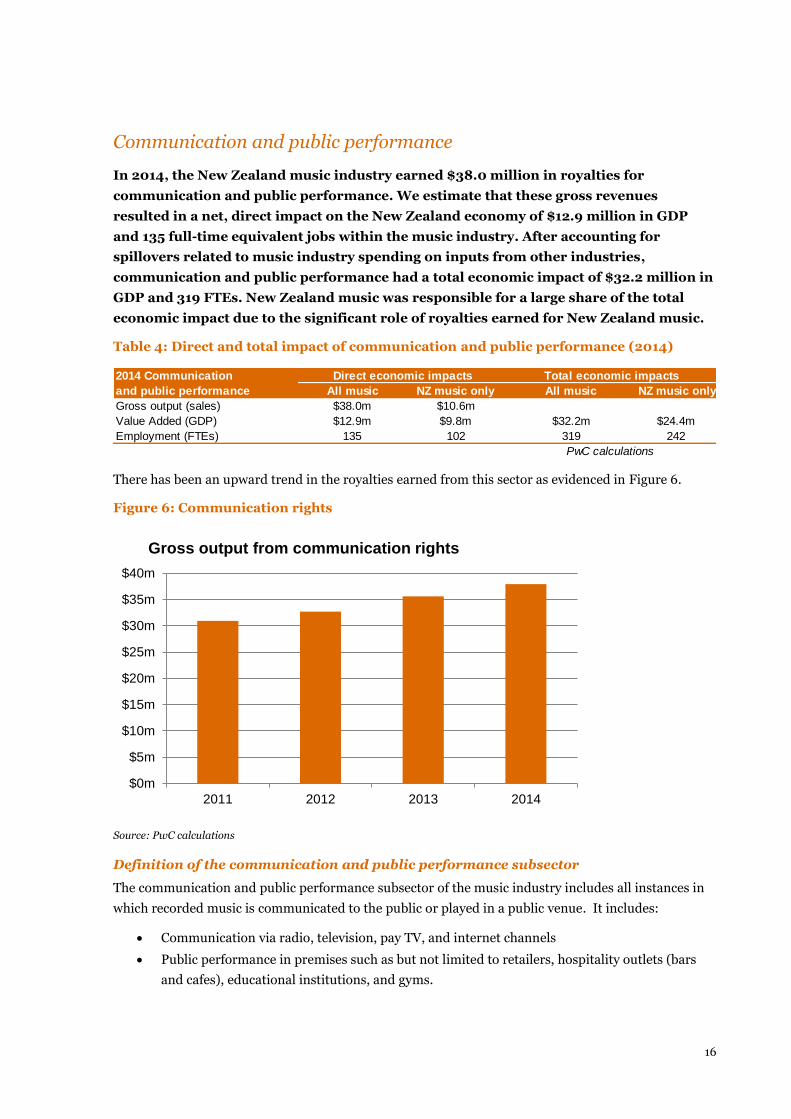
In 2014, the New Zealand music industry earned $38.0 million in royalties for
communication and public performance. We estimate that these gross revenues
resulted in a net, direct impact on the New Zealand economy of $12.9 million in GDP
and 135 full-time equivalent jobs within the music industry. After accounting for
spillovers related to music industry spending on inputs from other industries,
communication and public performance had a total economic impact of $32.2 million in
GDP and 319 FTEs. New Zealand music was responsible for a large share of the total
economic impact due to the significant role of royalties earned for New Zealand music.
Table 4: Direct and total impact of communication and public performance (2014)
There has been an upward trend in the royalties earned from this sector as evidenced in Figure 6.
Figure 6: Communication rights
Source: PwC calculations
Definition of the communication and public performance subsector
The communication and public performance subsector of the music industry includes all instances in
which recorded music is communicated to the public or played in a public venue. It includes:
Communication via radio, television, pay TV, and internet channels
Public performance in premises such as but not limited to retailers, hospitality outlets (bars
and cafes), educational institutions, and gyms.
2014 Communication
and public performance All music NZ music only All music NZ music only
Gross output (sales) $38.0m $10.6m
Value Added (GDP) $12.9m $9.8m $32.2m $24.4m
Employment (FTEs) 135 102 319 242
Direct economic impacts Total economic impacts
PwC calculations
$0m
$5m
$10m
$15m
$20m
$25m
$30m
$35m
$40m
2011 2012 2013 2014
Gross output from communication rights

17
When music is publicly performed, recording artists, record companies, songwriters, and music
publishers earn money from royalties paid for this use. These royalties are calculated on a blanket
basis and distributed mostly on a per-use basis. Data is obtained from Recorded Music NZ and
APRA/AMCOS.
18
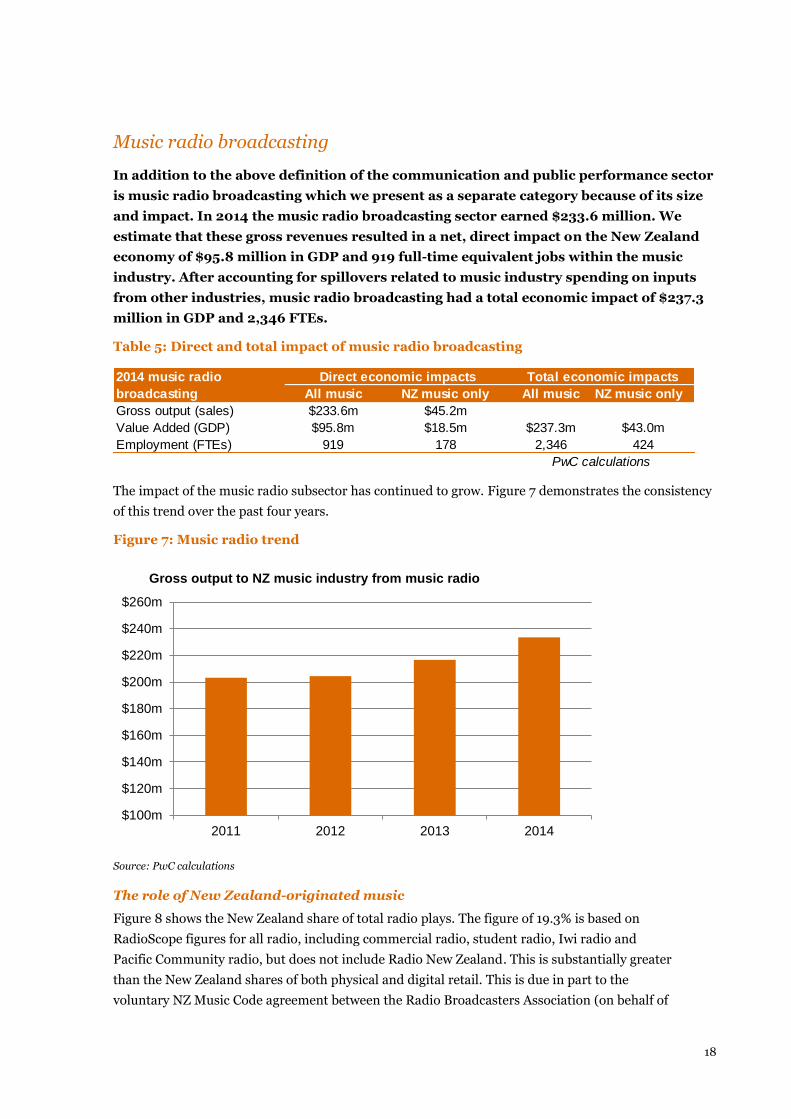
Music radio broadcasting
In addition to the above definition of the communication and public performance sector
is music radio broadcasting which we present as a separate category because of its size
and impact. In 2014 the music radio broadcasting sector earned $233.6 million. We
estimate that these gross revenues resulted in a net, direct impact on the New Zealand
economy of $95.8 million in GDP and 919 full-time equivalent jobs within the music
industry. After accounting for spillovers related to music industry spending on inputs
from other industries, music radio broadcasting had a total economic impact of $237.3
million in GDP and 2,346 FTEs.
Table 5: Direct and total impact of music radio broadcasting
The impact of the music radio subsector has continued to grow. Figure 7 demonstrates the consistency
of this trend over the past four years.
Figure 7: Music radio trend
Source: PwC calculations
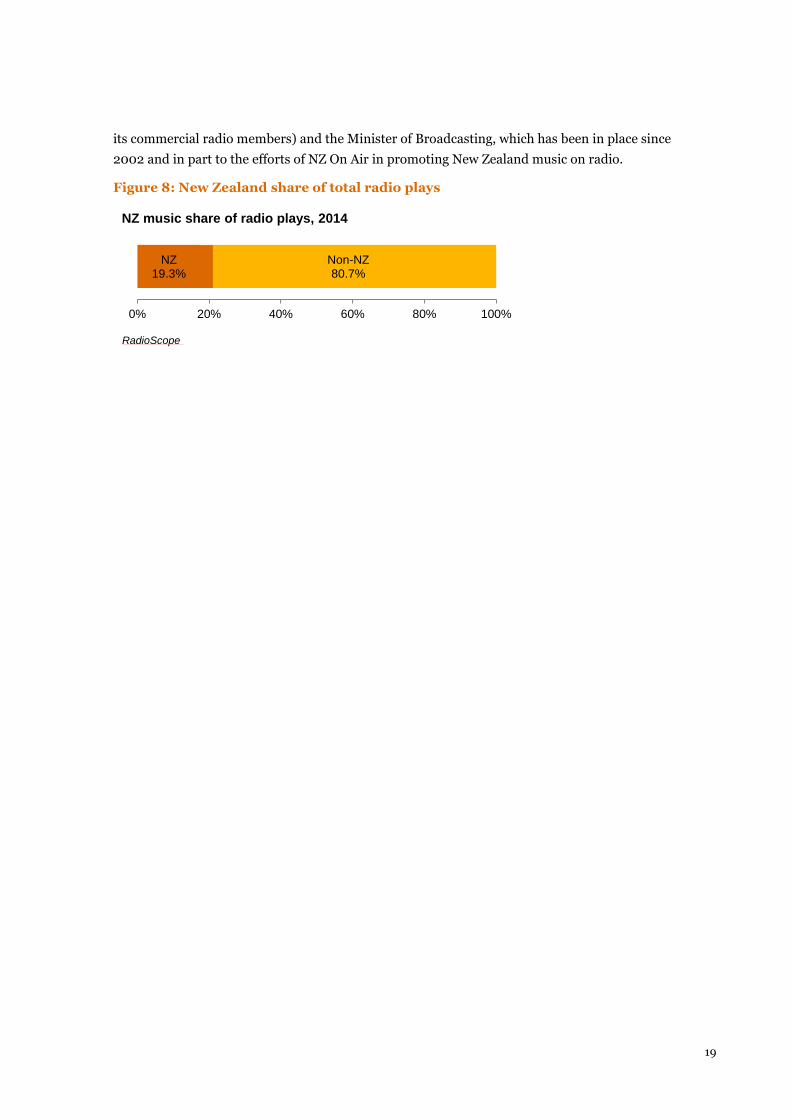
The role of New Zealand-originated music
Figure 8 shows the New Zealand share of total radio plays. The figure of 19.3% is based on
RadioScope figures for all radio, including commercial radio, student radio, Iwi radio and
Pacific Community radio, but does not include Radio New Zealand. This is substantially greater
than the New Zealand shares of both physical and digital retail. This is due in part to the
voluntary NZ Music Code agreement between the Radio Broadcasters Association (on behalf of
2014 music radio
broadcasting All music NZ music only All music NZ music only
Gross output (sales) $233.6m $45.2m
Value Added (GDP) $95.8m $18.5m $237.3m $43.0m
Employment (FTEs) 919 178 2,346 424
Direct economic impacts Total economic impacts
PwC calculations
$100m
$120m
$140m
$160m
$180m
$200m
$220m
$240m
$260m
2011 2012 2013 2014
Gross output to NZ music industry from music radio
19
its commercial radio members) and the Minister of Broadcasting, which has been in place since
2002 and in part to the efforts of NZ On Air in promoting New Zealand music on radio.
Figure 8: New Zealand share of total radio plays
NZ 19.3%
Non-NZ 80.7%
0% 20% 40% 60% 80% 100%
NZ music share of radio plays, 2014
RadioScope
20
Live performance subsector
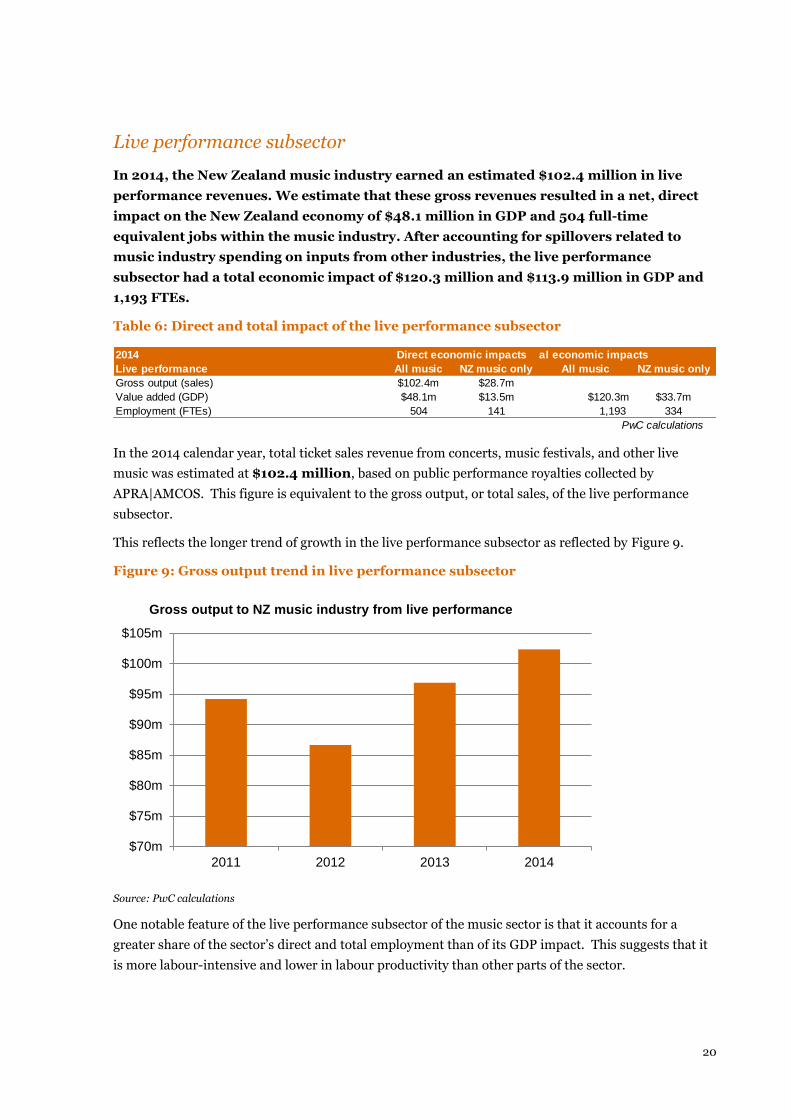
In 2014, the New Zealand music industry earned an estimated $102.4 million in live
performance revenues. We estimate that these gross revenues resulted in a net, direct
impact on the New Zealand economy of $48.1 million in GDP and 504 full-time
equivalent jobs within the music industry. After accounting for spillovers related to
music industry spending on inputs from other industries, the live performance
subsector had a total economic impact of $120.3 million and $113.9 million in GDP and
1,193 FTEs.
Table 6: Direct and total impact of the live performance subsector
In the 2014 calendar year, total ticket sales revenue from concerts, music festivals, and other live
music was estimated at $102.4 million, based on public performance royalties collected by
APRA|AMCOS. This figure is equivalent to the gross output, or total sales, of the live performance
subsector.
This reflects the longer trend of growth in the live performance subsector as reflected by Figure 9.
Figure 9: Gross output trend in live performance subsector
Source: PwC calculations
One notable feature of the live performance subsector of the music sector is that it accounts for a
greater share of the sector’s direct and total employment than of its GDP impact. This suggests that it
is more labour-intensive and lower in labour productivity than other parts of the sector.
2014 Total economic impacts
Live performance All music NZ music only All music NZ music only
Gross output (sales) $102.4m $28.7m
Value added (GDP) $48.1m $13.5m $120.3m $33.7m
Employment (FTEs) 504 141 1,193 334
PwC calculations
Direct economic impacts
$70m
$75m
$80m
$85m
$90m
$95m
$100m
$105m
2011 2012 2013 2014
Gross output to NZ music industry from live performance

21
APRA|AMCOS estimated that in 2014 28% of live performance revenue was attributed to New Zealand
content and that New Zealand content accounted for $33.7 million in total GDP impact. These
estimates suggest a strong contribution from New Zealand music in this subsector.
Definition of the live performance subsector
The live performance subsector of the New Zealand music industry includes all types of live music
played in New Zealand by local and overseas artists. These include:
Concerts and music festivals
Live music at music venues (ie door sales)
Orchestras
Music in theatre (excluding grand right musical plays).
22
Synchronisation subsector
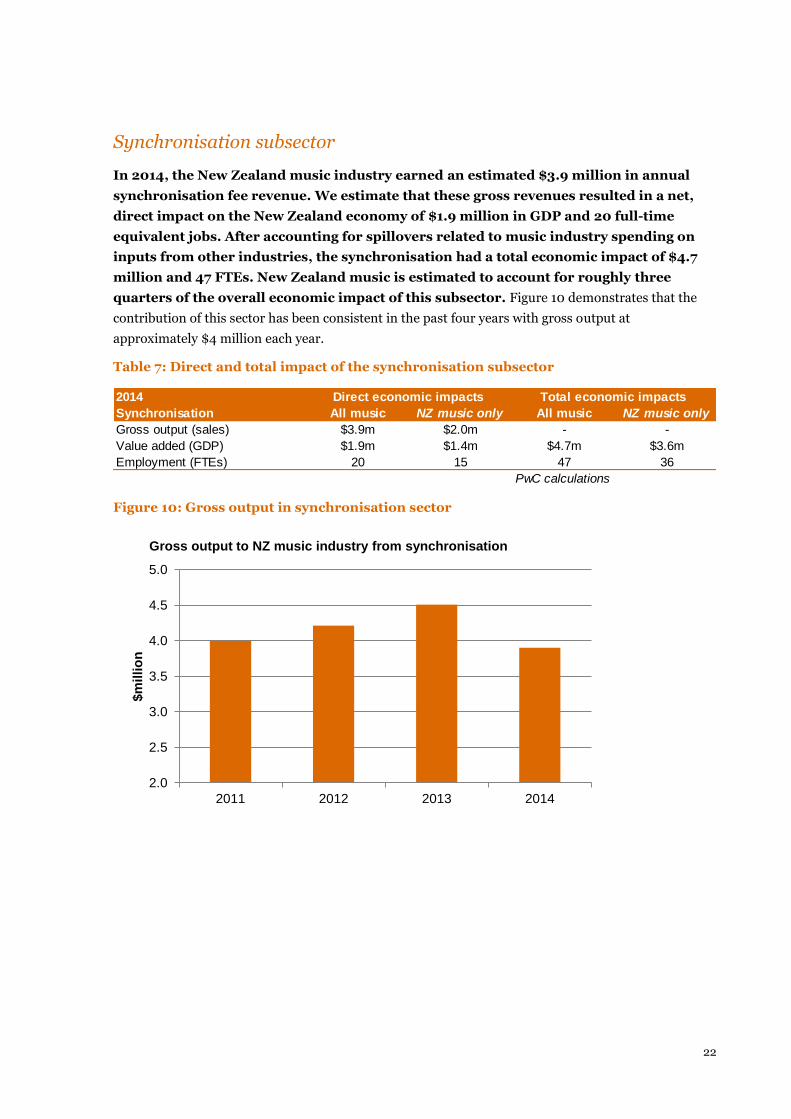
In 2014, the New Zealand music industry earned an estimated $3.9 million in annual
synchronisation fee revenue. We estimate that these gross revenues resulted in a net,
direct impact on the New Zealand economy of $1.9 million in GDP and 20 full-time
equivalent jobs. After accounting for spillovers related to music industry spending on
inputs from other industries, the synchronisation had a total economic impact of $4.7
million and 47 FTEs. New Zealand music is estimated to account for roughly three
quarters of the overall economic impact of this subsector. Figure 10 demonstrates that the
contribution of this sector has been consistent in the past four years with gross output at
approximately $4 million each year.
Table 7: Direct and total impact of the synchronisation subsector
Figure 10: Gross output in synchronisation sector
2014
Synchronisation All music NZ music only All music NZ music only
Gross output (sales) $3.9m $2.0m - -
Value added (GDP) $1.9m $1.4m $4.7m $3.6m
Employment (FTEs) 20 15 47 36
PwC calculations
Total economic impactsDirect economic impacts
2.0
2.5
3.0
3.5
4.0
4.5
5.0
2011 2012 2013 2014
$m
illio
n
Gross output to NZ music industry from synchronisation
23
4. Overseas Earnings
While New Zealand music income that is earned overseas is not used for the purpose of calculating
GDP or value add impact, these earnings still represent funds that are likely to flow back into the
economy and contribute to gross national income.
Overseas income is earned for the music industry in the form of:
royalties received from the sale of physical music overseas
royalties received from online sales and streams, that are purchased overseas
radio royalties received as a result of airplay overseas
synchronisation royalties from countries other than New Zealand
earnings from live performances overseas
earnings from other endorsements and appearances.
There is no required reporting or official statistics for exports relating to the New Zealand music
industry.
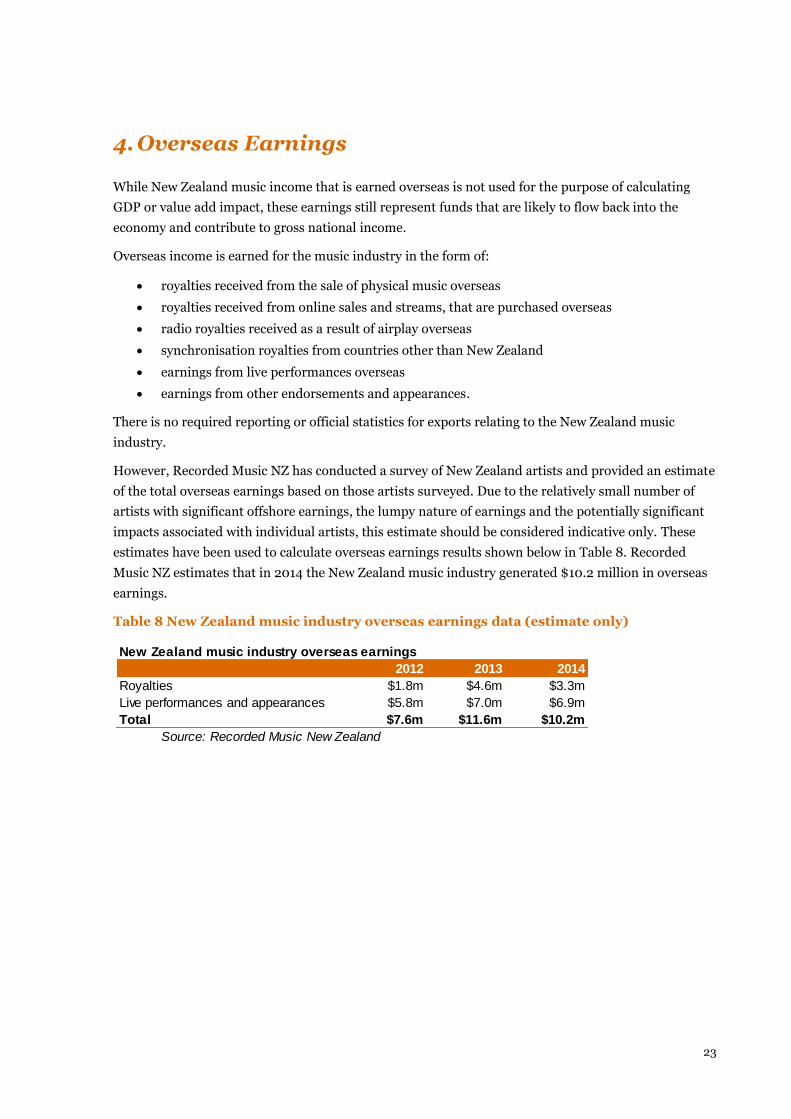
However, Recorded Music NZ has conducted a survey of New Zealand artists and provided an estimate
of the total overseas earnings based on those artists surveyed. Due to the relatively small number of
artists with significant offshore earnings, the lumpy nature of earnings and the potentially significant
impacts associated with individual artists, this estimate should be considered indicative only. These
estimates have been used to calculate overseas earnings results shown below in Table 8. Recorded
Music NZ estimates that in 2014 the New Zealand music industry generated $10.2 million in overseas
earnings.
Table 8 New Zealand music industry overseas earnings data (estimate only)
New Zealand music industry overseas earnings
2012 2013 2014
Royalties $1.8m $4.6m $3.3m
Live performances and appearances $5.8m $7.0m $6.9m
Total $7.6m $11.6m $10.2m
Source: Recorded Music New Zealand
24
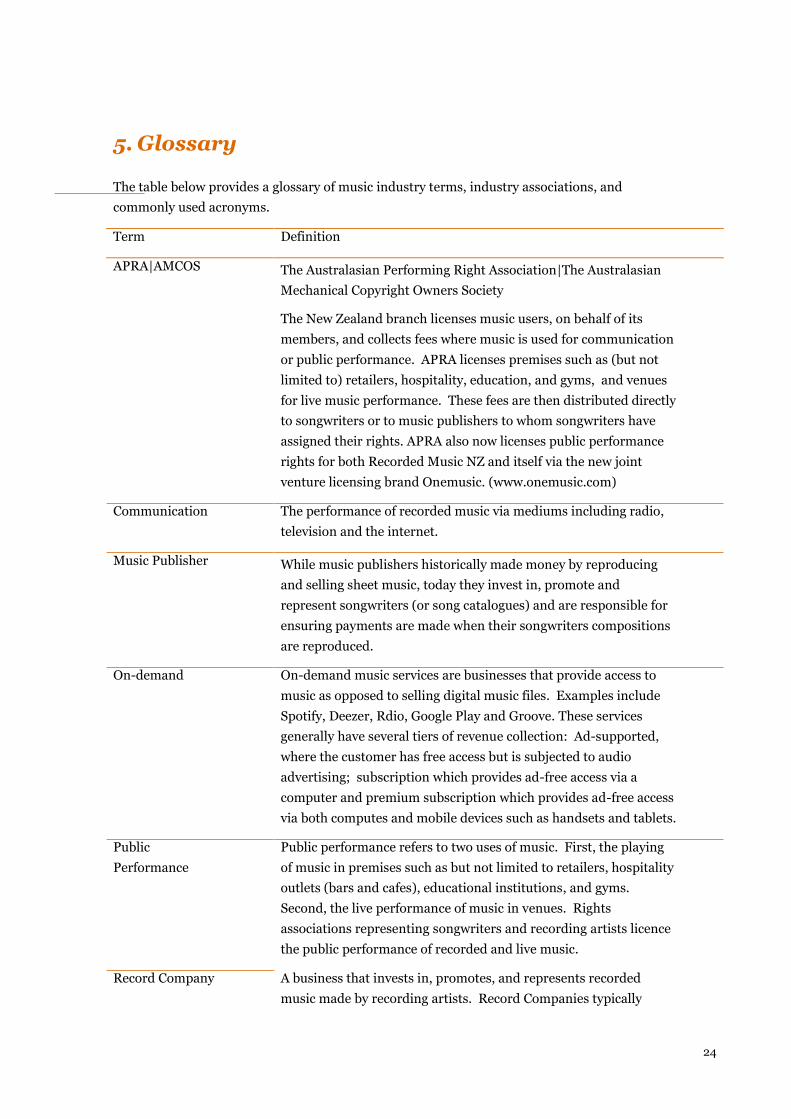
5. Glossary
The table below provides a glossary of music industry terms, industry associations, and
commonly used acronyms.
Term Definition
APRA|AMCOS The Australasian Performing Right Association|The Australasian
Mechanical Copyright Owners Society
The New Zealand branch licenses music users, on behalf of its
members, and collects fees where music is used for communication
or public performance. APRA licenses premises such as (but not
limited to) retailers, hospitality, education, and gyms, and venues
for live music performance. These fees are then distributed directly
to songwriters or to music publishers to whom songwriters have
assigned their rights. APRA also now licenses public performance
rights for both Recorded Music NZ and itself via the new joint
venture licensing brand Onemusic. (www.onemusic.com)
Communication The performance of recorded music via mediums including radio,
television and the internet.
Music Publisher While music publishers historically made money by reproducing
and selling sheet music, today they invest in, promote and
represent songwriters (or song catalogues) and are responsible for
ensuring payments are made when their songwriters compositions
are reproduced.
On-demand On-demand music services are businesses that provide access to
music as opposed to selling digital music files. Examples include
Spotify, Deezer, Rdio, Google Play and Groove. These services
generally have several tiers of revenue collection: Ad-supported,
where the customer has free access but is subjected to audio
advertising; subscription which provides ad-free access via a
computer and premium subscription which provides ad-free access
via both computes and mobile devices such as handsets and tablets.
Public
Performance
Public performance refers to two uses of music. First, the playing
of music in premises such as but not limited to retailers, hospitality
outlets (bars and cafes), educational institutions, and gyms.
Second, the live performance of music in venues. Rights
associations representing songwriters and recording artists licence
the public performance of recorded and live music.
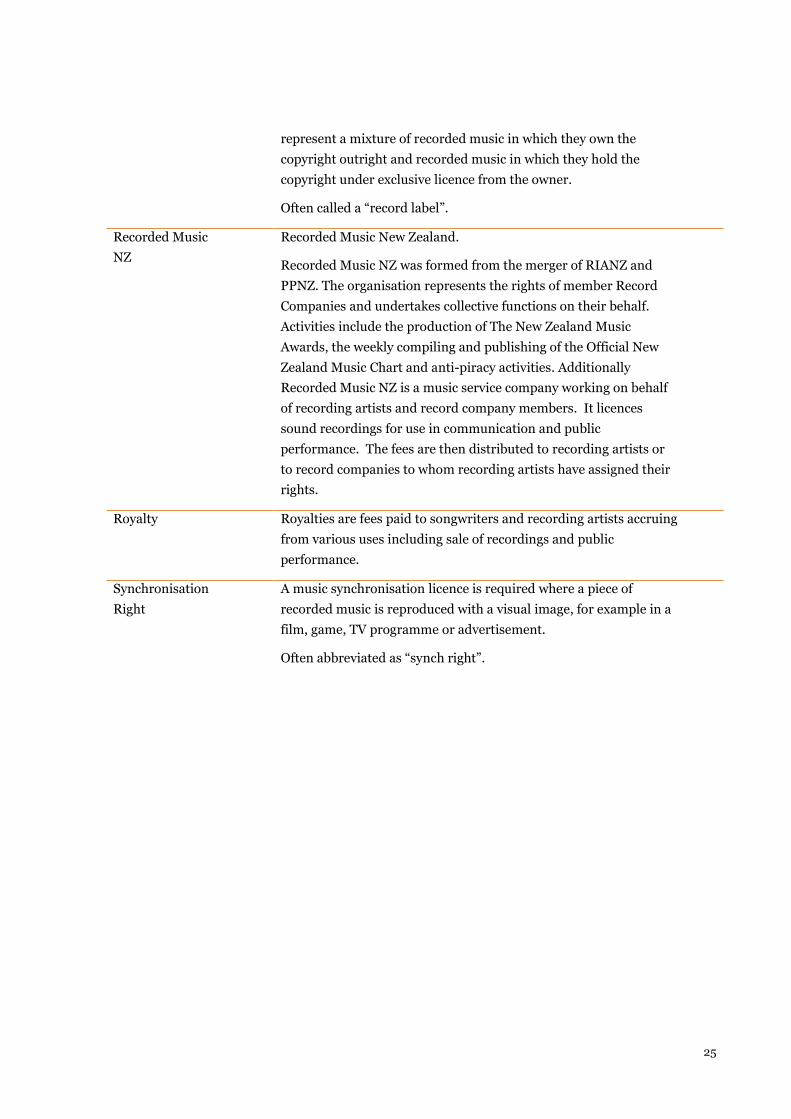
Record Company A business that invests in, promotes, and represents recorded
music made by recording artists. Record Companies typically
25
represent a mixture of recorded music in which they own the
copyright outright and recorded music in which they hold the
copyright under exclusive licence from the owner.
Often called a “record label”.
Recorded Music
NZ
Recorded Music New Zealand.
Recorded Music NZ was formed from the merger of RIANZ and
PPNZ. The organisation represents the rights of member Record
Companies and undertakes collective functions on their behalf.
Activities include the production of The New Zealand Music
Awards, the weekly compiling and publishing of the Official New
Zealand Music Chart and anti-piracy activities. Additionally
Recorded Music NZ is a music service company working on behalf
of recording artists and record company members. It licences
sound recordings for use in communication and public
performance. The fees are then distributed to recording artists or
to record companies to whom recording artists have assigned their
rights.
Royalty Royalties are fees paid to songwriters and recording artists accruing
from various uses including sale of recordings and public
performance.
Synchronisation
Right
A music synchronisation licence is required where a piece of
recorded music is reproduced with a visual image, for example in a
film, game, TV programme or advertisement.
Often abbreviated as “synch right”.
26
Appendix A: Approach and methodology
This section provides a detailed overview of our approach and methodology, including definitions of
our main economic impact measures, a discussion of our main data sources, and an explanation of
how we calculated direct and total economic impacts. Finally, it discusses some opportunities for
improving music industry data collection or undertaking future analysis.
Measures of economic impact
This report uses three main indicators of economic impact: gross output, value added, and
employment. It relies on input-output (multiplier) analysis to estimate the indirect and induced
impacts of the music industry.
Gross output
The gross output of an industry is equal to its total sales revenue. This figure incorporates both value
created within that industry and the value of intermediate goods (eg raw materials, real estate,
equipment and machinery) purchased by the industry from other industries.
Although gross output or sales revenue is commonly used as a measure of the value of an industry, it is
an imperfect measure due to its inclusion of inputs purchased from other industries.
Value added
The value added of an industry is equal to the total value created within that industry. It can also be
described as the gross domestic product (GDP) impact of an industry. It measures the contributions of
labour (through wages and salaries) and capital (through profits and depreciation) to the output
produced by the industry, and the taxes paid by the industry. As a result, it is equivalent to the gross
output of an industry, less the value of all inputs purchased from other industries.
When using our value-added estimates, it is important to understand what they do and do not include.
GDP measures, including those reported in Statistics New Zealand’s national accounts and in most
economic impact studies, measure the total value of goods and services produced in New Zealand,
rather than the net income of all businesses and individuals located within New Zealand. As a
consequence, we will:
include income earned by overseas musicians touring in New Zealand, as it was earned in New
Zealand regardless of whether it is ultimately repatriated elsewhere.
exclude royalty payments paid to New Zealand musicians by overseas sources, as they
resemble investment income accruing from ownership of an asset more than they do exports
of goods physically produced in NZ.
These inclusions and exclusions should be taken into consideration when using our estimates. The
New Zealand music industry is relatively globalised – New Zealand consumers purchase a great deal of
overseas-originated music, and New Zealand musicians tour and earn royalties overseas. We have
excluded most music imports from our analysis by:
measuring only economic benefits from New Zealand-originated music in digital retail and
broadcasting
27
including both New Zealand and overseas music in gross output figures for physical retail in
the expectation that output multipliers will correct for any imported content.
However, our analysis does not account for New Zealand musicians’ overseas income earned through
touring and royalties from overseas retail sales and music broadcasts. As a result, it will underestimate
the total income earned by the New Zealand music industry.
There were two main reasons to measure value added in terms of GDP. First, GDP impact is the most
commonly-used measure of total economic impact. It is used by Statistics New Zealand when
reporting on the size of the New Zealand economy and in many other economic impact studies.
Although GDP does have some weaknesses, they are not unique to the New Zealand music industry.
Across the whole economy, there is a significant gap between GDP and gross national income (GNI)
figures due to the large role of foreign investment and lending in the New Zealand economy.
According to World Bank figures, New Zealand’s GNI has been three to seven percent lower than GDP
in recent years. The same is true for specific industries as well – for example, measures of the GDP
impact of the wine industry will exclude both profits paid out to overseas owners of New Zealand
wineries and income earned from New Zealand wineries’ overseas investments, which may be
considerable.
Second, we found in discussions with stakeholders (eg APRA|AMCOS, NZMC) that no comprehensive
data on overseas income from music sales, royalties and touring exists. We investigated whether it
would be possible to compile this information from industry participants. While some data on
overseas touring revenues and royalties earned from overseas does exist, it is neither comprehensive
enough nor accessible enough to base robust quantitative analysis on.
The New Zealand Music Commission (NZMC) administers some overseas development grants to New
Zealand musicians. They require grant applicants to submit information about their overseas earnings
(from sales, touring, and licensing) in the last financial year. Because NZMC receives applications
from roughly 60-100 artists a year, their figures would allow us to estimate overseas income for a large
portion of the music industry. However, as NZMC does not audit artists’ reported income, we cannot
be sure that they are accurate. Nor can we be certain what share of overseas income is counted in their
data.
APRA|AMCOS collects songwriter royalties for all music played within New Zealand and Australia. It
repatriates royalties earned by overseas artists to their national royalty-collection body, which then
distributes it to publishers and artists. In return, other royalty-collection bodies (eg PRS for Music in
the UK, ASCAP in the US) collect royalties for Australian and New Zealand music played in those
countries, and remit it to APRA|AMCOS. However, it may not be possible to obtain information for
New Zealand artists only. The largest music publishers operate out of Australia, and as a result most
overseas royalty income earned by New Zealand artists will go to Australia in the first instance.
Discussions with APRA|AMCOS have indicated that it will be time-consuming, if not impossible, to
obtain comprehensive New Zealand-specific information on overseas royalties.
Employment
We measure employment on the basis of full-time equivalent jobs (FTEs), rather than total (full-time
and part-time) jobs. Under this measure, part-time jobs are counted as a proportion of a full-time job
– so, for example, a job that involved working 15 hours a week would be counted as 0.5 of an FTE.
28
This provides us with the most comparable measure of employment in an industry, as rates of part-
time employment can vary between different industries.
Values are reported in New Zealand dollars of the day unless otherwise stated
All figures in this report refer to New Zealand dollars in nominal terms.
Data sources
Main quantitative data sources
Our estimates of the economic impact of the New Zealand music industry are based primarily upon
three sources of data:
Recorded Music NZ figures on physical and digital sales wholesale revenue
APRA|AMCOS data on songwriter royalties and Recorded Music NZ data on recording
royalties
Regional Industry Database (RID) industry-level estimates of economic activity and input-
output tables for New Zealand industries.
Where possible, other data was used to provide a sense check on estimates derived from these sources.
The calendar years (year ended December quarter) have been selected as the basis for the
economic impact calculations and these are the most recent full set of annual data available. All
amounts in this report, then, relate to impacts that occur in this period.
Avoiding double counting
In several cases, Recorded Music NZ and APRA|AMCOS figures measured different components of the
same market subsector. For example, Recorded Music NZ provided data on total physical and digital
music sales, while APRA|AMCOS provided data on mechanical royalties (ie royalties paid each time a
piece of recorded music is reproduced) paid from physical and digital music sales. As royalties are
paid as a proportion of retail sales, including both of these figures in our analysis would mean double-
counting activity in this market subsector.
In order to avoid double-counting, we have examined the definitions of each measure of the market
and discussed with data providers where necessary.
Multiplier analysis
Direct, indirect and induced impacts
Like any other industry, the music industry has spillover effects on other parts of the New Zealand
economy. For our purposes here, these impacts can be divided into two categories:
Indirect (or upstream) impacts
Induced (or downstream) impacts.
Indirect impacts occur as a result of purchases of goods and services from other industries. When a
record is made or a concert is put on, businesses within the music industry purchases a range of
inputs: advertising and marketing, transportation services, machinery and instruments, rented real
estate, etc.
29
Induced impacts occur as a result of the wages and salaries paid out by the music industry. When a
musician collects a royalty check, he or she will then spend some of that money on a range of goods
and services, thereby stimulating further economic impact.
Estimating direct economic impacts
We estimated the direct impact of the music industry in terms of its contribution to gross output, value
added, and employment as follows:
For each market subsector, we started with figures on either gross output (eg total digital
music sales, total estimated ticket sales) or value added (eg broadcasting royalties).
We then chose a representative ANZSIC industry (eg Entertainment Media Retailing, Creative
Artists, Musicians, Writers, and Performers) for each market subsector.
We used data from the PwC Regional Industry Database (RID) to estimate the ratios of value
added (VA) to gross output (GO) and VA (or GO) to employment in these industries. These
ratios were then used to estimate direct GO/VA and employment in each market subsector.
Estimating total economic impacts
Spending in the music industry has multiplier effects in other industries as a result of the way in
which that spending flows through the economy. Every dollar that is spent directly on music will also
stimulate or support other types of economic activity indirect and induced from the industry.
In order to estimate flow-on effects, we applied multipliers calculated using 2006/07 input-output
tables for all New Zealand industries, which are the latest available. Multipliers were available for
gross output, value added, and employment in these industries.
Indirect impacts were estimated using Type 1 multipliers, which account for the first-round
and indirect effect of purchases of goods and services by each industry.
Induced impacts were estimated using Type 2 multipliers, which account for induced effects
from wages and salaries paid by each industry.
30
Approaches followed for individual subsectors
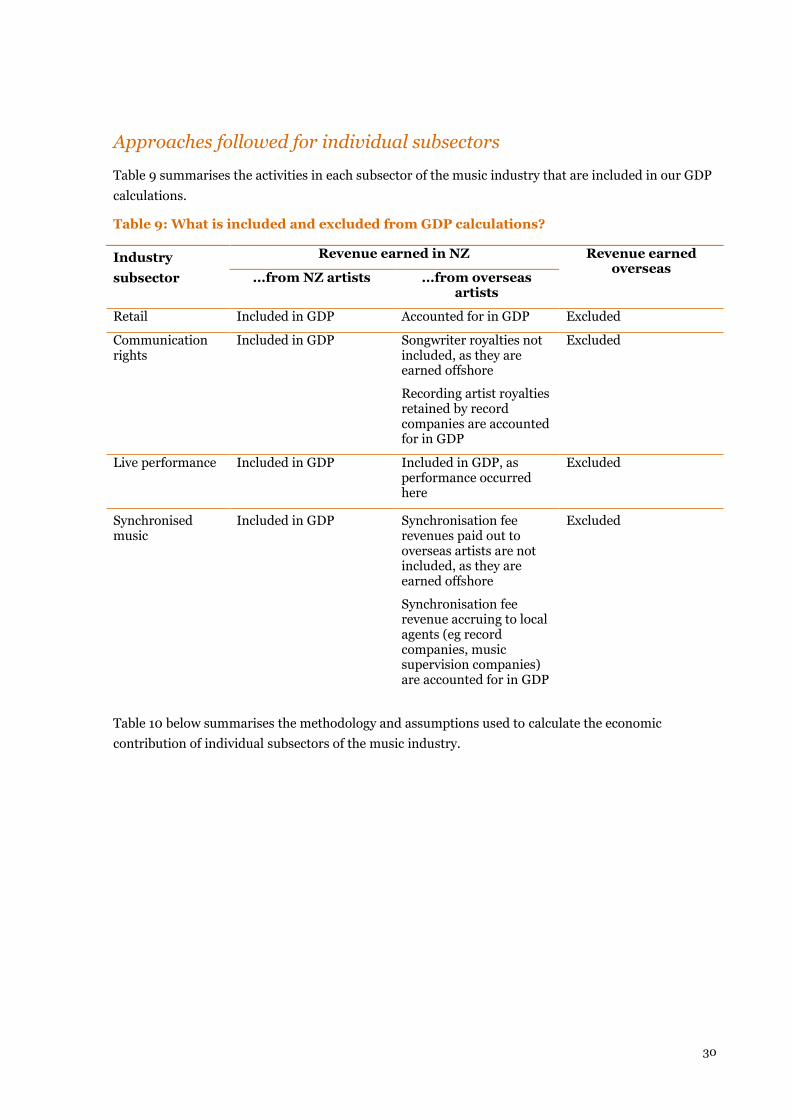
Table 9 summarises the activities in each subsector of the music industry that are included in our GDP
calculations.
Table 9: What is included and excluded from GDP calculations?
Industry
subsector
Revenue earned in NZ Revenue earned overseas
...from NZ artists ...from overseas artists
Retail Included in GDP Accounted for in GDP Excluded
Communication rights
Included in GDP Songwriter royalties not included, as they are earned offshore
Recording artist royalties retained by record companies are accounted for in GDP
Excluded
Live performance Included in GDP Included in GDP, as performance occurred here
Excluded
Synchronised music
Included in GDP Synchronisation fee revenues paid out to overseas artists are not included, as they are earned offshore
Synchronisation fee revenue accruing to local agents (eg record companies, music supervision companies) are accounted for in GDP
Excluded
Table 10 below summarises the methodology and assumptions used to calculate the economic
contribution of individual subsectors of the music industry.
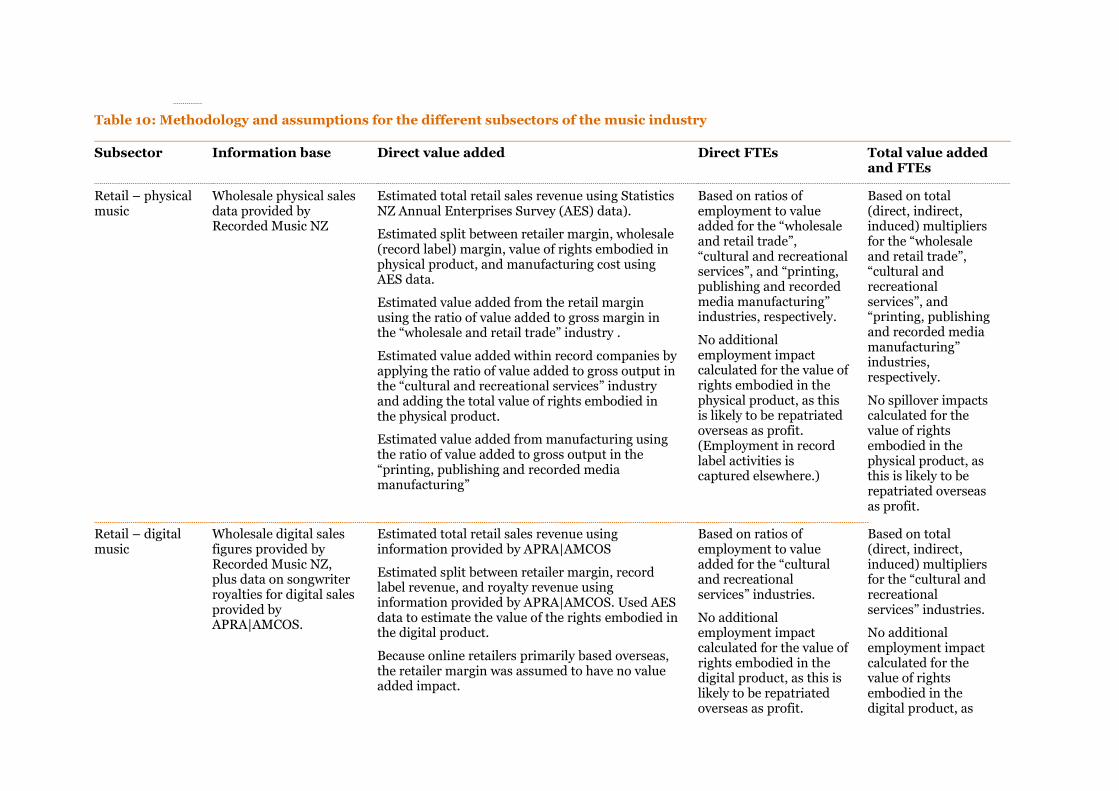
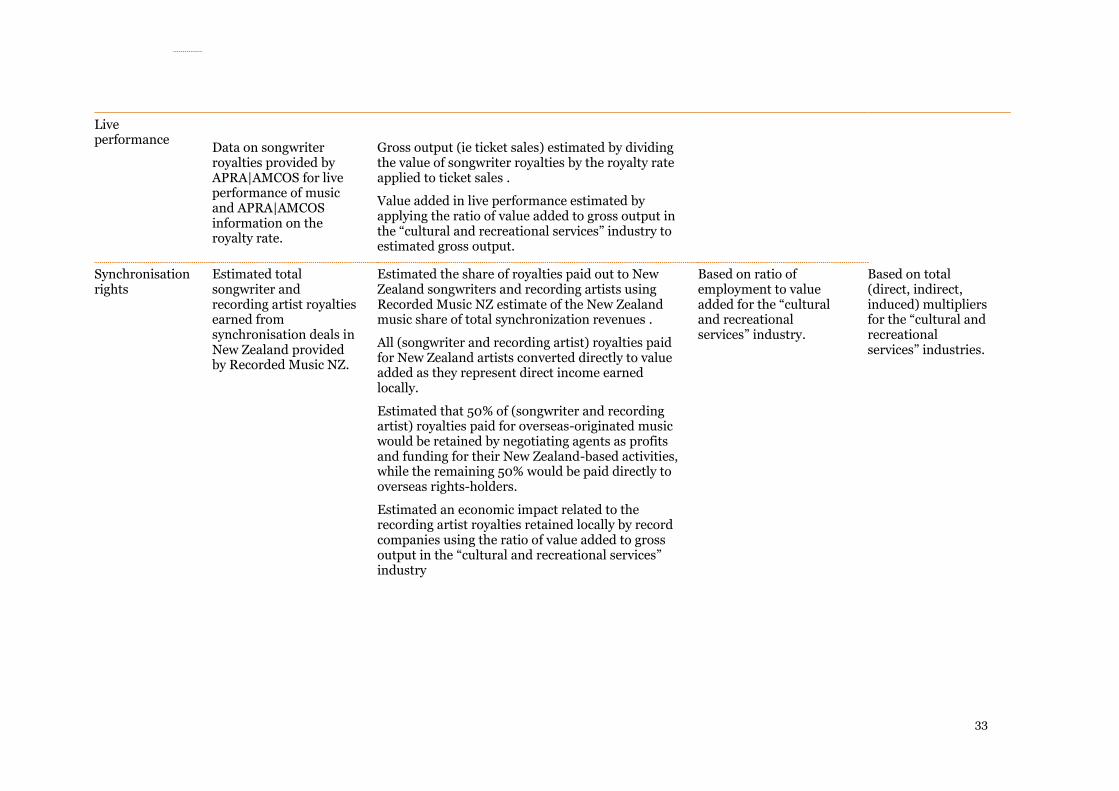
Table 10: Methodology and assumptions for the different subsectors of the music industry
Subsector Information base Direct value added Direct FTEs Total value added and FTEs
Retail – physical music
Wholesale physical sales data provided by Recorded Music NZ
Estimated total retail sales revenue using Statistics NZ Annual Enterprises Survey (AES) data).
Estimated split between retailer margin, wholesale (record label) margin, value of rights embodied in physical product, and manufacturing cost using AES data.
Estimated value added from the retail margin using the ratio of value added to gross margin in the “wholesale and retail trade” industry .
Estimated value added within record companies by applying the ratio of value added to gross output in the “cultural and recreational services” industry and adding the total value of rights embodied in the physical product.
Estimated value added from manufacturing using the ratio of value added to gross output in the “printing, publishing and recorded media manufacturing”
Based on ratios of employment to value added for the “wholesale and retail trade”, “cultural and recreational services”, and “printing, publishing and recorded media manufacturing” industries, respectively.
No additional employment impact calculated for the value of rights embodied in the physical product, as this is likely to be repatriated overseas as profit. (Employment in record label activities is captured elsewhere.)
Based on total (direct, indirect, induced) multipliers for the “wholesale and retail trade”, “cultural and recreational services”, and “printing, publishing and recorded media manufacturing” industries, respectively.
No spillover impacts calculated for the value of rights embodied in the physical product, as this is likely to be repatriated overseas as profit.
Retail – digital music
Wholesale digital sales figures provided by Recorded Music NZ, plus data on songwriter royalties for digital sales provided by APRA|AMCOS.
Estimated total retail sales revenue using information provided by APRA|AMCOS
Estimated split between retailer margin, record label revenue, and royalty revenue using information provided by APRA|AMCOS. Used AES data to estimate the value of the rights embodied in the digital product.
Because online retailers primarily based overseas, the retailer margin was assumed to have no value added impact.
Based on ratios of employment to value added for the “cultural and recreational services” industries.
No additional employment impact calculated for the value of rights embodied in the digital product, as this is likely to be repatriated overseas as profit.
Based on total (direct, indirect, induced) multipliers for the “cultural and recreational services” industries.
No additional employment impact calculated for the value of rights embodied in the digital product, as
32
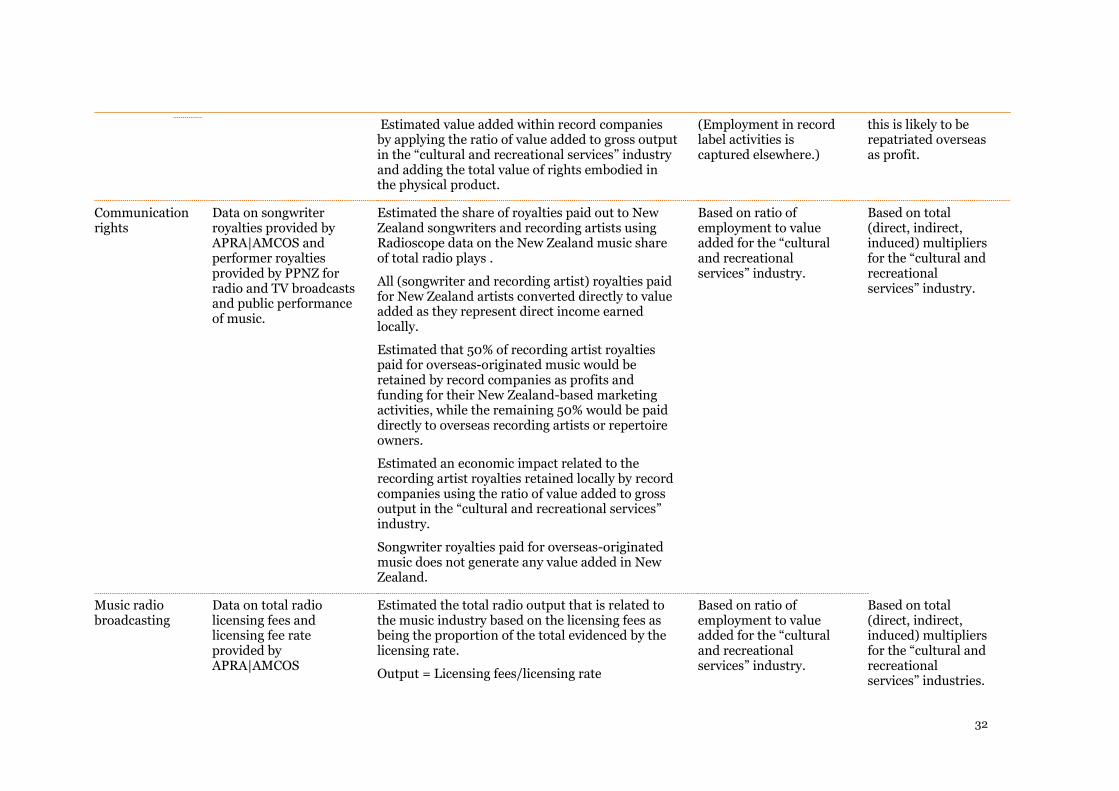
Estimated value added within record companies by applying the ratio of value added to gross output in the “cultural and recreational services” industry and adding the total value of rights embodied in the physical product.
(Employment in record label activities is captured elsewhere.)
this is likely to be repatriated overseas as profit.
Communication rights
Data on songwriter royalties provided by APRA|AMCOS and performer royalties provided by PPNZ for radio and TV broadcasts and public performance of music.
Estimated the share of royalties paid out to New Zealand songwriters and recording artists using Radioscope data on the New Zealand music share of total radio plays .
All (songwriter and recording artist) royalties paid for New Zealand artists converted directly to value added as they represent direct income earned locally.
Estimated that 50% of recording artist royalties paid for overseas-originated music would be retained by record companies as profits and funding for their New Zealand-based marketing activities, while the remaining 50% would be paid directly to overseas recording artists or repertoire owners.
Estimated an economic impact related to the recording artist royalties retained locally by record companies using the ratio of value added to gross output in the “cultural and recreational services” industry.
Songwriter royalties paid for overseas-originated music does not generate any value added in New Zealand.
Based on ratio of employment to value added for the “cultural and recreational services” industry.
Based on total (direct, indirect, induced) multipliers for the “cultural and recreational services” industry.
Music radio broadcasting
Data on total radio licensing fees and licensing fee rate provided by APRA|AMCOS
Estimated the total radio output that is related to the music industry based on the licensing fees as being the proportion of the total evidenced by the licensing rate.
Output = Licensing fees/licensing rate
Based on ratio of employment to value added for the “cultural and recreational services” industry.
Based on total (direct, indirect, induced) multipliers for the “cultural and recreational services” industries.
33
Live performance
Data on songwriter royalties provided by APRA|AMCOS for live performance of music and APRA|AMCOS information on the royalty rate.
Gross output (ie ticket sales) estimated by dividing the value of songwriter royalties by the royalty rate applied to ticket sales .
Value added in live performance estimated by applying the ratio of value added to gross output in the “cultural and recreational services” industry to estimated gross output.
Synchronisation rights
Estimated total songwriter and recording artist royalties earned from synchronisation deals in New Zealand provided by Recorded Music NZ.
Estimated the share of royalties paid out to New Zealand songwriters and recording artists using Recorded Music NZ estimate of the New Zealand music share of total synchronization revenues .
All (songwriter and recording artist) royalties paid for New Zealand artists converted directly to value added as they represent direct income earned locally.
Estimated that 50% of (songwriter and recording artist) royalties paid for overseas-originated music would be retained by negotiating agents as profits and funding for their New Zealand-based activities, while the remaining 50% would be paid directly to overseas rights-holders.
Estimated an economic impact related to the recording artist royalties retained locally by record companies using the ratio of value added to gross output in the “cultural and recreational services” industry
Based on ratio of employment to value added for the “cultural and recreational services” industry.
Based on total (direct, indirect, induced) multipliers for the “cultural and recreational services” industries.
Appendix B: Restrictions
This economic impact assessment has been prepared for Recorded Music New Zealand Limited
(Recorded Music NZ), the Australasian Performing Rights Association/The Australasian Mechanical
Copyright Owners Society (APRA|AMCOS) and the NZ Music Commission. This report has been
prepared solely for this purpose and should not be relied upon for any other purpose.
This report has been prepared solely for use by Recorded Music NZ, APRA|AMCOS and the NZ Music
Commission and may not be copied or distributed to third parties without our prior written consent.
To the fullest extent permitted by law, PwC accepts no duty of care to any third party in connection
with the provision of this Report and/or any related information or explanation (together, the
“Information”). Accordingly, regardless of the form of action, whether in contract, tort (including
without limitation, negligence) or otherwise, and to the extent permitted by applicable law, PwC
accepts no liability of any kind to any third party and disclaims all responsibility for the consequences
of any third party acting or refraining to act in reliance on the Information.
Our report has been prepared with care and diligence and the statements and opinions in the report
are given in good faith and in the belief on reasonable grounds that such statements and opinions are
not false or misleading. In preparing our report, we have relied on the data and information provided
by members of the sponsor group as being complete and accurate at the time it was given. The views
expressed in this report represent our independent consideration and assessment of the information
provided.
No responsibility arising in any way for errors or omissions (including responsibility to any person for
negligence) is assumed by us or any of our partners or employees for the preparation of the report to
the extent that such errors or omissions result from our reasonable reliance on information provided
by others or assumptions disclosed in the report or assumptions reasonably taken as implicit.
We reserve the right, but are under no obligation, to revise or amend our report if any additional
information (particularly as regards the assumptions we have relied upon) which exists at the date of
our report, but was not drawn to our attention during its preparation, subsequently comes to light.
This report is issued pursuant to the terms and conditions set out in our engagement letter dated 15
June 2015.