Embed Size (px)
Citation preview

Economic Assessment Results
Markus Kempen

Cross Compliance Assessment Tool
Outline
Scenarios Definition
Agricultural Income Effects
Main Market Effects
Overview on Cost Impacts
Conclusion/Discussion

Cross Compliance Assessment Tool
Analyzed ScenariosMain Scenarios:
Baseline 2005:• Technically: CAPRI “base year”• All measures implemented in base period 2005-2009• Compliance varies among SMR directives( GAEC issues and countries (70% -
100%); on average about ~90% • No implementation in Bulgaria and Romania• Violation of measures as estimated/observed in base year
Zero Compliance:• Hypothetical situation without CC related measures• Mainly used as comparison scenario
Compliance100pct:• Assuming full compliance with all measures
Variations of Compliance100pct for Sensitivity Analysis:Cost200: cost doubledCost500: cost increased by factor 5Crops000Animals200: no cost for crops, animals doubledCrops200Animals000: no cost for animals, crops doubled

Cross Compliance Assessment Tool
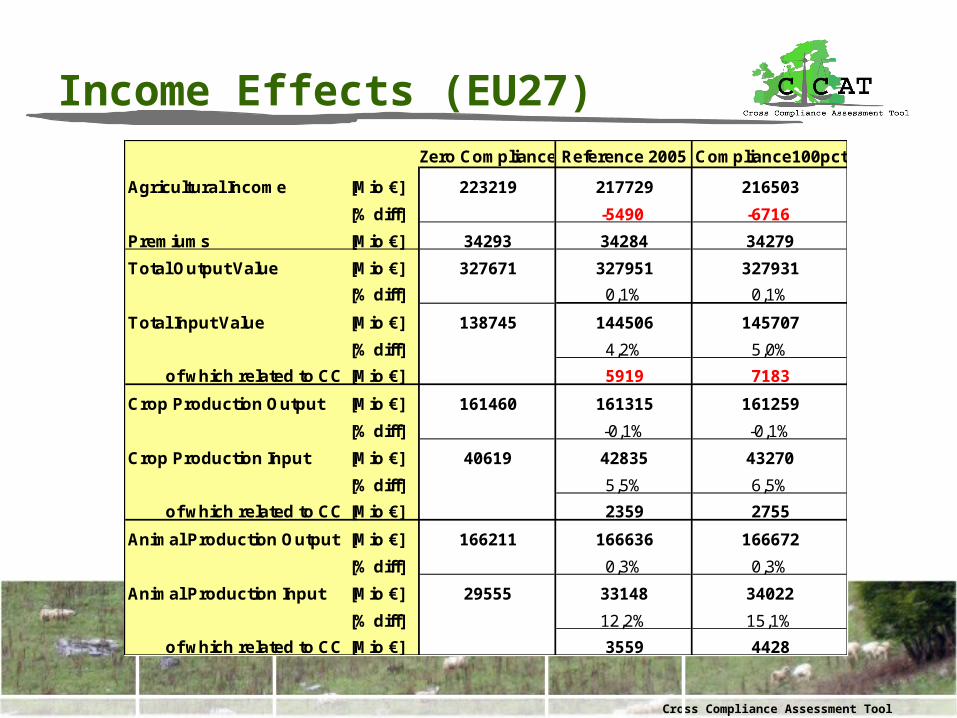
Income Effects (EU27)Zero Compliance Reference 2005 Compliance100pct
Agricultural Income [Mio €] 223219 217729 216503
[% diff] -2,5% -3,0%
Premiums [Mio €] 34293 34284 34279
Total Output Value [Mio €] 327671 327951 327931
[% diff] 0,1% 0,1%
Total Input Value [Mio €] 138745 144506 145707
[% diff] 4,2% 5,0%
of which related to CC [Mio €] 5919 7183
Crop Production Output [Mio €] 161460 161315 161259
[% diff] -0,1% -0,1%
Crop Production Input [Mio €] 40619 42835 43270
[% diff] 5,5% 6,5%
of which related to CC [Mio €] 2359 2755
Animal Production Output [Mio €] 166211 166636 166672
[% diff] 0,3% 0,3%
Animal Production Input [Mio €] 29555 33148 34022
[% diff] 12,2% 15,1%
of which related to CC [Mio €] 3559 4428
Cross Compliance Assessment Tool
Income Effects (EU27)Zero Compliance Reference 2005 Compliance100pct
Agricultural Income [Mio €] 223219 217729 216503
[% diff] -5490 -6716
Premiums [Mio €] 34293 34284 34279
Total Output Value [Mio €] 327671 327951 327931
[% diff] 0,1% 0,1%
Total Input Value [Mio €] 138745 144506 145707
[% diff] 4,2% 5,0%
of which related to CC [Mio €] 5919 7183
Crop Production Output [Mio €] 161460 161315 161259
[% diff] -0,1% -0,1%
Crop Production Input [Mio €] 40619 42835 43270
[% diff] 5,5% 6,5%
of which related to CC [Mio €] 2359 2755
Animal Production Output [Mio €] 166211 166636 166672
[% diff] 0,3% 0,3%
Animal Production Input [Mio €] 29555 33148 34022
[% diff] 12,2% 15,1%
of which related to CC [Mio €] 3559 4428

Cross Compliance Assessment Tool
Income Effects – Sensitivity of Results
Cross Compliance Assessment Tool
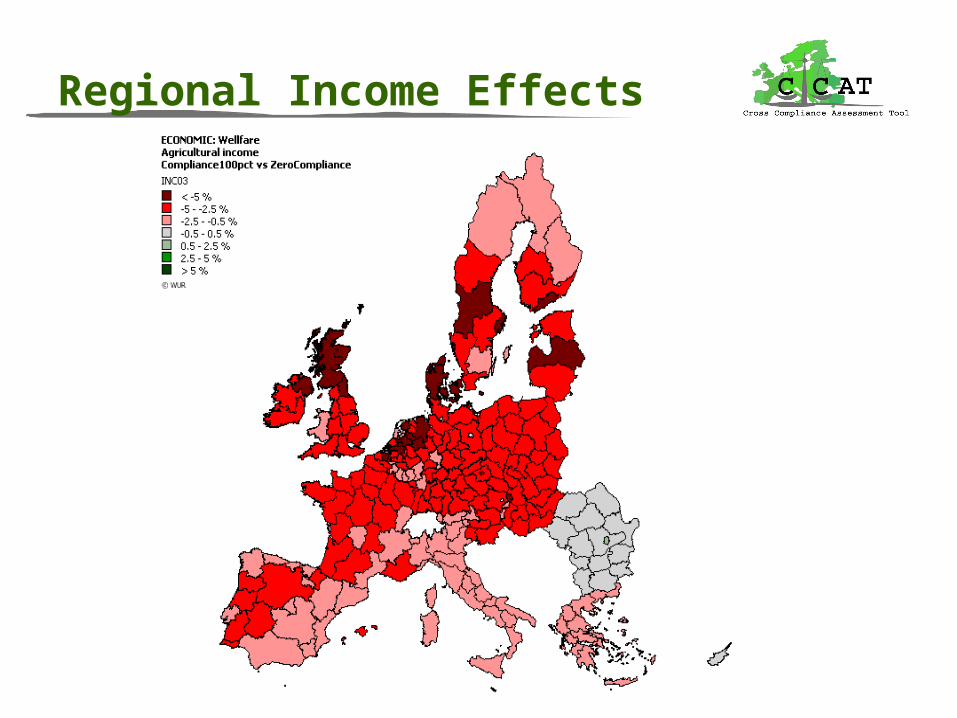
Regional Income Effects

Cross Compliance Assessment Tool
Summary - Income
– Minor effects comparing baseline situation (about 90% compliance) and full compliance (100%)
– Cost related to CC standards are almost equal to drop in agricultural income
– Agricultural Income decreases compared to a situation without regulation ( ~ -3%)
– CC standards cost are significantly lower than premium payments
– No significant difference between crops and animal production ( … with respect to income)
– Output value of animal products goes up with increasing cost (market effects can partially compensate)
– Output value of crops slightly decreasing (at most stable)
– Income drop homogeneous among regions [-5%, -1%]

Cross Compliance Assessment Tool
Market effects for selected activities/products
Production Revenue CC Cost Price Supply Demand Net Trade
[1000 ha or heads] [€ / ha or head] [€ / ha or head] [€ per ton] [Mio tion] [Mio tion] [Mio tion]
22501 589,24 13,9 98,62 127961 121780 6030
0,40% -3,03 -0,44% 1118 1032 86
14044 451,67 13,2 98,62 61235 57908 3327
0,93% -3,66 -0,62% 887 822 64
4586 667,06 29,1 200,16 14194 14154 29
-1,13% 2,25 0,37% -288 -286 -1
2306 3362,24 46,7 122,65 62272 56572 5701
-0,45% 13,42 0,37% -584 -530 -54
12294 23,2
-1,87%
25267 2018,12 45,8 280.53 143568 143568 0
-0,02% 2,39 0.25% -10 -10 0
239122 117,63 3,1 1302,23 21497 18575 2923
-1,33% 2,28 2,01% -624 -566 -58
Dairy cows / Raw milk
Pig fattening / Pork
Selcted Indicators in 100% Compliance Scenario (2005) - absolut or relative diff. to Zero Compliance
Soft wheat
Barley
Rape seed
Potatoes
Fallow Land

Cross Compliance Assessment Tool
Regional Production Effects
LU per ha
Cross Compliance Assessment Tool
Summary – Market/Production Effects
Animals:– Overall decrease in herds;– Increasing prices almost compensate CC cost (… but not loss of production)– Decreases in prevailing intensive regions (… due cost related to manure
application)– Dairy sector almost not affected (quota!)
Crops:– Cereal production increasing (“best alternative”); – Cereal prices go down due decreasing (feed) demand and increasing acreage– Additional cereal production is processed to bio fuels (at lower prices)– “demanding” crops go down, costs can be partially compensated by price
effects)
Fallow Land: – Set aside and fallow land decrease (due GAEC enforcing minimum
maintenance)– Assumptions on cost of fallow land are crucial!

Cross Compliance Assessment Tool
Cost Implication at EU level

Cross Compliance Assessment Tool
Regional Cost Implication
Total cost per UAA Crop related cost per UAA Animal related cost per LU
Nitrate Directive Animal Welfare Directive(s)

Cross Compliance Assessment Tool
Summary - Cost
Cost:– Animal production more affected then crops– Dir 4 (crops and animals) and Dir16-18
(only animals) major cost drivers– Significant regional difference in cost
effects (especially for animals)

Cross Compliance Assessment Tool
Conclusion/Discussion
– CC Cost are not compensated by market effects
– Divergent effects in Crop and animal sector
- Public service payments might need to be targeted more strongly to livestock sectors (also in the light of important positive and negative externalities to environment by these sectors)
– Maybe accompanying measure needed on maintenance of fallow land level?

Cross Compliance Assessment Tool
Minimum legal standard
Animal Welfare
Minimum legal Standard
Dairy cows Suckler cows Calves Pig fattening
Estimated on farm condition

Cross Compliance Assessment Tool
Animal Welfare CriteriaDairy cows - loose housing
0
20
40
60
80
100
T1f T1e T1a T1b T2b T2c T2e T2d T2a T3a T3e T3f T3b T3c T3d T4e T4f T4a T4b T4d T4c T5d T5a T5e T5g T5f T5c T5b
Locomation Social interaction Flooring Light, air and noise Stockmanship
Animal Nedds Index criteria
% o
f o
pti
ma
l c
on
dit
ion
legal standardon farm condition
Pig fattening
0
20
40
60
80
100
T1e T1a T1c T1b T2f T2d T2e T2a T2b T2c T3f T3a T3e T3c T3d T4g T4f T4b T4a T4e T4c T5c T5g T5d T5e T5b T5a T5f
Locomation Social interaction Flooring Light, air and noise Stockmanship
Animal Needs Index criteria
% o
f o
pti
mal
co
nd
itio
n
legal standard
on farm condition

Cross Compliance Assessment Tool
Summary – Animal Welfare
– Based on Animal Needs Index (Cattle and Pigs)
– Minimum legal standard based on EU and national legislation
– Estimated on farm condition extrapolated from own field study (Austria, 60 farms)
– Overall: On farm condition above minimum standard ( … but several standards “binding”)