Embed Size (px)
Citation preview

Economic And Social Commission For Western Asia
ESCWA – IRENA Joint Study
“Potential of Manufacturing RE Equipment in the Arab Region”

© Copyright 2016 ESCWA. All rights reserved. No part of this presentation in all its property may be used or reproduced in any form without a written permission
Background
2014: IRENA and LAS published Pan-Arab RE Strategy 2030: Road of
Actions for Implementation, to address the current state of RE, targets,
market, incentives, gaps (technical, financial, legal, political), AREF &
NREAP
2015: Recommendation of ESCWA’s Committee on Energy held in
Amman in March 2016
2015: Similar study was conducted by IRENA and FEMIP: focusing on
Egypt, Morocco, and Tunisia (North Africa)
2016: IRENA and UN-ESCWA signed a MoU and are jointly conducting
the study about the potential of local manufacturing of RE equipment in the
Arab Region

© Copyright 2016 ESCWA. All rights reserved. No part of this presentation in all its property may be used or reproduced in any form without a written permission
Why RE manufacturing in the Arab region?
• Increase Job Creation
• Increase Economic activity
• Lower RE prices
• Increase RE installation
• Reach the RE target and lower the dependency on
conventional fuel

© Copyright 2016 ESCWA. All rights reserved. No part of this presentation in all its property may be used or reproduced in any form without a written permission
Why RE manufacturing in the Arab region?
Public Sector Input
Permit
EIA
Market Analysis
Technical Analysis
Financial Analysis
R&D
Real Estate
Industry
Investors (Local
and International)
Funds
Banking
EPC
Raw
Materials
Supply
Raw Materials
Import
Installation,
O&M
OR OR
R&D
Production Lines
Packaging and Labeling
QA and Testing
Labors (Food, Dorms,
Salaries, Insurance)
Distribution to the
Local Market
Export to the
Regional or
International Market
Key players in RE manufacturing

© Copyright 2016 ESCWA. All rights reserved. No part of this presentation in all its property may be used or reproduced in any form without a written permission
Selected Case Studies
• Three countries: Jordan, Lebanon and United Arab Emirates
(UAE)
• These countries showed a high interest and investment in RE
especially in the last 5 years
• The total installed RE capacity increased significantly, and
particularly in Jordan and UAE
• Lebanon’s incentives and financing mechanism dedicated to
RE are remarkable and inducing further implementation of
RE projects
• For Lebanon and Jordan, they lack sufficient power capacity
and RE can play a remarkable role in this regard
• As for UAE, the aim is diversifying energy resources,
increasing RE share in the energy mix

© Copyright 2016 ESCWA. All rights reserved. No part of this presentation in all its property may be used or reproduced in any form without a written permission
Objectives of ESCWA – IRENA Present Study
1. Positioning of potential manufacturing of RE
technologies (mainly PV, CSP and onshore wind), in terms
of Supply Chains, Export Opportunities, Industrial Structure,
Regional Cooperation
2. Identifying Gaps: Technical, industrial, financial, political,
with a focus on Lebanon, Jordan and UAE, as considered,
as 3 case studies, to be addressed within this context.
3. Providing Recommendations and Action plans: based on
gaps, success factors, and regional linkages

© Copyright 2016 ESCWA. All rights reserved. No part of this presentation in all its property may be used or reproduced in any form without a written permission
Study Methodology
A
• Reviewing previous studies and results regarding RE manufacturing in the Arab region
B• Analysis of PV, CSP, and onshore wind value chains
C
• Analysis of the Industrial Structure (available industries, strengths, weaknesses) in the Arab Region focusing on Lebanon, Jordan and UAE
D
• Matching (if possible) available industries into supply chains components showing related industries and potential extensions in other industries
C
• Review of key success factors (incentives, skills…) in Arab region and case studies showing threats and opportunities of local manufacturing
D
• SWOT Analysis followed by recommendations including technical, industrial, commercial, financial, and political aspects

© Copyright 2016 ESCWA. All rights reserved. No part of this presentation in all its property may be used or reproduced in any form without a written permission
Recommendations from Previous Studies
I. Local Levela) Review RE Policies and strategies
b) Coordinate with other local ministries and institutions
c) Design dedicated education programs
d) Propose a soft loan regime for new investments in the field of RE.
e) Facilitate foreign investments
II. Regional Levela) Coordinate national renewable energy plans and policies
b) Optimize development of renewable energy resources and manufacturing capacities
c) Cross-border trade and R&D collaboration
d) Establish a regional financial framework and financing facility

© Copyright 2016 ESCWA. All rights reserved. No part of this presentation in all its property may be used or reproduced in any form without a written permission
Solar PV-Value Chain

© Copyright 2016 ESCWA. All rights reserved. No part of this presentation in all its property may be used or reproduced in any form without a written permission
Onshore Wind- Value Chain

© Copyright 2016 ESCWA. All rights reserved. No part of this presentation in all its property may be used or reproduced in any form without a written permission
CSP-Value Chain
© Copyright 2016 ESCWA. All rights reserved. No part of this presentation in all its property may be used or reproduced in any form without a written permission
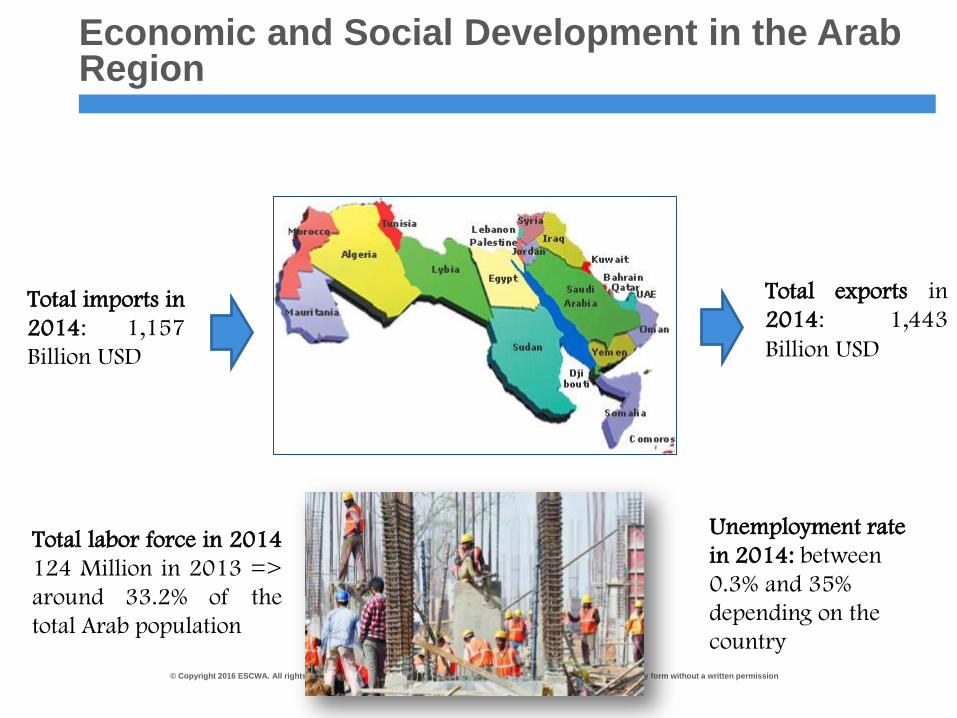
Economic and Social Development in the Arab Region
Total exports in
2014: 1,443
Billion USD
Total imports in
2014: 1,157
Billion USD
Total labor force in 2014
124 Million in 2013 =>
around 33.2% of the
total Arab population
Unemployment rate
in 2014: between
0.3% and 35%
depending on the
country

© Copyright 2016 ESCWA. All rights reserved. No part of this presentation in all its property may be used or reproduced in any form without a written permission
Economic and social indicators in the Arab region
Total current GDP of Arab Countries
2,757 Billion USD in 2014
2,717 Billion USD in 2013
Growth Rate= 1.5%
vs 3% (2012-2013)
• Decline in oil export revenues (decline in
Oil prices)
• Decline in the stability of oil production
Political Instability in some countries

© Copyright 2016 ESCWA. All rights reserved. No part of this presentation in all its property may be used or reproduced in any form without a written permission
Inter-Arab Trade Agreements and Zones
• Agreement to Facilitate the development of trade among Arab
countries (1981,1997)
• Greater Arab Free Trade Area/GAFTA (~ all Arab Countries,
2005)
• Agadir Agreement (Egypt, Jordan, Morocco, Tunisia, 2001)
• Council of Arab Economic Unity (Egypt, Iraq, Jordan, Kuwait,
Libya, Mauritania, Palestine, Saudi Arabia, Sudan, Tunisia,
Syria, UAE, Yemen)
• Arab Maghreb Union (Algeria, Tunisia, Libya, Mauritania and
Morocco)
• Gulf Cooperation Council (Bahrain, Kuwait, Oman, Qatar,
Saudi Arabia, and the United Arab Emirates)
• Treaty of Joint Defense and Economic Co-operation of the
League of Arab States

© Copyright 2016 ESCWA. All rights reserved. No part of this presentation in all its property may be used or reproduced in any form without a written permission
Industrial Structure in the Arab Region
Total industrial output in 2014 = 1,214 Billion USD equivalent to
44% of the total Arab GDP
Decrease in 5.1% compared to 2013
17.4% of total Arab workforce in the industrial sector
in the contribution of the
mining and quarrying
industry in GDP from
38% in 2013 to 34.2% in
2014
Manufacturing
industries contribution
in GDP from 9.1% in
2013 to 9.8% in 2014
=> Growth rate of 9%
in the contribution of
commodity
production sector from
59.7% in 2013 to
57.3% in 2014

© Copyright 2016 ESCWA. All rights reserved. No part of this presentation in all its property may be used or reproduced in any form without a written permission
• Food, beverages and tobacco
• Textile and leather products
• Wearing apparel, dressing and dyeing fur
• Paper products, publishing and printing
• Wood products including furniture
• Basic metals
• Chemical products, coal, rubber and plastics
• Coke, refined petroleum and nuclear fuel
• Non-metallic mineral products
• Office accounting and computing machinery
• Electrical machinery and apparatus
• Fabricated metal products
• Machinery and equipment
Industrial Structure in the Arab Region
• Food, beverages and tobacco
• Textile and leather products
• Wearing apparel, dressing and dyeing fur
• Paper products, publishing and printing
• Wood products including furniture
• Basic metals
• Chemical products, coal, rubber and plastics
• Coke, refined petroleum and nuclear fuel
• Non-metallic mineral products
• Office accounting and computing machinery
• Electrical machinery and apparatus
• Fabricated metal products
• Machinery and equipment
Directly related
to the Value
Chains of RE
Technologies

© Copyright 2016 ESCWA. All rights reserved. No part of this presentation in all its property may be used or reproduced in any form without a written permission
Jordan: RE Current State
RE & EE Law N⁰13, 2012: The Law was issued in April 2012
The by-laws and regulations related to RE projects and electricity generation:
1- Tax Exemptions By-law
2- The Reference Price List which includes the indicative prices for each type of Renewable Source
3- Sale of Electrical Energy generated from Small RE Systems (Net Metering –
Roof Tops)
4- Cost of Connecting RE Facility to Distribution Grid
5 -Electric Power Wheeling Directives
Target Date 2020
Wind 1,200 MW
PV 500 MW
CSP 100 MW
Biomass 50 MW
Geothermal 0
Total 1,850 MW
10% from
electricity
generation
Country Capacity by 2018: 1132 MW
20% of the installed generated capacity
9% contribution in electricity generation

© Copyright 2016 ESCWA. All rights reserved. No part of this presentation in all its property may be used or reproduced in any form without a written permission
Jordan: Main Industries
• The Jordanian authorities are encouraging foreign investments, by setting
special conditions for the investors at the thirteen special economic zones
• Jordan's import policy theoretically => promotes domestic manufacturing
industries by ensuring their access to cheaper imported capital goods, raw
materials, and other intermediate inputs rather than granting them monopoly
markets.
• Main Industries:
Mineral and Mining Sector (5th World producer of Potash, 5th world
producer/4th world exporter of Phosphate, Fertilizers, chemicals, cement,
refineries)
Plastics, Paper, packaging
Publishing, glass and rubber products, electrical equipment, and
machinery--each of which (< 1 %) of total manufacturing output value
Real estate market
Apparel and textiles (30% of Jordanian exports=> 55,000 workers)
Pharmaceuticals
Agriculture and Food

© Copyright 2016 ESCWA. All rights reserved. No part of this presentation in all its property may be used or reproduced in any form without a written permission
Jordan: Existing RE Local Manufacturing
• Some industries are currently manufacturing PV system components
according to national and International standards to meet either local
or non-local demands
• Other industries are producing PV components but not according to
national standards. However with technical and financial support
they can upgrade their supply chain to comply with the standards.
Component Number of Industries
Connection boxes 5
Cables 5
Frames 8
PV Modules 1
Transformers 1
Component Number of Industries
Connection boxes 8
Cables -
Frames 2
PV Modules -
Transformers 1

© Copyright 2016 ESCWA. All rights reserved. No part of this presentation in all its property may be used or reproduced in any form without a written permission
Jordan RE Local Manufacturing: Potential
- Well Defined Target
- RE and EE law since 2013
- Institutional Framework (Net-metering for residential, FIT)
- Financial Support (JREEEF, Exemptions…)
- Direct Project Submittal
- PPA and IPPs
- Standards available for PV components
- No Environmental impact assessment needed for PV
technologies
- PV: Mature and easy installed technology leading to
a large market potential
- PV: Available technical skills
- Easy procedure for international investments
- Mandatory local contribution by 20% in the bidding
including EPC and O&M
Creation of
Local
Market
Potential
for
manufactur
-ing
Lack in
Wind and
CSP

© Copyright 2016 ESCWA. All rights reserved. No part of this presentation in all its property may be used or reproduced in any form without a written permission
Jordan RE Local Manufacturing: Gaps
- RE electricity generated tariffs fixed
- PPA for 20 years and not related to fuel prices causing
high PBPs in many cases
- Limited space especially in Urban Areas
- Small grid capacity but being upgraded through the
“Green Corridor”
- Limited R&D- No local testing facilities
- Regional Instability- High Land Cost especially in Urban Areas- Although subsidized, the electricity cost is high
compared to GCC => shutting down some existingindustries
Local Market
Manufacturing
Technical

© Copyright 2016 ESCWA. All rights reserved. No part of this presentation in all its property may be used or reproduced in any form without a written permission
Lebanon: RE Current State
Policy Paper for the Electricity sector (2010)
NEEAP (2011-2015)
Net-metering
NREAP (2016-2030)
Target Date 2020
Wind MW
PV MW
CSP MW
Biomass MW
Geothermal
Total MW
12% from
electricity
generation
Country Capacity end 2015: 20 MW

© Copyright 2016 ESCWA. All rights reserved. No part of this presentation in all its property may be used or reproduced in any form without a written permission
Lebanon: Main Industries
Rubber and plastic products
5%
Printed matter and recorded media
4%
Machinery and Equipment
3%
Other non-metallic mineral products
12%
Fabricated metal products
11%
Electric machinery and apparatus
10%
Chemicals and man-made fibres
7%
Pulp, paper and paper products
6%
Furniture and other manufactured goods
7%
Other activities9%
Food products and beverages
26%

© Copyright 2016 ESCWA. All rights reserved. No part of this presentation in all its property may be used or reproduced in any form without a written permission
Lebanon: Existing RE Local Manufacturing
• Cables
• Transformers
• Structure (steel, aluminum,…)
• EPC
• O&M
• Control and automation
• Inverters

© Copyright 2016 ESCWA. All rights reserved. No part of this presentation in all its property may be used or reproduced in any form without a written permission
Lebanon RE Local Manufacturing: Potential
- Well Defined Target
- Institutional Framework (Net-metering)
- Currently Optimizing the mix
- Qualified and experienced managers, engineers and
technicians
- Logistics for import and export
- Financial incentives for the industrial sector (through Central
Bank of Lebanon)
Creation of
Local
Market
Potential
for
manufactur
-ing
Technical

© Copyright 2016 ESCWA. All rights reserved. No part of this presentation in all its property may be used or reproduced in any form without a written permission
Lebanon RE Local Manufacturing: Gaps
- Absence of minimum threshold of local content
- Weak Public Private Partnership
- Limited R&D
- No local testing facilities
- Regional instability
- High Land Cost especially in Urban Areas
- High Energy Cost
- Power Shortage
Local Market
Manufacturing
Technical

© Copyright 2016 ESCWA. All rights reserved. No part of this presentation in all its property may be used or reproduced in any form without a written permission
UAE: RE current State
• Dubai Integrated Energy Strategy (2030)
RE TargetsTarget
datesTotal
MW %
Abu Dhabi 460 7 2020
Dubai 3000 15 2030
RE Technology MW Project Total
PV 200 Dubai Solar Park Phase 2
550PV 350 Abu Dhabi Solar Park (including Noor 1
Noor 1 project)

© Copyright 2016 ESCWA. All rights reserved. No part of this presentation in all its property may be used or reproduced in any form without a written permission
UAE: Main Industries
• Oil and Gas
• Free Trade Zone: Jebel Ali ,Sharjah and Ajman
• Advertising, Market Research, Public Relations, Media and
Entertainment
• Engineering, construction and real estate
• Retail/trade and logistics
• Production/manufacturing, automotive and ancillary:
• Petroleum products
• Chemicals
• Rubber and plastic products (PVC and polyethylene sheets,
tubes and other materials)
• Basic metal industries
• Metal products
• Machinery & equipment
• Electrical equipment & parts

© Copyright 2016 ESCWA. All rights reserved. No part of this presentation in all its property may be used or reproduced in any form without a written permission
UAE: Existing RE local manufacturing
• PV module assembly (2 factories)
• Cables
• Transformers
• Structure (steel, aluminum,…)
• EPC
• O&M
• Unemployment: 4.1%

© Copyright 2016 ESCWA. All rights reserved. No part of this presentation in all its property may be used or reproduced in any form without a written permission
UAE RE Local Manufacturing: Potential
- Well Defined Target
- Institutional Framework (Net-metering)
- Currently revising energy policy (target to be 24% clean
energy on 2021) => Optimizing the mix
- Easy procedure for international investments
- Logistics for import and export
- GCC trade (tax free)
Creation of
Local
Market
Potential for
manufacturing

© Copyright 2016 ESCWA. All rights reserved. No part of this presentation in all its property may be used or reproduced in any form without a written permission
UAE RE Local Manufacturing: Gaps
- No clear Strategy and Regulatory framework (project by
project)
- No minimum threshold for local content contribution
- Weak Public Private Partnership
- Limited R&D- No local testing facilities
- High Land Cost especially in Urban Areas- Instable Cost of Energy- Management is expensive- Non Sustainable workforce ????
Local Market
Manufacturing
Technical

© Copyright 2016 ESCWA. All rights reserved. No part of this presentation in all its property may be used or reproduced in any form without a written permission
General Recommendations based on Gaps
• R&D shouldn’t be optional but rather a must to keep the market
(0.1% increase in panels efficiency is needed in order to think
about establishing a PV module manufacturing facility)
• Need of Mapping and integration between R&D and industrial
applications
• Need of cooperation between all institutions
• O&M need more capacity building than it seems
• Technical skills can be easily obtained (1 or 2 trainings)
• EPC, business, finance skills are available from earlier experience
• Short term Visibility => assembly related to the local demand
(some elements of the value chain e.g. 70% of the inverter are
components and 30% (assembly, testing...) could be locally done)
• Long term Visibility => export (more elements in the value chain)

© Copyright 2016 ESCWA. All rights reserved. No part of this presentation in all its property may be used or reproduced in any form without a written permission
General Recommendations based on Gaps
government clear vision
financial sector (currency state, banking sector, incentives…)
institutions (R&D,
capacity building,
NGO)Infrastructure (energy, land,
roads, logistics,..)
time frame protection for
industries
access to markets: free
zones, tax holidays

Economic And Social Commission For Western Asia
THANK YOU