Embed Size (px)
Citation preview

Economic and Market Report
EU Automotive Industry Quarter 2 2017
September 2017

ACEA Economic and Market Report: Quarter 2 2017 – September 2017 1
CONTENTS Passenger cars ......................................................................................................................... 2
Registrations ....................................................................................................................... 2
World ............................................................................................................................... 2
The European Union ........................................................................................................ 4
Passenger car registrations by fuel type ....................................................................... 6
Production .......................................................................................................................... 10
World .............................................................................................................................. 10
The European Union ....................................................................................................... 13
Trade .................................................................................................................................. 14
Imports ........................................................................................................................... 15
Exports ........................................................................................................................... 16
Commercial vehicles ............................................................................................................... 17
Registrations in the EU ....................................................................................................... 17
New light commercial vehicles (LCV) up to 3.5 tonnes ................................................ 19
New medium and heavy commercial vehicles (MHCV) over 3.5 tonnes ...................... 20
New medium and heavy buses and coaches (MHBC) over 3.5 tonnes .......................... 21
Global production outlook ................................................................................................. 22
Trade ................................................................................................................................. 24
Imports ........................................................................................................................... 25
Exports .......................................................................................................................... 26

ACEA Economic and Market Report: Quarter 2 2017 – September 2017 2
PASSENGER CARS
REGISTRATIONS
WORLD
From January to June 2017, passenger car registrations across Europe increased by 4.3% to 9.5
million units. After a strong start (7.2% growth in the first quarter), EU registrations slowed down
during the second quarter. With 8.2 million passenger cars sold during the first six months of 2017,
EU results were 4.7% higher than in the same period last year. After two strong years, the EU
passenger car market is expected to grow at a slower pace, of around 2%, in 2017.
Halfway in the year, the Russian car market showed some signs of recovery – registrations went up
by 6.9%. Ukraine continued the positive momentum from last year, recording a substantial
increase in car demand (+36.7%). The Turkish market saw demand decline by 9.6%, still affected
by an unstable political climate following last year’s coup attempt.
Six months into 2017, Japanese registrations were 11.3% higher than in the same period last year,
with domestic sales recovering after the government decided to delay a hike in consumption tax to
October 2019. South Korea, on the other hand, posted a 3.4% decline compared to 2016, the result
of an uncertain politico‐economic environment following the impeachment of its President in
March.
In the United States, car volumes went down by 3.3% over the first six months of the year, totalling
about 7 million vehicles sold and representing 17.7% of the global market.
Through the first half of 2017, passenger car demand in South America showed signs of recovery
(+11.0%) after last year’s significant losses (due to high inflation, currency devaluation and low
consumer confidence). Brazilian sales also increased (+5.2%), after a negative first quarter.
Chinese car registrations slowed down in the second quarter of the year after a strong start of 2017
(+8.0% in Q1 and +1.6% in Q2), resulting in an increase of 4.6% over the first semester. However,
China still held the highest market share in global car sales (27.7%).
Globally, 39 million passenger cars were sold in the first half of 2017, 3.5% more than in same period
last year.

ACEA Economic and Market Report: Quarter 2 2017 – September 2017 3
Table 1: World new passenger car registrations
H1 20171 H1 2016 % change 17/16 % share 2017
EUROPE 9,542,309 9,152,366 +4.3 24.5
EU2 8,210,921 7,844,316 +4.7 21.1
EFTA 250,555 247,911 +1.1 0.6
RUSSIA 666,244 623,180 +6.9 1.7
TURKEY 305,924 338,482 ‐9.6 0.8
UKRAINE 35,550 26,011 +36.7 0.1
OTHERS‐EUROPE3 73,115 72,466 +0.9 0.2
NORTH AMERICA4 8,302,161 8,499,250 ‐2.3 21.3
of which the US 6,886,439 7,120,095 ‐3.3 17.7
SOUTH AMERICA 1,642,155 1,479,075 +11.0 4.2
of which Brazil 852,832 810,921 +5.2 2.2
ASIA 17,416,845 16,549,662 +5.2 44.7
CHINA 10,793,863 10,322,932 +4.6 27.7
JAPAN 2,356,158 2,117,021 +11.3 6.0
INDIA 1,545,649 1,445,989 +6.9 4.0
SOUTH KOREA 749,866 775,927 ‐3.4 1.9
OTHERS‐ASIA5 1,971,309 1,887,793 +4.4 5.1
MIDDLE EAST/AFRICA 2,090,329 1,997,864 +4.6 5.4
WORLD 38,993,799 37,678,217 +3.5 100.0
Source: IHS MARKIT, ACEA
1 Provisional figures
2 Data for Malta not available
3 Includes Belarus, Bosnia‐Herzegovina, Kazakhstan, Macedonia, Serbia and Uzbekistan
4 Based on production type
5 Includes Hong Kong, Taiwan and all the other South Asian countries, excluding India

ACEA Economic and Market Report: Quarter 2 2017 – September 2017 4
THE EUROPEAN UNION
Over the first half of 2017, demand for passenger cars in the EU increased by 4.7%, totalling more
than 8 million units registered. Growth slowed down compared to the first quarter, mainly the
result of declines observed in April due to the Easter holidays.
Most of the major markets saw demand increase during the first six months of the year, with Italy
(+8.9%), Spain (+7.1%), Germany (+3.1%) and France (+3.0%) posting growth. Only the United
Kingdom registered a minor decline (‐1.3%) in new car registrations.
Despite this positive trend, the EU passenger car market is expected to slow down in 2017 after two
strong years. For the full year, we currently forecast a marginal rise in car sales of around 1.5‐2% (a
slight upward revision from ACEA’s initial January forecast of 1% growth).
Table 2: Top 5 – New passenger car registrations in the EU
H1 2017 H1 2016 % change 17/16
GERMANY 1,787,026 1,733,839 +3.1
UNITED KINGDOM 1,401,811 1,420,636 ‐1.3
ITALY 1,136,331 1,043,388 +8.9
FRANCE 1,135,267 1,102,429 +3.0
SPAIN 667,494 623,234 +7.1
EU6 8,210,921 7,844,316 +4.7
Source: ACEA
6 Data for Malta not available

ACEA Economic and Market Report: Quarter 2 2017 – September 2017 5
Figure 1: New passenger car registrations in the EU | 12‐month trend
Source: ACEA

ACEA Economic and Market Report: Quarter 2 2017 – September 2017 6
Passenger car registrations by fuel type
In the first half of 2017, EU demand for alternative fuel vehicles (AFV) continued the positive
momentum from the first quarter. Registrations went up by 37.8% compared to the same period
last year. A total of 417,894 cars with alternative powertrains were registered in the EU, accounting
for 5.1% of all passenger cars sold in the first six months of 2017. Electrically‐chargeable vehicles
(ECVs) accounted for 1.2% of total car sales.
Registrations of hybrid vehicles (HEV) and ECVs grew considerably (up +61.1% and +37.7%
respectively); the latter supported by significant growth in demand for both battery (+49.5%) and
plug‐in electric cars (+27.5%). Registrations of new cars powered by propane or natural gas also
increased during the first six months of the year (+6.9%), largely the result of an uplift in
registrations of LPG‐fuelled cars.
Table 3: New passenger car registrations in the EU by alternative fuel type
H1 2017 H1 2016 % change 17/16
ECV7 96,888 70,363 +37.7
Of which BEV 46,709 31,252 +49.5
Of which PHEV 48,407 37,953 +27.5
HEV8 214,208 132,953 +61.1
Other AFV9 106,798 99,925 +6.9
Total AFV 417,894 303,241 +37.8
Source: ACEA
7 Electrically‐chargeable vehicles (ECV): battery electric (BEV), extended‐range electric (EREV), fuel cell
electric (FCEV) and plug‐in hybrid electric vehicles (PHEV)
8 Hybrid electric vehicles (HEV): full and mild hybrids
9 Alternative fuel vehicles other than electric: natural gas (NGV), LPG‐fuelled and ethanol (E85) vehicles

ACEA Economic and Market Report: Quarter 2 2017 – September 2017 7
All five big markets posted double‐digit increases, thereby significantly contributing to the EU’s
positive performance. Spain and Germany saw the largest increases over the period, with
respectively +83.8% and +79.7%, followed by the United Kingdom (+27.5%), France (+26.5%) and
Italy (+17.7%). Growth in most of these countries was fully driven by the electric and hybrid‐electric
segments. The UK, Germany and France accounted for the largest numbers of new electrically‐
chargeable cars. The positive performance of the Italian market, on the other hand, was mainly the
result of recovering demand for cars running on LPG.
Figure 2: Alternative fuel car registrations in the five big markets | H1 2017
Source: ACEA

ACEA Economic and Market Report: Quarter 2 2017 – September 2017 8
Drop in diesel sales offset by increase in petrol vehicles
In the first half of 2017, about 46% of all new passenger cars registered in Western Europe ran on
diesel; almost four percentage points lower than in the same period last year. In the EU‐15, diesel’s
market share fell from 50.2% to 46.3% of total registrations.
However, this drop was almost completely offset by an increase in the sales of petrol vehicles.
Petrol vehicles are now the most sold vehicle type in the EU‐15, accounting for 48.5% of new
passenger car sales – followed by diesel (46.3%) and alternatively‐powered cars (5.2%).
Results were diverse across Western Europe: the market share of diesel increased slightly in
Denmark, Italy, the Netherlands and Iceland, while the largest declines were observed in
Luxembourg, Greece and Spain. Ireland remains the country with the highest diesel market share
(66%), followed by Portugal and Italy.
Figure 3: New passenger car in the EU‐15 by fuel type, % share | H1 2017

ACEA Economic and Market Report: Quarter 2 2017 – September 2017 9
Table 4: Share (%) of diesel in new passenger cars in Western Europe
H1 2017 H1 2016
AUSTRIA 51.1 57.3
BELGIUM 46.2 51.2
DENMARK 35.9 35.2
FINLAND 32.9 33.9
FRANCE 47.9 52.8
GERMANY 41.2 46.8
GREECE 44.4 54.0
IRELAND 66.0 70.4
ITALY 56.2 54.7
LUXEMBOURG 53.2 63.5
NETHERLANDS 17.8 17.6
PORTUGAL 61.4 63.5
SPAIN 50.0 57.0
SWEDEN 51.5 53.4
UNITED KINGDOM 43.8 47.9
EU‐15 46.3 50.2
ICELAND 45.1 43.7
NORWAY 25.8 31.8
SWITZERLAND 37.1 38.9
EFTA 34.1 36.9
WESTERN EUROPE 45.9 49.7
Source: AAA

ACEA Economic and Market Report: Quarter 2 2017 – September 2017 10
PRODUCTION
WORLD
European passenger car production totalled more than 10 million units during the first half of 2017,
up 1.5% compared to the same period one year ago. Growth was mainly driven by the recovery of
production in Eastern Europe, and Ukraine in particular (+149.3%). Turkish and Russian production
also increased significantly, up 19.6% and 12.6% respectively.
Production in the United States remained stable as domestic car sales decelerated, with total
output amounting to 4.7 million units – representing 12% of global car production.
Passenger car production in South America showed signs of recovery throughout the first half of
the year (+2.5%), with more than 1 million units built. Brazil was the main driver of this trend,
accounting for more than 82% of the region’s output.
Chinese production growth in the first half of 2017 slowed down compared to 2016’s strong figures
– output grew by 2.2%, reaching 10.3 million units in total. This slowdown can mainly be attributed
to the tax cut policy that will enter into force at the end of this year, resulting in slack domestic
demand already now. Still, China maintained its leading position among global passenger car
producers, accounting for more than 26% of worldwide car production.
Japanese output increased over the first six months of 2017 (+5.9%), reaching a total of 4 million
units. Production in South Korea also grew during the same period, although at a more modest
pace (+1.2%).
Indian passenger car production continued to grow (+9.0%) after starting the year positively,
reaching almost 2 million units built in first semester of 2017. Thailand and Indonesia, on the other
hand, posted declines – car production went down by 5.2% and 3.0% respectively.
Globally, 39 million passenger cars were produced during the first half of the year, or 2.9% more
than in the same period last year.
ACEA Economic and Market Report: Quarter 2 2017 – September 2017 11
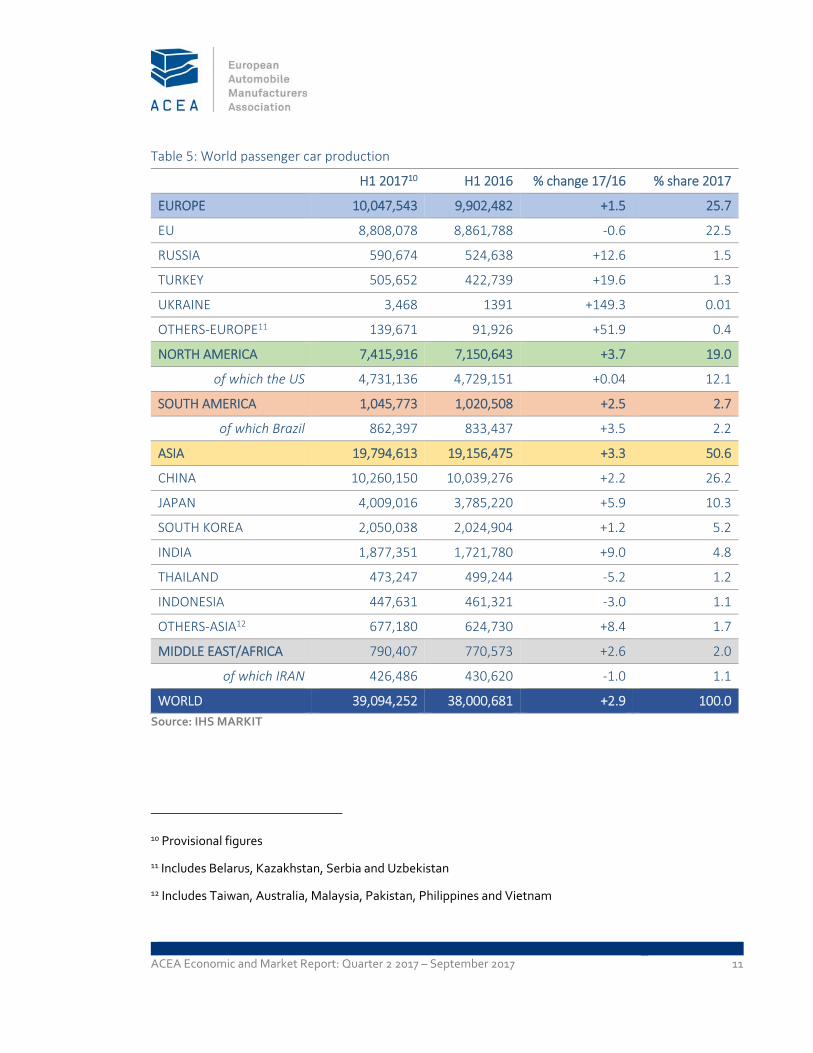
Table 5: World passenger car production
H1 201710 H1 2016 % change 17/16 % share 2017
EUROPE 10,047,543 9,902,482 +1.5 25.7
EU 8,808,078 8,861,788 ‐0.6 22.5
RUSSIA 590,674 524,638 +12.6 1.5
TURKEY 505,652 422,739 +19.6 1.3
UKRAINE 3,468 1391 +149.3 0.01
OTHERS‐EUROPE11 139,671 91,926 +51.9 0.4
NORTH AMERICA 7,415,916 7,150,643 +3.7 19.0
of which the US 4,731,136 4,729,151 +0.04 12.1
SOUTH AMERICA 1,045,773 1,020,508 +2.5 2.7
of which Brazil 862,397 833,437 +3.5 2.2
ASIA 19,794,613 19,156,475 +3.3 50.6
CHINA 10,260,150 10,039,276 +2.2 26.2
JAPAN 4,009,016 3,785,220 +5.9 10.3
SOUTH KOREA 2,050,038 2,024,904 +1.2 5.2
INDIA 1,877,351 1,721,780 +9.0 4.8
THAILAND 473,247 499,244 ‐5.2 1.2
INDONESIA 447,631 461,321 ‐3.0 1.1
OTHERS‐ASIA12 677,180 624,730 +8.4 1.7
MIDDLE EAST/AFRICA 790,407 770,573 +2.6 2.0
of which IRAN 426,486 430,620 ‐1.0 1.1
WORLD 39,094,252 38,000,681 +2.9 100.0
Source: IHS MARKIT
10 Provisional figures
11 Includes Belarus, Kazakhstan, Serbia and Uzbekistan
12 Includes Taiwan, Australia, Malaysia, Pakistan, Philippines and Vietnam

ACEA Economic and Market Report: Quarter 2 2017 – September 2017 12
Figure 4: Top 10 – World passenger car production
Source: IHS MARKIT

ACEA Economic and Market Report: Quarter 2 2017 – September 2017 13
THE EUROPEAN UNION
Over the first half of this year, EU passenger car production slowed down to reach 8.8 million units
built (‐0.6% compared to the same period one year ago). Domestic demand is expected to further
stabilise in the European Union this year. However, the EU still accounted for 22.5% of global car
production, making it the world’s second largest producer after China.
Among Western Europe’s main producing countries, output grew by 8.0% in Italy, 5.7% in the
United Kingdom and 1.8% in France. So far in 2017, production of cars declined in Spain (‐4.5%) and
Germany (‐3.4%).
In Central Europe results were diverse, with production falling in Poland (‐16.0%) and Hungary
(‐7.4%), while the Czech Republic (+2.8%) and Slovakia (+2.1%) performed better than last year.
Table 6: Top 10 – Passenger car producers in the EU
H1 201713 H1 2016 % change 17/16
GERMANY 2,867,258 2,966,904 ‐3.4
SPAIN 1,203,689 1,260,003 ‐4.5
UNITED KINGDOM 950,405 899,292 +5.7
FRANCE 892,920 877,449 +1.8
CZECH REPUBLIC 731,077 711,457 +2.8
SLOVAKIA 505,950 495,403 +2.1
ITALY 419,439 388,198 +8.0
HUNGARY 239,109 258,251 ‐7.4
POLAND 223,862 266,484 ‐16.0
BELGIUM 189,160 193,927 ‐2.5
EU 8,808,078 8,861,788 ‐0.6
Source: IHS MARKIT
13 Provisional figures

ACEA Economic and Market Report: Quarter 2 2017 – September 2017 14
TRADE
From January to June 2017, the EU exported about 3 million passenger cars worth around €63
billion. EU car exports increased compared to the same period last year, both in value (+2.0%) and
in volume terms (+7.6%), although at a lower rate than in the first quarter.
Over the same period, car imports also increased – totalling 1.6 million units, or +14.5% compared
to the first half of 2016. Added up, this comes down to a trade surplus of about €43 billion – slightly
less than one year ago (‐2.3%).
Table 7: EU passenger car trade
Trade in value (€m) H1 2017 H1 2016 % change 17/16
IMPORTS 20,614 18,334 +12.4
EXPORTS 63,363 62,099 +2.0
TRADE BALANCE 42,749 43,764 ‐2.3
Trade in volume (units) H1 2017 H1 2016 % change 17/16
IMPORTS 1,589,427 1,388,191 +14.5
EXPORTS 2,918,490 2,712,446 +7.6
Source: EUROSTAT

ACEA Economic and Market Report: Quarter 2 2017 – September 2017 15
IMPORTS
During the first half of 2017, EU imports from Turkey and South Korea increased considerably, both
in value (respectively +49.3% and +20.3%) and volume terms (up 36.3% and 16.5%).
However, imports from Japan and the United States declined – especially in value terms, going
down by 14.2% and 8.3%.
In total, the EU imported about 1.6 million passenger cars worth almost €21 billion.
Table 8: Origin of most passenger car imports
Trade in value (€m) H1 2017 H1 2016 % change 17/16
WORLD 20,614 18,334 +12.4
TURKEY 4,197 2,811 +49.3
JAPAN 3,841 4,477 ‐14.2
UNITED STATES 3,340 3,642 ‐8.3
SOUTH KOREA 2,817 2,342 +20.3
MEXICO 1,829 1,024 +78.5
Source: EUROSTAT
Table 9: Origin of most passenger car imports
Trade in volume (units) H1 2017 H1 2016 % change 17/16
WORLD 1,589,427 1,388,191 +14.5
TURKEY 409,625 300,632 +36.3
JAPAN 271,719 280,039 ‐3.0
SOUTH KOREA 236,132 202,779 +16.5
MOROCCO 129,054 101,663 +26.9
UNITED STATES 123,721 126,063 ‐1.9
Source: EUROSTAT

ACEA Economic and Market Report: Quarter 2 2017 – September 2017 16
EXPORTS
From January to June 2017, EU passenger car exports to the United States declined slightly
(‐0.8%), after a positive start of the year. Nevertheless, the US remained the EU's most valuable
export market for passenger cars, with exports roughly amounting to €18 billion – up 1.8%
compared to the first half of 2016.
The value of EU exports to Japan and China grew over the same period, respectively by +13.5% and
+7.5%. Strong growth was also observed in EU export volumes to Nigeria – up 255.2% compared to
last year. In contrast, car exports to Turkey dropped significantly during the first semester of 2017
(‐23.7%).
Table 10: Main destinations of EU passenger car exports
Trade in value (€m) H1 2017 H1 2016 % change 17/16
WORLD 63,363 62,099 +2.0
UNITED STATES 18,385 18,060 +1.8
CHINA 10,728 9,977 +7.5
SWITZERLAND 3,844 3,659 +5.1
JAPAN 3,830 3,375 +13.5
SOUTH KOREA 2,955 4,238 ‐30.3
Source: EUROSTAT
Table 11: Main destinations of EU passenger car exports
Trade in volume (units) H1 2017 H1 2016 % change 17/16
WORLD 2,918,490 2,712,446 +7.6
UNITED STATES 546,280 550,804 ‐0.8
CHINA 270,068 239,394 +12.8
NIGERIA 226,426 63,750 +255.2
TURKEY 219,304 287,367 ‐23.7
SWITZERLAND 145,656 144,636 +0.7
Source: EUROSTAT

ACEA Economic and Market Report: Quarter 2 2017 – September 2017 17
COMMERCIAL VEHICLES
REGISTRATIONS IN THE EU
During the first half of 2017, demand for new commercial vehicles in the European Union slowed
down after a strong start of the year. Due to the Easter holidays, the market declined in April
(‐7.2%) before returning to growth in May (+9.0%) and June (+2.5%). Overall, demand grew by 4.1%
across the EU, with 1.2 million new commercial vehicles registered so far in 2017.
Growth was sustained across all segments, but demand was especially strong for new light
commercial vehicles (+4.7%) – with vans accounting for 83% of total commercial vehicle sales.
Most of the major markets performed better than in the same period last year, with Spain posting
the strongest results over the period (+14.2%), followed by Italy (+8.7%), France (+6.0%) and
Germany (+2.1%). The UK market, however, contracted (‐3.1%) over the first half of the year.
Table 12: New commercial vehicle registrations in the EU | by type
H1 2017 H1 2016 % change 17/16
LCV ≤ 3,5t14 1,014,969 969,625 4.7%
MHCV > 3,5t15 187,432 184,950 1.3%
MHBC > 3,5t16 19,709 19,304 2.1%
TOTAL CV 1,222,110 1,173,879 4.1%
Source: ACEA
14 New light commercial vehicles (LCV) up to 3.5 tonnes
15 New medium and heavy commercial vehicles (MHCV) over 3.5 tonnes
16 New medium and heavy buses and coaches (MHBC) over 3.5 tonnes

ACEA Economic and Market Report: Quarter 2 2017 – September 2017 18
Figure 5: New commercial vehicle registrations in the five big EU markets
Source: ACEA

ACEA Economic and Market Report: Quarter 2 2017 – September 2017 19
New light commercial vehicles (LCV) up to 3.5 tonnes
Six months into the year, more than one million new vans were registered in the European Union,
up 4.7% compared to the same period one year ago.
The United Kingdom (‐3.7%) was the only major market with falling demand, while light
commercial vehicle registrations saw significant gains in Spain (+16.3%), Italy (+6.5%), France
(+6.4%) and Germany (+3.3%).
Figure 6: New light commercial vehicle registrations in the five big EU markets
Source: ACEA

ACEA Economic and Market Report: Quarter 2 2017 – September 2017 20
New medium and heavy commercial vehicles (MHCV) over 3.5 tonnes17
So far in 2017, 187,432 new heavy commercial vehicles were registered in the European Union. That
is only 1.3% more than in the first semester of last year, the result of a slowdown in demand for new
trucks in April and June 2017 (down 9.8% and 1.7% respectively).
Results were diverse among the five big markets, with Italy recording the strongest performance
(+21.5%), followed by France, (+5.7%) and the UK (+2.3%). By contrast, truck registrations in
Germany and Spain declined over the same period (‐1.6% and ‐1.5% respectively).
Figure 7: New medium and heavy commercial vehicle registrations in the five big EU markets
Source: ACEA
17 Excluding buses & coaches

ACEA Economic and Market Report: Quarter 2 2017 – September 2017 21
New medium and heavy buses and coaches (MHBC) over 3.5 tonnes
Halfway into the year, the EU bus and coach market grew by 2.1%, counting 19,709 new vehicles
registered.
Demand was mainly driven by the Italian (+49.6%) and Spanish (+16.5%) markets, which saw the
strongest gains, while new bus and coach registrations dropped significantly in France (‐18.4%) and
the United Kingdom (‐10.4%).
Figure 8: Top 5 – New medium and heavy bus and coach registrations in the EU | by country
Source: ACEA

ACEA Economic and Market Report: Quarter 2 2017 – September 2017 22
GLOBAL PRODUCTION OUTLOOK
European18 commercial vehicle production is expected to remain stable in 2017 at around 3.4
million units, with domestic demand in Western Europe stabilising this year. Production in the
United Kingdom, Italy and Germany is likely to contract by the end of the year, affecting the LCV
segment in particular. However, total 2017 output probably will be sustained by recovering demand
in Russia and Ukraine
Commercial vehicle production in China19 will remain more or less stable throughout the year
(+0.5%), with slightly more than 6 million units, as demand for vans and buses is expected to
decelerate during the year.
North America’s output is projected to remain similar to last year’s results, with more than 42
million commercial vehicles produced. Japanese and South Korean commercial vehicle production
will likely face a slight drop to around 1.57 million units, about 1% less than in 2016.
Commercial vehicle production in South America is expected to slow down (‐2.2%) to around 0.6
million units in 2017 – largely the result of the region’s fragile economic situation.
Production trends in the Middle East and Africa are showing signs of improvement, also in part due
to the Iranian industry picking up speed again. The region is expected to produce around 0.6 million
commercial vehicles throughout 2017, up 16.2% compared to the year before.
Commercial vehicle output in South Asia is likely to grow significantly (+5.9%) this year thanks to
robust domestic demand, especially in the Philippines and Thailand.
18 Includes Turkey and CIS countries
19 Includes Hong Kong and Taiwan

ACEA Economic and Market Report: Quarter 2 2017 – September 2017 23
Figure 9: World commercial vehicle production | by region20
Source: IHS MARKIT
20 Provisional figures

ACEA Economic and Market Report: Quarter 2 2017 – September 2017 24
TRADE
During the first half of 2017, the value of EU commercial vehicle exports (including buses) increased
by 5.5% to €5.4 billion, largely driven by the truck segment.
The value of commercial vehicle imports into the EU also grew (+7.6%) over the same period, with
the van segment making a major contribution. Overall, this resulted in a trade surplus of €1.2 billion
over the first six months of the year.
Table 13: EU commercial vehicles (CV), buses and coaches (BC) trade | by type
Trade in value (€m) CV up to 5t CV over 5t + BC Total CV + BC
H1 2017
IMPORTS 3,268 947 4,215
EXPORTS 2,102 3,321 5,424
TRADE BALANCE ‐1,166 2,374 1,208
H1 2016
IMPORTS 2,973 946 3,919
EXPORTS 2,010 3,130 5,140
TRADE BALANCE ‐962 2,183 1,221
% change 17/16
IMPORTS +9.9 +0.1 +7.6
EXPORTS +4.6 +6.1 +5.5
Source: EUROSTAT

ACEA Economic and Market Report: Quarter 2 2017 – September 2017 25
IMPORTS
Halfway in the year, Turkey remained the dominant country of origin of EU commercial vehicle
imports, accounting for 180,570 units – a rather stable performance compared to the same period
last year (‐0.5%). China came second with 46,031 units, recovering from last year’s losses (+23.1%).
Imports of commercial vehicles from the US increased markedly over the first half of 2017
(+102.9%), following a slow start of the year. Impressive growth has also been observed in imports
from India and Canada, mainly focussing on the truck segment.
In total, the EU imported 306,852 commercial vehicles (including buses and coaches) during the
first six months of 2017, or 9.6% more than in the same period last year.
Table 14: Top 10 – Origin of EU commercial vehicle and bus imports
Trade in volume (units) H1 2017 H1 2016 % change 17/16
WORLD 306,852 279,974 +9.6
TURKEY 180,570 181,414 ‐0.5
CHINA 46,031 37,389 +23.1
THAILAND 22,497 21,041 +7.0
SOUTH AFRICA 13,745 9,620 +42.9
MOROCCO 12,065 10,284 +17.3
INDIA 10,913 1,975 +452.6
UNITED STATES 8,803 4,339 +102.9
SWITZERLAND 3,686 3,379 +9.1
CANADA 2,321 50 +4542.0
NORWAY 1,497 1,524 ‐1.8
Source: EUROSTAT

ACEA Economic and Market Report: Quarter 2 2017 – September 2017 26
EXPORTS
EU commercial vehicle exports declined significantly over the first six months of 2017, the result of
a significant drop in exports to Hong Kong (‐95.9%), the United States (‐60.5%) and Turkey
(‐13.0%).
However, exports to Norway (+16.3%), Ukraine (+17.9%), Australia (+20.5%) and Georgia
(+286.4%) grew substantially – exports to the latter were mainly driven by the truck segment.
In total, the EU exported 254,080 commercial vehicles over the first half of 2017, down 52.8%
compared to the same period last year.
Table 15: Top 10 – Destinations of EU commercial vehicle and bus exports
Trade in volume (units) H1 2017 H1 2016 % change 17/16
WORLD 254,080 538,165 ‐52.8
TURKEY 23,956 27,521 ‐13.0
NORWAY 16,060 13,814 +16.3
SWITZERLAND 15,379 14,505 +6.0
UKRAINE 12,700 10,769 +17.9
HONG KONG 11,733 284,689 ‐95.9
AUSTRALIA 11,477 9,522 +20.5
SERBIA 7,463 7,553 ‐1.2
GEORGIA 6,943 1,797 +286.4
MEXICO 6,794 6,455 +5.3
UNITED STATES 6,538 16,535 ‐60.5
Source: EUROSTAT

ACEA Economic and Market Report: Quarter 2 2017 – September 2017 27
ABOUT ACEA
ACEA represents the 15 Europe‐based car, van, truck and bus manufacturers: BMW
Group, DAF Trucks, Daimler, Fiat Chrysler Automobiles, Ford of Europe, Hyundai
Motor Europe, Iveco, Jaguar Land Rover, Opel Automobile, PSA Group, Renault
Group, Toyota Motor Europe, Volkswagen Group, Volvo Cars, and Volvo Group.
More information can be found on www.acea.be or @ACEA_eu.
ABOUT THE EU AUTOMOBILE INDUSTRY
12.6 million people – or 5.7% of the EU employed population – work in the sector.
The 3.3 million jobs in automotive manufacturing represent almost 11% of EU
manufacturing employment.
Motor vehicles account for almost €396 billion in tax contributions in the EU15.
The sector is also a key driver of knowledge and innovation, representing Europe's
largest private contributor to R&D, with more than €50 billion invested annually.
The automobile industry generates a trade surplus of about €90 billion for the EU.
European Automobile Manufacturers' Association (ACEA) Avenue des Nerviens 85 | B‐1040 Brussels | www.acea.be T +32 2 732 55 50 | F +32 738 73 10 | [email protected] | @ACEA_eu