Embed Size (px)
Citation preview

ECONOMIC AND FINANCIAL DEVELOPMENTS IN MALAYSIA IN THE FIRST
QUARTER OF 2015
OVERVIEW
The Malaysian economy grew by 5.6% in the fi rst quarter of 2015
The global economic activity expanded with
divergent growth momentum across economies
in the fi rst quarter of 2015. While the US
economy registered broader improvements,
the economic recovery in the euro area and
Japan progressed at a more gradual pace. In
Asia, growth was sustained by the continued
expansion in domestic demand.
implementation of GST. Private investment
recorded a growth of 11.7% (4Q 2014: 11.1%),
underpinned by capital expenditure in the
manufacturing and services sectors. Growth in
public consumption improved in the fi rst quarter
(4.1%; 4Q 2014: 2.5%), due to higher growth in
supplies and services amid moderate growth in
emoluments. Public investment turned around
to register a positive growth of 0.5% (4Q 2014:
-1.9%) following higher capital spending by the
Federal Government.
On the supply side, growth in the fi rst quarter
was supported by the major economic
sectors. The services sector was underpinned
by growth in all sub-sectors, particularly
consumption-related sub-sectors. Growth in
the manufacturing sector was supported by
stronger performance in the export-oriented
industries, particularly the electronics and
electrical (E&E) cluster. The construction sector
was supported mainly by the non-residential
and residential sub-sectors, while the mining
sector continued to record stronger growth amid
higher crude oil production. Meanwhile, the
agriculture sector contracted as a result of lower
palm oil production, arising from fl ood-related
disruptions.
Infl ation, as measured by the annual change
in the Consumer Price Index (CPI), averaged
signifi cantly lower at 0.7% in the fi rst quarter of
2015 (4Q 2014: 2.8%). The lower infl ation was
mainly attributable to the decline in prices in
the transport category (-7.6%; 4Q 2014: 4.8%),
following the downward revision of domestic
fuel prices in January and February amid lower
global oil prices.
The trade surplus amounted to RM21.3 billion
in the fi rst quarter of 2015 (4Q 2014: RM21.5
billion). Gross exports contracted by 2.5%
(4Q 2014: +0.5%), refl ecting mainly a decline in
the growth of commodity exports and resource-
based manufactured exports, amid lower
commodity prices. Gross imports moderated to
a marginal growth of 0.2% (4Q 2014: 4.6%).
The Malaysian economy registered a growth
of 5.6% in the fi rst quarter of 2015 (4Q 2014:
5.7%), underpinned mainly by the private
sector demand. On the supply side, growth
was supported by the major economic sectors.
On a quarter-on-quarter seasonally-adjusted
basis, the economy recorded a growth of 1.2%
(4Q 2014: 1.8%).
Private sector activity remained the key
driver of growth during the quarter. Private
consumption expanded at a stronger pace of
8.8% (4Q 2014: 7.6%), supported by stable
labour market conditions and higher wage
growth. The strong private consumption
growth was also contributed by the fl ood
relief efforts early in the year, and the front-
loading of household spending prior to the
The economy expanded in the first quarter (at constant 2010 prices)
Source: Department of Statistics, Malaysia
6.3 6.5 5.6 5.7 5.6
0
1
2
3
4
5
6
7
0
50
100
150
200
250
300
1Q 2011
2Q 3Q 4Q 1Q 2012
2Q 3Q 4Q 1Q 2013
2Q 3Q 4Q 1Q 2014
2Q 3Q 4Q 1Q 2015
RM billion Annual change (%)
1
Quarterly BulletinFirst Quarter 2015

The international reserves of BNM amounted to
RM389.7 billion (equivalent to USD105.1 billion)
as at 31 March 2015. This reserve level has
taken into account the quarterly adjustment for
foreign exchange revaluation changes. As at
30 April 2015, the reserves position amounted
to RM392.4 billion (equivalent to USD105.8
billion), sufficient to fi nance 8.0 months of
retained imports and is 1.1 times the short-term
external debt.
Interest rates remained stable
The Monetary Policy Committee (MPC) decided
to maintain the Overnight Policy Rate (OPR) at
3.25% at its meetings during the fi rst quarter
of 2015. At the prevailing level of the OPR,
monetary conditions remained supportive of
economic activity. Refl ecting the unchanged
OPR, the average overnight interbank rate
was relatively stable during the quarter.
Interbank rates of longer maturities continued
to be elevated in January, but subsequently
moderated as funding pressures eased
following BNM’s announcement on 30 January
2015 on the arrangements to facilitate transition
to the full implementation of the Liquidity
Coverage Ratio (LCR) by 2019. For the quarter
as a whole, 3-month KLIBOR decreased from
3.86% to 3.73%. In terms of retail rates, both
deposit and borrowing cost to the economy
were broadly stable throughout the quarter. On
2 January 2015, the Base Rate (BR) replaced
the base lending rate (BLR) as the main
reference rate for new retail fl oating rate loans
and fi nancing facilities. Upon introduction, the
average BR of banks stood at 3.90% where it
remained as at 31 March 2015.
The monetary aggregates continued to expand
in the fi rst quarter. M3, or broad money,
increased by RM35.9 billion on a quarter-on-
quarter basis to record an annual growth rate
of 7.9% as at end-March (end-December
2014: 7.0%). The increase in M3 during the
quarter was driven mainly by the continued
expansion in credit extended to the private
sector by the banking system and lower net
foreign assets. The expansion in broad money,
however, moderated somewhat following lower
net claims on the Government. In the banking
system, liquidity conditions remained ample at
both the institutional and system-wide levels.
The level of surplus liquidity placed with BNM
was marginally lower during the quarter due to
external sector outfl ows.
Total gross fi nancing raised by the private
sector through the banking system and the
capital market amounted to RM282.5 billion
(4Q 2014: RM309.8 billion). On a net basis,
outstanding banking system loans and PDS
expanded by 8.3% as at end-March (end-
December 2014: 8.8%). Loan disbursement to
businesses during the quarter remained healthy,
with higher level of credit extended mainly to
the fi nance, insurance and business services;
mining and quarrying; and education, health and
others sectors on an annual basis. In particular,
fi nancing for SMEs continued to be strong, with
outstanding SME loans growing at 17.2% as
at end-March (end-December 2014: 14.0%).
Outstanding household loans growth remained
stable at 9.8% as at end-March (end-December
2014: 9.9%). Net funds raised in the capital
market moderated to RM21.0 billion in the fi rst
quarter (4Q 2014: RM26.4 billion).
The ringgit and other regional currencies
continued to face volatility in the fi rst quarter due
to uncertainty in global monetary conditions,
which led to portfolio investment outfl ows.
Overall, the ringgit depreciated by 6.0% against
the US dollar during the quarter. Against other
major currencies, the ringgit appreciated against
the euro (5.9%) and the Australian dollar (1.2%)
but depreciated against the pound sterling
(-1.0%), and the Japanese yen (-5.3%). Against
regional currencies, the ringgit depreciated by
between 1.0% and 7.0%.
Between 1 Apr and 13 May 2015, the ringgit
appreciated against the US dollar by 3.1%. The
ringgit also appreciated against the Japanese
yen (2.8%), but depreciated against the euro
(-0.9%), the Australian dollar (-1.5%) and the
pound sterling (-2.8%). The ringgit appreciated
against most regional currencies.
Domestic fi nancial stability continued to be preserved
Financial system resilience remained intact
amid continued volatile fi nancial and commodity
market conditions during the quarter. Financial
intermediation activities were well-supported
Quarterly BulletinFirst Quarter 2015
2
by sound fi nancial institutions, orderly fi nancial
market conditions and continued ample
domestic liquidity. Domestic fi nancial system
stability is expected to be maintained and this
will continue to support sustained growth of the
domestic economy.
The strong capitalisation of the banking system
was well-preserved with the common equity
tier 1 (CET1) capital ratio, tier 1 capital ratio
and total capital ratio remaining well above the
minimum regulatory levels at 12.5%, 13.2% and
15.2% respectively. More than 80% of banks’
total capital consists of high quality capital,
that is, retained earnings, paid-up capital and
reserves. The excess total capital buffer for
banks was sustained in excess of RM90 billion.
The capital adequacy ratio of the insurance
sector similarly remained strong at 246.5% (4Q
2014: 252.1%) with an excess capital buffer of
RM30.1 billion.
Domestic demand will remain the key driver of growth
Moving forward, global economic growth is
projected to improve at a moderate pace, but
with diverging growth momentum across major
economies. Although lower oil prices will
have varying impact on economies, overall
global growth is expected to benefi t from this
development. Downside risks to the growth
outlook continue to persist, arising from the
prolonged weakness in domestic demand and
low infl ation in a number of major economies,
concern on the growth prospects of several
net commodity-exporting emerging economies
and the re-emergence of geopolitical tensions,
which could heighten fi nancial market volatility.
The Malaysian economy is expected to
remain on a steady growth path. Domestic
demand will remain the key driver of growth
amid the lower oil prices. Investment activity
is projected to remain resilient, with continued
capital spending by both the private and
public sectors. While private consumption is
expected to moderate as households adjust
to the introduction of the Goods and Services
Tax (GST), the steady rise in income and
stable labour market conditions would support
household spending. The recovery in global
growth while remaining moderate, will provide
support to manufactured exports, although
lower commodity prices will likely weigh down
on overall exports.
3
Quarterly BulletinFirst Quarter 2015

DEVELOPMENTS IN THE FIRST QUARTER OF 2015
INTERNATIONAL ECONOMIC ENVIRONMENT
Moderate global economic expansion
The global economic activity expanded
with divergent growth momentum across
economies in the fi rst quarter of 2015.
While the US economy registered broader
improvements, the economic recovery in the
euro area and Japan progressed at a more
gradual pace. In Asia, growth was sustained
by the continued expansion of domestic
demand.
Most major and regional equity markets
ended the quarter higher. In the fi rst half of
the quarter, global equity markets initially
declined as market sentiments were affected
by the sharp decline in oil prices, the
downward revision to the IMF and World
Bank global growth forecasts, as well as
uncertainty over the outcome of the Greek
debt negotiations. Nevertheless, most equity
markets trended higher from February
onwards, which more than offset the initial
decline. This was underpinned by policy
actions in a few major economies, namely,
the commencement of the European Central
Bank’s (ECB) expanded asset purchase
programme and the announcement of
monetary easing measures by the People’s
Bank of China (PBOC), which lifted market
sentiments.
The US economy expanded at a faster annual
pace of 3.0% in the fi rst quarter (4Q 2014: 2.4%).
On a seasonally adjusted annualised basis
however, growth moderated to 0.2% (4Q 2014:
2.2%). Private consumption activity improved
in the fi rst quarter, benefi tting from lower oil
prices, stronger labour market conditions
and improved household balance sheets.
Nevertheless, growth in the fi rst quarter
was affected by temporary factors including
harsh winter conditions and port congestion.
Growth of fi xed investment moderated as
the slower expansion in non-residential capital
expenditure more than offset the faster growth
in residential investment. Headline infl ation
turned negative (-0.1%; 4Q 2014: 1.2%), amid
lower oil prices.
Economic activity in the euro area registered
a gradual improvement in the fi rst quarter of
2015 (1.0%; 4Q 2014: 0.9%). Overall demand
conditions were supported by lower oil prices,
accommodative monetary policy and continued
depreciation of the euro. Business and
consumer sentiments also improved, with the
manufacturing PMI increasing to 51.4 during the
quarter (4Q 2014: 50.4). The economy, however,
entered into defl ation (-0.3%; 4Q 2014: 0.2%)
due mainly to lower oil prices.
The UK economy continued to expand in the
fi rst quarter, albeit at a more moderate pace
of 2.4% (4Q 2014: 3.0%). Growth was mainly
driven by the services sector, particularly the
transportation, storage and communication
sub-sector. Infl ation rate fell to 0.1% during the
quarter (4Q 2014: 0.9%), amid lower food and
transportation prices.
Economic activity in Japan remained weak.
Retail sales registered a broad-based decline
in the fi rst quarter (-4.8%; 4Q 2014: 0.6%)
amid lower household consumption. Business
sentiments, however, were sustained as
refl ected by the Tankan survey index for large
manufacturers which was unchanged during the
quarter. On the external front, exports growth
was sustained at 9.1% in the fi rst quarter
(4Q 2014: 9.1%) amid continued depreciation of
the yen. Infl ation (less fresh food) continued to
moderate (2.1%; 4Q 2014: 2.7%) on account of
lower cost of utilities, furniture, transportation and
communication, and recreation. Core infl ation
(excluding food and energy) was sustained at
2.1% (4Q 2014: 2.1%).
2014 2015
1Q 4Q Year 1Q
Annual change (%)
US 1.9 2.4 2.4 3.0a
UK 2.7 3.0 2.8 2.4p
Euro area 1.1 0.9 0.9 1.0p
a Advance estimatep Preliminary
Source: National authorities
Advanced Economies: Real GDP Growth
Quarterly BulletinFirst Quarter 2015
4

Most central banks in the advanced economies
continued to maintain an accommodative
monetary policy stance, despite diverging
trend in the monetary policy direction across
economies. In the US, the Federal Reserve
assessed that “an increase in the federal funds rate target is likely to become appropriate later this year”1 amid the reduction in labour
market slack. Following the decline in oil
prices in January, the Fed lowered its infl ation
projection for 2015 to 0.6% - 0.8% in March
2015 (December 2014 forecast: 1.0% - 1.6%).
In contrast, several central banks increased
monetary accommodation amid lower infl ation
and rising growth concerns. In January 2015,
the ECB began its asset purchase programme
of EUR60 billion (approximately USD70.9
billion) per month between March 2015 until at
least September 2016, to include the purchase
of bonds issued by euro area governments,
agencies and European institutions. Similarly,
the Bank of Japan continued with its annual
asset purchases of JPY80 trillion (approximately
USD670 billion) amid continued disinfl ation
concerns. Meanwhile, the Swiss National Bank
(SNB) and the Bank of Canada reduced their
key policy rates by 50 and 25 basis points,
respectively to -0.75% and 0.75%, respectively.
On 15 January, the SNB also discontinued the
minimum exchange rate of CHF1.20 per euro
amid more pronounced divergences between
monetary policies in the US and euro area.
In February and May, the Reserve Bank of
Australia lowered its key interest rate by 25
basis points each to 2.0%, while Danmarks
Nationalbank (Danish National Bank) cut its
policy rate on four occasions by a cumulative 70
basis points to -0.75% in the fi rst two months of
the year. Sveriges Riksbank (Swedish National
Bank), on the other hand, reduced its policy rate
by a cumulative 25 basis points to -0.25% in
February and March.
In PR China, economic growth moderated to
7.0% in the fi rst quarter (4Q 2014: 7.3%). By
industry, sustained growth in the tertiary sector
(services) was offset by slower expansion in the
primary (agriculture) and secondary industries
(industry and construction). In March 2015, the
Chinese government also announced a lower
official growth target of “around 7.0%”2 for
2015. To this end, policymakers continued to
provide support to economic activity during the
quarter through the acceleration of infrastructure
projects, monetary stimulus measures and the
easing of property market restrictions. Infl ation
moderated to 1.2% (4Q 2014: 1.5%) amid lower
transportation and housing costs.
In Asia, growth continued to expand, albeit at
a more moderate pace in most economies.
The Chinese Taipei economy continued to
expand in the fi rst quarter (3.5%; 4Q 2014:
3.3%), supported by an improvement in private
consumption and sustained export growth.
Singapore registered sustained growth in the
fi rst quarter (2.1%; 4Q 2014: 2.1%), supported
by continued expansion in the construction
and services industries. In Korea, growth
moderated slightly to 2.4% (4Q 2014: 2.7%)
as the improvement in private consumption
and investment was offset by weaker external
demand. Economic activity grew at a slower
pace of 4.7% (4Q 2014: 5.0%) in Indonesia
as weaker growth in private consumption
and government spending outweighed the
improvements in investment and net exports.
1 “The New Normal Monetary Policy” speech by Janet Yellen at the Research Conference on 27 March 20152 “Report on PR China’s Economic, Social Development Plan (2015)” The National People’s Congress of PR China official website
2014 2015
1Q 4Q Year 1Q
Annual change (%)
PR China 7.4 7.3 7.4 7.0
Indonesia 5.1 5.0 5.0 4.7
Singapore 4.6 2.1r 2.9r 2.1a
Korea 3.9 2.7 3.3 2.4a
Chinese Taipei 3.4 3.3r 3.7r 3.5a
a Advance estimater Revised Source: National authorities
Regional Countries: Real GDP Growth
Headline infl ation moderated in most Asian
economies, with Thailand, Singapore and
Chinese Taipei falling into defl ation. The
moderation primarily refl ected the decline in
oil prices and its pass-through to lower food,
utilities and transportation costs. In contrast,
infl ation in Indonesia was sustained due to
the increase in fuel pump prices after the
implementation of subsidy reforms.
5
Quarterly BulletinFirst Quarter 2015

Most regional central banks increased the
degree of monetary accommodation in the
fi rst quarter. Of signifi cance, the Monetary
Authority of Singapore reduced the slope of
the S$ nominal effective exchange rate policy
band in January due to expectations of lower
imported infl ation following the signifi cant fall
in oil prices. Similarly, in response to persistent
defl ationary pressures and growth concerns, the
Bank of Thailand and the Bank of Korea also
reduced their respective policy rates from 2%
respectively to 1.5% and 1.75%, respectively.
Bank Indonesia also lowered its policy rate by
25 basis points to 7.5% as the central bank
expected infl ation to fall towards the lower end
of its 3-5% 2015 year-end target. In India, the
central bank lowered the repo rate in January
and March by a total of 50 basis points to 7.5%,
given expectations of lower infl ation. In PR
China, the PBOC eased monetary conditions
to help lower the funding costs for fi nancial
institutions, reduce market interest rates and
thereby the fi nancing costs of the corporate
sector. Between January to May 2015, PR
China’s one-year benchmark deposit and
loan interest rates were lowered to 2.25%
and 5.1%, respectively (Previous: 2.75% and
5.6%, respectively). In addition, the reserve
requirement ratio for fi nancial institutions
was reduced by a total of 150 basis points in
February and April to support lending to small
and micro enterprises, the agriculture sector
and rural areas.
Brent crude oil prices declined by approximately
29% to average USD55 per barrel in the fi rst
quarter (4Q 2014: USD77 per barrel). The
decline was driven by high global supply of oil,
and to a lesser extent, slower demand in a few
major economies. Amid rising oil inventory in
major consuming countries, prices declined to a
low of USD47 per barrel on 12 January, levels
last seen during the Global Financial Crisis.
Prices subsequently stabilised towards the
end of the quarter to around USD55 per barrel
following the decline in US oil rig operations,
which pointed to a reduction in US shale oil
output in the medium-term.
Most major and regional currencies ended
the quarter lower against the US dollar. The
broad-based depreciation against the US
dollar was attributed mainly to the continued
improvements in US economic activity, which
supported market expectations for monetary
policy normalisation to begin in the second
half of 2015. The euro and Japanese yen
also depreciated following the implementation
of additional monetary stimulus by their
respective central banks. In contrast, the Thai
baht ended the quarter higher against the US
dollar due to lower political uncertainty and the
improvement in the country’s external position.
The Taiwanese dollar also strengthened amid
investor optimism that the fall in oil prices will
support the economy’s growth prospects.
Moving forward, the global economy is
projected to be on a moderate growth path,
but with diverging growth momentum across
major economies. While lower oil prices will
have varying impact on economies, overall
global growth is expected to benefi t from this
development. Nevertheless, downside risks to
the growth outlook continue to persist, arising
from the prolonged weakness in domestic
demand and the low infl ation in a number of
major economies, concerns on the growth
prospects of several net commodity-exporting
emerging economies and the re-emergence
of geopolitical tensions, which could result in
heightened fi nancial market volatility.
Quarterly BulletinFirst Quarter 2015
6

DEVELOPMENTS IN THE MALAYSIAN ECONOMY
The Malaysian economy grew by 5.6% in the fi rst quarter
The Malaysian economy registered a growth of 5.6% in the fi rst quarter of 2015 (4Q 2014: 5.7%). Private sector expenditure remained the key driver of growth (9.6%; 4Q 2014: 8.3%). This contributed towards a strong domestic demand performance, which offset the negative contribution from net exports during the quarter. On a quarter-on-quarter seasonally-adjusted basis, the economy recorded a growth of 1.2% (4Q 2014: 1.8%).
Continued expansion in domestic demand
Domestic demand expanded by 7.9% in the fi rst quarter of 2015 (4Q 2014: 5.7%), driven mainly by private sector expenditure.
Private sector activity grew by 9.6% (4Q 2014: 8.3%), following continued growth in consumption and investment activities. Private consumption expanded at a stronger pace of 8.8% (4Q 2014: 7.6%), supported by stable labour market conditions and higher wage growth. Furthermore, household spending was supported by fl ood relief efforts, in particular, during the early parts of the quarter. The front-loading of consumer purchases prior to the implementation of GST, particularly on transport, food and beverages, as well as communication, also contributed to the strong expansion in private consumption. Private investment expanded by 11.7% (4Q 2014: 11.1%), driven by capital spending in the export-oriented manufacturing sector and in the telecommunication and transport-related services industries.
Public sector expenditure expanded by 2.5% in the fi rst quarter (4Q 2014: 0.6%) driven mainly by higher growth in public consumption and a turnaround in public investment. Public consumption grew by 4.1% (4Q 2014: 2.5%), refl ecting higher Federal Government spending on supplies and services amid moderate growth in emoluments. Following a rebound in spending on fi xed assets by the Federal
GDP by Expenditure Components (at constant 2010 prices)
Share2014(%)
2014 2015
1Q 4Q Year 1Q
Annual change (%)
Aggregate Domestic Demand (excluding stocks)
Private Sector ConsumptionInvestment
Public SectorConsumptionInvestment
Net ExportsExports of Goods and ServicesImports of Goods and Services
91.568.551.816.6
23.013.6
9.5
9.376.166.8
7.68.97.0
14.9
3.612.2-6.3
8.27.97.8
5.78.37.6
11.1
0.62.5
-1.9
-4.01.92.6
5.97.97.0
11.0
0.44.4
-4.7
12.85.14.2
7.99.68.8
11.7
2.54.10.5
-10.2-0.61.0
GDP 100.0 6.3 5.7 6.0 5.6
GDP (q-o-q growth, seasonallyadjusted) - 1.4 1.8 - 1.2
Source: Department of Statistics, Malaysia
Government, public investment turned around and grew by 0.5% (4Q 2014: -1.9%).
In terms of total investment, gross fi xed capital formation expanded by 7.9% (4Q 2014: 4.3%), supported mainly by capital spending in the private sector. By type of assets, investments on structures expanded by 9.9% (4Q 2014: 10.4%), while machinery and equipment investment turned around to record a positive growth of 5.8% (4Q 2014: -0.8%).
GFCF by Type of Assets
Other assets* Machinery & equipment Structures
* Other assets include mineral exploration, research & development, etc
Source: Department of Statistics, Malaysia
% share to real GFCF
Q1 Q2 Q3 Q42012
Q1 Q2 Q3 Q42013
Q1 Q2 Q3 Q42014
Q1 2015
9.7 9.8 9.2 9.8 8.9 10.0 9.0 9.9 8.6 9.4 9.3 8.9 8.3
41.7 39.3 41.1 41.1 42.3 36.8 40.5 39.7 39.0 37.3 36.9 37.8 38.3
48.6 50.9 49.7 49.1 48.8 53.2 50.5 50.4 52.4 53.4 53.8 53.3 53.4
0
20
40
60
80
100
7
Quarterly BulletinFirst Quarter 2015

The Broad-based Composition of Private Investment in Malaysia
Malaysia’s private investment has been broad-based across the economy
Since 2010, private investment in Malaysia has registered a robust double-digit average growth rate. Investment activity in the services and manufacturing sectors were the main drivers of the strong performance, accounting for more than 75% of private investment (Figure 1). The mining sector also contributed signifi cantly to investment growth, particularly in 2012, due to the simultaneous commencement of several major oil and gas projects under the Economic Transformation Programme (ETP) (Figure 2).
Figure 1: Share of Private Investment by Sector (2014e)
Construction2.7%
Mining 15.8%
Manufacturing 25.7%
Services51.2%
Agriculture4.6%
e Estimate
Source: Bank Negara Malaysia estimates
Figure 2: Contribution to Private Investment Growth (2011-2014e)
Source: Department of Statistics, Malaysia and Bank Negara Malaysia estimates
e Estimate
Note: Figures are based on 2005 base year. The new figures based on the base year of 2010 will be released in the second half of 2015
1.0 6.9
2.0 1.1
3.9
2.8
1.6 2.2
3.3
12.0
8.9 7.1
9.4
22.8
13.1
11.0
0
5
10
15
20
25
2011 2012 2013 2014e
Private investment growth
Ppt. cont. / Annual change %
Services
Manufacturing
Mining
Sector Main investment activityServices Tourism and retail: Theme parks, hotels and shopping malls
Transport and storage: Logistics facilities, oil storage facilitiesHealthcare: New hospitals, upgrading of medical equipmentTelecommunications: Roll-out of high-speed 3G / HSPDA / 4G LTE infrastructure
Manufacturing Petrochemicals: Oil refi neries and chemical plantsElectronics and electrical: Solar, semiconductors, medical devicesAutomotive: Energy-effi cient vehicle plantsAeronautical: Aircraft design, aircraft components
Mining Deepwater exploration, enhanced oil recovery (EOR) and marginal oil fi elds
Construction Investment in construction machinery and equipment for the building of structures
Agriculture Replanting and new planting of palm oil and rubber, upgrading of machinery and equipment
Table 1: Recent private investment activity in Malaysia (2010-2014)
Quarterly BulletinFirst Quarter 2015
8

Going forward, investment will remain resilient amidst lower oil prices, driven by the manufacturing and services sectors
Investment activity, particularly in the manufacturing and services sectors, is expected to remain robust as refl ected by the record-high level of investment approvals reported by the Malaysian Investment Development Authority (MIDA) (Figure 3). Investment in the manufacturing sector will be supported by capital spending in the export-oriented industries and in new growth areas such as renewable energy (e.g. solar and energy-efficient vehicles), semiconductors and medical devices. In the services sector, spending will be channelled into higher value-added activities, such as IT services (e.g. cloud computing), education and medical tourism.
Investment by new and existing businesses in Malaysia (Figure 4) and the continued implementation of long-gestation projects (Table 2) will also support investment growth in 2015-2016.
Figure 3: MIDA Total Investment Approvals
Source: Malaysian Investment Development Authority (MIDA)
105.6
154.6 167.8
219.4 235.9
0
50
100
150
200
250
2010 2011 2012 2013 2014
RM billion
Additionally, the incentives announced by the Government in April 2015 to promote investment in automation and principal hub activity are also expected to lift capital spending and to attract more fi rms to set up their global or regional bases in Malaysia.
Projects Description TimelineBukit Bintang City Centre Mixed residential and commercial development 2015-2024
Infi neon Technologies Competence Centre for Megatrend Technologies in Kulim and expansion of a Development Centre in Melaka
2014-2024
Seagate New plant for hard drives and storage solutions 2014-2019
Dialog-Vopak Phase 2 Oil and gas storage and terminal 2014-2018
Genting refurbishment New theme park and hotel refurbishment 2013-2016
Table 2: Selected Long-gestation Projects
Source: Newsfl ows
Figure 4: MIDA Manufacturing Investment Approvals by Purpose
Source: Malaysian Investment Development Authority (MIDA)
RM billion
23.9 33.1 26.9
38.1 43.5
23.3
23.0
14.2
14.0
28.4
20
0
40
60
80
2010 2011 2012 2013 2014
Expansion / Diversification New investment
9
Quarterly BulletinFirst Quarter 2015

Continued expansion in major economic sectors
On the supply side, growth in the fi rst quarter was supported by the major economic sectors. The services sector was underpinned by growth in all sub-sectors, particularly consumption-related sub-sectors. Growth in the manufacturing sector was supported by stronger performance in the export-oriented industries, particularly the electronics and electrical (E&E) cluster. The construction sector was supported mainly by the non-residential and residential sub-sectors, while the mining sector continued to record stronger growth amid higher crude oil production. Meanwhile, the agriculture sector contracted as a result of lower palm oil production.
The services sector grew by 6.4% in the fi rst quarter (4Q 2014: 6.6%) benefi tting from the higher growth in domestic demand. The wholesale and retail trade sub-sector recorded
Share2014(%)
2014 2015
1Q 4Q Year 1Q
Annual change (%)
AgricultureMiningManufacturingConstructionServices
9.29.0
23.04.3
53.5
2.6-0.17.0
19.36.7
-3.79.55.48.86.6
2.13.36.2
11.86.5
-4.79.65.69.76.4
Real GDP 100.01 6.3 5.7 6.0 5.6
Real GDP (q-o-qseasonally adjusted) - 1.4 1.8 - 1.21 Numbers do not add up due to rounding and exclusion of import duties component
Source: Department of Statistics, Malaysia
GDP by Economic Activity (at constant 2010 prices)
Share2014(%)
2014 2015
1Q 4Q Year 1Q
Annual change (%)
Intermediate Services 38.4 6.1 6.1 5.9 5.7
Finance & insurance Real estate & business servicesTransport & storage Information & communication
13.77.96.5
10.2
2.78.24.8
10.1
2.48.36.09.7
2.38.05.29.7
1.97.65.79.6
Final Services 61.6 7.2 6.9 7.0 6.8
Wholesale & retail tradeFood & beverages and accommodationUtilities Government servicesOther services
26.95.14.8
16.58.2
8.56.33.27.65.3
9.47.53.94.74.7
8.96.53.86.14.8
9.87.33.73.94.6
Total Services 100.01 6.7 6.6 6.5 6.4
1 Numbers do not add up due to rounding
Source: Department of Statistics, Malaysia
Performance of the Services Sector (value added at constant 2010 prices)
2014 2015
1Q 4Q Year 1Q
Index
MIER Consumer Sentiments IndexMIER Retail Trade IndexMIER Tourism Market Index
96.886.3
115.8
83.092.9
107.6
94.599.7
108.8
72.685.4
100.7
Annual change (%)
Total consumption credit outstandingTotal loans outstandingLoans outstanding to the wholesale & retail trade, hotels & restaurantsImports of consumption goodsTotal sales of motor vehiclesContainer cargo handled (Port Klang and PTP)
4.810.2
6.415.6
1.43.7
2.79.37.52.93.8
12.8
2.79.37.55.71.68.3
3.59.29.44.45.3
13.1
Source: Various sources
Selected Quarterly Indicators in the Services Sector
a stronger growth of 9.8% (4Q 2014: 9.4%), in line with higher household spending ahead of the implementation of GST. Growth in the information and communication sub-sector remained robust (9.6%; 4Q 2014: 9.7%), driven mainly by strong demand for data communication services, amid higher usage of
Quarterly BulletinFirst Quarter 2015
10

mobile devices, particularly smartphones. The real estate and business services sub-sector expanded by 7.6% (4Q 2014: 8.3%), supported mainly by the business services segment. The transport and storage sub-sector registered a more moderate growth of 5.7% (4Q 2014: 6.0%) in line with the slower trade-related activity. The fi nance and insurance sub-sector expanded by 1.9% (4Q 2014: 2.4%), supported by continued demand for fi nancial services products.
The manufacturing sector recorded a higher growth of 5.6% in the fi rst quarter (4Q 2014: 5.4%), supported by the stronger performance in the export-oriented industries, particularly the strong production in the electronics and electrical (E&E) cluster. This more than offsets the slight moderation in the domestic-oriented industries. Overall capacity utilisation rate in the manufacturing sector moderated to 78.4% in the fi rst quarter (4Q 2014: 79.8%) amid
Share in2014(%)
2014 2015
1Q 4Q Year 1Q
Annual Change (%)
Overall value Added (at constant 2010 prices) 100.0 7.0 5.4 6.2 5.6
Export-oriented industries 63.6 7.4 6.8 5.9 7.0
Domestic-oriented industries 36.4 6.3 3.1 6.9 2.8
Overall Manufacturing Production1 100.0 6.9 5.0 6.1 5.6
Export-oriented industries Electronics and electrical products cluster Of which:
ElectronicsElectrical products
Primary-related cluster Of which:
Chemicals and chemical productsPetroleum productsRubber productsOff-estate processing
Domestic-oriented industries Construction-related cluster
Of which:Construction-related products Fabricated metal products
Consumer-related clusterOf which:
Transport equipmentFood, beverage & tobacco products
74.924.2
15.38.9
50.7
14.321.1
2.54.5
25.111.3
8.23.1
13.8
5.57.3
6.614.6
19.15.43.0
1.16.51.30.8
7.83.2
1.26.9
11.8
19.05.7
5.410.2
6.019.7
2.9
7.91.8
-0.8-9.0
3.93.6
5.30.64.2
1.18.3
5.412.1
10.615.4
2.1
3.60.6
-1.31.5
7.94.3
5.12.8
10.9
14.48.9
6.311.3
-0.236.9
3.8
9.92.1
-1.3-12.2
3.86.9
8.14.71.4
9.2-4.6
1 Industrial Production Index (2010=100)
Source: Department of Statistics, Malaysia
Performance of the Manufacturing Sector
Capacity Utilisation Rate in the Manufacturing Sector*
Overall
IPI (RHS)
Domestic-oriented industriesExport-oriented industries
* Beginning 2012, the capacity utilisation rate in the manufacturing sector has been rebased from value-add in year 2006 to value-add in year 2009
Source: Bank Negara Malaysia & Department of Statistics, Malaysia
% Index
100
110
120
130
60
70
80
90
1Q 2011
2Q 3Q 4Q 1Q 2012
2Q 3Q 4Q 1Q 2013
2Q 3Q 4Q 1Q 2014
2Q 3Q 4Q 1Q 2015
lower capacity utilisation in the export-oriented industries (80%, 4Q 2014: 83%). However, the domestic-oriented industries recorded a higher capacity utilisation rate at 74% (4Q 2014: 73%).
11
Quarterly BulletinFirst Quarter 2015

Rebasing of the Malaysian GDP from Base Year 2005 to 2010 Prices
With effect from 1Q 2015, Malaysia’s Gross Domestic Product (GDP) in constant terms is rebased to 2010 prices from 2005 prices. This rebasing exercise by the Department of Statistics, Malaysia (DOSM) also refl ects the enhancement of data sources and coverage, as well as the incorporation of the latest international guidelines for statistical compilations1. These improvements will enhance the quality and comparability of Malaysia’s GDP statistics, and ensure that they better represent the current structure of the Malaysian economy.
Purpose of Rebasing Exercise
The practice of rebasing GDP is a standard exercise by statistical agencies worldwide. Other countries, including the euro area, South Korea, Singapore, PR China and Indonesia are also using 2010 as their current base year. In general, there are three key motivations to the improvements and rebasing of the GDP:
a) To refl ect the recent economic developments
The rebasing of GDP is necessary to ensure that the national accounts statistics refl ect the most recent underlying economic structure and relative prices in the economy. By using constant base year prices, changes in GDP in constant terms (real GDP) would refl ect only changes in the volume of economic activity. However, relative prices of goods and services do change over time due to the changing demand conditions. This would result in greater allocation of resources and production towards certain economic sectors relative to other sectors. Consequently, the relative weights of the old base year prices would become less representative of the current structure of the economy. This necessitates a change in the base year such that the reference prices become more representative of the more recent economic developments.
b) To incorporate methodological improvements and industrial reclassifi cation
In order to enhance the quality and comparability of Malaysia’s GDP statistics, the rebasing exercise incorporates conceptual and methodological improvements as well as the latest industrial reclassifi cation to the statistical compilation. i. There are two main conceptual and methodological changes that were carried out. First,
a refi ned methodology will be implemented for goods for processing (GFP) (see factbox on ‘Goods for Processing in Malaysia’s Balance of Payments Statistics’). Secondly, the depreciation of public assets will now be based on the Perpetual Inventory Method as recommended by System of National Accounts.
ii. In terms of industrial reclassifi cation, selected subsectors in the manufacturing, services and mining sectors were reclassifi ed in accordance with the latest Malaysia Standard Industrial Classifi cations (MSIC 2008).
c) To reconcile data from various censuses, surveys and sources
With the aim of enhancing the quality, reliability and coverage of Malaysia’s national account
statistics, the rebasing exercise reconciles the latest data from the various censuses, surveys
and data sources. DOSM utilised detailed censuses and surveys undertaken since 2010
(including the Economic Census 2011, Supply & Use Tables 2010, Household Expenditure
Survey 2009/10 and 2014, Census of Distributive Trade 2014 and other indices such as
Consumer Price Index, Producer Price Index and Industrial Production Index based at 2010
prices). Moreover, more comprehensive information and data on industries were obtained from
other public agencies such as the Malaysian Palm Oil Board and the Ministry of Agriculture.
1 System of National Accounts 2008 (SNA 2008) and Balance of Payments and International Investment Position Manual, IMF, Sixth Edition (BPM6). 2 GFP are items for processing by an entity which does not own the goods, and hence, does not involve a change of ownership.
Quarterly BulletinFirst Quarter 2015
12

Implications on GDP Figures
Following the reconciliation of new information from more recent surveys and improvement in methodologies, Malaysia’s nominal GDP in 2010 increased from RM797 billion to RM821 billion (+3.0%). This increase in nominal GDP after rebasing is modest and comparable to revisions made by other countries (Table 1). Meanwhile, the nominal GDP increased from RM1,070 billion to RM1,107billion (+3.4%) in 2014.
Country Nominal GDP Before Rebasing Nominal GDP After Rebasing Revision (%)
South Korea 1,173,275 1,265,3087.8
(bil won, 2010) (2005=100) (2010=100)
Netherlands 586,789 631,5127.6
(mil euro, 2010) (2005=100) (2010=100)
Philippines 3,355 3,5816.7
(bil PHP, 2000) (1985=100) (2000=100)
Malaysia 797,327 821,4343.0
(mil RM, 2010) (2005=100) (2010=100)
Singapore 318 3221.3
(bil $S, 2010) (2005=100) (2010=100)
PR China 401,202 401,5130.1
(100 mil yuan, 2010) (2005=100) (2010=100)
India 9,009,722 8,832,012-2.0
(rupee crores, 2011/12) (2004-05=100) (2011-12=100)
Source: Department of Statistics, Malaysia
Table 1: Nominal GDP of selected countries (during the year of rebase)
On the supply side, economic activity is still driven by the services and manufacturing sectors, which account for approximately three quarters of the GDP. The share of commodities sectors (agriculture and mining) increased, refl ecting the higher commodity prices relative to non-commodity prices in 2010 compared with 2005 (Table 2). On the whole, growth rates of all sectors were broadly unchanged.
2014 share of GDP (%)1 2014 growth of GDP (%)
2005 prices 2010 prices 2005 prices 2010 prices
Services 55.3 53.5 6.3 6.5
Manufacturing 24.6 23.0 6.2 6.2
Agriculture 6.9 9.2 2.6 2.1
Mining & Quarrying 7.9 9.0 3.1 3.3
Construction 3.9 4.3 11.6 11.8
Overall GDP 100.0 100.0 6.0 6.0
1 Numbers may not add up due to rounding and exclusion of import duties component Source: Department of Statistics, Malaysia
Table 2: Real GDP by Economic Activity
13
Quarterly BulletinFirst Quarter 2015

On the demand side, the shares of major components were broadly unchanged. Domestic demand, in particular private sector expenditure, remains the key driver of growth in the Malaysian economy (Table 3). Additionally, the increase in the share of net exports is due to higher commodity prices relative to non-commodity prices in 2010 compared to 20053. Meanwhile, the growth rates of major components were relatively unchanged, except for net exports as a result of the new base year prices and treatment for goods for processing (GFP).
3 Both exports and imports of goods and services recorded a lower share due to the new treatment for goods for processing (GFP)
2014 share of GDP (%)2 2014 growth of GDP (%)
2005 prices 2010 prices 2005 prices 2010 prices
Aggregate domestic demand 93.1 91.5 6.0 5.9
Private sector 70.0 68.5 8.0 7.9
Consumption 52.5 51.8 7.1 7.0
Investment 17.5 16.6 11.0 11.0
Public sector 23.0 23.0 0.2 0.4
Consumption 13.2 13.6 4.4 4.4
Investment 9.8 9.5 -4.9 -4.7
Net exports of goods & services 8.0 9.3 19.7 12.8
Exports of goods & services 88.8 76.1 5.1 5.1
Imports of goods & services 80.8 66.8 3.9 4.2
Overall GDP 100.0 100.0 6.0 6.0
2 Numbers may not add up due to rounding and exclusion of the changes in inventories and valuables component Source: Department of Statistics, Malaysia
Table 3: Real GDP by Expenditure
Conclusion
The estimation of Malaysia’s GDP has been improved and benchmarked to the base year 2010 to refl ect the latest changes in economic structure and relative prices in the economy. This exercise refl ects three key enhancements:
(i) The use of 2010 prices in the estimation of GDP at constant prices in order to better refl ect current relative prices in the economy;
(ii) Methodological enhancements and industrial reclassifi cation to statistical compilation; and
(iii) Wider coverage of and further enhancements to various data sources, censuses and surveys.
Following the rebase, the upward revision for Malaysia’s nominal GDP is modest and is broadly in line with the experience of other countries that have recently undertaken the rebasing exercise. The revision has minimal impact on Malaysia’s overall growth fi gures, suggesting that underlying growth momentum of the economy remains unchanged.
Quarterly BulletinFirst Quarter 2015
14

Goods for Processing in Malaysia’s Balance of Payments Statistics
Goods for processing (GFP) are goods that are sent abroad by an owner to a processor for processing and subsequently returned to the owner or exported to third party, without a change of ownership. Throughout the process, the processing entity does not own either the imported inputs or the processed goods. The processing entity merely receives a processing fee from the owner of the goods for providing the processing services. Based on the survey conducted by DOSM, Malaysia is predominantly a GFP processor country.
In the past, GFP were treated as export and import transactions between a resident and non-resident in the goods account, regardless of the ownership status. With the rise of global production networks, this statistical treatment on GFP has infl ated international trade statistics. In response to these concerns, both 2008 System of National Accounts (2008 SNA) and 6th edition of Balance of Payments and International Investment Position Manual (BPM6)4 have recommended the exclusion of GFP from the goods accounts, with only the processing fees included in the services account (Figure 1).
Figure 1: Illustration of GFP and conceptual treatment of GFP in BOP statistics
Country A(Owner)
Country B(Processor)
1 Country A (owner) sends a GFP to Country B (processor) for processing
2 Country B (processor) sends the processed GFP to Country A (owner) or third party
Statistical treatment for GFP under BPM6
Goods account GFP excluded from goods account of both countries
Services account Export of manufacturing services for Country B Import of manufacturing services for Country A
4 For more information on Malaysia’s migration to BPM6, please refer to “Malaysia’s Balance of Payments (BOP) – Compilation of BOP Statistics
in Accordance with the 6th Edition of Balance of Payments and International Investment Position Manual (BPM6) of the International Monetary
Fund”, published in BNM Quarterly Bulletin, First Quarter 2013.
15
Quarterly BulletinFirst Quarter 2015

In principle, the revised treatment would not have any impact on GDP and BOP statistics, as it involves merely a reclassifi cation of goods transactions to services transactions. In reality, however, the complexity of international trade transactions mean that the effect of these shifts do not entirely offset, as the service charges include other costs, such as holding gains/losses and overheads, which are not attributed to the processing entity.
In the case of Malaysia, the amount of GFP removed from the goods accounts was higher than the services charges included in the services accounts in the BOP. The net result is a lower net goods and services balance in GDP. Consequently, the current account balance was also lower (Table 1).
RM billion Before incorporating GFP After incorporating GFP Difference
Goods balance 125.1 113.4 -11.7
Services balance -20.5 -11.2 9.4
Goods and services 104.5 102.2 -2.3*
Primary income -37.4 -37.3 0.1
Secondary income -17.6 -17.6 -
Current account balance 49.5 47.3 -2.2*
* Difference in current account balance and goods and services balance differ, as there were also statistical revisions to primary income account data, which affected the overall current account balance
Source: Department of Statistics, Malaysia
Table 1: Current Account Balance in Malaysia, 2014
References
International Monetary Fund 2011. “Balance of Payments and International Investment Position Manual (Sixth Edition)”
Quarterly BulletinFirst Quarter 2015
16

The construction sector grew by 9.7% in the fi rst quarter (4Q 2014: 8.8%), underpinned by the expansion in non-residential and residential sub-sectors. The expansion of the non-residential sub-sector was driven by construction activity for industrial and commercial buildings. Growth in the residential sub-sector remained supported by the construction of properties in both the mass- and high-end markets. The special trade sub-sector continued to expand, refl ecting activity for piling, earthworks, electrical and system installation as well as building completion and fi nishing works. Growth in the civil engineering sub-sector improved, supported by large infrastructure projects in the utility and transportation segments. The agriculture sector contracted further by 4.7% (4Q 2014: -3.7%), amid continued lower production of palm oil caused by the fl oods
in the eastern states of Peninsular Malaysia. Meanwhile, the mining sector expanded further by 9.6% (4Q 2014: 9.5%) due to stronger crude oil production (690,000 barrels per day), the highest since 3Q 2008. This was driven by rising output from the new Gumusut Kakap oilfi eld offshore Sabah.
2014 2015
1Q 4Q Year 1Q
Annual change (%)
Value of construction work doneResidentialNon-residentialCivil engineeringSpecial Trade1
Housing approvalsProduction2 of construction-related materials
Hydraulic cementOther articles of concrete, cement and
plaster n.e.cOther porcelain and ceramic productsPrefabricated structural components for
building or civil engineering of cement, concrete or artifi cial stone
Capital imports (excluding lumpy items)Loans for the construction sector
ApprovalDisbursement
21.133.119.910.549.3-8.93.21.3
36.915.2
2.6-3.3
-32.823.3
9.718.323.5-8.07.78.03.69.9
27.329.6
-13.38.1
24.917.8
12.822.217.1
1.216.7
4.24.36.6
32.820.9
-3.81.2
0.312.7
15.119.524.3
4.24.2
2.23
6.920.2
20.931.2
-13.311.0
21.43.2
1 Includes special trade works such as site preparation, electrical installation and painting2 Industrial Production Index (2010=100)3 Jan 2015
Source: Department of Statistics, Malaysia, Ministry of Urban Wellbeing, Housing and Local Government, and Bank Negara Malaysia
Indicators for the Construction Sector
Performance of the Agriculture Sector
Share2014(%)
2014 2015
1Q 4Q Year 1Q
Annual change (%)
Value Added (at constant 2010 prices)
Industrial CropsOf which:
Oil palmRubber
Food CropsOf which:
FishingLivestock
9.25.8
4.40.6
3.4
0.81.0
2.6 0.6
2.9-11.1
7.4
3.78.5
-3.7-8.4
-8.0-25.5
6.5
2.28.8
2.10.1
2.4-19.2
1.5
2.17.9
-4.7-11.0
-11.75.0
4.0
4.44.3
Source: Department of Statistics, Malaysia
Share2014(%)
2014 2015
1Q 4Q Year 1Q
Annual change (%)
Value Added (at constant 2010 prices)
Production Of which:
Crude oil and condensatesNatural gasOther mining and support services
9.0
--
-
-0.1
-3.62.2
10.8
9.5
16.23.1
9.3
3.3
4.31.6
9.0
9.6
20.4-1.2
11.3
Source: Department of Statistics, Malaysia
Performance of the Mining Sector
Lower headline infl ation in the fi rst quarter
Infl ation, as measured by the annual change in the Consumer Price Index (CPI), averaged signifi cantly lower at 0.7% in the fi rst quarter of 2015 (4Q 2014: 2.8%). The lower infl ation was mainly attributed to the decline in prices in the transport category (1Q 2015: -7.6%, 4Q 2014: 4.8%), following the downward revision of domestic fuel prices in January and February amid lower global oil prices. Infl ation in the housing, water, electricity, gas and other fuels category also moderated during the quarter (1Q 2015: 2.1%; 4Q 2014: 3.4%) due to the lapse in the impact of the increase in electricity tariff in January 2014, and the downward revision in electricity tariff in March 2015.
The Producer Price Index (PPI) also declined by 5.4% on an annual basis in the fi rst quarter (4Q 2014: -2.3%) driven mainly by the lower prices of mineral, fuels and lubricants and inedible crude materials categories following the decline in global oil prices. Correspondingly, prices of commodity-related components declined by 16.7% (4Q 2014: -8.8%). Meanwhile, prices of non-commodity-related components increased at a relatively stable rate of 1.1% during the quarter
(4Q 2014: 1.4%).
17
Quarterly BulletinFirst Quarter 2015
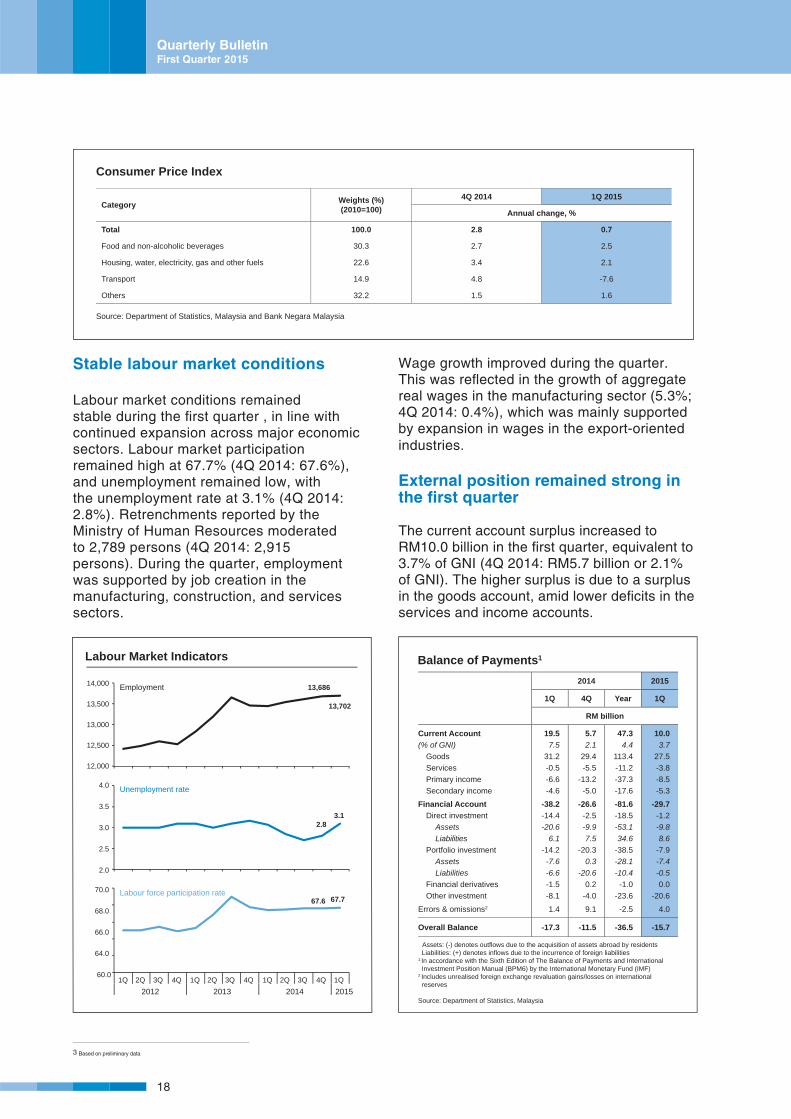
Stable labour market conditions
Labour market conditions remained stable during the fi rst quarter , in line with continued expansion across major economic sectors. Labour market participation remained high at 67.7% (4Q 2014: 67.6%), and unemployment remained low, with the unemployment rate at 3.1% (4Q 2014: 2.8%). Retrenchments reported by the Ministry of Human Resources moderated to 2,789 persons (4Q 2014: 2,915 persons). During the quarter, employment was supported by job creation in the manufacturing, construction, and services sectors.
Labour Market Indicators
14,000 13,686
13,702
3.12.8
67.6 67.7
13,500
13,000
12,500
12,000
4.0
3.5
3.0
2.5
2.0
70.0
68.0
66.0
64.0
60.01Q 2Q 3Q
20124Q 1Q 2Q 3Q
20134Q 1Q 2Q 3Q
20141Q2015
4Q
Employment
Unemployment rate
Labour force participation rate
3 Based on preliminary data
Wage growth improved during the quarter. This was refl ected in the growth of aggregate real wages in the manufacturing sector (5.3%; 4Q 2014: 0.4%), which was mainly supported by expansion in wages in the export-oriented
industries.
External position remained strong in the fi rst quarter
The current account surplus increased to RM10.0 billion in the fi rst quarter, equivalent to 3.7% of GNI (4Q 2014: RM5.7 billion or 2.1% of GNI). The higher surplus is due to a surplus in the goods account, amid lower defi cits in the services and income accounts.
2014 2015
1Q 4Q Year 1Q
RM billion
Current Account (% of GNI)
GoodsServicesPrimary incomeSecondary income
Financial Account Direct investment
AssetsLiabilities
Portfolio investmentAssetsLiabilities
Financial derivativesOther investment
Errors & omissions2
19.57.5
31.2-0.5-6.6-4.6
-38.2-14.4-20.6
6.1-14.2
-7.6-6.6-1.5-8.1
1.4
5.72.1
29.4-5.5
-13.2-5.0
-26.6-2.5-9.97.5
-20.30.3
-20.60.2
-4.0
9.1
47.34.4
113.4-11.2-37.3-17.6
-81.6-18.5-53.134.6
-38.5-28.1-10.4
-1.0-23.6
-2.5
10.03.7
27.5-3.8-8.5-5.3
-29.7-1.2-9.88.6
-7.9-7.4-0.50.0
-20.6
4.0
Overall Balance -17.3 -11.5 -36.5 -15.7
Assets: (-) denotes outfl ows due to the acquisition of assets abroad by residents Liabilities: (+) denotes infl ows due to the incurrence of foreign liabilities1 In accordance with the Sixth Edition of The Balance of Payments and International Investment Position Manual (BPM6) by the International Monetary Fund (IMF)2 Includes unrealised foreign exchange revaluation gains/losses on international reserves
Source: Department of Statistics, Malaysia
Balance of Payments1
Category Weights (%)(2010=100)
4Q 2014 1Q 2015
Annual change, %
Total 100.0 2.8 0.7
Food and non-alcoholic beverages 30.3 2.7 2.5
Housing, water, electricity, gas and other fuels 22.6 3.4 2.1
Transport 14.9 4.8 -7.6
Others 32.2 1.5 1.6
Source: Department of Statistics, Malaysia and Bank Negara Malaysia
Consumer Price Index
Quarterly BulletinFirst Quarter 2015
18

The trade surplus amounted to RM21.3 billion in the first quarter of 2015 (4Q 2014: RM21.5 billion). Gross exports contracted by 2.5% (4Q 2014: +0.5%), reflecting mainly a decline in the growth of commodity exports and resource-based manufactured exports, amid lower commodity prices. Gross imports moderated to a marginal growth of 0.2% (4Q 2014: +4.6%), amid a slower expansion of intermediate imports and a contraction in import for re-exports.
Manufactured export growth moderated due mainly to further contraction in non-E&E exports. The decline in non-E&E exports was mostly due to a contraction in exports of resource based products, particularly
petroleum products. Meanwhile, growth of E&E exports was supported by the continued demand for semiconductors, and growth of exports of non-resource based products was supported by the continued demand for machinery and appliances as well as optical and scientifi c equipment.
The contraction in commodity exports was attributable to lower prices and demand for crude palm oil and rubber. While lower prices of crude oil and LNG also weighed on commodity export during the quarter, the impact was partly offset by higher export volume of these commodities. In terms of destination, export to the US continued to record a double-digit growth, amid improvements in the US economy. By destination, exports to the region declined, refl ecting mainly lower exports to PR China, Korea, Chinese Taipei and the ASEAN economies during the quarter.
Growth of gross imports moderated in the fi rst quarter of 2015, refl ecting a slower expansion of intermediate imports, as well as a contraction in imports for re-exports. Intermediate imports grew marginally, amid slower manufacturing activity. Meanwhile, re-export activity remained weak amid lower commodity prices during the quarter. Nevertheless, capital imports recorded a higher growth, supported by continued expansion in private investment. Higher import growth of consumption goods was due mainly to broad-based improvement in major consumption imports, particularly food and beverages.
Share 2014 (%)
2014 2015
1Q 4Q Year 1Q
Annual change (%)
Gross ExportsManufactured
E&ENon-E&E
Resource basedNon-resource based
CommoditiesMineralsAgriculture
Gross ImportsIntermediate goodsCapital goodsConsumption goodsRe-exports and dual-use goods
Trade balance (RM billion)
100.076.733.443.223.619.622.713.7
9.0100.0
59.814.1
7.418.8
–
10.712.512.512.5
9.216.9
5.78.02.25.54.4
-6.415.615.726.3
0.51.85.5
-0.9-4.53.6
-3.9-0.5-8.84.6
12.50.12.9
-12.721.5
6.47.18.16.44.98.24.26.80.65.37.6
-2.15.73.8
83.1
-2.50.16.9
-4.7-12.3
4.7-10.4
-6.9-16.0
0.23.08.54.4
-15.021.3
Source: MATRADE and Department of Statistics, Malaysia
Trade Account
Share 2014 (%)
2014 2015
1Q 4Q Year 1Q
Annual change (%)
United StatesEuropean Union (EU)JapanSelected ASEAN countries1
North East Asia People’s Republic of ChinaHong Kong SARKoreaChinese Taipei
West Asia2
IndiaTotal exports
8.49.5
10.827.423.812.1
4.83.73.23.04.2
100.0
4.218.5
8.52.9
20.115.335.015.528.0-0.79.1
10.7
16.97.91.95.1
-8.7-15.7
-3.92.54.8
-2.816.0
0.5
11.011.54.45.83.4
-4.818.5
7.114.3-5.723.9
6.4
14.91.7
-2.5-2.3-7.1
-12.67.2
-8.9-3.8-8.012.1-2.5
1Singapore, Thailand, Indonesia, Philippines, Brunei Darussalam and Vietnam2United Arab Emirates, Saudi Arabia, Oman, Iraq, Qatar, Kuwait, Jordan, Lebanon, Bahrain, Syria, Palestine, Yemen and Iran
Source: Department of Statistics, Malaysia
Malaysia: Direction of Exports
19
Quarterly BulletinFirst Quarter 2015
The Pricing of Malaysia’s LNG Exports
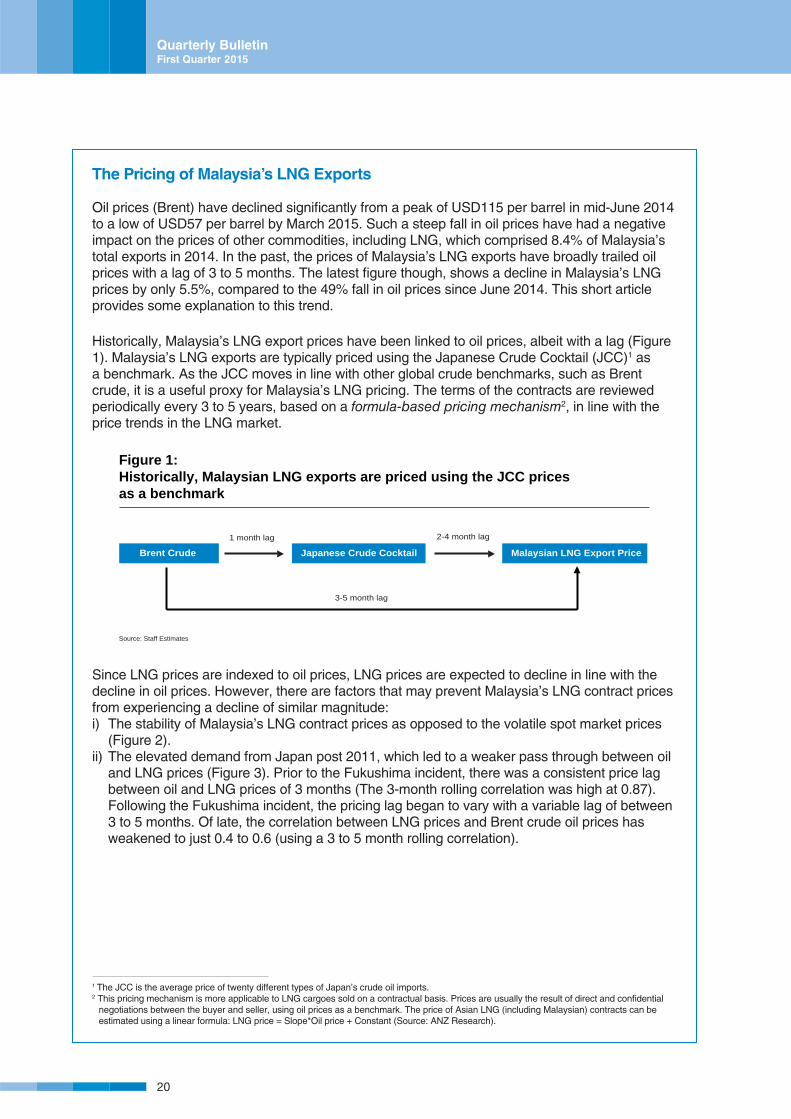
Oil prices (Brent) have declined signifi cantly from a peak of USD115 per barrel in mid-June 2014 to a low of USD57 per barrel by March 2015. Such a steep fall in oil prices have had a negative impact on the prices of other commodities, including LNG, which comprised 8.4% of Malaysia’s total exports in 2014. In the past, the prices of Malaysia’s LNG exports have broadly trailed oil prices with a lag of 3 to 5 months. The latest fi gure though, shows a decline in Malaysia’s LNG prices by only 5.5%, compared to the 49% fall in oil prices since June 2014. This short article provides some explanation to this trend.
Historically, Malaysia’s LNG export prices have been linked to oil prices, albeit with a lag (Figure 1). Malaysia’s LNG exports are typically priced using the Japanese Crude Cocktail (JCC)1 as a benchmark. As the JCC moves in line with other global crude benchmarks, such as Brent crude, it is a useful proxy for Malaysia’s LNG pricing. The terms of the contracts are reviewed periodically every 3 to 5 years, based on a formula-based pricing mechanism2, in line with the price trends in the LNG market.
1 The JCC is the average price of twenty different types of Japan’s crude oil imports.2 This pricing mechanism is more applicable to LNG cargoes sold on a contractual basis. Prices are usually the result of direct and confi dential
negotiations between the buyer and seller, using oil prices as a benchmark. The price of Asian LNG (including Malaysian) contracts can be
estimated using a linear formula: LNG price = Slope*Oil price + Constant (Source: ANZ Research).
Since LNG prices are indexed to oil prices, LNG prices are expected to decline in line with the decline in oil prices. However, there are factors that may prevent Malaysia’s LNG contract prices from experiencing a decline of similar magnitude:i) The stability of Malaysia’s LNG contract prices as opposed to the volatile spot market prices
(Figure 2).ii) The elevated demand from Japan post 2011, which led to a weaker pass through between oil
and LNG prices (Figure 3). Prior to the Fukushima incident, there was a consistent price lag between oil and LNG prices of 3 months (The 3-month rolling correlation was high at 0.87). Following the Fukushima incident, the pricing lag began to vary with a variable lag of between 3 to 5 months. Of late, the correlation between LNG prices and Brent crude oil prices has weakened to just 0.4 to 0.6 (using a 3 to 5 month rolling correlation).
Source: Staff Estimates
2-4 month lag
3-5 month lag
1 month lag Brent Crude Japanese Crude Cocktail Malaysian LNG Export Price
Figure 1: Historically, Malaysian LNG exports are priced using the JCC prices as a benchmark
Quarterly BulletinFirst Quarter 2015
20
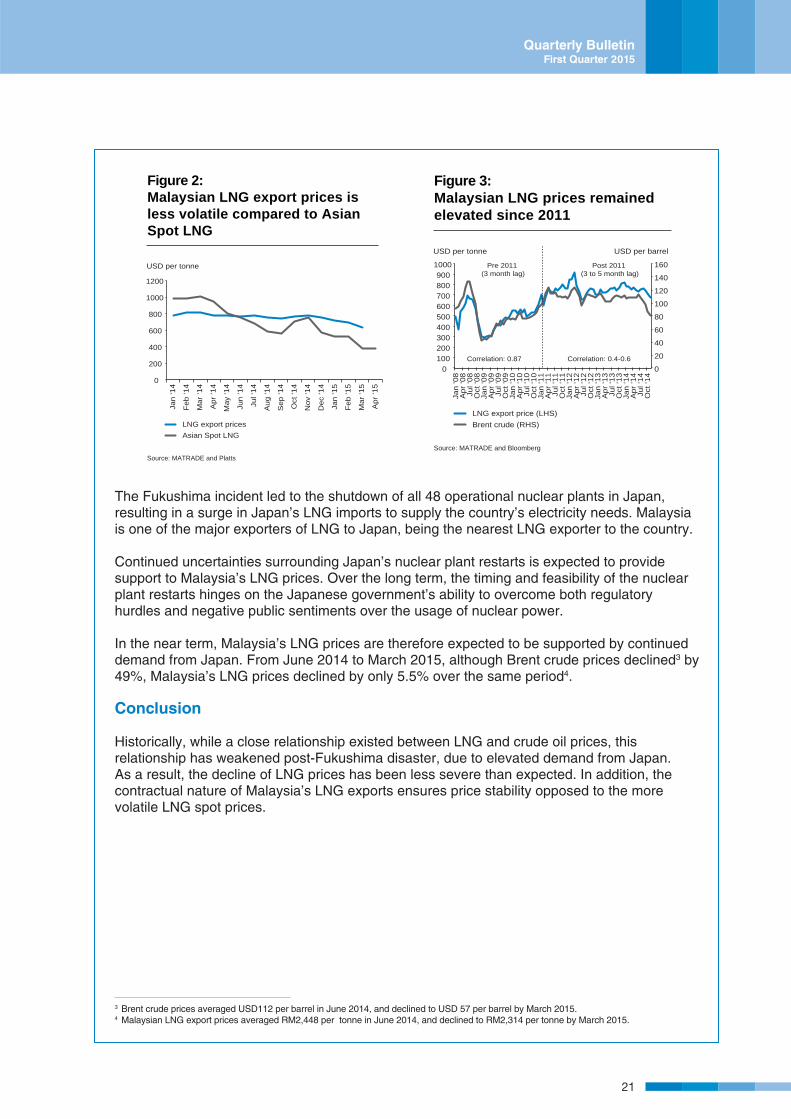
Figure 2: Malaysian LNG export prices is less volatile compared to Asian Spot LNG
Source: MATRADE and Platts
USD per tonne
0
200
400
600
800
1000
1200
Jan
‘14
Feb
‘14
Mar
‘14
Apr
‘14
May
‘14
Jun
‘14
Jul ‘
14
Aug
‘14
Sep
‘14
Oct
‘14
Nov
‘14
Dec
‘14
Jan
‘15
Feb
‘15
Mar
‘15
Apr
‘15
LNG export prices Asian Spot LNG
3 Brent crude prices averaged USD112 per barrel in June 2014, and declined to USD 57 per barrel by March 2015. 4 Malaysian LNG export prices averaged RM2,448 per tonne in June 2014, and declined to RM2,314 per tonne by March 2015.
Figure 3: Malaysian LNG prices remained elevated since 2011
Source: MATRADE and Bloomberg
USD per tonne
Correlation: 0.87
Correlation: 0.4-0.6
USD per barrel
0
20
40
60
80
100
120
140
160
0 100 200 300 400 500 600 700 800 900
1000
Jan
‘08
Apr
‘08
Jul ‘
08
Oct
‘08
Jan
‘09
Apr
‘09
Jul ‘
09
Oct
‘09
Jan
‘10
Apr
‘10
Jul ‘
10
Oct
‘10
Jan
‘11
Apr
‘11
Jul ‘
11
Oct
‘11
Jan
‘12
Apr
‘12
Jul ‘
12
Oct
‘12
Jan
‘13
Apr
‘13
Jul ‘
13
Oct
‘13
Jan
‘14
Apr
‘14
Jul ‘
14
Oct
‘14
LNG export price (LHS) Brent crude (RHS)
Pre 2011 (3 month lag)
Post 2011 (3 to 5 month lag)
The Fukushima incident led to the shutdown of all 48 operational nuclear plants in Japan, resulting in a surge in Japan’s LNG imports to supply the country’s electricity needs. Malaysia is one of the major exporters of LNG to Japan, being the nearest LNG exporter to the country.
Continued uncertainties surrounding Japan’s nuclear plant restarts is expected to provide support to Malaysia’s LNG prices. Over the long term, the timing and feasibility of the nuclear plant restarts hinges on the Japanese government’s ability to overcome both regulatory hurdles and negative public sentiments over the usage of nuclear power.
In the near term, Malaysia’s LNG prices are therefore expected to be supported by continued demand from Japan. From June 2014 to March 2015, although Brent crude prices declined3 by 49%, Malaysia’s LNG prices declined by only 5.5% over the same period4.
Conclusion
Historically, while a close relationship existed between LNG and crude oil prices, this relationship has weakened post-Fukushima disaster, due to elevated demand from Japan. As a result, the decline of LNG prices has been less severe than expected. In addition, the contractual nature of Malaysia’s LNG exports ensures price stability opposed to the more volatile LNG spot prices.
21
Quarterly BulletinFirst Quarter 2015
The services account recorded a smaller deficit of RM3.8 billion in the first quarter (4Q 2014: -RM5.5 billion). The smaller deficit was attributable mainly to the lower deficit in the construction services account, reflecting smaller payments for engaging foreign technical services for ongoing infrastructure projects. Meanwhile, the deficits in the transportation and insurance services account were also lower, amid more moderate trade activity. During the quarter, the surplus in the travel account was sustained at RM7.2 billion, compared to the previous quarter.
The primary income deficit narrowed to RM8.5 billion during the quarter (4Q 2014: -RM13.2 billion), reflecting mainly a lower net payment for investment income. During the quarter, investment income accrued to Malaysian companies investing abroad was higher, particularly in the mining sector, while income from the services sector was broadly sustained. Income accrued to foreign direct investors was lower in particular companies in the manufacturing and finance and insurance sectors. Meanwhile, the higher net payment in the secondary income account (-RM5.3 billion; 4Q 2014: -RM5.0 billion) was due mainly to higher outward remittances.
The financial account registered a higher net outflow of RM29.7 billion in the first quarter (4Q 2014: -RM26.6 billion), mainly accounted for by larger other investment outflows.
Direct investment registered a lower net outflow of RM1.2 billion (4Q 2014: -RM2.5 billion). Outward direct investment recorded sustained outflows of RM9.8 billion (4Q 2014: -RM9.9 billion). Of these, direct investment abroad (DIA) recorded outflows of RM11.1 billion (4Q 2014: -RM12.2 billion), supported mainly by the continued investments overseas by Malaysian companies in the oil and gas industry as well as a sizable acquisition of plantation assets in the agricultural sector. Investments into the services sector abroad, in particular the finance and insurance and transportation and storage sub-sectors, also remained sizeable.
Inward direct investment registered higher infl ows of RM8.6 billion (4Q 2014: +RM7.5 billion). Of these, foreign direct investment (FDI) recorded an infl ow of RM9.9 billion (4Q 2014: +RM9.8 billion), due to higher investments into the oil and gas industry amid further reinvestments into the manufacturing sector, as well as fi nance and insurance and real estate services sub-sectors.
Portfolio investment recorded a smaller net outfl ow of RM7.9 billion (4Q 2014: -RM20.3 billion). During the quarter, non-residents continued to liquidate their holdings of equity securities and Bank Negara Monetary Notes upon maturity. However, the extent of the outfl ows was mostly mitigated by infl ows arising from non-resident purchases of offshore debt securities issued by a public enterprise in the oil and gas sector and Malaysian Government Securities. Portfolio investment by residents turned around to register an outfl ow as domestic institutional investors reacquired foreign debt and equity securities.
Other investments recorded signifi cantly larger outfl ow of RM20.6 billion (4Q 2014: -RM4.0 billion). This is due mainly to a turnaround in the banking sector to record a large net outfl ow, amid smaller net outfl ows in the non-bank sector. The large outfl ows in the banking sector mainly refl ected the higher placement of interbank deposits by Malaysian banks in fi nancial institutions abroad which is part of their centralised treasury operations. Malaysian banks also repaid maturing interbank borrowings during the quarter. Meanwhile, the repayment of trade credits to Malaysian exporters resulted in smaller outfl ows in the non-bank sector.
Following these developments, the overall balance of payments registered a defi cit of RM15.7 billion in the fi rst quarter (4Q 2014: -RM11.5 billion). Errors and Omissions (E&O) amounted to +RM4.0 billion, partly refl ecting foreign exchange revaluation changes on international reserves.
Quarterly BulletinFirst Quarter 2015
22
Manageable external debt
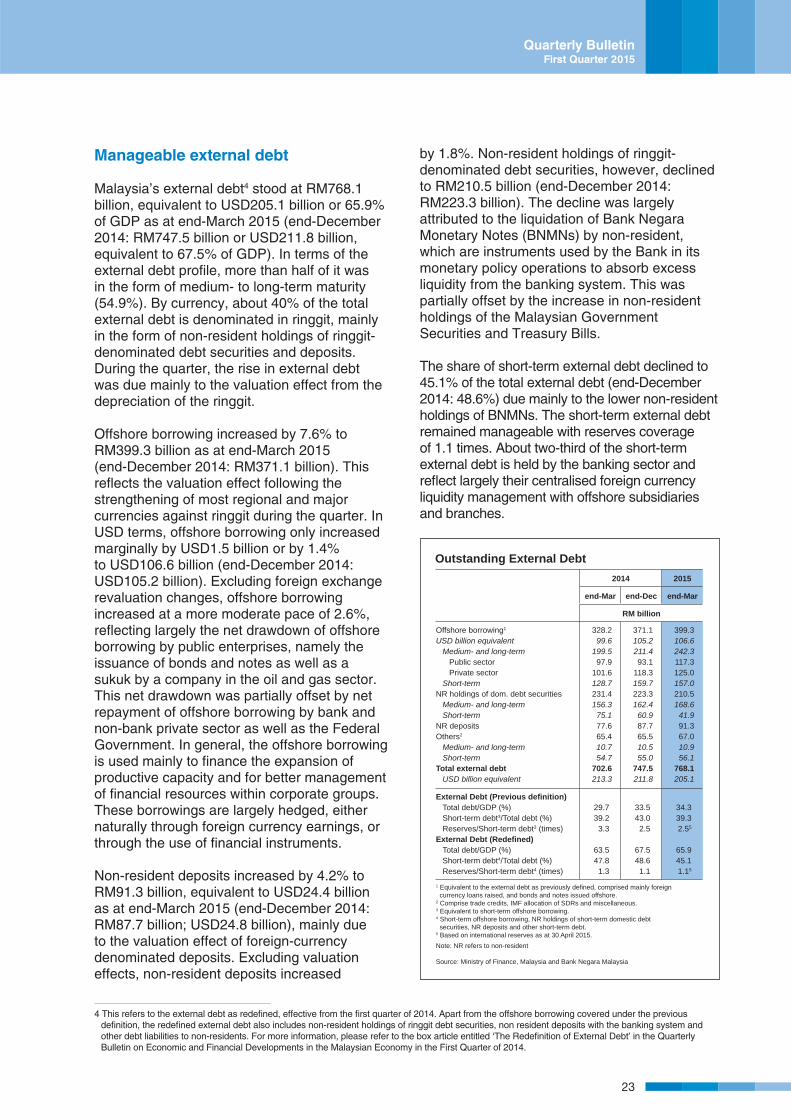
Malaysia’s external debt4 stood at RM768.1 billion, equivalent to USD205.1 billion or 65.9% of GDP as at end-March 2015 (end-December 2014: RM747.5 billion or USD211.8 billion, equivalent to 67.5% of GDP). In terms of the external debt profi le, more than half of it was in the form of medium- to long-term maturity (54.9%). By currency, about 40% of the total external debt is denominated in ringgit, mainly in the form of non-resident holdings of ringgit-denominated debt securities and deposits. During the quarter, the rise in external debt was due mainly to the valuation effect from the depreciation of the ringgit.
Offshore borrowing increased by 7.6% to RM399.3 billion as at end-March 2015 (end-December 2014: RM371.1 billion). This refl ects the valuation effect following the strengthening of most regional and major currencies against ringgit during the quarter. In USD terms, offshore borrowing only increased marginally by USD1.5 billion or by 1.4% to USD106.6 billion (end-December 2014: USD105.2 billion). Excluding foreign exchange revaluation changes, offshore borrowing increased at a more moderate pace of 2.6%, refl ecting largely the net drawdown of offshore borrowing by public enterprises, namely the issuance of bonds and notes as well as a sukuk by a company in the oil and gas sector. This net drawdown was partially offset by net repayment of offshore borrowing by bank and non-bank private sector as well as the Federal Government. In general, the offshore borrowing is used mainly to fi nance the expansion of productive capacity and for better management of fi nancial resources within corporate groups. These borrowings are largely hedged, either naturally through foreign currency earnings, or through the use of fi nancial instruments.
Non-resident deposits increased by 4.2% to RM91.3 billion, equivalent to USD24.4 billion as at end-March 2015 (end-December 2014: RM87.7 billion; USD24.8 billion), mainly due to the valuation effect of foreign-currency denominated deposits. Excluding valuation effects, non-resident deposits increased
by 1.8%. Non-resident holdings of ringgit-denominated debt securities, however, declined to RM210.5 billion (end-December 2014: RM223.3 billion). The decline was largely attributed to the liquidation of Bank Negara Monetary Notes (BNMNs) by non-resident, which are instruments used by the Bank in its monetary policy operations to absorb excess liquidity from the banking system. This was partially offset by the increase in non-resident holdings of the Malaysian Government Securities and Treasury Bills.
The share of short-term external debt declined to 45.1% of the total external debt (end-December 2014: 48.6%) due mainly to the lower non-resident holdings of BNMNs. The short-term external debt remained manageable with reserves coverage of 1.1 times. About two-third of the short-term external debt is held by the banking sector and refl ect largely their centralised foreign currency liquidity management with offshore subsidiaries and branches.
4 This refers to the external debt as redefi ned, effective from the fi rst quarter of 2014. Apart from the offshore borrowing covered under the previous
defi nition, the redefi ned external debt also includes non-resident holdings of ringgit debt securities, non resident deposits with the banking system and
other debt liabilities to non-residents. For more information, please refer to the box article entitled ‘The Redefi nition of External Debt’ in the Quarterly
Bulletin on Economic and Financial Developments in the Malaysian Economy in the First Quarter of 2014.
Outstanding External Debt2014 2015
end-Mar end-Dec end-Mar
RM billion
Offshore borrowing1
USD billion equivalentMedium- and long-term
Public sectorPrivate sector
Short-termNR holdings of dom. debt securities
Medium- and long-term Short-term
NR depositsOthers2
Medium- and long-term Short-term
Total external debtUSD billion equivalent
328.299.6
199.597.9
101.6128.7231.4156.3
75.177.665.410.754.7
702.6213.3
371.1105.2211.493.1
118.3159.7223.3162.4
60.987.765.510.555.0
747.5211.8
399.3106.6242.3117.3125.0157.0210.5168.6
41.991.367.010.956.1
768.1205.1
External Debt (Previous defi nition)Total debt/GDP (%)Short-term debt3/Total debt (%)Reserves/Short-term debt3 (times)
External Debt (Redefi ned)Total debt/GDP (%)Short-term debt4/Total debt (%)Reserves/Short-term debt4 (times)
29.739.2
3.3
63.547.8
1.3
33.543.0
2.5
67.548.6
1.1
34.339.32.55
65.945.11.15
1 Equivalent to the external debt as previously defi ned, comprised mainly foreign currency loans raised, and bonds and notes issued offshore. 2 Comprise trade credits, IMF allocation of SDRs and miscellaneous. 3 Equivalent to short-term offshore borrowing. 4 Short-term offshore borrowing, NR holdings of short-term domestic debt securities, NR deposits and other short-term debt. 5 Based on international reserves as at 30 April 2015. Note: NR refers to non-resident
Source: Ministry of Finance, Malaysia and Bank Negara Malaysia
23
Quarterly BulletinFirst Quarter 2015

International reserves remained ample
The international reserves of BNM amounted to RM389.7 billion (equivalent to USD105.1 billion) as at 31 March 2015. This reserve level has taken into account the quarterly adjustment for foreign exchange revaluation changes.
As at 30 April 2015, the reserves position amounted to RM392.4 billion (equivalent to USD105.8 billion), sufficient to fi nance 8.0 months of retained imports and is 1.1 times the short-term external debt.
Lower Government defi cit as the growth of operating expenditure moderated
In the fi rst quarter of 2015, Federal Government recorded a fi scal defi cit of -4.2% of GDP (4Q 2014: -5.7% of GDP). This was due to the moderation in the growth of Government expenditure to 1.8%, which was accounted mostly by the lower spending on subsidy. Consequently, the operating expenditure grew only by 0.4% (4Q 2014: 1.6%). Development expenditure expanded by 13.2%, disbursed mainly for education and public amenities. Government revenue increased at a sustained pace of 4.8% (4Q 2014: -2.3%). As at end-March 2015, total outstanding debt of the Federal Government amounted to RM596.8 billion or 51.2% of the estimated 2015 GDP.
2014 2015
1Q 4Q Year 1Q
RM billion
Revenue % annual growthOperating expenditure % annual growthCurrent account % of GDPNet development expenditure % annual growthOverall balance % of GDP
49.212.455.210.6-6.0-2.37.0
-20.9-13.0
-4.9
59.6-2.359.7
1.6-0.10.0
16.42.1
-16.5-5.7
220.63.4
219.63.91.00.1
38.4-5.5
-37.4-3.4
51.54.8
55.40.4
-3.9-1.47.9
13.2-11.8-4.2
Memo item:Total net expenditure % annual growthTotal Federal Government debt (as at end-period) % of GDP
Domestic debt % of GDPExternal debt % of GDP Non-resident holdings of RM-denominated Federal Government debt % of GDP Offshore borrowing % of GDP
62.25.9
560.650.7
398.436.0
162.114.7
145.713.216.5
1.5
76.11.7
582.852.7
414.737.5
168.215.2
151.413.716.8
1.5
258.02.4
582.852.7
414.737.5
168.215.2
151.413.716.8
1.5
63.31.8
596.851.2
418.935.9
177.915.3
160.213.717.6
1.5
p PreliminaryNote: Beginning fi rst quarter of 2015, GDP has been rebased from base year 2005 to base year 2010
Source: Ministry of Finance, Malaysia and Bank Negara Malaysia
Federal Government Financep
ReservesRetained import cover (RHS)Reserves/ST ext debt (RHS)
Net International Reserves (as at end period)
Source: Bank Negara Malaysia
Month/TimesUSD billion
0
2
4
6
8
10
12
14
70
80
90
100
110
120
130
140
150
O N D J 2013 2012
F M A M J J A S O N D J 2014
F M A M J J A S O N D J 2015
F M A
as at 30 Apr. ‘15:USD105.8 billion
8.0 months
1.1 times
Federal Government Finance
p PreliminarySource: Ministry of Finance, Malaysia
RM billion
-30 -20 -10
0 10 20 30 40 50 60 70
1Q 2Q 3Q 4Q 2013
1Q 1Q2Q 3Q 4Q 2014 2015p
Overall balance
Gross development expenditure
Revenue
Operating expenditure
Quarterly BulletinFirst Quarter 2015
24

MONETARY AND FINANCIAL DEVELOPMENTS
Interest rates remained stable
The Monetary Policy Committee (MPC) decided to maintain the Overnight Policy Rate (OPR) at 3.25% during the fi rst quarter of 2015. At the prevailing level of the OPR, monetary conditions remained supportive of economic activity.
Refl ecting the unchanged OPR, the average overnight interbank rate was relatively stable during the quarter, moving within a range of 3.14% to 3.25% between 1 January and 31 March 2015. Interbank rates of other short-term maturities (less than 1 month) were also relatively stable. Interbank rates of longer maturities continued to be elevated in January, refl ecting the increase in funding cost of banks due to higher competition for stable funding amid slower growth in deposits due to net external outfl ows. However, following BNM’s announcement on 30 January 2015 on the arrangements to facilitate transition to the full implementation of the Liquidity Coverage Ratio (LCR) by 2019, a moderation of the Kuala Lumpur Interbank Offered Rates (KLIBOR) was observed. These arrangements include broadening the scope of recognition of high-quality liquid assets (HQLA) and further clarifi cation on the treatment of banks’ expected cash outfl ows, which have helped to ease funding pressures. For the quarter as a whole, 3-month KLIBOR decreased from 3.86% to 3.73%. Rates on interest rate swaps and the 3-month KLIBOR futures were lower in the fi rst quarter, as earlier expectations for an interest rate increase continued to ease.
Retail deposit rates were stable during the quarter. The average quoted fi xed deposit(FD) rates of commercial banks were relatively unchanged. The average fi xed deposit (FD) rates of commercial banks for the tenures 1 to 12 months ranged from 3.08% to 3.30%, respectively.
Borrowing costs to the economy were broadly stable throughout the quarter. On 2 January 2015, the Base Rate (BR) replaced the base lending rate (BLR) as the main reference rate for new retail fl oating rate loans and fi nancing facilities. Upon introduction, the average BR of banks stood at 3.90% where it remained as at 31 March 2015. The transition to BR was neutral on retail lending rates, with most major banks
Daily Weighted Average Overnight Interbank Rate
Source: Bank Negara Malaysia
%
3.00%
3.50%
1.80
2.20
2.60
3.00
3.40
3.80
4.20
Dec
‘10
Mar
‘11
Jun
‘11
Sep
‘11
Dec
‘11
Mar
‘12
Jun
‘12
Sep
‘12
Dec
‘12
Mar
‘13
Jun
‘13
Sep
‘13
Dec
‘13
Mar
‘14
Jun
‘14
Sep
‘14
Dec
‘14
Mar
‘15
Ceiling rate of the corridor for the OPR
Floor rate of the corridor for the OPR
13 May 15: 3.24%
2014 2015
1Q 4Q 1Q
At end-period (%)
Overnight Policy Rate (OPR)Interbank rates
Overnight1-month
3.00
3.003.06
3.25
3.233.38
3.25
3.243.28
Base lending rate (BLR)Commercial banks 6.53 6.79 6.79
Base rate (BR)Commercial banks - - 3.90
Weighted average lending rateCommercial banks 5.39 5.51 5.48
Fixed deposit ratesCommercial banks
1-month12-month
2.913.15
3.083.31
3.083.30
Source: Bank Negara Malaysia
Interest Rates
maintaining the same effective lending rates under the BLR and the BR. This was refl ected by the stable average lending rate of commercial
banks at 5.48% at the end of the fi rst quarter.
Source: Bank Negara Malaysia
Weighted ALR Base Rate (BR)BLR
Lending Rates of Commercial Banks (At end-period)
%
6.79
5.48
3.90
3.60 4.00 4.40 4.80 5.20 5.60 6.00 6.40 6.80 7.20
Mar
‘13
Jun
‘13
Sep
‘13
Dec
‘13
Mar
‘14
Jun
‘14
Sep
‘14
Dec
‘14
Mar
‘15
25
Quarterly BulletinFirst Quarter 2015

M3 continued to expand
The monetary aggregates continued to expand in the fi rst quarter. M1, or narrow money, increased by RM13.9 billion during the quarter. On an annual basis, M1 expanded by 10.2% as at end-March (end-December 2014: 5.7%). M3, or broad money, increased by RM35.9 billion on a quarter-on-quarter basis to record an annual growth rate of 7.9% as at end-March (end-December 2014: 7.0%).
The increase in M3 during the quarter was driven mainly by the continued expansion in credit extended to the private sector by the banking system. The expansion in broad money, however, was moderated somewhat by lower net claims on the Government and lower net foreign assets.
In the banking system, liquidity conditions remained ample at both the institutional and system-wide levels. The level of surplus liquidity placed with BNM was marginally lower during the quarter due to external sector outfl ows.
3 Month KLIBOR Futures
%
Quarterly volume Open Interest3M KLIBOR Futures Yield for 3rd Contract Month (RHS)
No. of contracts (thousands)
Source: Bursa Malaysia
0
1
2
3
4
5
6
7
8
9
2.0
2.3
2.6
2.9
3.2
3.5
3.8
4.1
4.4
2013 1Q 2Q 3Q 4Q
2014 20151Q 2Q 3Q 4Q 1Q
Interest Rate Swap: Rates
1 year 3 years 5 years 10 years
Source: Bloomberg
3.623.673.804.11
2.7 3.0 3.3 3.6 3.9 4.2 4.5 4.8 5.1
%
1Q 2Q 2Q 3Q 4Q 2013
1Q 1Q 3Q 4Q 2014 2015
Monetary Aggregates
Annual growth (%)
Source: Bank Negara Malaysia
3
5
7
9
11
13
15
Sep
‘13
Oct
‘13
Nov
‘13
Dec
‘13
Jan
‘14
Feb
‘14
Mar
‘14
Apr
‘14
May
‘14
Jun
‘14
Jul ‘
14
Aug
‘14
Sep
‘14
Oct
‘14
Nov
‘14
Dec
‘14
Jan
‘15
Feb
‘15
Mar
‘15
M1: 10.2
M3: 7.9
Outstanding Liquidity Placed with Bank Negara Malaysia (At end-period, RM billion)RM billion
Repos
Others
Bank Negara Malaysia Monetary Notes (BNMN)
SRR
Money Market Borrowings (excluding repos)
Source: Bank Negara Malaysia
60 100 140 180 220 260 300 340 380 420 460 500 540
Sep
‘12
Dec
‘12
Mar
‘13
Jun
‘13
Sep
‘13
Dec
‘13
Mar
‘14
Jun
‘14
Sep
‘14
Dec
‘14
Mar
‘15
`
Change during the period
2014 2015
1Q 4Q Year 1Q
RM billion
M3Net claims on GovernmentClaims on private sector
LoansSecurities
Net foreign assets1
BNMBanking System
Other infl uences
21.77.0
24.324.6-0.33.8
-18.021.8
-13.5
49.918.240.838.4
2.4-28.1-28.5
0.419.0
101.534.3
118.0111.4
6.6-19.3-44.124.8
-31.5
35.9-4.628.325.2
3.1-1.9
-25.023.114.2
1 Pre-revaluation
Note: Numbers may not add up due to rounding
Source: Bank Negara Malaysia
Determinants of Broad Money, M3
Quarterly BulletinFirst Quarter 2015
26

Private sector fi nancing activity was sustained in the fi rst quarter
In the fi rst quarter, total gross fi nancing raised by
the private sector through the banking system
and the capital market amounted to RM282.5
billion (4Q 2014: RM309.8 billion). On a net
basis, outstanding banking system loans and
PDS expanded by 8.3% as at end-March (end-
December 2014: 8.8%).
quarter remained steady, with higher level of
credit extended mainly to the fi nance, insurance
and business services; mining and quarrying;
and education, health and others sectors. In
particular, fi nancing for SMEs continued to be
strong, with outstanding SME loans growing at
17.2% as at end-March (end-December 2014:
14.0%). In addition, the level of loans disbursed
to SMEs remained high, with loans disbursed
being RM3.9 billion more than the previous
quarter.
Net fi nancing to the household sector expanded
by RM16.3 billion during the quarter (4Q 2014:
RM17.9 billion). On an annual basis, outstanding
household loans growth remained stable at 9.8%
as at end-March (end-December 2014: 9.9%).
Net lending to businesses by the banking
system expanded by RM9.8 billion during the
quarter (4Q 2014: RM17.7 billion). On an annual
basis, outstanding business loans grew at a
slower pace of 8.9% as at end-March (end-
December 2014: 9.4%). Notwithstanding that,
loan disbursement to businesses during the
During the period (RM billion) Annual growth (%)
2014 2015 2014 2015
1Q 4Q Year 1Q 1Q 4Q Year 1Q
Gross total fi nancingLoans disbursedGross PDS1
Equity
Net total fi nancing (A)+(B)Banking system
Loans outstanding (A)*Holding of PDS
PDS outstanding (B)
Memorandum itemGross PDS2
282.2258.4
19.64.2
32.322.121.01.1
11.3
20.5
309.8287.7
21.21.0
52.444.341.6
2.710.8
21.6
1,175.21,073.9
82.119.2
144.2121.3114.1
7.330.1
85.5
282.5267.3
10.54.7
26.023.722.2
1.53.8
10.9
16.117.4-11.1
320.7
9.69.7
10.23.47.7
-9.1
3.312.2
-41.2-87.1
8.89.29.37.97.3
-40.1
12.313.2
0.019.6
8.89.29.37.97.3
2.0
0.13.5
-46.511.3
8.39.29.28.25.4
-46.8
* Banking systems loans include loans sold to Cagamas1 Excluding Cagamas and foreign issuances2 Including Cagamas and foreign issuancesNote: Numbers may not add up due to rounding
Source: Bank Negara Malaysia
Financing of the Private Sector through the Banking System and Capital Market
Gross Private Sector Financing through theBanking System and Capital Market
Loan DisbursedGross PDS Issued (excl. Cagamas and foreign issuances)Equity
Source: Bank Negara Malaysia
RM billion
243.1 247.4 255.9
299.9 282.2 281.0
302.1 309.8 282.5
70
120
170
220
270
320
370
1Q ‘13 2Q ‘13 3Q ‘13 4Q ‘13 1Q ‘14 2Q ‘14 3Q ‘14 4Q ‘14 1Q ‘15
Source: Bank Negara Malaysia
Bank Lending to SMEs
Loan Applications
Loan ApprovalsLoan Disbursements
43.6 48.9 52.4 51.0
43.4 46.6 45.1 45.5 42.4
15.9 19.3 18.1 18.1 15.1 16.2 16.8 15.8 15.9
55.5
56.6 56.2 58.3
55.6 57.0 58.9 62.1
66.0
0
10
20
30
40
50
60
70
Q1 ‘13 Q2 ‘13 Q3 ‘13 Q4 ‘13 Q1 ‘14 Q2' ‘14 Q3 ‘14 Q4 ‘14 Q1 ‘15
RM billion
27
Quarterly BulletinFirst Quarter 2015

Loan IndicatorsDuring the period (RM billion) Annual growth (%)
2014 2015 2014 2015
1Q 4Q Year 1Q 1Q 4Q Year 1Q
TotalLoan applicationsLoan approvalsLoan disbursementsLoan repaymentsChange in loans outstanding*
Of which:Business enterprises1,2
Loan applicationsLoan approvalsLoan disbursementsLoan repaymentsChange in loans outstanding*
SMEs1
Loan applicationsLoan approvalsLoan disbursementsLoan repaymentsChange in loans outstanding*
Large corporations2 Loan applicationsLoan approvalsLoan disbursementsLoan repaymentsChange in loans outstanding*
HouseholdsLoan applicationsLoan approvalsLoan disbursementsLoan repaymentsChange in loans outstanding*
185.791.2
258.4245.9
21.0
86.334.8
184.0179.5
11.0
43.415.155.652.7
7.1
42.819.8
128.4126.8
3.9
99.456.374.466.315.9
210.1106.4287.7258.5
41.6
100.446.1
209.9192.3
17.7
45.515.862.157.510.0
54.930.4
147.8134.8
7.6
109.760.377.866.217.9
822.1401.4
1,073.9996.5114.1
386.2160.0770.3735.5
42.3
180.763.8
233.7222.5
27.8
205.596.2
536.6513.0
14.5
435.9241.4303.6261.0
68.9
178.594.0
267.3255.5
22.2
78.439.9
189.0187.8
9.8
42.415.966.060.314.6
36.124.0
122.9127.5
-4.8
100.154.178.367.716.3
-0.84.3
17.418.410.2
1.90.9
23.324.4
8.7
-0.5-5.30.22.1
13.0
4.56.3
37.036.9
5.5
-3.16.55.14.7
11.6
-0.28.6
12.212.8
9.3
12.724.517.616.7
9.4
-10.8-12.8
6.57.7
14.0
44.160.223.020.9
5.7
-9.6-1.1-0.32.99.9
0.22.3
13.215.6
9.3
7.63.4
18.621.1
9.4
-7.8-10.6
3.15.9
14.0
26.115.326.929.1
5.7
-5.61.61.62.49.9
-3.93.13.53.99.2
-9.114.5
2.74.68.9
-2.45.6
18.914.417.2
-15.821.3-4.30.52.3
0.7-3.95.32.19.8
* The annual growth is for end-period.1 Include loans to individual businesses.2 Include domestic fi nancial institutions, government, domestic other entities and foreign entities, except for loan outstanding which refers to businesses only.Note: Numbers do not add up due to rounding
Source: Bank Negara Malaysia
Loans disbursed Loans out-standing
During the period (RM billion)Share of total Share of total
(%)
1Q 14 4Q 14 2014 1Q 15
Business enterprises1,*
Large corporations1 SMEs*
Selected sectors1
Agriculture, hunting, forestry and fi shingMining and quarryingManufacturingConstructionReal estateElectricity, gas and water supplyWholesale and retail trade, restaurants and hotelsTransport, storage and communicationFinance, insurance and business services
HouseholdsPurchase of residential propertiesConsumption creditOf which: Credit cards Purchase of passenger carsOthers
184.0128.4
55.6
8.73.5
54.416.812.9
2.653.7
5.718.9
74.419.740.3
24.29.0
14.4
209.9147.8
62.1
8.42.9
54.719.214.3
2.159.8
7.229.0
77.821.743.9
26.39.8
12.1
770.3536.6233.7
31.312.2
213.465.551.614.0
221.127.096.2
303.681.4
167.7
99.337.854.6
189.0122.9
66.0
8.87.0
50.417.413.3
1.847.0
6.124.9
78.321.044.3
26.310.813.0
70.746.024.7
3.32.6
18.96.55.00.7
17.62.39.3
29.37.9
16.6
9.84.04.9
42.925.217.7
2.40.87.34.36.50.87.32.56.8
57.127.817.5
2.610.511.9
Total 258.4 287.7 1,073.9 267.3 100.0 100.0
* Include loans to individual businesses.1 Include domestic fi nancial institutions, government, domestic other entities and foreign entities.Note: Numbers do not add up due to rounding
Source: Bank Negara Malaysia
Loans by Sector
Quarterly BulletinFirst Quarter 2015
28

Lower net funds raised in the capital market
Net funds raised in the capital market moderated to RM21.0 billion in the fi rst quarter (4Q 2014: RM26.4 billion). The decline was due mainly to lower net issuances of government and private debt securities.
In the public sector, net funds raised moderated to RM13.2 billion (4Q 2014: RM15.3 billion) given the higher redemptions of government securities amounting to RM13.8 billion (4Q 2014: RM7.5 billion). Funds were raised through new issuances of a 7-year and 10-year Malaysian Government Security (MGS) and 5-year, 7-year and 15-year Government Investment Issue (GII), as well as the re-opening of a 3-year and 15-year MGS. Additionally, funds were raised via a RM4.0 billion issuance of the Government Housing Sukuk.
In the private sector, net funds raised were also lower at RM7.8 billion (4Q 2014: RM11.2 billion), due mainly to lower net issuances of private debt securities (PDS). Funds raised in the PDS market were mainly driven by issuances in the fi nance, insurance, real estate and business services sector, which were used to fi nance new activities. Meanwhile, equity issuances during the quarter were higher amounting to RM4.7 billion (4Q 2014: RM1.0 billion).
2014 2015
1Q 4Q Year 1Q
RM billion
By Public SectorGovernment securities, Gross
Malaysian Government SecuritiesGovernment Investment IssuesSukuk Pinjaman Perumahan Kerajaan
24.0 27.5 14.5 9.0 4.0
15.3 22.8 12.7 6.6 3.4
49.9 96.8 51.4
33.9 11.5
13.2 27.0 13.5 9.5 4.0
Less: Redemptions Malaysian Government Securities Government Investment IssuesSukuk Pinjaman Perumahan Kerajaan
3.5-
3.5-
7.52.05.5
-
46.926.420.5
-
13.811.82.0
-
By Private SectorSharesPrivate Debt Securities, Net
Private Debt Securities, GrossLess: Redemptions
15.4 4.2
11.2 20.5
9.4
11.2 1.0
10.2 21.6 11.4
50.2 19.2 31.0 85.5 54.5
7.8 4.7 3.1
10.9 7.8
Total 39.4 26.4 100.1 21.0
Note: Numbers may not add up to total due to rounding
Source: Bank Negara Malaysia and Bursa Malaysia
Net Funds Raised in the Capital Market
Private Debt Securities Issued by Purpose (% of total)
New activities Refinancing Mergers & Acquisitions
Others1
4Q 2014 1Q 20151 Includes issuance by non-residents & Cagamas and for the purpose of working capital and general business activities
Source: Bank Negara Malaysia
%
19.0
9.7
0.0
71.2
34.1
2.2 0.7
63.1
0
10
20
30
40
50
60
70
80
29
Quarterly BulletinFirst Quarter 2015

Bond yields declined in the fi rst quarter
MGS yields were on a declining trend in the fi rst quarter amid the resumption of non-resident infl ows amounting to RM6.1 billion into the MGS market during the quarter. For the quarter as a whole, yields on the 3-year, 5-year and 10-year MGS declined by 30, 25, 25 basis points respectively. In the PDS market, corporate yields remained relatively stable on account of sustained demand by domestic investors.
Secondary trading in the bond market increased
Total trading in the secondary market increased to RM238.4 billion during the quarter (4Q 2014: RM181.2 billion), refl ecting increased and steady trading activities by fi nancial institutions and non-resident investors. The increase in turnover was mainly concentrated in the trading of MGS and GII which registered higher liquidity ratio of 0.42 and 0.38 respectively. The liquidity ratio in the PDS segment remained relatively unchanged at 0.06.
Source: Bank Negara Malaysia
Trend in MGS Yields
Years to maturity
2.8
3.0
3.2
3.4
3.6
3.8
4.0
4.2
4.4
1 2 3 4 5 6 7 8 9 10
%
Sep ‘14
Dec ‘14
3 year: -29.6 bps
5 year: -24.5 bps
10 year: -25.3 bps Mar ‘15
Source: Bank Negara Malaysia
5 year MGS and 5 year Corporate Bond Yield
%
2.5 3.0 3.5 4.0 4.5 5.0 5.5 6.0 6.5 7.0 7.5 8.0
Mar
‘10
Jun
‘10
Sep
‘10
Dec
‘10
Mar
‘11
Jun
‘11
Sep
‘11
Dec
‘11
Mar
‘12
Jun
‘12
Sep
‘12
Dec
‘12
Mar
‘13
Jun
‘13
Sep
‘13
Dec
‘13
Mar
‘14
Jun
‘14
Sep
‘14
Dec
‘14
Mar
‘15
AAA 4.221 AA 4.641
A 6.986
MGS 3.590
Liquidity Ratio: Value of Bond Traded /Outstanding
1Q 20154Q 2014
Source: Bank Negara Malaysia
0.42
0.38
0.06
0.33
0.24
0.06
0.00 0.05 0.10 0.15 0.20 0.25 0.30 0.35 0.40 0.45
MGS
GII
PDS
Quarterly BulletinFirst Quarter 2015
30

FBM KLCI increased during the quarter, in tandem with regional markets
In the fi rst quarter, the FBM (FTSE Bursa
Malaysia) KLCI increased by 3.9% to close at
1,830.8 points (end-Dec 2014: 1,761.3 points).
The increase was driven mainly by higher
demand by domestic investors, supported by
the announcement of strong corporate earnings
for 4Q 2014. In line with the trends in global and
regional markets, the index was further lifted by
renewed interest from foreign investors amid the
announcement of additional monetary stimulus
by the European Central Bank.
Overall, market capitalisation increased to
RM1.74 trillion as at end-March 2015 (end-
December 2014: RM1.65 trillion) while the
daily average turnover increased to 2.11 billion
units (4Q 2014: 1.94 billion units) during the
quarter.
On 13 May 2015, the FBM KLCI ended lower
at 1,803.0 points (since end-Mar 2015: -1.5%),
with market capitalisation of RM1.72 trillion
(since end-Mar 2015: -0.8%).
Bursa Malaysia: Market Turnover2014 2015
1Q 4Q Year 1Q
Billionunits
RMbillion
Billionunits
RMbillion
Billionunits
RMbillion
Billionunits
RMbillion
TurnoverOf which:
Main BoardOf which
Consumer ProductsIndustrial ProductsConstructionTrading/ServicesFinancePropertiesPlantationsInfrastructure
ACE Market1
120.7
91.3
8.4 18.9
4.0 33.9
3.4 10.5
1.7 1.5
26.8
127.4
119.7
7.1 13.1
5.9 51.9 18.8
7.8 5.4 4.7 7.0
122.5
85.5
5.3 13.3
3.4 42.0
3.1 6.1 1.2 1.3
30.3
126.0
117.3
5.2 11.2 5.7
56.7 18.7
6.3 3.6 4.4 7.3
530.7
397.1
29.6 72.0 19.0
172.0 13.9 41.0
6.3 5.4
115.6
531.8
501.2
26.3 52.2 26.3
219.0 84.9 34.6 19.8 17.2 27.1
124.3
75.8
7.4 12.8
3.7 32.7
3.5 5.4 1.0 1.0
41.2
128.5
117.7
6.4 11.1 5.9
55.4 21.3
4.8 3.5 4.4 8.7
1From 3 August 2009, MESDAQ market was replaced with ACE Market
Source: Bursa Malaysia
Bursa Malaysia: Selected Market Indicators2014 2015
As at end
Mar Dec Year Mar
Price IndicesCompositeFBMEMAS1
ACE Market2
Market capitalisation (RM billion)No. of companies listed
1,849.2 12,797.6 6,661.3
1,719.1907
1,761.3
12,066.3 5,653.4
1,651.2906
1,761.3
12,066.3 5,653.4
1,651.2906
1,830.8 12,563.4 7,120.2
1,737.5903
During the period
1Q 4Q Year 1Q
Average daily turnoverVolume (million units)Value (RM million)
2,046.4 2,158.8
1,944.4 1,999.9
2,157.1 2,161.8
2,107.4 2,177.4
1 FBMEMAS stands for FTSE Bursa Malaysia EMAS Index2 From 3 August 2009, MESDAQ market was replaced with ACE Market Source: Bursa Malaysia
4Q 2014 1Q 2015
Source: Bloomberg and Bank Negara Malaysia calculations
Performance of Selected Global and Regional EquityMarkets in 2015 (% growth QoQ)
4.4 -5.5
2.7
-0.9
-4.6
1.7
-5.2 1.7
-0.7 7.9
36.8
0.4 0.6
2.4
3.2
3.9
5.6
6.5
8.8
9.8
10.1
15.9
-10 -5 0 5 10 15 20 25 30 35 40
US Thailand
Singapore UK
Malaysia Indonesia
Korea Australia
Philippines Japan
PR China
(%)
31
Quarterly BulletinFirst Quarter 2015
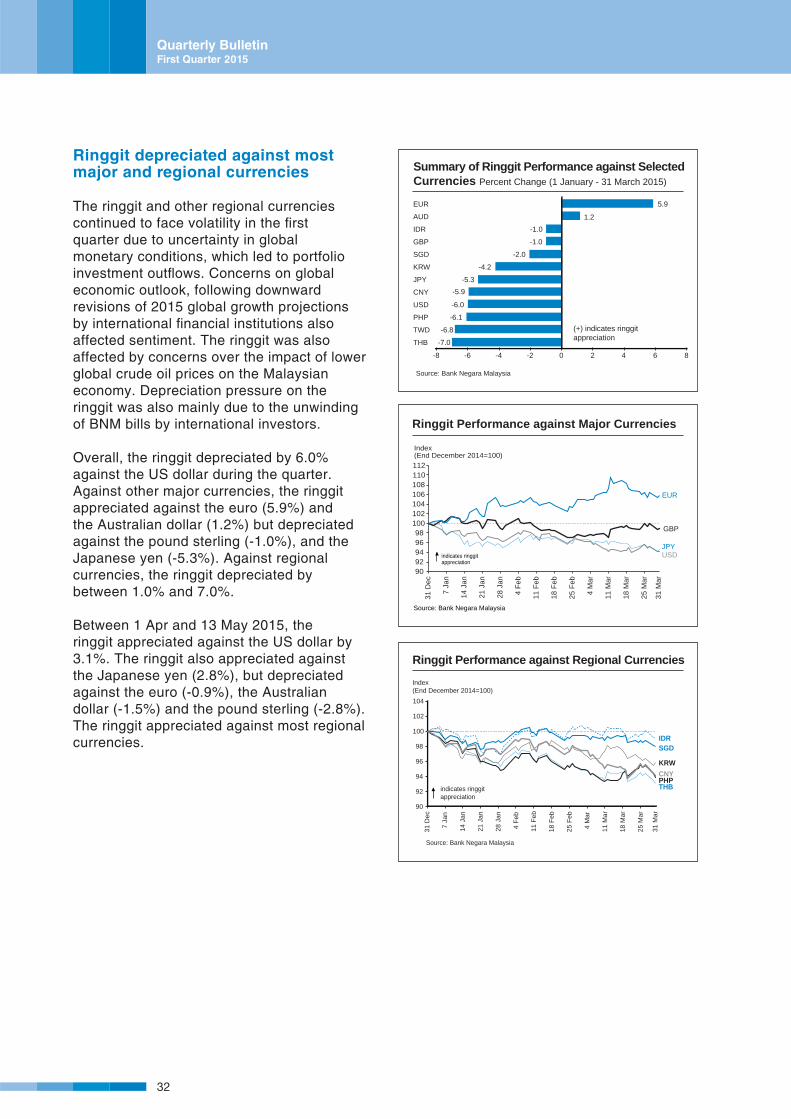
Ringgit depreciated against most major and regional currencies
The ringgit and other regional currencies
continued to face volatility in the fi rst
quarter due to uncertainty in global
monetary conditions, which led to portfolio
investment outfl ows. Concerns on global
economic outlook, following downward
revisions of 2015 global growth projections
by international fi nancial institutions also
affected sentiment. The ringgit was also
affected by concerns over the impact of lower
global crude oil prices on the Malaysian
economy. Depreciation pressure on the
ringgit was also mainly due to the unwinding
of BNM bills by international investors.
Overall, the ringgit depreciated by 6.0%
against the US dollar during the quarter.
Against other major currencies, the ringgit
appreciated against the euro (5.9%) and
the Australian dollar (1.2%) but depreciated
against the pound sterling (-1.0%), and the
Japanese yen (-5.3%). Against regional
currencies, the ringgit depreciated by
between 1.0% and 7.0%.
Between 1 Apr and 13 May 2015, the
ringgit appreciated against the US dollar by
3.1%. The ringgit also appreciated against
the Japanese yen (2.8%), but depreciated
against the euro (-0.9%), the Australian
dollar (-1.5%) and the pound sterling (-2.8%).
The ringgit appreciated against most regional
currencies.
Source: Bank Negara Malaysia
Summary of Ringgit Performance against Selected Currencies Percent Change (1 January - 31 March 2015)
-7.0
-6.8
-6.1
-6.0
-5.9 -5.3
-4.2
-2.0
-1.0
-1.0 1.2
5.9
-8 -6 -4 -2 0 2 4 6 8
THB
TWD
PHP
USD
CNY
JPY
KRW
SGD
GBP
IDR
AUD
EUR
(+) indicates ringgit appreciation
Ringgit Performance against Major Currencies
Index (End December 2014=100)
Source: Bank Negara Malaysia
90 92 94 96 98
100 102 104 106 108 110 112
31 D
ec
7 Ja
n
14 J
an
21 J
an
28 J
an
4 Fe
b
11 F
eb
18 F
eb
25 F
eb
4 M
ar
11 M
ar
18 M
ar
25 M
ar
USD JPY
GBP
EUR
indicates ringgit appreciation
31 M
ar
indicates ringgit appreciation
Source: Bank Negara Malaysia
Ringgit Performance against Regional Currencies
Index(End December 2014=100)
90
92
94
96
98
100
102
104
31 D
ec
7 Ja
n
14 J
an
21 J
an
28 J
an
4 Fe
b
11 F
eb
18 F
eb
25 F
eb
4 M
ar
11 M
ar
18 M
ar
25 M
ar
IDR
PHP
SGD
THB
KRW CNY
31 M
ar
Quarterly BulletinFirst Quarter 2015
32
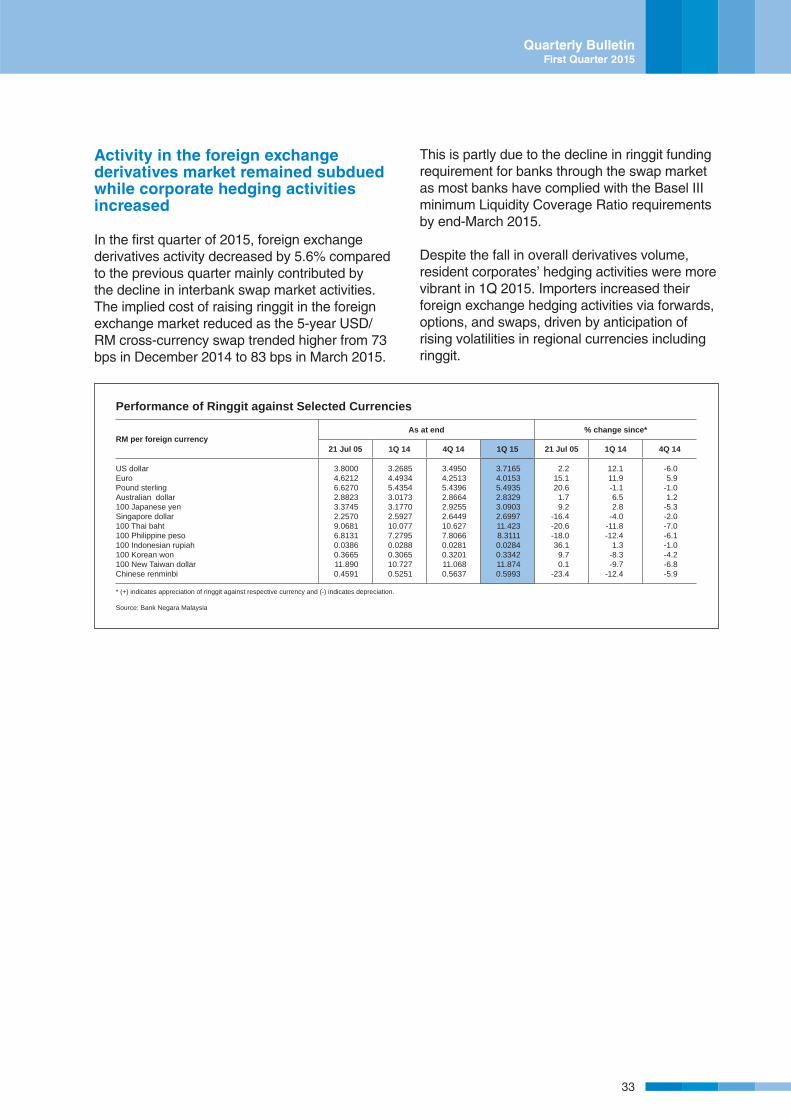
Activity in the foreign exchange derivatives market remained subdued while corporate hedging activities increased
In the fi rst quarter of 2015, foreign exchange
derivatives activity decreased by 5.6% compared
to the previous quarter mainly contributed by
the decline in interbank swap market activities.
The implied cost of raising ringgit in the foreign
exchange market reduced as the 5-year USD/
RM cross-currency swap trended higher from 73
bps in December 2014 to 83 bps in March 2015.
This is partly due to the decline in ringgit funding
requirement for banks through the swap market
as most banks have complied with the Basel III
minimum Liquidity Coverage Ratio requirements
by end-March 2015.
Despite the fall in overall derivatives volume,
resident corporates’ hedging activities were more
vibrant in 1Q 2015. Importers increased their
foreign exchange hedging activities via forwards,
options, and swaps, driven by anticipation of
rising volatilities in regional currencies including
ringgit.
RM per foreign currencyAs at end % change since*
21 Jul 05 1Q 14 4Q 14 1Q 15 21 Jul 05 1Q 14 4Q 14
US dollarEuroPound sterlingAustralian dollar100 Japanese yenSingapore dollar100 Thai baht100 Philippine peso100 Indonesian rupiah100 Korean won100 New Taiwan dollarChinese renminbi
3.80004.62126.62702.88233.37452.25709.06816.81310.03860.366511.8900.4591
3.26854.49345.43543.01733.17702.592710.0777.27950.02880.306510.7270.5251
3.49504.25135.43962.86642.92552.644910.6277.80660.02810.320111.0680.5637
3.71654.01535.49352.83293.09032.699711.4238.31110.02840.334211.8740.5993
2.215.120.6
1.79.2
-16.4-20.6-18.036.1
9.70.1
-23.4
12.111.9-1.16.52.8
-4.0-11.8-12.4
1.3-8.3-9.7
-12.4
-6.05.9
-1.01.2
-5.3-2.0-7.0-6.1-1.0-4.2-6.8-5.9
* (+) indicates appreciation of ringgit against respective currency and (-) indicates depreciation.
Source: Bank Negara Malaysia
Performance of Ringgit against Selected Currencies
33
Quarterly BulletinFirst Quarter 2015
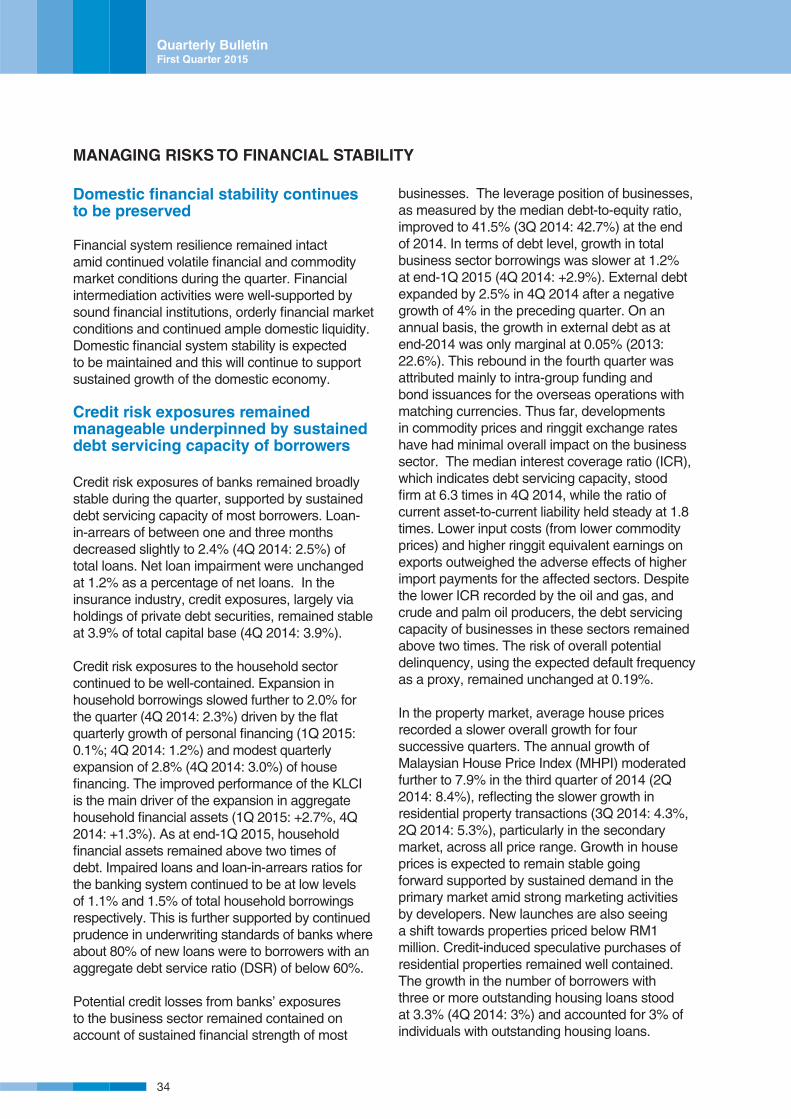
MANAGING RISKS TO FINANCIAL STABILITY
Domestic fi nancial stability continues to be preserved
Financial system resilience remained intact
amid continued volatile fi nancial and commodity
market conditions during the quarter. Financial
intermediation activities were well-supported by
sound fi nancial institutions, orderly fi nancial market
conditions and continued ample domestic liquidity.
Domestic fi nancial system stability is expected
to be maintained and this will continue to support
sustained growth of the domestic economy.
Credit risk exposures remained manageable underpinned by sustained debt servicing capacity of borrowers
Credit risk exposures of banks remained broadly
stable during the quarter, supported by sustained
debt servicing capacity of most borrowers. Loan-
in-arrears of between one and three months
decreased slightly to 2.4% (4Q 2014: 2.5%) of
total loans. Net loan impairment were unchanged
at 1.2% as a percentage of net loans. In the
insurance industry, credit exposures, largely via
holdings of private debt securities, remained stable
at 3.9% of total capital base (4Q 2014: 3.9%).
Credit risk exposures to the household sector
continued to be well-contained. Expansion in
household borrowings slowed further to 2.0% for
the quarter (4Q 2014: 2.3%) driven by the fl at
quarterly growth of personal fi nancing (1Q 2015:
0.1%; 4Q 2014: 1.2%) and modest quarterly
expansion of 2.8% (4Q 2014: 3.0%) of house
fi nancing. The improved performance of the KLCI
is the main driver of the expansion in aggregate
household fi nancial assets (1Q 2015: +2.7%, 4Q
2014: +1.3%). As at end-1Q 2015, household
fi nancial assets remained above two times of
debt. Impaired loans and loan-in-arrears ratios for
the banking system continued to be at low levels
of 1.1% and 1.5% of total household borrowings
respectively. This is further supported by continued
prudence in underwriting standards of banks where
about 80% of new loans were to borrowers with an
aggregate debt service ratio (DSR) of below 60%.
Potential credit losses from banks’ exposures
to the business sector remained contained on
account of sustained fi nancial strength of most
businesses. The leverage position of businesses,
as measured by the median debt-to-equity ratio,
improved to 41.5% (3Q 2014: 42.7%) at the end
of 2014. In terms of debt level, growth in total
business sector borrowings was slower at 1.2%
at end-1Q 2015 (4Q 2014: +2.9%). External debt
expanded by 2.5% in 4Q 2014 after a negative
growth of 4% in the preceding quarter. On an
annual basis, the growth in external debt as at
end-2014 was only marginal at 0.05% (2013:
22.6%). This rebound in the fourth quarter was
attributed mainly to intra-group funding and
bond issuances for the overseas operations with
matching currencies. Thus far, developments
in commodity prices and ringgit exchange rates
have had minimal overall impact on the business
sector. The median interest coverage ratio (ICR),
which indicates debt servicing capacity, stood
fi rm at 6.3 times in 4Q 2014, while the ratio of
current asset-to-current liability held steady at 1.8
times. Lower input costs (from lower commodity
prices) and higher ringgit equivalent earnings on
exports outweighed the adverse effects of higher
import payments for the affected sectors. Despite
the lower ICR recorded by the oil and gas, and
crude and palm oil producers, the debt servicing
capacity of businesses in these sectors remained
above two times. The risk of overall potential
delinquency, using the expected default frequency
as a proxy, remained unchanged at 0.19%.
In the property market, average house prices
recorded a slower overall growth for four
successive quarters. The annual growth of
Malaysian House Price Index (MHPI) moderated
further to 7.9% in the third quarter of 2014 (2Q
2014: 8.4%), refl ecting the slower growth in
residential property transactions (3Q 2014: 4.3%,
2Q 2014: 5.3%), particularly in the secondary
market, across all price range. Growth in house
prices is expected to remain stable going
forward supported by sustained demand in the
primary market amid strong marketing activities
by developers. New launches are also seeing
a shift towards properties priced below RM1
million. Credit-induced speculative purchases of
residential properties remained well contained.
The growth in the number of borrowers with
three or more outstanding housing loans stood
at 3.3% (4Q 2014: 3%) and accounted for 3% of
individuals with outstanding housing loans.
Quarterly BulletinFirst Quarter 2015
34

Exposures to market risk was well-contained
Domestic fi nancial markets remained resilient
despite heightened volatility during the quarter.
Portfolio investments recorded a lower net outfl ow
position of RM7.9 billion (4Q 2014: net outfl ow
of RM20.3 billion) for the quarter. The outfl ow
was attributable mainly to domestic institutional
investors’ portfolio investment abroad. The
average volatility of the FBM KLCI rose to 11.7%
(4Q 2014: 7.7%) while the average volatility of
the 10-year MGS yield doubled to 13% (4Q 2014:
6.7%). The FBM KLCI ended the quarter higher
at 1,830.8 points (4Q 2014: 1,761.3 points) in line
with other regional equity markets on investor
expectations of a possible delayed increase in US
interest rates. Yields for the 10-year MGS eased
to 3.9% (4Q 2014: 4.1%), refl ecting sustained
interest by non-residents in the MGS market.
The price-to-earnings ratio of the FBM KLCI
remained broadly stable at 16.9 times (4Q 2014:
16.3 times), underpinned by strong economic
fundamentals of the country. Trading liquidity, both
in terms of price and volume, remained intact. The
bid-ask spreads for MGS and FBM KLCI were
unchanged at 0.1% and 0.4% of the mid-price
respectively. The turnover ratio for MGS and FBM
KLCI was higher at 14.5% and 2.0% respectively
(4Q 2014: 10.8% and 1.8% respectively) refl ecting
active trading activities by domestic institutional
investors and fi nancial institutions.
Market risk exposures of fi nancial institutions
remained within manageable levels, supported by
continuous active risk management and hedging
strategies by the institutions. Bank exposures
to interest rate risk in the trading book remained
limited at 1.4% of total capital. Exposures to equity
risk were almost unchanged at 1.2% (4Q 2014:
1.3%) of total capital. The foreign exchange net
open position of banks edged higher to 5.9% (4Q
2014: 4.7%) of total capital during the quarter
mainly driven by higher foreign currency deposit
placements by Malaysian banks. Similarly, market
risk exposures of the insurance industry remained
manageable to account for 12.9% of total capital
(4Q 2014: 12.2%) amidst higher investments in
equities as a result of portfolio rebalancing. Equity
risk continues to form the bulk of insurers’ market
risk exposures at 7.7% of total capital.
Financial institutions continued to remain sound and resilient
The strong capitalisation of the banking system
was well-preserved with the common equity tier
1 (CET1) capital ratio, tier 1 capital ratio and total
capital ratio remaining well above the minimum
regulatory levels at 12.5%, 13.2% and 15.2%
respectively. More than 80% of banks’ total capital
consists of high quality capital - retained earnings,
paid-up capital and reserves. The excess total
capital buffer for banks was sustained in excess
of RM90 billion. The capital adequacy ratio of
the insurance sector similarly remained strong at
246.5% (4Q 2014: 252.1%) with an excess capital
buffer of RM30.1 billion.
The banking system registered pre-tax profi t
totalling RM7.1 billion (4Q 2014: RM7.8 billion)
in the fi rst quarter. This was due mainly to lower
contribution of revenue from dividend income
segment. Returns on assets and equity were at
1.2% and 12.4% respectively (4Q 2014: 1.5%
and 15.2% respectively). The operating profi t for
Banking System: Loan Quality
Source: Bank Negara Malaysia
Net impaired loansNet impaired loans ratio (RHS)Gross impaired loans ratio for businesses (RHS)Gross impaired loans ratio for households (RHS) Gross impaired loans ratio for SMEs (RHS)
RM billion %
0
2
4
6
8
0
5
10
15
20
25
1Q 2Q 3Q 4Q 1Q 2Q 3Q 4Q 1Q 2Q 3Q 4Q 1Q 2Q 3Q 4Q 1Q 2011 2012 2013 2014 2015
RM billion %
2013 2014 2015
Banking System: Basel III Capitalisation
Source: Bank Negara Malaysia
Common equity tier 1 capital ratio Excess capital (RHS)
Tier 1 capital ratio Total capital ratio
60
70
80
90
100
8
10
12
14
16
1Q 2Q 3Q 4Q 1Q 2Q 3Q 4Q 1Q
15.2
13.2
12.5
35
Quarterly BulletinFirst Quarter 2015

the general insurance and takaful businesses
increased to RM806.1 million (4Q 2014:
RM763.4 million) due to stronger underwriting
profi ts recorded during the quarter. Excess
income over outgo of the life insurers and
takaful operators improved to RM5.4 billion (4Q
2014: RM2.1 billion) due to net capital gains of
RM2.1 billion (4Q 2014: net capital loss of RM0.9
billion) mainly from investment in equities.
Competition for deposits eased slightly following
the Bank’s clarifi cation of the Liquidity Coverage
Ratio rules, although it remains at an elevated
level. Liquidity in the banking system remained
ample with liquidity buffers for maturities over
the 1-week and 1-month horizons standing well
above the minimum regulatory levels under
the existing liquidity framework at 16.3% and
16% of total deposits respectively (4Q 2014:
17.4% and 15.8% respectively). In addition, the
net interbank placements and reverse repo by
banking institutions with Bank Negara Malaysia,
which can be unwound to meet liquidity needs,
remained above RM100 billion. In terms of US
dollar liquidity, banks recorded a higher surplus
position of RM20 billion in the less than 1-week
maturity bucket (4Q 2014: surplus of RM15
billion) following a lower amount of net outfl ows
from maturing FX derivative contracts payable.
For the less than 1-month maturity bucket, banks
recorded a surplus of RM2.4 billion compared to
a surplus of RM5.5 billion at end-2014.
Insurance Sector: Capitalisation
Total capital available Total capital required
Capital adequacy ratio (RHS)
Source: Bank Negara Malaysia
%RM billion
2011 1Q 2Q 3Q 4Q
20121Q 2Q 3Q 4Q
2013 1Q 2Q 3Q 4Q
2014 20151Q 1Q 2Q 3Q 4Q 210
220
230
240
250
260
10
0
20
30
40
50
60
Insurance Sector: Capitalisation
Total capital available Total capital required
Capital adequacy ratio (RHS)
Source: Bank Negara Malaysia
%RM billion
210
220
230
240
250
260
10
0
20
30
40
50
60
Banking System: Profitability
Return on assets Return on equity (RHS)
Source: Bank Negara Malaysia
% %
2011 2012 2013 2014 2015
0
5
10
15
20
25
0
1
2
3
1Q 2Q 3Q 4Q 1Q 2Q 3Q 4Q 1Q 2Q 3Q 4Q 1Q 2Q 3Q 4Q 1Q
12.4
1.2
Banking System: Liquidity Buffer to Total Deposit Ratio
Source: Bank Negara Malaysia
Liquidity buf fer <1-week maturity
Liquidity buf fer <1-month maturity
%
2012 2013 2014 2015
5
10
15
20
25
1Q 2Q 3Q 4Q 1Q 2Q 3Q 4Q 1Q 2Q 3Q 4Q 1Q
16.3
16.0
2014 2015
1Q 4Q Year 1Q
RM million
Life insurance & family takafulExcess of income over outgo
General insurance & general takafulOperating profi tClaims ratio (%)
3,211
82455.0
2,127
76357.5
13,767
3,17957.5
5,354
80649.3
Annual Change (%)
Life insurance & family takafulExcess of income over outgo
General insurance & general takafulOperating profi tClaims ratio (percentage points)
-15.2
11.4-3.4
-36.4
-26.70.4
4.4
-1.40.4
66.7
-2.2-5.7
Source: Bank Negara Malaysia
Insurance and Takaful Sectors: Indicators
Quarterly BulletinFirst Quarter 2015
36

Islamic Economy Award 2014 Dubai, 14 January 2015
Speech by
Tan Sri Dato’ Sri Dr. Zeti Akhtar AzizGovernor, Bank Negara Malaysia
It is my very great honour to receive the
Lifetime Achievement Award for the global
development of Islamic fi nance conferred
under the patronage of His Highness Sheikh
Mohammed bin Rashid Al Maktoum. I am most
humbled to receive this award. It has been my
privilege to contribute to the international efforts
to create the foundations for a sustainable and
resilient Islamic fi nancial system in the global
fi nancial system. This recent decade has been
highly challenging for the world of fi nance, yet
the experience of confronting the challenges
has been tremendously fulfi lling. The overall
progress and advancement of Islamic fi nance
has continued to be accompanied by growth,
dynamism and stability.
Islamic fi nance brings immense benefi ts to
the overall economy. It is a form of fi nancial
intermediation that is well anchored to the
real economy. With its internationalisation,
that began at the turn of the millennium, it
now serves to enhance and strengthen the
interlinkages between economies, facilitating
international trade and cross border investment
activities. This trend has marked the beginning
of intensifi ed collective efforts to enhance
the Islamic fi nancial infrastructure to create
a robust and resilient global Islamic fi nancial
system.
The focus has gradually shifted from
strengthening intermediaries in the domestic
Islamic fi nancial industry to fortifying the
regulatory, supervisory, Shariah and liquidity
framework necessary for such a robust
fi nancial system. This has involved greater
international cooperation and collaboration in
this new environment. A further development
has been the evolution of the domestic Islamic
fi nancial markets into international markets.
This has manifested itself in the form of
foreign participation in raising funds and in
investment activities in these markets, thus
generating increased cross border fi nancial
fl ows. This has drawn participation from both
emerging and the developed world in Islamic
and non-Islamic countries. Going forward, the
Islamic fi nancial system is envisaged to have
an increasing important role in connecting the
world economies – through the strengthening
of fi nancial linkages, it will in turn facilitate
increased international trade and investment
activities.
This internationalisation of Islamic fi nance
will require the intensifi cation of international
collective efforts to establish the international
Islamic fi nancial architecture, and the
development of mechanisms for more effective
cross-border liquidity management. Central to
achieving this next thrust of development is to
develop a high caliber and competent talent
base to cultivate fi nancial innovation. Therein
lies the investment needed in human capital
development to support the industry.
While Malaysia’s own experience and
aspirations is to evolve into an international
Islamic fi nancial centre, we also continue to
promote a more inclusive fi nancial system
to support a more balanced growth. On the
international front, the aim is to enhance
our international connectivity and thus
establish greater economic linkages with
other economies. In Dubai, the efforts by the
authorities to create the Islamic economy
initiative to further enhance the inter-linkages
with other Islamic fi nancial centres is also a
step towards strengthening the international
economic connectivity especially between
our regions. The efforts will not only enhance
Islamic fi nance as an effective fi nancial
intermediary but also as a binding force for
the other segments of the Islamic economy,
including with other parts of the world.
37
Quarterly BulletinFirst Quarter 2015

Our collective efforts in developing Islamic
fi nance will provide an important platform to
unlock the potential opportunities that lie therein
to benefi t every segment of the society and the
business community that now extends beyond
our domestic borders. In this highly dynamic and
rapidly changing world environment, efforts will
need to be unrelenting on developing further
the enabling infrastructure, the foundations for
stability and enhancing the internal capability.
And with the greater international linkages,
the greater will be the importance of working
collectively for the common goals we aspire and
for which the benefi ts will be mutually reinforcing.
Quarterly BulletinFirst Quarter 2015
38
CALENDAR OF EVENTSJanuary – April 2015
14 January 2015
Governor Dr. Zeti received the Lifetime Achievement Award for the global development of
Islamic fi nance at the Second Islamic Economy Award Ceremony in Dubai. In her speech, she
highlighted the intensifi ed collaborative efforts to enhance the Islamic fi nancial infrastructure to
create a robust and resilient global Islamic fi nancial system and the investment needed in human
capital development to support the industry. She also pointed out Malaysia’s own experience and
aspirations in evolving into an international Islamic fi nancial centre and continuing efforts to promote
a more inclusive fi nancial system to support a more balanced growth.
23 January 2015
The Bank established a Special Relief Facility of RM500 million to alleviate the problems faced by
businesses affected by the recent fl oods. The businesses can obtain fi nancing at a concessionary
rate from any commercial bank, Islamic bank, and other selected participating fi nancial institutions.
It is available to Malaysian SMEs affected in the districts defi ned as fl ood disaster areas with a
maximum amount of fi nancing of RM500,000 per group of companies. Its effective fi nancing rate
chargeable is up to 2.25% per annum and tenure of the fi nancing is up to fi ve years with a grace
period of six months.
27 January 2015
The ASEAN Working Committee on Payment and Settlement Systems (WCPSS) adopted the
Principles of Product Transparency and Disclosure (Principles) to improve the level of transparency
on charges and service levels offered by fi nancial institutions in the ASEAN region for cross-border
trade settlement. The Principles are designed to ensure that customers have clear, timely, easily
accessible and comparable key information to make an informed decision in performing cross-border
trade settlement. The WCPSS also aims to improve the payment and settlement infrastructure for
ASEAN member countries that will stand ready to support the fi nancial integration within the Asean
Economic Community.
28 January 2015
The Bank kept the Overnight Policy Rate (OPR) at 3.25% at its fi rst Monetary Policy Committee
(MPC) meeting for the year. At the current OPR level, the monetary policy stance remains
accommodative given the developments in monetary and fi nancial conditions.
At its subsequent meeting on 5 March, the MPC maintained the OPR. The MPC’s assessment was
that while divergent growth was seen among advanced economies, domestic demand continues to
support Asian growth. For Malaysia, the economy is expected to remain on a steady growth path with
domestic demand as a key driver of growth. In the external sector, the performance of manufactured
exports is expected to improve. The MPC added that underlying infl ation is expected to remain
contained amid stable domestic demand conditions.
The MPC will continue to assess external and domestic developments and their implications on the
risks to infl ation and on the Malaysian economy as well as monitor risks of destabilising fi nancial
imbalances to ensure sustainable growth prospects.
39
Quarterly BulletinFirst Quarter 2015

12 February 2015
The Bank called a press conference to announce the release of 4Q 2014 GDP results. Governor
Dr. Zeti highlighted that the Malaysian economy registered a higher growth of 5.8% in 4Q 2014
driven mainly by stronger private sector spending. On the supply side, growth was sustained by
the major economic sectors, led by trade and domestic activities. For the year 2014, the Malaysian
economy grew by a strong 6.0%. During the Q&A session, Governor Dr. Zeti also clarifi ed several
misperceptions on the Malaysian economy, including the role of oil and gas activities in the economy.
26 February 2015
The Bank and the United Kingdom Foreign and Commonwealth Office co-hosted the second Global
Islamic Finance and Investment Group meeting at Sasana Kijang. The meeting was co-chaired by
Governor Dr. Zeti and the Rt. Hon. Hugo Swire, Minister of State at the United Kingdom Foreign
and Commonwealth Office. The attendance of members and invitees from various countries brought
upon interesting dialogues on opportunities and potential solutions to address challenges in global
Islamic fi nance. The key outcomes of the meeting were to improve communications to foster better
understanding on Islamic fi nance globally and to enhance efforts to link the fl ow of Islamic fi nance
funds into infrastructure needs and to support economic development globally.
11 March 2015
The Bank appointed Datuk Dr. Noor Azlan Ghazali and Dr. Yeah Kim Leng as external members
of Bank Negara Malaysia’s MPC for a two-year term effective 1 April 2015. The Central Bank of
Malaysia Act 2009 provides for the appointment of external members to the MPC. The appointment
of Datuk Dr. Noor Azlan Ghazali and Dr. Yeah Kim Leng will enhance the collective expertise and
experience relevant to the responsibilities and functions of the MPC. With their appointments, the
MPC will have ten members in total.
On the same day, the Bank released its Annual Report and the Financial Stability and Payment
Systems Report for 2014.
At the press conference, Governor Dr. Zeti remarked that the global economy expanded at a
moderate pace in 2014. Global fi nancial markets also faced heightened volatility in the later part
of 2014, following uncertainty on monetary policy normalisation in the US and sharp declines in
commodity prices.
Governor Dr. Zeti also announced that the Malaysian economy recorded a stronger growth of
6.0% in 2014 driven primarily by the continued strength of private domestic demand supported
by improvement in external sector. For 2015, the Malaysian economy is expected to register
steady growth of 4.5% - 5.5%, supported by sustained domestic demand and a resilient export
sector. Touching on infl ation for 2015, Governor said it is expected to be contained despite GST
implementation, largely on impact of lower oil prices. Infl ation is projected to be between 2-3%.
Governor Dr. Zeti also pointed out that domestic fi nancial stability continued to be preserved in 2014.
The country’s deep fi nancial markets and strong domestic institutional investors have supported
orderly market conditions despite higher funds outfl ows. Further, risks arising from household
indebtedness and rising property prices have moderated due to the various measures with new
household borrowings of higher quality. She also said that Islamic fi nance industry continued its
growth momentum in 2014.
Quarterly BulletinFirst Quarter 2015
40

Governor Dr. Zeti also drew attention to other key developments in the Malaysian fi nancial sector
such as the establishment of the Financial Services Talent Council and the Financial Services
Professional Board; the establishment of the Asia School of Business - a collaboration between
the Bank and Massachusetts Institute of Technology’s Sloan School of Management; appointment
of a renminbi clearing bank; the passage of the Netting of Financial Agreements Act 2015; and
transforming the existing Financial Mediation Bureau into a full-fl edged fi nancial ombudsman
scheme.
17 March 2015
The Bank announced the appointment of new members of the Small Debt Resolution Committee
effective 1 March 2015 with Datuk Wan Azhar Wan Ahmad appointed as the Chairman. The
Committee undertakes independent assessments on the viability of the SMEs’ businesses and
proposes rehabilitation solutions through restructuring or rescheduling of existing fi nancing facilities,
or providing new fi nancing, where appropriate. Since its inception in 2003, the Small Debt Resolution
Scheme has received a total of 1,316 applications with 916 applications approved for restructuring
or rescheduling. Of this amount, about 50 per cent of the SMEs assisted were able to improve their
businesses cash fl ow conditions, turn around their businesses and continue to remain viable.
27 March 2015
The Bank and Hong Kong Monetary Authority (HKMA) co-organised the Second Malaysia-Hong
Kong Private Sector Dialogue on Offshore Renminbi (RMB) Business in Johor Bahru. Its aim
was to foster closer collaboration between Malaysia and Hong Kong on the development of RMB
business and was attended by senior representatives of banks from Malaysia and Hong Kong and
representatives from corporates and businesses. Among others, the Dialogue reviewed the recent
progress in internationalisation of RMB and the continuing efforts in making the RMB capital account
convertible.
29 March 2015
The Bank’s second auction of Malaysian banknotes with special serial numbers was held at Sasana
Kijang. It received responses from 113 registered bidders, consisting of private collectors and traders
both locals and from abroad. All lots were successfully auctioned off with total proceeds of more than
RM660,000 for a total face value of RM7,264. The auction proceeds will be channelled to support
the Corporate Social Responsibility programs of the Bank, including the provision of free gadgets to
assist the visually impaired and small retailers in identifying and authenticating banknotes. They will
also be used for outreach programs to educate the public on techniques to authenticate banknotes
and coins as well as the proper handling of polymer banknotes.
41
Quarterly BulletinFirst Quarter 2015

Acronyms and Abbreviations
ABIF ASEAN Banking Integration Framework
ADB Asian Development Bank
AFI Alliance for Financial Inclusion
ALR average lending rate
APN Asian Payment Network
BI Bank Indonesia
BIS Bank for International Settlements
BLR base lending rate
BNM Bank Negara Malaysia
BNMN Bank Negara Monetary Notes
BoE Bank of England
BoJ Bank of Japan
BR Base Rate
CET1 common equity tier 1
CMP Commodity Murabahah Programme
CoFC consumption of fi xed capital
CPI Consumer Price Index
DIA direct investment abroad
DOSM Department of Statistics, Malaysia
DSR debt service ratio
E&E electronics and electrical
E&O Errors and Omissions
ECB European Central Bank
EOR enhanced oil recovery
ETP Economic Transformation Programme
EU European Union
FBM KLCI FTSE Bursa Malaysia Kuala Lumpur Composite Index
FD fi xed deposit
FDI foreign direct investment
Fed Federal Reserve
FOMC Federal Open Market Committee
FSB Financial Stability Board
FX foreign exchange
GDP Gross Domestic Product
GFCF gross fi xed capital formation
GFP goods for processing
GIFF Global Islamic Financial Forum
GII Government Investment Issues
GNI Gross National Income
GST Goods and Services Tax
Quarterly BulletinFirst Quarter 2015
42

HoA Heads of Agreement
HQLA high-quality liquid asset
HSDPA High-Speed Downlink Packet Access
ICR interest coverage ratio
IDB Islamic Development Bank
IILM International Islamic Liquidity Management
IMF International Monetary Fund
IT information technology
JCC Japanese Crude Cocktail
KLCI Kuala Lumpur Composite Index
KLIBOR Kuala Lumpur Interbank Offered Rate
LCR Liquidity Coverage Ratio
LNG liquefi ed natural gas
MGS Malaysian Government Securities
MHPI Malaysia House Price Index
MIDA Malaysian Investment Development Authority
MIER Malaysian Institute of Economic Research
MoU Memorandum of Understanding
MPC Monetary Policy Committee
MSIC Malaysia Standard Industrial Classifi cations
NBFI non-bank fi nancial institutions
OPEC Organisation of the Petroleum Exporting Countries
OPR Overnight Policy Rate
PBOC People’s Bank of China
PDS private debt securities
PMI Purchasing Managers’ Index
PPI Producer Price Index
PTP Port of Tanjung Pelepas
QAB Qualifi ed ASEAN Banks
QE quantitative easing
RBI Reserve Bank of India
RM Ringgit Malaysia
SDA Special Deposit Account
SME small and medium enterprise
SNA System of National Accounts
SNB Swiss National Bank
SRR Statutory Reserve Requirement
43
Quarterly BulletinFirst Quarter 2015

![Ground Improvement - A Green Technology for Housing Infrastructure and Utilities Developments in Malaysia[1]-1](https://img.dokumen.tips/doc/110x75/55720ee2497959fc0b8c8549/ground-improvement-a-green-technology-for-housing-infrastructure-and-utilities-developments-in-malaysia1-1.jpg)