Embed Size (px)
Citation preview

Economic Analysisof Mangrove Forests:
A case study in Gazi Bay, Kenya
Job Number: DEW/1230/NAISBN: 978-92-807-3187-3
United Nations Environment ProgrammeP.O. Box 30552 - 00100 Nairobi, Kenya
Tel.: +254 20 762 1234Fax: +254 20 762 3927
e-mail: [email protected]
www.unep.org
. . . . . . . . . . . . . . . . . . . . . . . . . . . . . . . . . . . . . . . . . . . . . . . . . . . . . . . . . The report features a detailed economic analysis of the mangrove forest in Gazi Bay, Kenya. It promotes the ecosystem as a valuable source of income for the local community. The results and methods can be applied to other sites in Africa in order to determine the importance of including the coastal forest into national accounts. Local policymakers are encouraged to consider the non-marketable services of mangroves when making decisions on coastal land use, especially at this time when we are experiencing increasing pressure on marine ecosystems due to population growth, land conversion and climate change.

UNEP promotesenvironmentally sound practices
globally and in its own activities. Thispublication is printed on 100% recycled paper
using vegetable based inks and other eco-friendly practices. Our distribution policy aims to
reduce UNEP’s carbon footprint.
This publication, Economic Analysis of Mangrove Forests: A case study in Gazi Bay, Kenya is prepared as part of the efforts of the United Nations Environment Programme of promoting coastal intertidal forests as a significant green economy asset for Kenya which require consideration when calculating national accounts.
Published by the United Nations Environment Programme in September 2011
Copyright © 2011, United Nations Environment Programme
ISBN: 978-92-807-3187-3 Job Number: DEW/1230/NA
This publication may be reproduced in whole or in part and in any form for educational or non-profit purposes without special permission from the copyright holder, provided acknowledgement of the source is made. United Nations Environment Programme (UNEP) would appreciate receiving a copy of any publication that uses this report as a source.
No use of this publication may be made for resale or for any other commercial purpose whatsoever without prior permission in writing of the United Nations Environment Programme.
Disclaimers
The views expressed in this publication are not necessarily those of the agencies cooperating in this project. The designations employed and the presentations do not imply the expression of any opinion whatsoever on the part of UNEP or cooperating agencies concerning the legal status of any country, territory, city, or area of its authorities, or of the delineation of its frontiers or boundaries.
Mention of a commercial company or product in this report does not imply endorsement by the United Nations Environment Programme. The use of information from this publication for publicity or dvertising is not permitted. Trademark names and symbols are used in an editorial fashion with no intention of infringement on trademark or copyright laws.
We regret any errors or omissions that may have been unwittingly made.
© Maps, photos and illustrations as specified.
Contributors and Reviewers
Author: Janis Hoberg, Department of Business and Economics, Free University of Berlin, Germany
UNEP Production Team: Mwangi Theuri, Jane Muriithi, Eugene Ochieng
UNEP Reviewers: Pushpam Kumar, Christian Lambrechts, Alberto Pacheco; Nick Bertrand, Derek Eaton, Ashbindu Singh, Johannes Akiwumi, Neeyati Patel
Field data support: Dr. J. G. Kairo (Kenya Marine and Fisheries Research Institute, Mombasa), Caroline Wanjiru (University of Nairobi), A. Hamsa (Gazi Women Boardwalk, Gazi Village)
Citation
For bibliographic purposes, this document may be cited as: UNEP, 2011. Economic Analysis of Mangrove Forests: A case study in Gazi Bay, Kenya, UNEP, iii+42 pp.
Cover photos: © Janis Hoberg
Design and layout (UNEP): Audrey Ringler
Page
i
Economic analysis of mangrove forests: A case study in Gazi Bay, Kenya
Economic Analysisof Mangrove Forests:
A case study in Gazi Bay, Kenya
. . . . . . . . . . . . . . . . . . . . . . . . . . . . .
Source: © Janis Hoberg*
____________________* Free University of Berlin, Department of Business and Economics

Page
ii
Economic analysis of mangrove forests: A case study in Gazi Bay, Kenya
Source: © Janis Hoberg / UNEP
Page
iii
Economic analysis of mangrove forests: A case study in Gazi Bay, Kenya
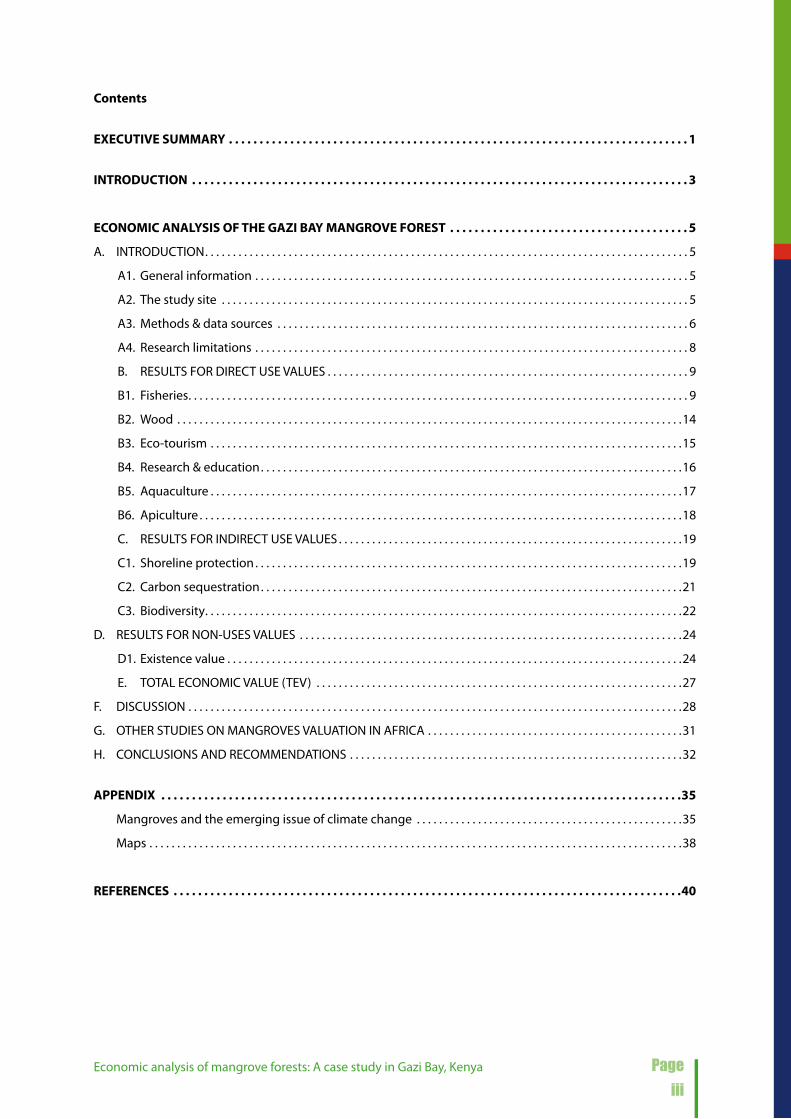
Contents
EXECUTIVE SUMMARY . . . . . . . . . . . . . . . . . . . . . . . . . . . . . . . . . . . . . . . . . . . . . . . . . . . . . . . . . . . . . . . . . . . . . . . . . . . 1
INTRODUCTION . . . . . . . . . . . . . . . . . . . . . . . . . . . . . . . . . . . . . . . . . . . . . . . . . . . . . . . . . . . . . . . . . . . . . . . . . . . . . . . . . 3
ECONOMIC ANALYSIS OF THE GAZI BAY MANGROVE FOREST . . . . . . . . . . . . . . . . . . . . . . . . . . . . . . . . . . . . . . . 5
A. INTRODUCTION . . . . . . . . . . . . . . . . . . . . . . . . . . . . . . . . . . . . . . . . . . . . . . . . . . . . . . . . . . . . . . . . . . . . . . . . . . . . . . . . . . . . . . . 5
A1. General information . . . . . . . . . . . . . . . . . . . . . . . . . . . . . . . . . . . . . . . . . . . . . . . . . . . . . . . . . . . . . . . . . . . . . . . . . . . . . . 5
A2. The study site . . . . . . . . . . . . . . . . . . . . . . . . . . . . . . . . . . . . . . . . . . . . . . . . . . . . . . . . . . . . . . . . . . . . . . . . . . . . . . . . . . . . 5
A3. Methods & data sources . . . . . . . . . . . . . . . . . . . . . . . . . . . . . . . . . . . . . . . . . . . . . . . . . . . . . . . . . . . . . . . . . . . . . . . . . . 6
A4. Research limitations . . . . . . . . . . . . . . . . . . . . . . . . . . . . . . . . . . . . . . . . . . . . . . . . . . . . . . . . . . . . . . . . . . . . . . . . . . . . . . 8
B. RESULTS FOR DIRECT USE VALUES . . . . . . . . . . . . . . . . . . . . . . . . . . . . . . . . . . . . . . . . . . . . . . . . . . . . . . . . . . . . . . . . . 9
B1. Fisheries . . . . . . . . . . . . . . . . . . . . . . . . . . . . . . . . . . . . . . . . . . . . . . . . . . . . . . . . . . . . . . . . . . . . . . . . . . . . . . . . . . . . . . . . . . 9
B2. Wood . . . . . . . . . . . . . . . . . . . . . . . . . . . . . . . . . . . . . . . . . . . . . . . . . . . . . . . . . . . . . . . . . . . . . . . . . . . . . . . . . . . . . . . . . . .14
B3. Eco-tourism . . . . . . . . . . . . . . . . . . . . . . . . . . . . . . . . . . . . . . . . . . . . . . . . . . . . . . . . . . . . . . . . . . . . . . . . . . . . . . . . . . . . .15
B4. Research & education . . . . . . . . . . . . . . . . . . . . . . . . . . . . . . . . . . . . . . . . . . . . . . . . . . . . . . . . . . . . . . . . . . . . . . . . . . . .16
B5. Aquaculture . . . . . . . . . . . . . . . . . . . . . . . . . . . . . . . . . . . . . . . . . . . . . . . . . . . . . . . . . . . . . . . . . . . . . . . . . . . . . . . . . . . . .17
B6. Apiculture . . . . . . . . . . . . . . . . . . . . . . . . . . . . . . . . . . . . . . . . . . . . . . . . . . . . . . . . . . . . . . . . . . . . . . . . . . . . . . . . . . . . . . .18
C. RESULTS FOR INDIRECT USE VALUES . . . . . . . . . . . . . . . . . . . . . . . . . . . . . . . . . . . . . . . . . . . . . . . . . . . . . . . . . . . . . .19
C1. Shoreline protection . . . . . . . . . . . . . . . . . . . . . . . . . . . . . . . . . . . . . . . . . . . . . . . . . . . . . . . . . . . . . . . . . . . . . . . . . . . . .19
C2. Carbon sequestration . . . . . . . . . . . . . . . . . . . . . . . . . . . . . . . . . . . . . . . . . . . . . . . . . . . . . . . . . . . . . . . . . . . . . . . . . . . .21
C3. Biodiversity . . . . . . . . . . . . . . . . . . . . . . . . . . . . . . . . . . . . . . . . . . . . . . . . . . . . . . . . . . . . . . . . . . . . . . . . . . . . . . . . . . . . . .22
D. RESULTS FOR NON-USES VALUES . . . . . . . . . . . . . . . . . . . . . . . . . . . . . . . . . . . . . . . . . . . . . . . . . . . . . . . . . . . . . . . . . . . . .24
D1. Existence value . . . . . . . . . . . . . . . . . . . . . . . . . . . . . . . . . . . . . . . . . . . . . . . . . . . . . . . . . . . . . . . . . . . . . . . . . . . . . . . . . .24
E. TOTAL ECONOMIC VALUE (TEV) . . . . . . . . . . . . . . . . . . . . . . . . . . . . . . . . . . . . . . . . . . . . . . . . . . . . . . . . . . . . . . . . . .27
F. DISCUSSION . . . . . . . . . . . . . . . . . . . . . . . . . . . . . . . . . . . . . . . . . . . . . . . . . . . . . . . . . . . . . . . . . . . . . . . . . . . . . . . . . . . . . . . . .28
G. OTHER STUDIES ON MANGROVES VALUATION IN AFRICA . . . . . . . . . . . . . . . . . . . . . . . . . . . . . . . . . . . . . . . . . . . . . .31
H. CONCLUSIONS AND RECOMMENDATIONS . . . . . . . . . . . . . . . . . . . . . . . . . . . . . . . . . . . . . . . . . . . . . . . . . . . . . . . . . . . .32
APPENDIX . . . . . . . . . . . . . . . . . . . . . . . . . . . . . . . . . . . . . . . . . . . . . . . . . . . . . . . . . . . . . . . . . . . . . . . . . . . . . . . . . . . . .35
Mangroves and the emerging issue of climate change . . . . . . . . . . . . . . . . . . . . . . . . . . . . . . . . . . . . . . . . . . . . . . . .35
Maps . . . . . . . . . . . . . . . . . . . . . . . . . . . . . . . . . . . . . . . . . . . . . . . . . . . . . . . . . . . . . . . . . . . . . . . . . . . . . . . . . . . . . . . . . . . . . . . .38
REFERENCES . . . . . . . . . . . . . . . . . . . . . . . . . . . . . . . . . . . . . . . . . . . . . . . . . . . . . . . . . . . . . . . . . . . . . . . . . . . . . . . . . . .40

Page
iv
Economic analysis of mangrove forests: A case study in Gazi Bay, Kenya
LIST OF TABLES
Table 1: Summary of the drivers of change in the Western Indian Ocean (WIO) regionTable A1: Overview of methods for ecosystem valuationTable B1: Projected fish capture development Gazi BayTable B2: Mangrove’s contribution to on- and offshore fishery at different sitesTable B3: Projected fish price Kenya 2010 (Theoretical approach)Table B4: Catch composition & fish prices in Gazi (Empirical approach)Table B5: Costs of a fishing vesselTable B6: Value of fishery in Gazi Bay (related to the mangroves)Table B7: Revenues and costs of sustainable mangrove harvesting in Gazi (2010)Table B8: Income from fuel wood collection in GaziTable B9: Tourists visiting the “Gazi Women Mangroves Boardwalk“(2008-2010)Table B10: Revenues from aquaculture ponds in GaziTable B11: Income from aquaculture production in GaziTable C1: Calculation of the average house priceTable C2: Valuation shoreline protection Table D1: Potential national non-use value for Egypt’s mangrovesTable D2: Potential visitors non-use value for Egypt’s mangrovesTable D3: Potential Kwale population non-use value for Gazi Bay’s mangroves Table D4: Potential national non-use value for Gazi Bay’s mangroves (Empirical approach)Table D5: Potential visitors’ non-use value for Gazi Bay’s mangroves (Theoretical approach) Table D6: Potential visitors’ non-use value for Gazi Bay’s mangroves (Empirical approach)Table D7: Existence value of the mangroves in Gazi Bay (Theoretical approach)Table G1: Economic valuations of mangroves in AfricaTable H1: Results assessment, recommendations and advices
LIST OF FIGURES
Figure 1: Kenya fish catch development 1975-2008Figure 2: Process of carbon sequestration in mangrovesFigure 3: Total Economic Value of the mangrove forest in Gazi Bay (TEV)Figure 4: Sea-level changes 1800-2100Figure 5: Projected global warming by 2100
LIST OF MAPS
Map 1: Gazi Bay Map 2: Potential spread of a tsunami wave from Karthala volcano lava flowMap 3: Mangroves distribution in Eastern AfricaMap 4: Mangroves distribution in Kenya

Page
1
Economic analysis of mangrove forests: A case study in Gazi Bay, Kenya
EXECUTIVE SUMMARY
This study was undertaken as part of UNEP efforts of promoting forests as a significant green economy asset for Kenya. Forests should be taken into account when calculating the national accounts because the global rush for land and the increasing demand for agricultural products and urban infrastructure continue to intensify the pressure on tropical and coastal forests. The fact that forests provide goods and services which currently have no valued assigned to in economic markets exacerbates the deforestation and land conversion.
Mangrove forests are among the most productive and valuable ecosystems on earth. However, the economic value of the diverse functions they provide such as shoreline protection, nursery habitats and carbon storage are not accounted for by decision-makers. This study aims to demonstrate the economic value of mangrove forest services in Kenya, using the Gazi Bay mangrove forest ecosystem as an illustration.
The study quantifies the Total Economic Value (TEV) of the Gazi Bay mangrove forest. The variables are divided into direct use, indirect use and non-use value. Direct use values include fishery, timber, eco-tourism, research and education, aquaculture and apiculture. They account for 20 per cent of the TEV. Indirect use values of the mangroves are shoreline protection, carbon sequestration and biodiversity. They represent 25 per cent of the TEV. The existence value, which represents the value of mangroves in an unharmed state, accounts for 55 per cent of the TEV. The analysis results in a TEV of US$ 1,092 per hectare per year.
To quantify the value of the goods and services, different methods were applied. Most of the direct uses were calculated using the market value of the products. The Damage Costs Avoided Method was used to value the shoreline protection function of the mangroves. Biodiversity and existence value were derived using the Benefit Transfer Method (BT).
It is acknowledged and stressed that this study suffers from research limitations. One reason is the lack of primary data and appropriate peer reviewed studies. Application of the BT should also be considered with caution. It is, however, recognized as one of the most widely used methodologies in the field of environmental valuation and serves as a first approach in determining non-marketable mangrove services. Therefore the results of this analysis should be considered as a first step towards quantifying the value of Kenyan mangrove goods and services.
The results of the analysis are also compared with other economic analyses of mangroves in Africa, although only a few mangrove valuations have been conducted. Recommendations for future research on mangrove valuation are made.

Page
2
Economic analysis of mangrove forests: A case study in Gazi Bay, Kenya
Page
3
Economic analysis of mangrove forests: A case study in Gazi Bay, Kenya
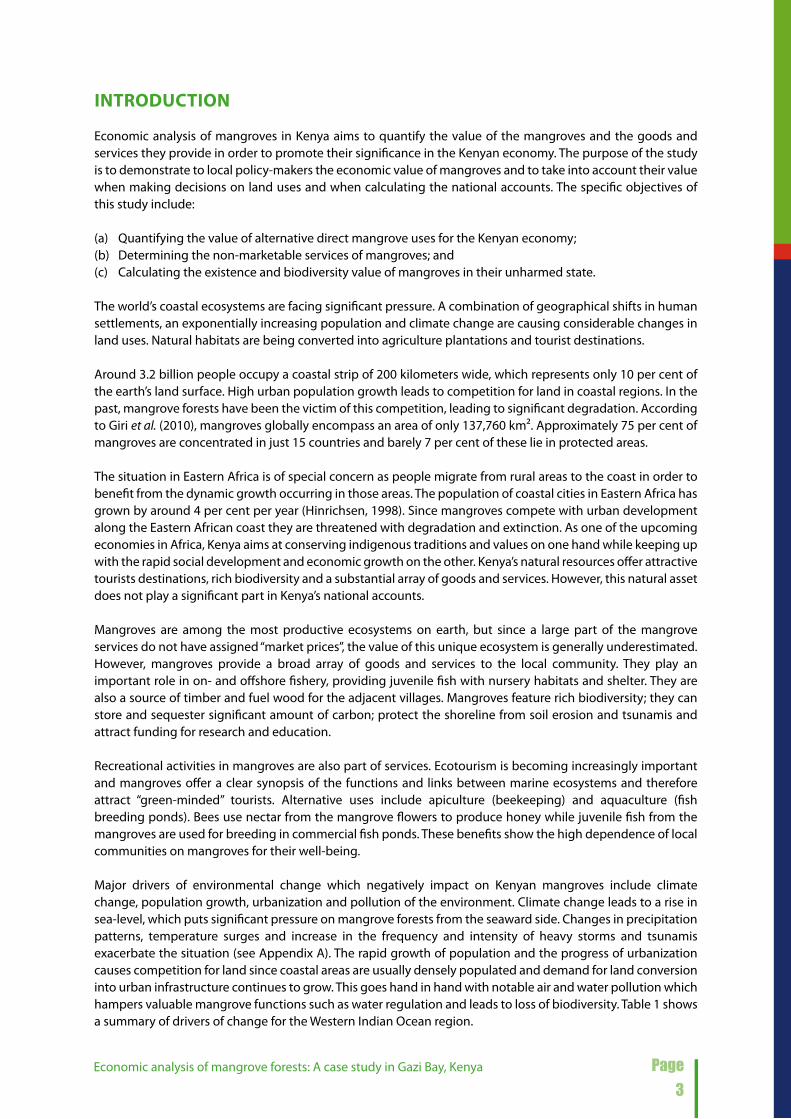
INTRODUCTION
Economic analysis of mangroves in Kenya aims to quantify the value of the mangroves and the goods and services they provide in order to promote their significance in the Kenyan economy. The purpose of the study is to demonstrate to local policy-makers the economic value of mangroves and to take into account their value when making decisions on land uses and when calculating the national accounts. The specific objectives of this study include:
(a) Quantifying the value of alternative direct mangrove uses for the Kenyan economy;(b) Determining the non-marketable services of mangroves; and(c) Calculating the existence and biodiversity value of mangroves in their unharmed state.
The world’s coastal ecosystems are facing significant pressure. A combination of geographical shifts in human settlements, an exponentially increasing population and climate change are causing considerable changes in land uses. Natural habitats are being converted into agriculture plantations and tourist destinations.
Around 3.2 billion people occupy a coastal strip of 200 kilometers wide, which represents only 10 per cent of the earth’s land surface. High urban population growth leads to competition for land in coastal regions. In the past, mangrove forests have been the victim of this competition, leading to significant degradation. According to Giri et al. (2010), mangroves globally encompass an area of only 137,760 km². Approximately 75 per cent of mangroves are concentrated in just 15 countries and barely 7 per cent of these lie in protected areas.
The situation in Eastern Africa is of special concern as people migrate from rural areas to the coast in order to benefit from the dynamic growth occurring in those areas. The population of coastal cities in Eastern Africa has grown by around 4 per cent per year (Hinrichsen, 1998). Since mangroves compete with urban development along the Eastern African coast they are threatened with degradation and extinction. As one of the upcoming economies in Africa, Kenya aims at conserving indigenous traditions and values on one hand while keeping up with the rapid social development and economic growth on the other. Kenya’s natural resources offer attractive tourists destinations, rich biodiversity and a substantial array of goods and services. However, this natural asset does not play a significant part in Kenya’s national accounts.
Mangroves are among the most productive ecosystems on earth, but since a large part of the mangrove services do not have assigned “market prices”, the value of this unique ecosystem is generally underestimated. However, mangroves provide a broad array of goods and services to the local community. They play an important role in on- and offshore fishery, providing juvenile fish with nursery habitats and shelter. They are also a source of timber and fuel wood for the adjacent villages. Mangroves feature rich biodiversity; they can store and sequester significant amount of carbon; protect the shoreline from soil erosion and tsunamis and attract funding for research and education.
Recreational activities in mangroves are also part of services. Ecotourism is becoming increasingly important and mangroves offer a clear synopsis of the functions and links between marine ecosystems and therefore attract “green-minded” tourists. Alternative uses include apiculture (beekeeping) and aquaculture (fish breeding ponds). Bees use nectar from the mangrove flowers to produce honey while juvenile fish from the mangroves are used for breeding in commercial fish ponds. These benefits show the high dependence of local communities on mangroves for their well-being.
Major drivers of environmental change which negatively impact on Kenyan mangroves include climate change, population growth, urbanization and pollution of the environment. Climate change leads to a rise in sea-level, which puts significant pressure on mangrove forests from the seaward side. Changes in precipitation patterns, temperature surges and increase in the frequency and intensity of heavy storms and tsunamis exacerbate the situation (see Appendix A). The rapid growth of population and the progress of urbanization causes competition for land since coastal areas are usually densely populated and demand for land conversion into urban infrastructure continues to grow. This goes hand in hand with notable air and water pollution which hampers valuable mangrove functions such as water regulation and leads to loss of biodiversity. Table 1 shows a summary of drivers of change for the Western Indian Ocean region.

Page
4
Economic analysis of mangrove forests: A case study in Gazi Bay, Kenya
Table 1: Summary of the drivers of change in the Western Indian Ocean (WIO)
Direct drivers Indirect drivers
LOCAL LOCAL
Changes in land uses & cover Poverty
Species introductions Community health
Habitat degradation
Overfishing
Pollution
Agricultural practices
Erosion
NATIONAL NATIONAL
Natural disasters National policies
Migration Legislation
Industrial development Tourism development
Water quality Education
Catchment management Migration
Industrial development
GLOBAL GLOBAL
Climate change Globalization
Economics
Source: UNEP (2009)
Source: © Janis Hoberg / UNEP

Page
5
Economic analysis of mangrove forests: A case study in Gazi Bay, Kenya
ECONOMIC ANALYSIS OF THE GAZI BAY MANGROVE FOREST
A . INTRODUCTION
A1 . GENERAL INFORMATION
The valuation of an ecosystem is a complex process that is reliant on the availability of relevant and accurate biophysical data on ecosystem processes and functions and the appropriate applications of economic valuation (Morse-Jones et al., 2011). Resource economists approach the topic using different methods and methodologies. In this study, the Utilitarian approach is applied. The Utilitarian approach searches for the option that is the most valuable for the whole society in monetary terms. This study values the option of the wise use and conservation of mangroves. For example, it assumes that only a specific amount of timber and fuel wood is extracted from the mangroves so that they are able to recover from the harvest and remain mostly unharmed. This is a requirement for the provision of other ecosystem services.
The range of Total Economic Values (TEV) of mangroves determined in different studies show marked variances (Spalding et al., 2010). Causes of these inconsistencies result from the use of different approaches and methodologies as well as insufficient data collection. In addition emerging issues like climate change affect the valuation (see Appendix A) in which some variables might increase in importance while others will eventually depreciate. For instance, the rise in sea-level could increase the value of shoreline protection in the long run (Crabbe, 2009; IPCC, 2007).
Resource valuation can also be restricted when it comes to choosing the appropriate variables mainly due to lack of funding. Some variables require highly sophisticated research approaches and methods, which are not always affordable or have not even been invented. Regional or local specifications may also influence the valuation. While Spurgeon (2002) derived the value of eco-tourism in Egyptian mangroves to be as high as US$ 130,000 per hectare per year (ha-1 y-1), Kairo et al. (2009) valued the same factor at US$ 9.3 ha-1 y-1 in Gazi, Kenya. The significant difference in value is simply based on the fact that tourism is much more developed around the mangroves of Egypt than in Gazi Bay. In addition, the mangroves in Spurgeon’s analysis are part of a greater national park and therefore more attractive to tourists. This example shows how local differences can influence valuation.
Since little research has been done in Africa, “Benefit Transfer Method” (BT, see section A3 for explanation) has to be applied to calculate some of the values. Abundant economic data exist only for mangroves in Southeast Asia (e.g. Ruitenbeek (1992); Sathirathai (1995); Leong (1999)). However, these studies are geographically too far away from Kenya to work as appropriate peer reviewed studies.
A2 . THE STUDY SITE
In Kenya, several studies on mangroves have been conducted mainly focusing on the region around Gazi Bay, although it belongs to the smaller mangrove sites in Kenya (see Appendix A for geographical distribution). Lamu district offers a much larger mangrove site and features about 67 per cent of the Kenyan mangroves. However, researchers choose the Gazi Bay area which is easily accessible than Lamu. Gazi Bay is located at the far Southern edge of the Kenyan coastline some 55km South of Mombasa (4025’S and 39050’E). According to Maina et al. (2008) Gazi Bay occupies an area of 18km2 and is sheltered from storms by Chale Peninsula to the East and a coral reef to the South. These two natural barriers support mangrove growth in the protected bay (Map 1). The area is surrounded by 6.2km2 of mangroves and the bay hosts approximately 180 different species of fishes and abundant bird life (Kairo et al., 2010). Atmospheric conditions are typical for a tropical shoreline with annual precipitation of 1000-1600mm and air temperature of 24-39oC (Kirui, 2007). Humidity ranges from 60 per cent to 100 per cent (Kairo et al., 2010).

Page
6
Economic analysis of mangrove forests: A case study in Gazi Bay, Kenya
Map 1: Gazi Bay
Source: Survey of Kenya Map sheet 201/3, scale 1:50,000 (2000)
A3 . METHODS & DATA SOURCES
A3 .1 . Methods for ecosystem valuation
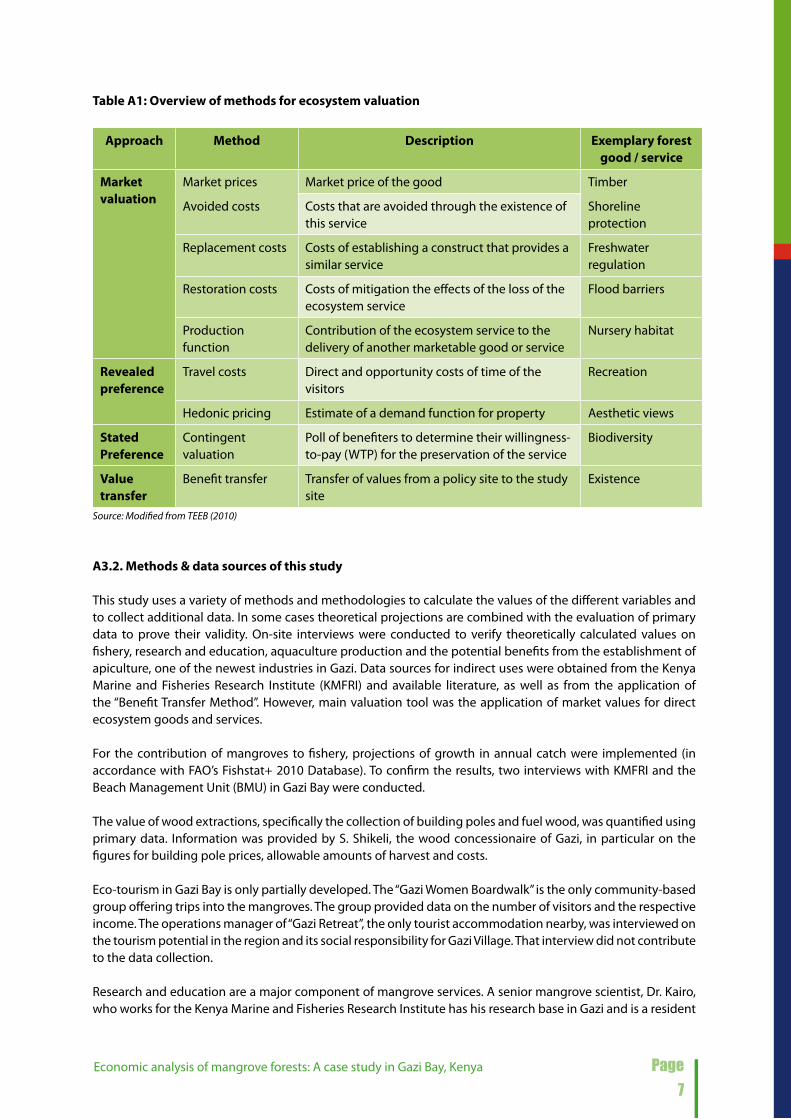
Research in the field of environmental economics has brought together an extensive array of methods for ecosystem valuation. TEEB (2010) differentiates between approaches based on market valuation, revealed preference and stated preference. The methods differ significantly from each other in terms of their reliability, validity and applicability. In addition, some methods are much more costly and time-consuming than others. However, all methods have their merits and flaws and it is left to the researcher to decide which method is best to apply to the respective study site considering the limitations, local circumstances and environmental settings. Table A1 provides an overview of the methods commonly used for ecosystem valuation.
Page
7
Economic analysis of mangrove forests: A case study in Gazi Bay, Kenya
Table A1: Overview of methods for ecosystem valuation
Approach Method Description Exemplary forest good / service
Market valuation
Market prices Market price of the good Timber
Avoided costs Costs that are avoided through the existence of this service
Shoreline protection
Replacement costs Costs of establishing a construct that provides a similar service
Freshwater regulation
Restoration costs Costs of mitigation the effects of the loss of the ecosystem service
Flood barriers
Production function
Contribution of the ecosystem service to the delivery of another marketable good or service
Nursery habitat
Revealed preference
Travel costs Direct and opportunity costs of time of the visitors
Recreation
Hedonic pricing Estimate of a demand function for property Aesthetic views
Stated Preference
Contingent valuation
Poll of benefiters to determine their willingness-to-pay (WTP) for the preservation of the service
Biodiversity
Value transfer
Benefit transfer Transfer of values from a policy site to the study site
Existence
Source: Modified from TEEB (2010)
A3 .2 . Methods & data sources of this study
This study uses a variety of methods and methodologies to calculate the values of the different variables and to collect additional data. In some cases theoretical projections are combined with the evaluation of primary data to prove their validity. On-site interviews were conducted to verify theoretically calculated values on fishery, research and education, aquaculture production and the potential benefits from the establishment of apiculture, one of the newest industries in Gazi. Data sources for indirect uses were obtained from the Kenya Marine and Fisheries Research Institute (KMFRI) and available literature, as well as from the application of the “Benefit Transfer Method”. However, main valuation tool was the application of market values for direct ecosystem goods and services.
For the contribution of mangroves to fishery, projections of growth in annual catch were implemented (in accordance with FAO’s Fishstat+ 2010 Database). To confirm the results, two interviews with KMFRI and the Beach Management Unit (BMU) in Gazi Bay were conducted.
The value of wood extractions, specifically the collection of building poles and fuel wood, was quantified using primary data. Information was provided by S. Shikeli, the wood concessionaire of Gazi, in particular on the figures for building pole prices, allowable amounts of harvest and costs.
Eco-tourism in Gazi Bay is only partially developed. The “Gazi Women Boardwalk” is the only community-based group offering trips into the mangroves. The group provided data on the number of visitors and the respective income. The operations manager of “Gazi Retreat”, the only tourist accommodation nearby, was interviewed on the tourism potential in the region and its social responsibility for Gazi Village. That interview did not contribute to the data collection.
Research and education are a major component of mangrove services. A senior mangrove scientist, Dr. Kairo, who works for the Kenya Marine and Fisheries Research Institute has his research base in Gazi and is a resident

Page
8
Economic analysis of mangrove forests: A case study in Gazi Bay, Kenya
of Gazi Village. He offers accommodation to foreign researchers and keeps record of the number of visiting researchers and the amount of funding. Those data were used to quantify the mangroves value for research and education.
Aquaculture production is one of the newest, mangroves-related projects in Gazi. The ponds are mainly managed by C. Wanjiru, a researcher from the University of Nairobi. She was able to provide data on potential earnings and costs of the breeding ponds. Additional data came from A. Hamsa, the director and manager of the “Gazi Women” initiative.
An apiculture (beekeeping) project was established by the “Gazi Women” initiative. Since the project was established only recently, data provided by the manager, A. Hamsa, were used to predict potential income from the bee hives. Market values were used to calculate the value of income from the honey production.
Indirect uses include shoreline protection, carbon sequestration and biodiversity values. For shoreline protection the “Damage Costs Avoided Method” was applied. Data on the number of houses and house prices were provided by Dr. Kairo. The rest of the required data was obtained from former studies or simply projected.Due to the changing prices for carbon credits, the value of carbon sequestration is fluctuating. This study uses figures from the “Mikoko Pamoja” project, a reforestation initiative, initiated by KMFRI, Earthwatch, Edinburgh University and Bangor University in 2010 (Kairo et al., 2010).
For the valuation of biodiversity in the Gazi mangroves the Benefit Transfer method (BT) was applied. BT included the comparison of the purchasing power parity GDP per capita for Kenya and Sri Lanka. UNEP/GPA (2003) used this approach to calculate the biodiversity value of mangroves in Sri Lanka. Non-use value in this study only consists of the existence value. This study uses BT to value the existence of the mangroves in Gazi Bay. The peer study is the analysis of the mangroves in Egypt (Spurgeon, 2002) which is one of the very few studies conducted in Africa. It is so far the only appropriate peer study that values biodiversity of mangroves in Africa.
A4 . RESEARCH LIMITATIONS
The variables of indirect use values and non-use values of this study lack primary data and appropriate peer studies. This is due to the fact that valuations of mangroves in Africa practically do not exist. Other reasons include a limited time frame for the analysis and the lack of data records of important variables, limited infrastructure to host and accommodate tourism as well as low publicity of the subject matter.
While the values of direct uses of the mangrove such as, fishery, wood collection and apiculture are considered to be accurate, the indirect and non-use values need to be confirmed by applying different methodologies. However, the results fall into the global range of valuations. In addition, the study site has minimal development, which results in a comparably low Total Economic Value (TEV). TEV represents the sum of all mangroves goods and services. Further development of the tourism and research sector may increase awareness and in effect the value of mangroves in Kenya.
Some of the assumptions made are based on studies from Southeast Asia. The environmental settings in Southeast Asia differ from the settings in Eastern Africa and this has to be considered when examining the results. Therefore, this study is seen as preliminary work and it is proposes that that the results, especially those of the indirect usage variables, are confirmed by applying a contingent valuation and conducting a survey in Gazi Bay.
An economic analysis of mangroves encompasses an array of goods and services, which have to be valuated individually. Relevant variables for Gazi Bay can be divided into direct, indirect use and non-use values.

Page
9
Economic analysis of mangrove forests: A case study in Gazi Bay, Kenya
B . RESULTS FOR DIRECT USE VALUES
B1 . FISHERIES
New fishermen site in Gazi VillageSource: © Janis Hoberg / UNEP
One of the major economic goods extracted from mangroves and surrounding habitats is fish. Direct fishing in the mangroves is relatively rare since mostly only juvenile fish are found there hidden between the roots of mangrove plants. Fishermen usually go offshore to the sea grasses or to the coral reefs to fish. Onshore fishery is only done by locals who cannot afford the more expensive offshore fishing gear (Kairo et al., 2009).
The most valuable direct use of mangroves is as a breeding and nursery habitat for juvenile fish. However, Kairo et al. (2009) assumed that fishing in Gazi Bay is done in the estuary and mangrove area because offshore fishing equipment is too expensive for the fishermen of Gazi Village. Therefore it was valuated as a direct use component with 100 per cent contribution, although sea grasses and coral reefs play an important part in coastal fishery. A 100 per cent contribution assumed that the whole value of fishery can be related directly to the mangroves and can be added to their value. This study ranks fisheries as a direct use of mangroves.
The contribution of mangroves to offshore and coral reef fishery consists in protection and the provision of nutrients from fallen leaves and nursery habitat. Since most fishes grow up in the mangroves and then leave to offshore areas it is important to examine how much of the catch can be related to the mangroves. Studies offer different solutions regarding this issue.

Page
10
Economic analysis of mangrove forests: A case study in Gazi Bay, Kenya
B1 .1 . Economic valuation: Amount of fish caught in Gazi in 2010
This study assumes a moderate contribution of mangroves to fishery. Furthermore, the considered fishing area benefiting from the mangroves is limited to the fishing grounds of the fishermen from Gazi Village.
The Indian Ocean along the Kenyan coastline is widely used for fishing by local communities. Figure 1 shows fish catch along the Kenyan coastline from 1975-2008. The amount of fish caught has increased significantly in the last 33 years (Fishstat+, 2010). A total of 4531 tons was caught in 1975 and this increased to 7228 tons in 2008. This corresponds roughly to an increase of 60 per cent in the last 33 years.
Figure 1: Kenya marine fish catch development 1975-2008
Source: Fishstat + 2010
To calculate the compounded annual growth rate (CAGR) for the Kenyan marine fisheries industry the following formula is applied:
Equation 1: Compounded annual growth rate
Where:CAGR = Compounded annual growth ratet
0= time 0
tn= time n
V (t0) = Fish catch in time 0
V (tn) = Fish catch in time n
Using data from Fishstat+ 2010 for Kenya, the CAGR (t1975
, t2008
) becomes:
The result shows that the fish capture in Kenya has increased on average by 1.425 per cent annually. This is mainly the result of a growing population, globalization and the increasing wealth of the population. Furthermore, fishing gear has improved, which makes capture of fish on- and offshore easier. Since mangroves are the nursery habitat of most of the fish caught, their importance for the Kenyan food supply and export economy is crucial.
12,000
10,000
8.000
6,000
4,000
2,000
01970
Mar
ine
�sh
catc
h (t
ons)
1975 1980 1975 1990Year
1975 2000 2005 2010
CAGR (t0,tn) = –1 V(tn)V(t0)
1tn - t0
CAGR (t1975,t2008) =
= 0.01425 = 1.425%
–1 72284531
12008 - 1975

Page
11
Economic analysis of mangrove forests: A case study in Gazi Bay, Kenya
Kairo et al. (2009) found using data from CORDIO EA that in 2006 the amount of fish caught in Gazi Bay was as much as 66.235 tons. Assuming that the catch composition and an annual growth rate of 1.425 per cent is applicable to and representative of Gazi Bay, one can calculate the projected amount of fish caught in Gazi (Table B1).
Table B1: Projected fish capture development Gazi Bay
2006* 2007 2008 2009 2010
66 .235 67.179 68.136 69.107 70 .092*Source: Kairo et al. (2009)
Following this projection the annual amount of fish caught in Gazi Bay is estimated at 70.092 tons. In order to confirm the fisheries data in Gazi Bay, in particular the amount of fish caught, current fish prices and fishing costs, two interviews were conducted with the Beach Management Unit (BMU) and with E. Myanchoka, a researcher and Laboratory Technician (KMFRI) respectively, on 02 and 04 March 2011. The BMU is responsible for the management of fisheries in Gazi village and keeps records of fishing data. According to E. Myanchoka the total amount of fish caught in 2009 was 72 tons and 69.8 tons in 2010 (Myanchoka (KMFRI), pers. comm). This corresponds roughly to the projected figure. For further calculations 69 .8 tons of total catch in 2010 is used.
B1 .2 . Contribution of mangroves to fisheries
Kairo et al. (2009) projected that the mangroves in Gazi Bay contribute 100 per cent to fishery income; however other studies show that fisheries in this coastal ecosystem are not entirely dependent on the mangroves. For example, Spurgeon (2002) suggests a 5-25 per cent contribution of mangroves to offshore fishery. Aburto-Oropreza (2008) calculated that 31.7 per cent of the capture production is related to the mangroves. Table B2 represents a global overview of estimates of mangrove’s contribution to on- and offshore fishery.
Table B2: Mangrove’s contribution to offshore fishery at different sites
Study year Mangrove’s contribution to fishery
Aburto-Oropreza 2008 31.7%
Spurgeon 2002 5-25%
Naylor and Drew 1999 90%
Singh 1994 30%
Bennett and Reynolds 1993 10-20%
Lal 1990 56%
Hamilton and Snedaker 1984 67%
Macintosh 1982 49%
Source: Modified from Roennbaeck (1999)
Since the result from the study of Aburto-Oropreya (2008) figure is based on accurate background research it is applied here to calculate a more valid figure for the value of mangrove contribution to offshore fishery in Gazi Bay.
Assuming a mangroves contribution to fishery of 31.7 per cent in Gazi Bay, the amount of fish caught attributable to the mangrove is as follows:
The total amount of fish caught in 2010, related to the mangroves in Gazi Bay, is: 22 .1538 tons
69.8 * .0317 = 22.1583

Page
12
Economic analysis of mangrove forests: A case study in Gazi Bay, Kenya
B1 .3 Fish prices
Kairo et al. (2009) set the fish price per kg at Kenya shillings 100.00 (Ksh 100). Table B3 shows the inflation rate for Kenya from 2006 to 2010 (IMF, 2010).
Table B3: Projected fish price Kenya 2010 (Theoretical)
Year Average annual inflation rate Projected Fish price (Ksh)
2006 6.0360% 100.00
2007 4.2560% 104.26
2008 16.1810% 121.13
2009 9.2510% 132.33
2010 4.1050% 137.76
In two interviews the prices for different fish species were determined. Table B4 shows the catch composition of Gazi Bay (Maina et al., 2008), the results from the two interviews, conducted in Gazi Village in March 2011 and the total average fish price. The numbers represent the prices quoted by the fishermen selling their fish to a dealer.
Table B4: Catch composition & fish prices in Gazi (Empirical)
Taxonomic group Species Price Ksh / kg1
Price Ksh / Kg2
Average price
Ksh/Kg
Catch composition
Gazi Bay3
Contribution to total
average fish price Ksh / Kg
Scombridae Mackerel, tuna 110-120 100 107 24.00% 25.68
Scaridae Monacanthidae Acanthuridae Labridae
Marine fishes ~110 ~110 110 22.50% 24.75
Siganidae Rabbitfishes 130-150 100-120 125 15.10% 18.875
Lethrinidae Emperors ~110 100-120 110 8.70% 9.57
Spyraendae Barracudas 100-110 100-120 107 7.40% 7.918
Octopodidae Octopuses 100 150 125 4.20% 5.25
Carangidae Amberjacks ~100 ~110 105 4.00% 4.2
Lutjanidae Snappers 150-180 120 140 3.40% 4.76
Haemulidae Grunts ? 100-120 110 2.80% 3.08
Mullidae Mullets 100 80-100 95 2.10% 1.995
Loligidae Various squids 100 120 110 0.50% 0.55
Others - ~110 ~110 110 5.30% 5.83
TOTAL / Average - ~115 112.5 113 100.00% 112 .458
Using these figures, the average price of fish in Gazi Bay is: Ksh 112 .458 / Kg
____________________1 Myanchoka (KMFRI), personal communication2 Beach Management Unit Gazi Village, personal communication3 Maina et al. (2008)
Page
13
Economic analysis of mangrove forests: A case study in Gazi Bay, Kenya
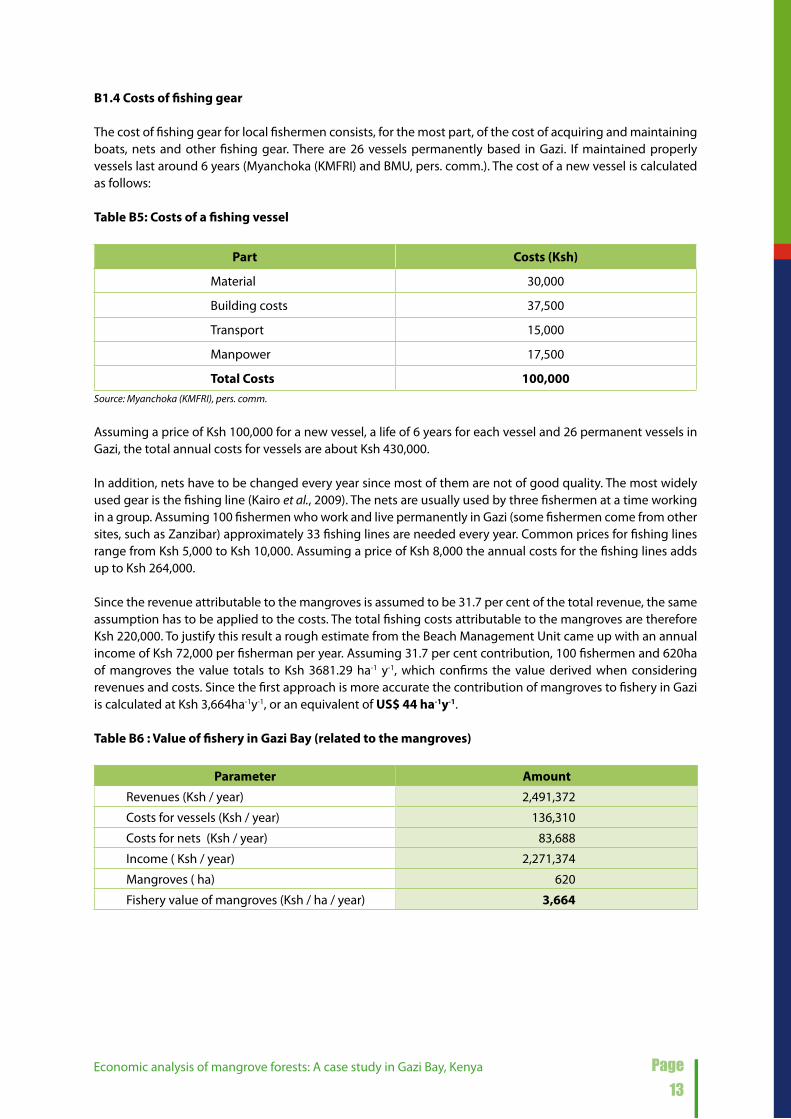
B1 .4 Costs of fishing gear
The cost of fishing gear for local fishermen consists, for the most part, of the cost of acquiring and maintaining boats, nets and other fishing gear. There are 26 vessels permanently based in Gazi. If maintained properly vessels last around 6 years (Myanchoka (KMFRI) and BMU, pers. comm.). The cost of a new vessel is calculated as follows:
Table B5: Costs of a fishing vessel
Part Costs (Ksh)
Material 30,000
Building costs 37,500
Transport 15,000
Manpower 17,500
Total Costs 100,000Source: Myanchoka (KMFRI), pers. comm.
Assuming a price of Ksh 100,000 for a new vessel, a life of 6 years for each vessel and 26 permanent vessels in Gazi, the total annual costs for vessels are about Ksh 430,000.
In addition, nets have to be changed every year since most of them are not of good quality. The most widely used gear is the fishing line (Kairo et al., 2009). The nets are usually used by three fishermen at a time working in a group. Assuming 100 fishermen who work and live permanently in Gazi (some fishermen come from other sites, such as Zanzibar) approximately 33 fishing lines are needed every year. Common prices for fishing lines range from Ksh 5,000 to Ksh 10,000. Assuming a price of Ksh 8,000 the annual costs for the fishing lines adds up to Ksh 264,000.
Since the revenue attributable to the mangroves is assumed to be 31.7 per cent of the total revenue, the same assumption has to be applied to the costs. The total fishing costs attributable to the mangroves are therefore Ksh 220,000. To justify this result a rough estimate from the Beach Management Unit came up with an annual income of Ksh 72,000 per fisherman per year. Assuming 31.7 per cent contribution, 100 fishermen and 620ha of mangroves the value totals to Ksh 3681.29 ha-1 y-1, which confirms the value derived when considering revenues and costs. Since the first approach is more accurate the contribution of mangroves to fishery in Gazi is calculated at Ksh 3,664ha-1y-1, or an equivalent of US$ 44 ha-1y-1.
Table B6 : Value of fishery in Gazi Bay (related to the mangroves)
Parameter Amount
Revenues (Ksh / year) 2,491,372
Costs for vessels (Ksh / year) 136,310
Costs for nets (Ksh / year) 83,688
Income ( Ksh / year) 2,271,374
Mangroves ( ha) 620
Fishery value of mangroves (Ksh / ha / year) 3,664

Page
14
Economic analysis of mangrove forests: A case study in Gazi Bay, Kenya
B2 . WOOD
This section includes the harvest of building poles and the collection of fuel wood in the mangroves. It is assumed that market prices are reasonable and that the harvest is sustainable. It is necessary to differentiate between clear-felling, which would destroy the whole ecosystem and all its depending goods and services, and sustainable harvesting. For sustainable subsistence forestry Bann (1997) suggests to introduce an imposition of a maximum allowable harvest rate that does not exceed the forest’s capacity to regenerate and develop naturally in order to ensure sustainability. In the past, especially between 1970 and 1980, the industrial sector and the local community clear-felled significant parts of the mangrove forest in Gazi Bay. However, the recent past has brought about some innovative projects where the local community is supported to replant an area and giving the people economic incentives especially through carbon credits trading (e.g. Kairo et al., 2010). This study assumes a sustainable harvesting of the mangroves which is secured by the strict harvesting and collecting rules for Gazi Bay established by the Kenyan government. No illegal cutting or collection of timber and fuel wood is taken into account in this study.
B2 .1 . Building poles
In Gazi Bay the only person allowed to cut mangrove trees for building poles is the concessionaire Mr. S. Shikeli. He is allowed to harvest 500 scores of building poles per year (1 score = 20 poles). This guarantees long-term conservation of the mangroves since only designated classes of poles are harvested. The concessionaire can decide for himself how to divide the 500 scores between the different tree classes. The prices for poles differ depending on their diameter. The industry differentiates between the Boriti, Mazio, Pau, Fito and Fingi classes. Harvesting of the Fito poles is no longer allowed. Depending on the class the concessionaire has to pay different tax rates. He also employs wood cutters who are paid per score and class. The annual charge for the license is Ksh 10,000 and an additional Ksh 1,000 charged as application fees. Table B7 shows revenue and costs for the concessionaire in 2010:
Table B7: Revenues and costs of sustainable mangrove harvesting in Gazi (2010)
Parameter Class
Fingi Boriti Mazio Pau
Price (Ksh / score) 2400 2000 1600 500
Salary costs (Ksh / score) 900 700 500 150
Taxes (Ksh / score) 600 500 400 110
Income (score / class) 900 800 700 240
Scores harvested per class (2010) 50 50 100 300
Income per class (Ksh) 45,000 40,000 70,000 72,000
Income (all classes) 227,000
license fees (Ksh) 10,000
Application fees (Ksh) 1,000
Total income 2010 (ksh) 216,000Source: Shikeli, pers. comm. March 2011
The annual income from sustainable harvesting was Ksh 216,000 in 2010. Assuming 620 hectares of mangroves, the harvesting income in Gazi is Ksh 348.4 ha-1y-1, which is equivalent to US$ 4 .2 ha-1y-1. This figure appears to be very low, but considering the tough restrictions for the concessionaire the low value is justifiable. 500 scores per year is equivalent to 10,000 stems. This results in a harvest limit of only 16 trees ha-1y-1. Acknowledging these limitations, which ensure conservation of the forest and taking into consideration the fact that all other variables depend on a sustainable mangroves forest the limited amount of income potential from mangroves cutting can be justified.

Page
15
Economic analysis of mangrove forests: A case study in Gazi Bay, Kenya
B2 .2 Fuel wood
Inhabitants from villages close to the mangroves are allowed to collect one bundle of fuel wood per day. 50 villagers, mostly women, take permanent advantage of this opportunity. Assuming those 50 people go to collect fuel wood 22 days per month (every day excluding weekends), the annual total amount of collected fuel wood is:
50 collectors * 22 days per month (1 bundle per day) * 12 months = 13,200 bundles / year
The collecting fees are Ksh 100 / month / person. The total fees are therefore Ksh 60,000 / year. Fuel wood can be sold at Ksh 70 per bundle (Shikeli, pers. comm.). Table B8 shows the villagers’ income from gathering of mangrove fuel wood.
Table B8: Income from fuel wood collection in Gazi
Parameter Amount
Collected fuel wood ( bundles / person / year) 264
Number of collectors 50
Total amount of collected bundles / year 13,200
Price per bundle ( Ksh) 70
Revenues (Ksh) 924,000
Fees (Ksh) 60,000
Income (Ksh) 864,000Source: Shikeli, pers. comm. March 2011
The total income from fuel wood collection is Ksh 864,000 or Ksh 1,394 per hectare (equivalent to US$ 16 .8 ha-1y-1). This figure is higher than the value of the building poles because collecting fuel wood is a day-to-day activity and many more people are involved. In addition, the limitations are not as strict as they are for the harvesting of building poles.
B3 . ECO-TOURISM
Tourism has always been a major source of income for any coastal population and since mangroves provide rich biodiversity and an impressive landscape, tourism could represent a reasonable part of the economic value of mangroves. Prerequisite for tourism is a well-established infrastructure to host and accommodate tourists. Tourism in Gazi Bay is only moderately developed. Additional infrastructure and a change of consciousness among ordinary tourists might lead to an increase in the value of this variable. “Gazi Retreat” lodge provides high-class services and facilities for affluent tourists. The “Gazi Women Boardwalk” is responsible for visits to the mangroves. The Operations Manager of “Gazi Retreat”, S. Fernandez, said that every visitor is strongly encouraged to visit the Boardwalk to support the local community.
This study uses the income / market value method to estimate the tourism value of the mangroves in Gazi. Table B9 shows the number of tourists visiting the Boardwalk from 2008 to 2010 . This study assumes that the income for the “Gazi Women Boardwalk” is an appropriate figure to apply to the value of eco-tourism. This figure will increase if mangroves are marketed more widely, especially in Diani, where a lot of international tourists spend their holidays. The study also recommends applying the “Travel Costs Method” (TC), which could increase the value of this variable significantly. Lack of primary data prevented the application of TC in this study.
Page
16
Economic analysis of mangrove forests: A case study in Gazi Bay, Kenya
Table B9: Tourists visiting the “Gazi Women Mangroves Boardwalk “(2008-2010)
Months No . of Visitors
2008 2009 2010
Jan 14 60 68
Feb 8 66 175
Mar 10 160 196
April 87 83 38
May 131 3 101
June 31 144 161
July 244 325 335
Aug 140 178 167
Sept 27 38 102
Oct 95 43 119
Nov 195 89 75
Dec 162 135 136
TOTAL 1144 1324 1673
Source: Gazi Women Boardwalk
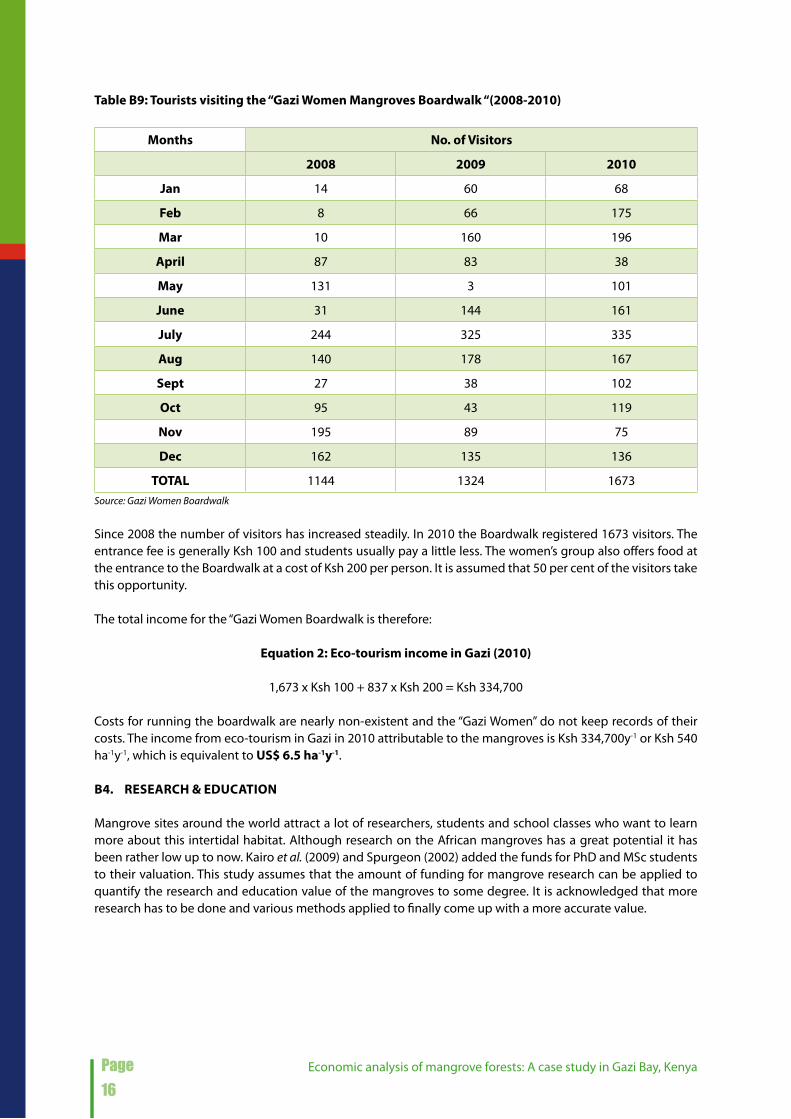
Since 2008 the number of visitors has increased steadily. In 2010 the Boardwalk registered 1673 visitors. The entrance fee is generally Ksh 100 and students usually pay a little less. The women’s group also offers food at the entrance to the Boardwalk at a cost of Ksh 200 per person. It is assumed that 50 per cent of the visitors take this opportunity.
The total income for the “Gazi Women Boardwalk is therefore:
Equation 2: Eco-tourism income in Gazi (2010)
1,673 x Ksh 100 + 837 x Ksh 200 = Ksh 334,700
Costs for running the boardwalk are nearly non-existent and the “Gazi Women” do not keep records of their costs. The income from eco-tourism in Gazi in 2010 attributable to the mangroves is Ksh 334,700y-1 or Ksh 540 ha-1y-1, which is equivalent to US$ 6 .5 ha-1y-1.
B4 . RESEARCH & EDUCATION
Mangrove sites around the world attract a lot of researchers, students and school classes who want to learn more about this intertidal habitat. Although research on the African mangroves has a great potential it has been rather low up to now. Kairo et al. (2009) and Spurgeon (2002) added the funds for PhD and MSc students to their valuation. This study assumes that the amount of funding for mangrove research can be applied to quantify the research and education value of the mangroves to some degree. It is acknowledged that more research has to be done and various methods applied to finally come up with a more accurate value.

Page
17
Economic analysis of mangrove forests: A case study in Gazi Bay, Kenya
Students visiting the mangroves in GaziSource: © Janis Hoberg / UNEP
There have been a number of research projects in the Gazi Bay mangroves during the period 2007 and 2010. Funding for those projects was as follows (Kairo, pers. comm.):PhD = 5 * US$ 10,000 / yearMsc = 9 * US$ 6,000 / yearBsc = 4 * US$ 2,500 / yearTOTAL = US$ 114,000 / year
The funding and research value per year is therefore US$ 114,000 or US$ 184 .4 ha-1y-1.
B5 . AqUACULTURE
Combining the efforts of KMFRI, UNDP and “The Gazi Fishermen Group” in January 2011 one of the newest initiatives in Gazi is the aquaculture project. Four ponds were established each featuring different sizes and settings. 20 people were involved in the project and the fingerlings and juvenile fishes were captured from the mangroves. The study assumes that all income from the aquaculture production can be related to the mangrove valuation since the ponds were established as a “mangroves related project”.
The fish species is milkfish and the feed is maize jam, which costs Ksh 2,000 per bag (270 Kg). The fishes are fed on a daily basis. For the 4 ponds, 5 Kg of maize jam are used every day. The total cost of 1,825Kg of maize jam per year is therewith Ksh 13,518. The milkfish takes 5 months to grow, which results in 2.4 intakes per year. The milkfish is sold at Ksh 100. According to A. Hamsa (pers. comm.) the costs of construction of the two UNDP ponds were Ksh 397,245 including the repair of the two other ponds. The total cost for the KMFRI pond was Ksh 175,000. The construction of the communal pond was Ksh 70,000 (Wanjiru, pers. comm.). The total construction costs were therefore Ksh 642,245. It is also assumed that the ponds have to be rebuilt after 8 years, which results in annualized construction costs of Ksh 80,280. The revenue from the ponds is as follows:

Page
18
Economic analysis of mangrove forests: A case study in Gazi Bay, Kenya
Table B10: Revenues from aquaculture ponds in Gazi
Pond SizeFish population
densityPotential number
of fishes / yearRevenues (Ksh)
KMFRI 180m2 2 fishes / m2 864 86,400
UNDP1 180m2 2 fishes / m2 864 86,400
UNDP2 180m2 3 fishes / m2 1296 129,600
Communal 80m2 2 fishes / m2 384 38,400
TOTAL 620m2 - 3408 340,800Source: Wanjiru, Aquaculture Management Gazi, pers. comm. March 2011
Income from the ponds is derived as follows:
Table B11: Income from aquaculture production in Gazi
Parameter Amount
Revenues (Ksh / year) 340,800
Feeding costs (Ksh / year) 13,518
Construction costs (Ksh / year) 80,280
Income ( Ksh / year) 247,002
Mangroves (ha) 620
Value of aquaculture ( Ksh / ha / year) 398 .4
The value of aquaculture production in Gazi Bay is Ksh 398.4 ha-1y-1, (US$ 4 .8 ha-1y-1). Although quite low a real potential exists. Up to now only 4 ponds have been built and the revenues are distributed over 620 hectares of mangroves. The concept is new and requires more research and practical application until it becomes a steady, alternative income source besides the offshore fishing.
B6 . APICULTURE
The first mangroves-related apiculture project in Gazi was introduced in 2010. After some problems with colonisation the first harvest was completed in the beginning of 2011. Apiculture is usually implemented through the establishment of bee hives. Since the apiculture project was introduced as a new way of creating benefits from the Gazi mangroves, this study assumes that the income from the bee hives can be added in its whole to the valuation. In addition, the bees get the nectar from the mangroves flowers and no other valuable sources are available in Gazi.
A total of 24 hives were built, each with 9 columns. Each column produces 3Kg of honey in 3 months. This results in 108Kg of honey / hive / year. The 24 hives are able to produce 2,592Kg of honey in one year. The honey can be sold at Ksh 300/Kg. The total potential annual revenue is therefore: Ksh 777,600 per year. The construction costs were Ksh 122,690 (Hamsa, pers. comm.). Without a protective shade a hive can last 10 years. Annualizing the construction costs results in annual costs of Ksh 12,269. The potential total annual income is thus: Ksh 765,331 per year or Ksh 1234.4ha-1y-1, which is equivalent to US$ 14 .7 ha-1y-1. If this business is expanded successfully it will constitute an important alternative source of income. However, problems arise from an insufficient amount of flowers and freshwater. Artificial sources have to be provided to keep the bees from using flowers and freshwater wells close to the village which could create problems for the community and visiting tourists.

Page
19
Economic analysis of mangrove forests: A case study in Gazi Bay, Kenya
C RESULTS FOR INDIRECT USE VALUES
C1 . SHORELINE PROTECTION
Studies show that where mangroves are intact they work as an effective buffer against tsunamis (UNEP-WCMC 2006). The death toll after the 2004 tsunami was significantly lower in areas where mangroves had remained unharmed (Das et al., 2008). Mangroves also prevent soil erosion and damage from the rise in sea-level. This study focuses only on the valuation of mangroves as a protection against extreme weather events such as tsunamis, cyclones or hurricanes. While some researchers generalized the protective function of mangroves to entire coastlines others have focused on the “apocalyptic nature” of these events and therefore minimized the contribution of mangroves to shoreline protection (see Walters et al., 2008). Kairo et al. (2009) valued shoreline protection as a major service of mangroves with close to 55% of the total economic value. In other studies (Spurgeon, 2002; Leong, 1999) the proportion is less. Other valuations range from US$ 32 ha-1y-1 to US$ 3,679 ha-1y-1 (Bann, 1997, Sathirathai et al., 2001). Barbier et al. (2008) claims that shoreline protection is one of the most undervalued mangrove ecosystem services yet mangroves can provide protection to coastal communities up to 5km inland. The study also points out that benefiters can be different depending on the use of the land. While outside investors may benefit from converting mangroves into uses such as shrimp farms, local communities mostly gain profits from protection and wise use of mangroves.
The valuation itself is complex since a number of factors and aspects have to be incorporated and different methodologies applied. The most widely used method is the Replacement Cost Method (RC) which derives the value of a man-made seawall as having the same protective effect for the shoreline. The value is then applied to the mangroves (Kairo et al. 2009, Spurgeon 2002). The alternative is the “Damage Cost Avoided Method” which calculates the potential damage a tsunami would have on the urban infrastructure or losses in agriculture if mangroves did not exist (Ruitenbeek, 1992). This study applies the damage cost avoided method.
Studies show that 30 trees per 100m2 in a 100m wide belt may reduce tsunami flow rate by as much as 90% (EjF, 2006). Different studies on the impact of the tsunami in 2004 indicated that in an area with an intact mangrove belt only 7 per cent of the villages were severely affected, while in areas where the mangrove forests were degraded, damage reached 80-100 per cent (Dahdouh-Guebas, 2006). Taking 80 per cent as representative, this corresponds to an additional protection of 73 per cent of the villages due to mangroves.
The impacts of a potential tsunami on the Kenyan coast are likely to be severe (Ngunjiri, undated). Since any extreme weather event occurs randomly and likelihood predictions do not exist, figures here have to be interpreted cautiously. As of 2011 only the 2004 tsunami which hit the Southeast Asian coastlines affected Kenya.
The greatest threat for the Kenyan coastline, however, is the Karthala volcano on the Comoros. It is active and has had four differing scale eruptions since 2005. Another large scale outbreak could lead to lava flowing into the ocean and trigger a tsunami which would eventually cause havoc along the Eastern African coastline. The increasing frequency of eruptions from the Karthala volcano since 2005 raises concerns about the potential of the volcano to produce a major eruption, which could have severe consequences. A tsunami caused by lava flow into the Indian Ocean from the Karthala volcano, could reach Mombasa in less than 30 minutes (Hartnady, 2005) (Map 2). According to Hartnady (per. comm.) the Karthala represents a possible tsunami hazard due to large-scale flank collapse on its western side. Taking into account recent developments this study assumes that the probability of an eruption of Karthala and other threats, including for example an accompanying tsunami caused, could lead to damage in Gazi Bay roughly estimated at 5 per cent per year. This figure includes all possible weather events that occur from the sea and which could affect Gazi Bay. It is pointed out that the assumptions of 73 per cent additional protection through mangroves and 5 per cent likelihood of a severe weather event are limited in their validity. The value for shoreline protection as it is quantified in this study is only a preliminary result and requires further investigations.

Page
20
Economic analysis of mangrove forests: A case study in Gazi Bay, Kenya
Map 2: Potential spread of a tsunami wave from Karthala lava flow
Data source: Giri et al. (2010); Hartnady (2005). Map redrawn by UNEP/DEWA
Gazi mangroves protect two nearby villages: Gazi and Makongeni. According to Dr. Kairo (KMFRI, pers. comm.) there are about 700 houses around the bay of which 500 are in Gazi and 200 in Makongeni. The average house price is as follows:
Gazi Bay
I n d i a n
O c e a n
Karthala volcano
< 30 Min
Tanzania
Kenya
Madagascar
Mozambique
Somalia
30°0'0"E
0°0'0"
15°0'0"S
30°0'0"S
I n d i a n O c e a n
Eastern AfricaEastern Africa
LegendMangroves
Tsunami waves0 500250Kilometers
Page
21
Economic analysis of mangrove forests: A case study in Gazi Bay, Kenya
Table C1: Calculation of the average house price
Status of house Village compositionHouse price
(US$)Contribution to total avg .
house price (US$)
Permanent 15% 5000 750
Semi-permanent 70% 2000 1400
Temporary 15% 500 75
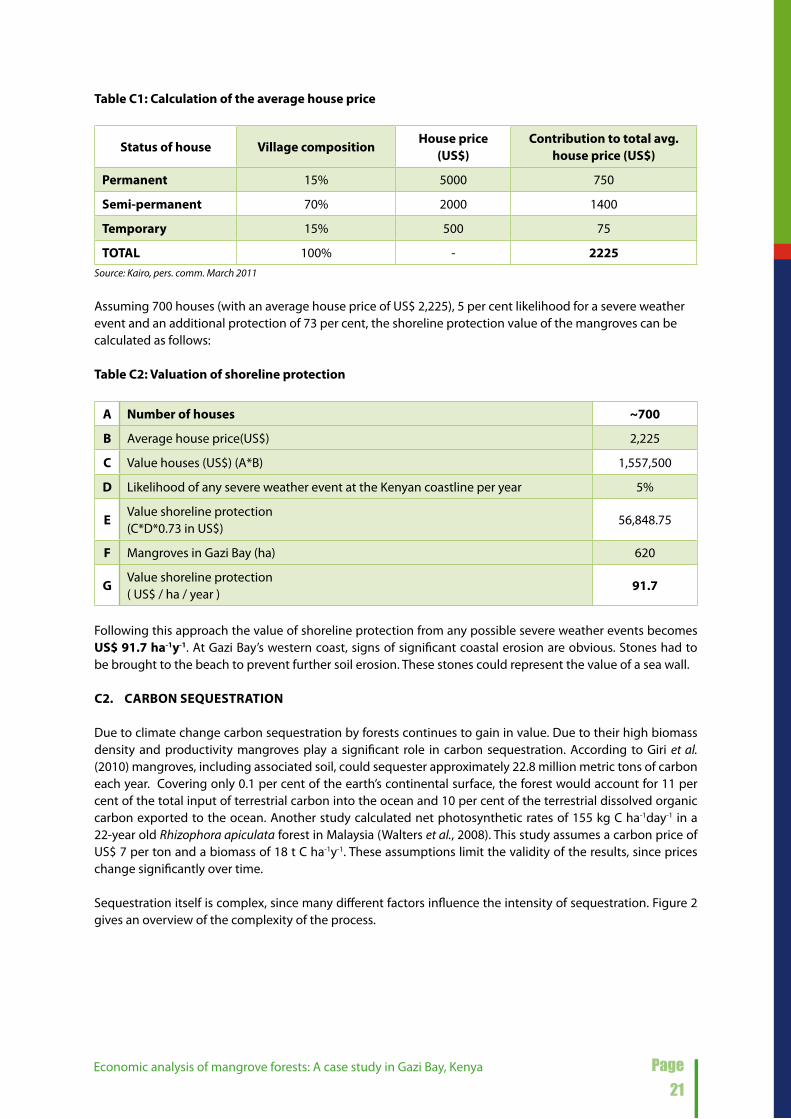
TOTAL 100% - 2225Source: Kairo, pers. comm. March 2011
Assuming 700 houses (with an average house price of US$ 2,225), 5 per cent likelihood for a severe weather event and an additional protection of 73 per cent, the shoreline protection value of the mangroves can be calculated as follows:
Table C2: Valuation of shoreline protection
A Number of houses ~700
B Average house price(US$) 2,225
C Value houses (US$) (A*B) 1,557,500
D Likelihood of any severe weather event at the Kenyan coastline per year 5%
EValue shoreline protection (C*D*0.73 in US$)
56,848.75
F Mangroves in Gazi Bay (ha) 620
GValue shoreline protection( US$ / ha / year )
91 .7
Following this approach the value of shoreline protection from any possible severe weather events becomes US$ 91 .7 ha-1y-1. At Gazi Bay’s western coast, signs of significant coastal erosion are obvious. Stones had to be brought to the beach to prevent further soil erosion. These stones could represent the value of a sea wall.
C2 . CARBON SEqUESTRATION
Due to climate change carbon sequestration by forests continues to gain in value. Due to their high biomass density and productivity mangroves play a significant role in carbon sequestration. According to Giri et al. (2010) mangroves, including associated soil, could sequester approximately 22.8 million metric tons of carbon each year. Covering only 0.1 per cent of the earth’s continental surface, the forest would account for 11 per cent of the total input of terrestrial carbon into the ocean and 10 per cent of the terrestrial dissolved organic carbon exported to the ocean. Another study calculated net photosynthetic rates of 155 kg C ha-1day-1 in a 22-year old Rhizophora apiculata forest in Malaysia (Walters et al., 2008). This study assumes a carbon price of US$ 7 per ton and a biomass of 18 t C ha-1y-1. These assumptions limit the validity of the results, since prices change significantly over time.
Sequestration itself is complex, since many different factors influence the intensity of sequestration. Figure 2 gives an overview of the complexity of the process.

Page
22
Economic analysis of mangrove forests: A case study in Gazi Bay, Kenya
Figure 2: Process of carbon sequestration in mangroves
Source: Bouillon et al. (2008)
A number of attempts to measure the ability of Gazi mangroves to sequester carbon have been undertaken. While most of these attempts were rather based on ecological approaches, Kairo et al. (2010) came up with a straightforward result of 18 tC ha-1y-1 carbon benefit potential. Carbon prices change depending on the location of the market, the type of market (e.g. Voluntary market) and supply and demand. This study assumes a price of US$ 7 per ton. These assumptions result in an additional mangrove value of US$ 126 ha-1y-1 .
C3 . BIODIVERSITY
Few studies have measured the value of biodiversity in mangroves. Nonetheless, mangroves in their undisturbed state are regarded as a refuge for rich biodiversity. Valuing biodiversity in monetary terms is one of the newest approaches in the field of environmental economics. The current discussion is stuck somewhere between ethical concerns about trying to put a value on life, and complex analysis models that try to quantify its value. Ruitenbeek (1992) defines the “capturable biodiversity benefit” as the potential benefit which the country might be able to obtain from the international community in exchange for maintaining its biodiversity base intact. Biodiversity value combines direct, indirect and non-use value and is a valuation of human preference rather than actual value (UNEP/GPA, 2003).
The greatest challenge is the non-use or non-marketable character of biodiversity. This problem has led to the fact that most attempts to value biodiversity apply the Contingent Valuation Method (CV). It is the most widely used method for estimating non-use values. It is based on the “Willingness to Pay” (WTP) concept, which includes surveys of the local and regional communities, asking them to place a monetary value on the mangroves and say, what they are willing to pay to conserve the biodiversity. The advantages of this method are its flexibility and has wide acceptance. However, CV is costly. Often, researchers use the “Benefit Transfer Method” (BT). The procedure estimates the value of an ecosystem service by transferring an existing valuation estimate from a similar ecosystem (TEEB, 2010). According to TEEB (2010) BT is the second most applied methodology to estimate services of wetlands. Therefore its application here to calculate the biodiversity value is justified.
In reality, what valuation studies normally measure is the economic value of ‘biological resources’ rather than biodiversity (Bann, 1997). Other studies suggest that the value of biodiversity should be expressed as or should at least include the value of medicinal and pharmaceutical extracts from the forest (Abeysinghe, 2010). This indicates that mangroves might be a source of different medicinal properties such as specific antibacterial features. Following this approach Ruitenbeek (1992) came up with a biodiversity value of US$ 15 ha-1y-1, measuring mainly the pharmaceutical value of the mangroves. UNEP/GPA (2003) used the following benefit transfer formula to calculate the value of biodiversity of mangroves in Sri Lanka:
faunal assimilationand respiration
sediment-atmosphereand sediment-water
CO2 exchange
sedimentburial exchange
of POC, DOCand DIC
root production
wood productionwater-atmosphere
CO2 e�ux
litter fall
direct herbivory

Page
23
Economic analysis of mangrove forests: A case study in Gazi Bay, Kenya
Equation 3: Benefit Transfer Method
Valuey = Value
x (PPP GNP
y /PPP GNP
x)E
Where:PPP GNP =Purchasing power parity GNP per capitaE = Elasticity of values with respect to real income (UNEP/GPA (2003) assumed E=1.00)E = 1.00 implies a 1 per cent change in WTP relative to a 1 per cent change in real income.
This method was adopted in this study for estimating non-use benefits of mangroves. Using this formula, UNEP/GPA (2003) estimated a value of US$ 18 ha-1y-1 for biodiversity. The data for the PPP GNP are as follows according to the World Bank (2011):
PPP GNP Sri Lanka 2009
= US$ 4,720PPP GNP
Kenya 2009 = US$ 1,570
Applying the figures gives the following result:
US$ 18 [US$ 1570 / US$ 4720]1.00 = US$ 5 ha-1y-1
Due to the relatively low PPP GNP of Kenya the value of biodiversity of the Kenyan mangroves, using BT, is only US$ 5 ha-1y-1. This value might change significantly, if a different methodology, such as WTP, is applied. This requires extensive field work and it is put forward as a recommendation to confirm the theoretically calculated results.
Rhizophora MucronataSource: © Janis Hoberg / UNEP

Page
24
Economic analysis of mangrove forests: A case study in Gazi Bay, Kenya
D . RESULTS FOR NON-USES VALUES
D1 . EXISTENCE VALUE
The simple acknowledgement of the existence of the mangroves can also be valuated. This expresses the intrinsic value of mangroves, considering cultural, aesthetic, heritage and landscape aspects (Ghani, 2006). In this case, all direct or indirect uses of the mangrove forest are not considered and the ecosystem is left without harming or using it. To come up with a monetary valuation of the existence of an ecosystem, Willingness To Pay (WTP) is applied by asking affected people how much value they would put on the simple existence and conservation of the relevant ecosystem. In other words the existence value of a natural resource is identified with the member of society’s WTP for the preservation or the use of the recreation value of forests and natural ecosystem (Deghani et al., 2010).
This study uses BT values from Spurgeon (2002) in Egypt. The limitations of the validity of this approach are acknowledged. Differences in environmental settings, society’s dependence on mangroves and in the wealth of the population can influence the WTP significantly. It is therefore strongly recommended that contingent valuation should be applied in Gazi Bay in order to quantify the existence value more accurately. Table D1 and D2 show the estimates for the non-use value of the mangroves in Egypt. The data were obtained from national statistics.
Table D1: Potential national non-use value for Egypt’s mangroves
Parameter Low Best High
National population (2002) - 66,000,000 -
% population willing to pay (WTP) 1% 2.5% 10%
WTP US$/year 0.1 1 5
Area of mangroves (ha) - 500 -
Total value of mangroves (US$/year) 66,000 1,650,000 33,000,000
Value of mangroves (US$/ha/year) 132 3,300 66,000
Source: Spurgeon, 2002
Table D2: Potential visitors non-use value for Egypt’s mangroves
Parameter Low Best High
Visitors to Sinai and Red Sea (2002) - 2,400,000 -
% visitors willing to pay (WTP) 5% 20% 40%
WTP US$/person 1 10 20
Area of mangroves (ha) - 500 -
Total value of mangroves (US$/year) 120,000 4,800,000 19,200,000
Value of mangroves (US$/ha/year) 240 9,600 38,400
Source: Spurgeon, 2002

Page
25
Economic analysis of mangrove forests: A case study in Gazi Bay, Kenya
Using the same approach for Kenya leads to the following results:
Table D3: Potential Kwale population non-use value for Gazi Bay’s mangroves
Parameter Low Moderate High
Population Kwale district (2010) 650,000 650,000 650,000
% of population willing-to-pay (WTP) 1%* 2.5%* 10%*
WTP US$ / year 0.1* 1* 5*
Area of mangroves in Gazi (ha) 620 620 620
Total value of mangroves (US$/yr) 650 16,250 325,000
Value of mangroves (US$/ha /yr) 1.05 26.21 524 .19*Assuming distribution from Spurgeon (2002)
People along the Kenyan coastline depend heavily on mangrove products. Therefore, consciousness of mangroves in Kenya can be assumed to be higher than in Egypt. Conclusively the parameter column “high” can be stated as being representative for Kenya. This results in a US$ 524.19 ha-1y-1 mangrove existence value when using the theoretical approach. Gazi Bay is home to around 3,000 inhabitants (Kairo, pers. comm.). Table D4 is a proposal for future use.
Table D4: Potential national non-use value for Gazi Bay’s mangroves (Empirical approach)
Parameter Low Moderate High
Population in Gazi Bay 3,000 3,000 3,000
% of Gazi Bay population “willing-to-pay” ? ? ?
WTP US$ / yr ? ? ?
Gazi Bay (ha) 620 620 620
Total value of mangroves (US$/yr)
Value of mangroves (US$/ha/yr)
? Questionnaire / Survey needed
On average round about 4,000,000 tourists per year visit the coastline of Kenya (KBS, 2010). Kenya as a whole features around 57,000 hectares of mangroves.
Table D5: Potential visitors’ non-use value for Gazi Bay’s mangroves (Theoretical approach)
Parameter Low Moderate High
Visitors of the Kenyan coastline 4,000,000 4,000,000 4,000,000
% of coastal visitors willing-to-pay (WTP) 5%* 20%* 40%*
WTP US$ / yr 1* 5* 20*
Area of mangroves in whole Kenya (ha) 53,000 57,000 61,000
Total value of mangroves (US$/y) 200,000 800,000 3,200,000
Total value of mangroves (US$ / ha /y) 3.8 70 .2 524.6
*Assuming distribution and WTP from Spurgeon (2002)

Page
26
Economic analysis of mangrove forests: A case study in Gazi Bay, Kenya
Since coastline tourists are usually only moderately interested in mangroves and most of them stay in hotels close to Diani Beach or Mombasa, the column “Moderate” is assumed to be appropriate. The existence value of the mangroves for visitors is therefore US$ 70 .2 ha-1y-1. Table D6 is a proposal for future use.
Table D6: Potential visitors’ non-use value for Gazi Bay’s mangroves (Empirical approach, WTP)
Parameter Low Best High
Visitors in Gazi Bay (2010) 1,673 1,673 1,673
% of Gazi Bay visitors willing-to-pay (WTP) ? ? ?
WTP US$ / year ? ? ?
Gazi Bay (ha) 620 620 620
Total value of mangroves in Gazi Bay (US$/y) ? ? ?
Total value of mangroves in Gazi Bay (US$/ha/y) ? ? ?
? Questionnaire / Survey needed
Table D7: Existence value of the mangroves in Gazi Bay (Theoretical approach)
Parameter Result
Existence value of mangroves for nationals ( US$ / ha / yr ) 524.19
Existence value of mangroves for visitors ( US$ / ha / yr ) 70.2
Total existence value of mangroves ( US$ / ha / yr ) 594 .39
It is a well-known fact that this approach is greatly influenced by local and regional circumstances such as wealth, education and awareness of the matter. For instance, Leong (1999) derived a significant existence value of US$ 26.439 ha-1y-1. In addition, since Kenya features a much higher amount of mangroves than for example Egypt, per hectare values in Kenya must be lower because the total amount of WTP is distributed over a larger area of mangroves.
Source: © Janis Hoberg / UNEP

Page
27
Economic analysis of mangrove forests: A case study in Gazi Bay, Kenya
E . TOTAL ECONOMIC VALUE (TEV)
The Total Economic Value consists of the three components: Direct Use Value, Indirect Use Value and Non-Use Value (Sathirathai, 1995). Thus TEV is made up of use value and non-use value. By definition, use values derive from the actual use of the environment while non-use values are non-instrumental values which are in the real nature of the thing but unassociated with actual use, or the option to use the thing. Instead such values are taken to be entities that reflect people’s preferences, but include concern for, sympathy with, and respect for the rights or welfare of non-human beings. The TEV value for the mangrove forest of Gazi bay is summarized in Figure 3.
Figure 3: Total Economic Value mangrove forest Gazi Bay (TEV)
TOTAL ECONOMIC VALUEUS$ 1,092.3 / hectare / year
Direct Use ValueUS$ 275.2 / ha / year
Fishery US$ 44 / ha / year
Building poles US$ 4 / ha / year
Fuel woodUS$ 16.8 / ha / year
Eco-tourismUS$ 6.5 / ha / year
ResearchUS$ 184.4 / ha / year
ApicultureUS$ 14.7 / ha / year
AquacultureUS$ 4.8 / ha / year
Indirect Use Value US$ 217.7 / ha / year
Shoreline protectionUS$ 91.7 / ha/ year
Carbon sequestration US$ 126 / ha / year
BiodiversityUS$ 5 / ha / year
Non-Use ValueUS$ 594.4 / ha / year
Existence value US$ 594.4 / ha / year

Page
28
Economic analysis of mangrove forests: A case study in Gazi Bay, Kenya
F . DISCUSSION
The Total Economic Value (TEV) of the mangroves in Gazi Bay is US$ 1,092.3 ha-1y-1. Direct uses account for around 25 per cent of the TEV. Mangroves should be used in a sustainable way to guarantee preservation for future generations and the conservation of the indirect uses, particularly shoreline protection and carbon sequestration. These uses will diminish in value if the forest is not managed sustainably.
Indirect uses represent 20 per cent of the TEV. This share is likely to increase in the future as the issue of carbon sequestration becomes more and more important. The market for carbon credit is expanding rapidly and could become the biggest global commodity market in the near future. Additionally, sea-level rise threatens the distribution of mangroves, leading to an increase in the value of shoreline protection.
The non-use value contributes the biggest share to the TEV of about 55 per cent. This figure should be reconsidered since no primary data is available. The application of the contingent valuation method (CV) could result in a more accurate figure.
The contribution of mangroves to on- and offshore fisheries in Gazi is valued at US$ 44 ha-1y-1. This is significantly less than the value that Kairo et al. (2009) derived for the reforested area, which was US$ 113.09 ha-1y-1. This is due to the fact that this study assumes a contribution of mangroves to fishery of 31.7 per cent, while Kairo et al. (2009) assumed 100 per cent. It is a well-known fact that sea grasses and coral reefs play a significant role in coastal fisheries. This justifies the assumption of a close to one third contribution. Spurgeon (2002) estimated a value of US$ 18,150 ha-1y-1, assuming that the 500 hectares of mangroves support fishery along the whole Red Sea coast. This study assumes that mangroves only support fishery around Gazi Bay. The Bay itself is protected by Chale Island and therefore creates a rather isolated ecosystem with the adjacent coral reef in the South. Most of the fishing is done close to the coral reef. The limitation of the mangroves’ contribution to fishery in Gazi to the bay is therefore acceptable.
Global estimates for the fishery value of mangroves range from US$ 84 ha-1y-1 (Sathirathai, 1995) to US$ 39,750 ha-1y-1 (Aburto-Oropeza et al., 2008). The wide range is due to the variability of the factors included in the analysis. For instance, the extent of the area that is considered to belong to the range of influence of the mangroves differs significantly between the studies. Secondly, the contribution of mangroves to fishery is handled differently (see Table B2). Thirdly, the amount of catch is subject to local environmental conditions, the provision of fishing gear and the richness of the fishing grounds. This study uses a rather strict assumption regarding the contribution of mangroves to fishery and the value ranges at the lower end of the spectrum.
This study also uses a conservative approach when calculating the allowable amount of harvestable wood. The value for building poles and fuel wood amounts to US$ 20.8 ha-1y-1. According to Spalding et al. (2010) the global range of timber/fuel wood value is US$ 10 - 1,093 ha-1y-1. Kairo et al. (2009) valued the building poles at US$ 360.67 ha-1y-1 for the replanted area. In recent years the cutting of mangroves in Gazi has been highly restricted and only one person is issued with a license. The allowable amount is limited to 500 scores, each consisting of 20 stems. This is equivalent to only 16 stems ha-1y-1. In comparison, Kairo et al. (2009) assumed a total amount of harvestable wood of 241 scores or 4819 stems ha-1y-1. The reforested area is planted with a density of one tree per 1- 1.5m2. Therefore the amount of trees per hectare is estimated to be around 8,000. Using the figures from Kairo et al. (2009), one would cut 60 per cent of all trees every year. This cannot be classified as sustainable harvesting and is therefore not the appropriate figure for the valuation. This study instead relies on primary data of the concessionaire, who stated that he is only allowed to cut 500 scores per year. Considering these strict limitations a value of US$ 4 ha-1y-1 for the building poles is reasonable.
Fuel wood is valued at US$ 16.8 ha-1y-1. This is close to the value of US$ 18.5 ha-1y-1 that Kairo et al. (2009) calculated for the reforested area. It is still a bit less, which can be explained by the fact that the reforested area is more densely planted than the natural forest surrounding it.
Eco-tourism in Gazi is valued at US$ 6.5 ha-1y-1. Kairo et al. (2009) valued it with US$ 9.3 ha-1y-1. A global overview provided by Spaldings et al. (2010) presents a range of US$ 43 – 152,100 ha-1y-1 for mangrove-related tourism. The value of tourism in Gazi is low because of the fact that tourism in Gazi Bay is really in its infancy. The only

Page
29
Economic analysis of mangrove forests: A case study in Gazi Bay, Kenya
income from tourism related to the mangroves comes from the “Gazi Women Boardwalk” that had ~ 1700 visitors in 2010 and charges only Ksh 100 per person. Nonetheless there is potential for more tourism in Gazi, especially if tourists from the nearby Diani-Beach are made aware of eco-tourism at Gazi.
Research and education in the Gazi mangroves is valued at US$ 184.4 ha-1y-1. This is less than the US$ 770.23 ha-
1y-1 that Kairo et al. (2009) obtained, but that study distributed the whole amount of current funding over only 7 hectare of replanted mangroves, which naturally led to a higher per hectare value. Globally, little research has been on the research and education value of mangroves. Spurgeon (2002) estimated US$ 18,000 ha-1y-1, based on the setting that less mangroves exist in the Egypt than in Kenya, which obviously leads to higher per hectare value.
Aquaculture production is valued at only US$ 4.8 ha-1y-1 since it is in early stages of establishment in Gazi. No comparable estimates have been done so far, which makes the project in Gazi a pilot project for other mangroves sites, with aquaculture as an alternative income source for the local community. It is important to stress that no mangroves should be harvested to make space for the ponds. Only the juvenile fish for the ponds should be obtained from the mangroves so that they actually contribute to the aquaculture production. Once well established, the ponds in Gazi can be expanded. Therefore there is a high potential for the value to appreciation in the future.
What is true for aquaculture production is also valid for apiculture in Gazi. As a project that has been established only recently, the current value ranges at US$ 14.8 ha-1y-1. However, it is higher than the value derived by Spurgeon (2002), which is US$ 0.8-1 ha-1y-1, since no noteworthy beekeeping had been established in the Egyptian mangroves by then.
Indirect usage of the Gazi mangroves consists of shoreline protection, carbon sequestration and biodiversity. This study suggests a value of US$ 91.7 ha-1y-1 for the shoreline protection function of the mangroves. Kairo et al. (2009) used the sea wall replacement method, which resulted in US$ 1,586.66 ha-1y-1. This study uses the “Damage Costs Avoided Method”, since the replacement method does not consider the differences of space of a mangrove forest and a sea wall. In addition, a sea wall does not feature the same costs and characteristics when assumed to be replaced at a completely different site. However, even the “Damage Costs Avoided Method” is lacking accuracy, since the prediction of a severe weather event affecting Gazi Bay is highly speculative. It is therefore recommended that further research on the actual protection value of mangroves from erosion and tsunamis be conducted.
Carbon sequestration is one of the major functions of mangrove forests. Since markets for carbon credits are starting to emerge, the focus of research on mangrove services is shifting towards their ability to sequester carbon. The ability depends on the productivity of the ecosystem which is varies from site to site depending on local precipitation patterns, salinity and solar intensity. Eastern Africa belongs to the region where mangroves feature less productivity than for instance, in Southeast Asia. However, they are still able to sequester significant amounts of carbon by producing new biomass while storing carbon in the above and below biomass.In Gazi Bay, the reforestation project dubbed “Mikoko Pamoja” (Kairo et al., 2010) provided reliable data on carbon sequestration of Gazi mangroves. Using those figures, this study derives a value of US$ 126 ha-1y-1. This represents an increase in value compared to the value of the reforested area from Kairo et al. (2009), although this study uses a price of US$ 7 per metric tonne of Carbon (tC), instead of US$ 10 per tC, which is what Kairo et al. (2009) assumed. Up to now, only few valuation studies world-wide have integrated carbon sequestration in their analysis. UNEP/GPA (2003) derived a value of US$ 85 ha-1y-1 (Spalding et al., 2010).
This study values biodiversity at US$ 5 ha-1y-1. The concept of biodiversity valuation is a relatively new feature in environmental economics (TEEB, 2010). The most accurate procedure to calculate it is to conduct a survey and ask locals for their “Willingness to pay” (WTP). This study uses the widely accepted “Benefit Transfer Method” (BT) instead, which is much easier to apply. The global valuation overview of Spalding et al. (2010) ranges biodiversity value at US$ 1-21 ha-1y-1.
Existence value as the only non-use value component of the TEV in this study is valued at US$ 594.4 ha-1y-1. Since this value is calculated with BT from the study in Egypt (Spurgeon, 2002), it is highly

Page
30
Economic analysis of mangrove forests: A case study in Gazi Bay, Kenya
recommended that a questionnaire is designed and a survey conducted to derive a more appropriate figure for the non-use value.
The TEV of this study results in US$ 1,092 ha-1y-1. Kairo et al. (2009) valued the replanted area of 7 hectares of Rhizophora mucronata at US$ 2902.9 ha-1y-1. However, this study focuses much more on a sustainable use of the mangroves, which is the reason for the comparably low TEV. Global estimates range from ~ US$ 1,000 ha-1y-1 to ~ US$ 22,000 ha-1y-1 (Spalding et al., 2010). Although the study provides values at the very lower end of the valuation range this can be justified by several factors. Gazi Bay is just at its infancy in terms of tourism development, strict limitations for harvesting are in place, and the abundance of mangroves along the Kenyan coastline diminishes the per hectare value considerably. This means that tourism income, WTP for the mangroves and research funds are distributed over a larger area.
This study shows that mangrove forests are a significant natural asset in a given economy. Decision-makers are encouraged to consider these non-marketable goods and services when calculating the national accounts. Acknowledging the value of mangroves as a natural capital is a forward step for Kenya towards the transition to a green economy. In addition, local government officials and land owners should incorporate the value of mangroves in their decision making process of determining the most appropriate land use.
Soil erosion in Gazi BaySource: © Janis Hoberg / UNEP

Page
31
Economic analysis of mangrove forests: A case study in Gazi Bay, Kenya
G . OTHER STUDIES ON MANGROVES VALUATION IN AFRICA
Research on mangrove valuation has been done on a large scale, but still in its infancy stage in Africa. Lack of funding, data, methodologies and knowledge about ecosystem linkages has prevented most researchers from expanding their analyses in order to include a wider range of mangroves goods and services. In 2003 the African Mangrove Conservation Network was founded. So far, 21 countries have become members of network. Gazi Bay in Kenya is one of the major study sites of mangroves in Africa. There are only a few other sites where mangrove valuation research has been conducted (Table G1).
The Ghana Wildlife Department conducted the Lower Volta Mangrove Project (LVMP) to enhance awareness of mangrove conservation in the estuary area of the Lower Volta River. The project included the following economic assessment: Per person net return from fish was recorded to be US$ 30 per week. The contribution to roofing a house was estimated at US$ 85. The total value of harvests from mangroves was valued at US$ 340 ha-1y-1. The contribution to fishery (nursery habitat) was valued at US$ 165 ha-1 y-1. The total value of the mangroves at Lowe Volta River estuary was estimated to be as high as US$ 500 ha-1y-1 (GWD, 1996). However, the study lacks in other variables such as tourism and erosion protection, which are usually included in mangrove valuations.
Table G1: Economic valuations of mangroves in Africa (all values in US$ / hectare / year)
Product / ServiceThis study
(2011)Kairo et al.
(2009)Lower Volta Mangrove
project (1996)Spurgeon
(2002)
Kenya: GaziKenya: Gazi
(Replantation)Ghana Egypt
Extent of mangroves (ha) 620 7 ? 500
Direct use
Fishery 44.00 113.09 254.00 18,150
Wood 20.80 379.17 251.00 -
Apiculture 14.70 - - 0.8-1
Aquaculture 4.80 - - -
Education & Research 184.40 770.23 - -
Tourism / Recreation 6.50 9.30 - 130,000
Indirect use
Carbon sequestration 126.00 44.42 - -
Shoreline protection 91.70 1586.66 - 1050
Biodiversity value 5.00 - - -
Non-use value
Existence value 594.40 - - -
Total Economic Value 1,092.30 2902.87 505.00 ~149,200
Sources: Kairo et al. (2009); GWD (1996); Spurgeon (2002)
Other activities on mangroves in AfricaMangrove protection and conservation projects have also been carried out in Liberia (SSNC, 2006). One project involved afforestation of 1.5 hectares of mangroves. A similar project was carried out in Eritrea, where 700,000 mangrove seedlings were planted along the coastline (Sato et al., 2005). Initial attempts of reforestation were also made in Senegal in 2008, where 6.2 million seedlings were planted (VPI, 2008).

Page
32
Economic analysis of mangrove forests: A case study in Gazi Bay, Kenya
H . CONCLUSIONS AND RECOMMENDATIONS
As a relatively new area of study in Africa, further research is necessary to confirm the results derived in this study. While BT is easily applicable it does not determine the value of the specific ecosystem conclusively. The following recommendations refer to each quantified mangroves good or service and the key points are summarized in Table H1 below. The table also includes the value potential as well as the accuracy assessment of each variable.
I. Studies on the actual contribution of mangroves to fishery are still in their early stages. This study assumes a contribution of about one third to fisheries, considering adjacent contributing ecosystems of sea grasses and coral reefs. It is recommended that the contribution of mangroves to on- and off-shore fishery should be investigated further. In addition a production function-based approach should be integrated into the valuation to estimate how much a given ecosystem service contributes to the delivery of another service or commodity which is traded on an existing market (TEEB, 2010).
II. The value for sustainable wood cutting calculated in this study is assumed to be quite precise. The legislations for cutting wood in the Gazi mangroves are strict and meet the requirements of sustainable harvesting of forestry products. However, unconfirmed sources state that there might be some illegal wood cutting which could affect long-term conservation of the mangroves and also the valuation itself since it constitutes an additional, albeit illegal, source of income.
III. Ecotourism within the Gazi Bay mangroves is less than three years old. The income from the “Gazi Women Boardwalk” was used as a proxy of the tourism value of the mangroves. Lack of data prevents the application of a more sophisticated methodology, such as the “Travel Cost Method” (TC). This study recommends applying the TC method in the future as the number of visiting tourists increases. TC is based on the rationale that recreational experiences are associated with a cost such as direct expenses and opportunity costs of time (TEEB, 2010).
IV. Research and education is one of the most ambiguous variables in the valuation. This study applies the same approach as Kairo et al. (2009) used to value the replanted Rhizophora mucronata plantation using the primary data available. Since quite a few student classes visit the mangroves it is recommended that those numbers should be used to confirm the calculated results. However, this requires the collection of more primary data. An almost similar methodology has been used in Egypt (Spurgeon, 2002).
V. The estimate of the value of the aquaculture industry in Gazi Bay is considered to be accurate since detailed primary data were available. Therefore the value of US$ 4.8 ha-1y-1 is appropriate. Despite this comparably low value the aquaculture industry features great potential for future value appreciation of mangroves services. The juvenile fishes for the ponds are directly taken from the mangroves. Aquaculture is expected to expand production and reduce over-reliance on onshore and offshore fishery.
VI. Apiculture is one of the newest projects established in Gazi Bay. Valuation data were obtained from estimates provided by the responsible personnel in the village. It is necessary to follow-up on the actual production of the hives to confirm the projection identified in this study using the market value approach.
VII. The value of mangroves to shoreline protection is generally stated as one of the most important services. The term shoreline protection itself, however, is ambiguous because it can refer to either protection from soil erosion or protection from severe weather events such as tsunamis and storms. The calculated value of shoreline protection for the Gazi Bay mangroves considers the threat of tsunami hitting the Kenyan coast. It also takes into account the recent eruptions of the Karthala volcano in the Comoros Island. Since this scenario is quite speculative it is recommended that further research on this service should focus on protection from soil erosion which already occurs along the beach in Gazi. In addition the significance of mangroves to shoreline protection from tsunamis is more relevant for Southeast Asia than for Eastern Africa.

Page
33
Economic analysis of mangrove forests: A case study in Gazi Bay, Kenya
VIII. Carbon sequestration is the most prospective service that mangroves provide. This study uses data collected during a reforestation project in 2010. It will be important to conduct more research on the ability of African mangroves to store and absorb carbon dioxide. This could lead to higher awareness of mangroves on the carbon credit market especially when considering such projects as REDD+ and blue carbon.
IX. The non-use values of mangrove services such as biodiversity, existence and option value in this study are estimated by using BT. When applied correctly BT can provide a good starting point to value those non-use services. However, to find more accurate values it is strongly recommended to apply Contingent Valuation Method (CV). CV uses questionnaires to ask people how much they would be willing to pay to increase or enhance the provision of an ecosystem service, or alternatively, how much they would be willing to accept for its loss or degradation (TEEB, 2010).
Table H1 summarizes the results of the analysis and recommendation made for future research on mangroves valuation in Gazi Bay. Such methods can be applied in other mangrove forests in Africa to obtain a good overview of the TEV of this ecosystem.
Source: © Janis Hoberg / UNEP

Page
34
Economic analysis of mangrove forests: A case study in Gazi Bay, Kenya
Table H1: Results of analysis, recommendations and action plan
Good / Service Result in / ha /
year
Assessment of result
Potential Recommendation Action plan
Fisheries US$ 44 Relatively certain
constant Reconsider mangroves
contribution to fishery; introduce
a production function-based
approach
-
Building poles US$ 4 Certain constant - -
Fuel wood US$ 16.8 Certain constant Observe illegal collection
-
Eco-tourism US$ 6.5 Relatively certain
high Apply Travel costs method (TCM)
Promoting trips to Gazi mangroves from Diani
Research & Education
US$ 184.4 RelativelyCertain
high Apply different methodology
Promoting further research
Aquaculture US$ 4.8 Certain high - Expanding a sustainable production
Apiculture US$ 14.7 Uncertain moderate Observe actual production
Expanding production; Provision of fresh water
and flowers
Shoreline protection
US$ 91.7 Very uncertain
very high Apply different methodology
Continuing reforestation and maintaining a
strong mangrove forest
Carbon sequestration
US$ 126 uncertain very high Reconsider carbon price and
sequestration potential
Continuing reforestation
Biodiversity US$ 5 uncertain constant Apply Contingent Valuation (WTP)
Establishing natural reserves
Existence US$ 594.4 uncertain constant Apply Contingent Valuation (WTP)
Creating awareness among locals and
tourists
Option for future generations
- - high Apply Contingent Valuation (WTP)
Creating awareness among locals and
tourists
TOTAL US$ 1,092
Relatively certain
high Confirm results (Apply WTP)
Similar studies can be done in order to obtain
an understanding of the value of mangrove
forest in Africa

Page
35
Economic analysis of mangrove forests: A case study in Gazi Bay, Kenya
APPENDIX
MANGROVES AND THE EMERGING ISSUE OF CLIMATE CHANGE
Introduction
One of the major threats for mangroves and adjacent ecosystems arises from climate change. Scholars differ in their opinion about the actual effects of climate change on mangroves. Obvious factors are a rise of the average sea-level, an increase in storm frequency and other weather phenomena, a general temperature surge and higher carbon dioxide content in the atmosphere. In the following section each of those effects will be examined individually for its impact on mangroves, including statistical prediction data sourced from recent studies.
Sea-level rise
Forecasts for the rise of the ocean’s water level caused mostly by melting glaciers generally differ. The IPCC ran highly sophisticated models in 2007 and came up with an expected rise of 0.22 to 0.44m in 2090 compared to 1990 (IPCC, 2007). Most common mangrove species can only cope with a rise of roughly 10cm in 100 years, which is only a negligible fraction of what most recent studies predict (Coughly, 1994). Local, specific circumstances can lead to different results in certain regions. One can, however, assume a steady rise in sea-level in the next decades. Since mangroves need a specific mixture of sea and fresh water and are only able to endure a certain amount of water coverage, a sea-level rise will inevitably lead to a landward retreat of mangrove forests. Depending on the speed of the rise, slow-growing species will eventually die out while the fast growing species will continue to expand. This will lead to a change in the botanical composition of mangrove forests. If space is available for mangroves to grow inland the effect will be minor, but since coastal areas are highly cultivated and built up space for movements will be curtailed. In that case, sea-level rise can lead to local extirpation of mangroves (Spalding et al., 2010).
Figure 4: Sea-level change 1800-2100
Source: IPCC 2007
500
400
300
200
100
0
-100
-200
Sea
leve
l cha
nge
(mm
)
195019001850
Estimatesof the past
Instrumental record Projectionsof the future
1800 2000 2050 2100Year

Page
36
Economic analysis of mangrove forests: A case study in Gazi Bay, Kenya
Tsunamis and tropical stormsClimate change leads to a change in local weather conditions probably with more extreme weather occurrences. Particularly relevant to the environment of mangroves and adjacent ecosystems are tsunamis and storms. Tsunamis create havoc along entire shorelines leaving dead plants and animals behind. Long-term effects may also include changes in topography, soil salinity and freshwater in-flow from upstream (Kruse, 2005).
Besides an increasing danger of tsunamis, the likelihood of heavy coastal storms caused by climate change is increasing. For example, a study at the eastern Victorian coastline predicts an increase of average wind speeds of about 3% by 2070 (Malcom and McInnes, undated). In the winter season this can increase to 19%, which will severely affect global coastlines, including mangrove ecosystems. Stronger storms, so-called tropical cyclones, will occur more frequently, the maximum wind speed intensity increasing 2-11% by 2100 (Knutson et al., 2010). The rise is mostly caused by higher ocean temperatures that lead to thermal movements causing cyclones and storms.
While the mangrove species can endure moderate storms, more extreme forms will inevitably cause unrecoverable damage that either leaves the mangroves destroyed or requires an enormous amount of financial resources to restore. Studies indicate that storm surges even have an influence on the earlier discussed issue of sea-level rise. The influence can be expressed with the following formula (Flather and Williams, 2005):
Sea-level rise = mean sea-level + tide + storm surges + interactions
This relationship introduces questions about how the effects of climate change are intertwined and how this will change former predictions of the individual effects. Since most of the models of climate change are partly speculative the chances are that the actual impacts will be more extreme than moderate models predict.
Temperature surge
Global temperature rise is one of the major issues of climate change. It is fundamental to this phenomenon and hence demands detailed observation. 2010 was recorded as the hottest year since the start of recording in 1880 (Hansen, 2011). The distribution of mangroves is very sensitive to the surrounding temperature. There are certain seasonal limits which the temperature must not exceed if further mangrove growth is to be encouraged (Pernetta et al., 1994). Even many animal and plant species in the mangroves are sensitive to rapid changes. Thus, an unusual temperature rise could lead to their immediate extinction. However, there might be other species whose physical capabilities are more suited to living in this hotter climate. Those species will eventually take over and create a new ecosystem themselves. This includes marine and coastal animals as well as species of plants. As mentioned earlier, the effects of climate change are usually strongly interlinked and work as catalysts for each other. The same paradigm is valid for an atmospheric temperature rise which exacerbates the likelihood of storms and ocean temperature. This should create sensitivity when it comes to modeling climate change.
Source: © Janis Hoberg / UNEP
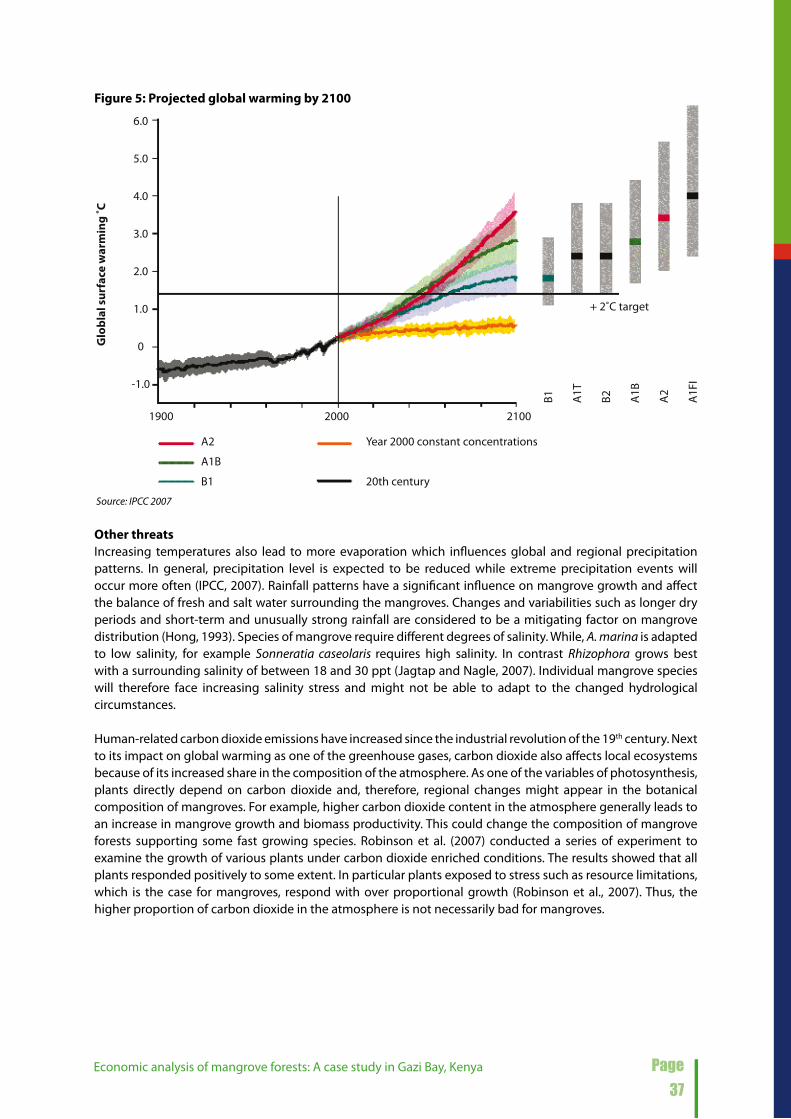
Page
37
Economic analysis of mangrove forests: A case study in Gazi Bay, Kenya
Glo
blal
sur
face
war
min
g ˚C
1900 2000
+ 2˚C target
A2
A1B
B1
Year 2000 constant concentrations
20th century
2100
6.0
5.0
4.0
3.0
2.0
1.0
0
-1.0
B1 A1T
B2 A1B
A2
A1F
I
Figure 5: Projected global warming by 2100
Source: IPCC 2007
Other threatsIncreasing temperatures also lead to more evaporation which influences global and regional precipitation patterns. In general, precipitation level is expected to be reduced while extreme precipitation events will occur more often (IPCC, 2007). Rainfall patterns have a significant influence on mangrove growth and affect the balance of fresh and salt water surrounding the mangroves. Changes and variabilities such as longer dry periods and short-term and unusually strong rainfall are considered to be a mitigating factor on mangrove distribution (Hong, 1993). Species of mangrove require different degrees of salinity. While, A. marina is adapted to low salinity, for example Sonneratia caseolaris requires high salinity. In contrast Rhizophora grows best with a surrounding salinity of between 18 and 30 ppt (Jagtap and Nagle, 2007). Individual mangrove species will therefore face increasing salinity stress and might not be able to adapt to the changed hydrological circumstances.
Human-related carbon dioxide emissions have increased since the industrial revolution of the 19th century. Next to its impact on global warming as one of the greenhouse gases, carbon dioxide also affects local ecosystems because of its increased share in the composition of the atmosphere. As one of the variables of photosynthesis, plants directly depend on carbon dioxide and, therefore, regional changes might appear in the botanical composition of mangroves. For example, higher carbon dioxide content in the atmosphere generally leads to an increase in mangrove growth and biomass productivity. This could change the composition of mangrove forests supporting some fast growing species. Robinson et al. (2007) conducted a series of experiment to examine the growth of various plants under carbon dioxide enriched conditions. The results showed that all plants responded positively to some extent. In particular plants exposed to stress such as resource limitations, which is the case for mangroves, respond with over proportional growth (Robinson et al., 2007). Thus, the higher proportion of carbon dioxide in the atmosphere is not necessarily bad for mangroves.
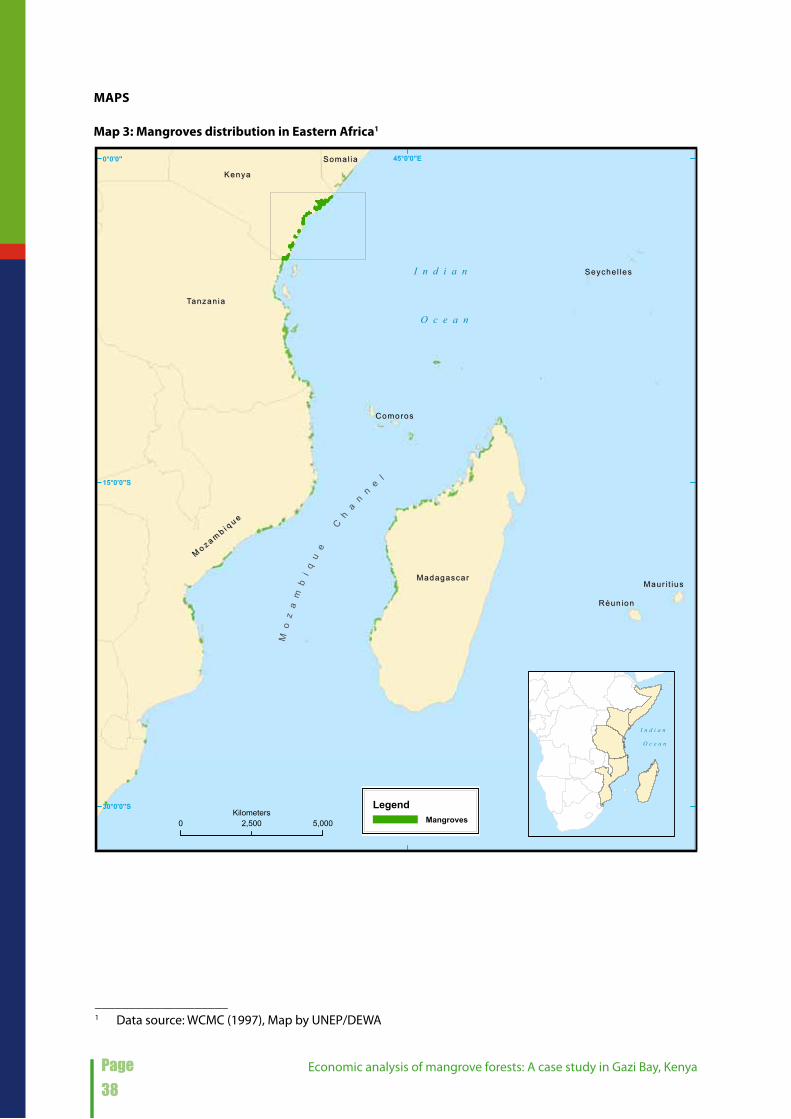
Page
38
Economic analysis of mangrove forests: A case study in Gazi Bay, Kenya
MAPS
Map 3: Mangroves distribution in Eastern Africa1
____________________1 Data source: WCMC (1997), Map by UNEP/DEWA
I n d i a n
O c e a n
Mo
za
mb
iq
ue
Ch
an
ne
l
MadagascarMadagascar
M o z a m b i qu e
M o z a m b i qu e
TanzaniaTanzania
KenyaKenya
RéunionRéunion
Maur i t iusMaur i t ius
ComorosComoros
Seychel lesSeychel les
Somal iaSomal ia 45°0'0"E0°0'0"
15°0'0"S
30°0'0"S LegendMangroves
I n d i a n
O c e a n
0 5,0002,500Kilometers

Page
39
Economic analysis of mangrove forests: A case study in Gazi Bay, Kenya
Map 4: Mangroves distribution in Kenya1
____________________1 Data source: WCMC (1997), Map by UNEP/DEWA
Funzi Bay
!.
!.
!.
!.
!.
MombasaMombasa
KwaleKwale
KilifiKilifi
MalindiMalindi
LamuLamu
GarsenGarsen!.
Mida Creek
G a l a n a
T a n a
Tana River Delta
C o a s t
P r o v i n c e
C o a s t
P r o v i n c e
N o r t h E a s t e r n
P r o v i n c e
N o r t h E a s t e r n
P r o v i n c e
Pate Islands
Indian Ocean
Gazi Bay LegendRiverMinor RiverMangroves0 50
KilometersTanzania
Uganda Somalia
Ethiopia
Indian Ocean
Kenya

Page
40
Economic analysis of mangrove forests: A case study in Gazi Bay, Kenya
REFERENCES
Abeysinghe P, 2010 . Antibacterial activity of some medicinal mangroves against antibiotic resistant pathogenic bacteria. Indian J Pharm Sci 2010;72:167-72
Aburto-Oropeza O, 2008. Mangroves in the Gulf of California increase fishery yields, PNSA Vol. 150 no. 30
Bann C, 1997. An economic analysis of Alternative Mangrove Management Strategies in Koh Kong Province, Cambodia, EEPSEA RESEARCH REPORT SERIES, http://203.116.43.77/publications/research1/ACF46.html (accessed 4 April 2011)
Barbier E, Koch E, Silliman B, Hacker S, Wolanski E, Primavera J, Granek E, Polaski S, Aswani S, Cramer L, Storms D, Kennedy C, Bael D, Kappel C, Perillo G and Reed D, 2008. Coastal ecosystem-based management with nonlinear ecological functions and values. Science Magazine Vol. 319 p. 321-323
Bouillon S, Borges A, Castaneda-Moya E, Diele K, Dittmar T, Duke N, Kristensen E, Lee S, Marchand C, Middelburg J, Rivera-Monroy V, Smith T, Twilley R, 2008. Mangroves production and carbon sink: A revision of global budget estimates, Global biochemical cycles, vol. 22, GB2013, doi: 10.1029/2007GB003052
Coughly, 1994. Climate impacts on mangrove ecosystems. Conservation of mangrove forest genetic resources. M. S. Swaminathan Research Foundation, Chennai, India 39-44:487 p
Crabbe M, 2009. Climate Change and tropical marine agriculture, Journal of Experimental Botany 2009; 60(10):2839-44.
Dahdouh-Guebas F, 2006. Mangrove forests and tsunami protection, www.vliz.be/imisdocs/publications/115329.pdf (accessed 4 April 2011)
Das S and Vincent J, 2008. Mangroves protected villages and reduced death toll during Indian super cyclone, PNAS May 5, 2009 vol. 106 no. 18: 7357-7360
Deghani M, Farshchi P, Danekar A, Karami M and Aleshikh A, 2010. Recreation value of Hara Biosphere Reserve using Willingness-to-pay method, Int. J. Environ. Res., 4(2):271-280, Spring 2010
EJF, 2006. Mangroves: Nature’s defence against tsunamis – A report on the impact of mangrove loss and shrimp farm development on coastal defences. Environmental Justice Foundation (EJF), London, UK. www.ejfoundation.org (accessed 30 March 2011)
FAO, 2007. The World’s Mangroves 1980-2005, FAO Forestry Paper 153. Food and Agriculture Organization of the United Nations. http://www.fao.org/docrep/010/a1427e/a1427e00.htm (accessed 30 March 2011)
Fishstat+ 2010, Capture production 1950-2008, Released December 2010. FAO. http://www.fao.org/fishery/statistics/software/fishstat/en (accessed 30 March 2011)
Flather and Williams, 2005. Climate change effects on storm surges: Methodologies and results, CCMSProudman Oceanographic Laboratory Bidston Observatory, Bidston Hill, Prenton CH43 7RA, Cheshire, U.K
Ghani A, 2006. Economic valuation of ecosystem services in Malaysia, presentation: University Putra Malaysia, http://www.jst.go.jp/asts/asts_m/files/0311pdf/09_Seminar_ASTS_Penang_10-14_March_2006_Awang_Noor.pdf (accessed 31 March 2011)
Giri C, Ochieng E, Tieszen L, Zhu Z, Singh A, Loveland T, Masek J and Duke J . 2010, Status and distribution of mangrove forests of the world using observation satellite data, Global Ecology and Biogeography Volume 20, Issue 1, pages 154–159, January 2011
GWD, 1996. Lower Volta Mangrove project: Phase 1: assessment of environmental, economic and social factors. Ghana Wildlife Department (GWD) / Department For International Development (WNAD), www.odi.org.uk/work/projects/98-99-tropical-forestry/projects/2276.htm (accessed 30 April 2011)
Hansen, 2011. NASA research finds 2010 tied for warmest year on record, NASA Earth Science News Team, http://climate.nasa.gov/news/index.cfm?FuseAction=ShowNews&NewsID=467
Hartnady C, 2005. Tsunami potential on East African coast, Western Indian Ocean island states, Disaster Reduction in Africa - ISDR Informs, Issue 5/July 2005. http://www.unisdr.org/files/8554_Issue52005englishISDRinforms1.pdf (accessed 20 April 2011)
Hinrichsen D, 1998. Coastal Waters of the World: Trends, Threats, and Strategies. Washington D.C. Island Press, 1998

Page
41
Economic analysis of mangrove forests: A case study in Gazi Bay, Kenya
Hong, 1993. Mangroves of Vietnam, The IUCN Wetland Programme Bangkok Thailand
IMF, 2010. World Economic Outlook 2010, International Monetary Fund, www.imf.org
IPCC, 2007. IPCC Fourth Assessment Report: Climate Change 2007, Working Group I. IPCC, www.ipcc.ch (accessed 23 March 2011)
Jagtap and Nagle, 2007. Response and adaptability of mangrove habitats from Indian subcontinent to climate change, Indian National Institute of Oceanography Ambio. 2007 Jun; 36(4):328‐3
Kairo J and Lang’at J . 2008, Conservation and management of mangrove forests in Kenya, Kenya Marine and Fisheries Research Institute. http://www.wrm.org.uy/countries/Africaspeaks/Conservation_and_managemen_mangrove_Kenya.pdf (accessed 23 March 2011)
Kairo J, Twaha M, Bosire J, Spring N, Huxham M, Skov M and Mencuccini M, 2010. Mangroves restoration in Gazi Bay, Kenya, Tidal forests of Kenya team, http://www.planvivo.org/wp-content/uploads/gazi_pin_PlanVivo_Kenya.pdf (accessed 23 March 2011)
Kairo J, Wanjiru C and Ochiewo J, 2009. Net Pay: Economic analysis of a Replanted Mangrove Plantation in Kenya. Journal of Sustainable Forestry, 28:(3):395 — 414
KBS, 2010. Economic Survey Kenya 2009, Kenya Bureau of Statistics, Nairobi, Kenya
Kirui K, 2007. Biodiversity and recovery of ecosystem function in replanted mangroves in Gazi Bay, Kenya, Western Indian Ocean Marine Science Association WIOMSA/MARG I No. 2007–03. 33 pp
Knutson T, McBride J, Chan J, Emmanuel K, Holland G, Landsea C, Held I, Kossin J, Srivastava A and Sugi M . 2010, Tropical Cyclones and climate change, Nature Geoscience 3: 157 – 163
Kruse M, 2005. Rehabilitation of tsunami affected mangroves needed, Food and Agriculture Organization of the United Nations, www.fao.org/newsroom/en/news/2005/89119/index.html (accessed 30 March 2011)
Leong F, 1999. Economic valuation of the mangrove forests in Kuala Selangor, Malaysia, Unpublished master’s thesis, University of Malaya, Malaya, Malaysia (accessed 23 March 2011)
Maina G, Obura D, Alidina H and Munywoki B, 2008. Increasing catch in an overexploited reef fishery: Diani-chale, Kenya, from 1998-2006, Cordio Status report 2008, Cordio East Africa. http://www.cordioea.org/storage/status-report-2008-papers/6.03%20MAINA%20ET%20AL%202008.pdf (accessed 7 April 2011)
Malcom and McInnes, undated. The effect of climate change on storm surges along the eastern Victorian coastline, CSIRO Marine and Atmospheric Research, http://www.vcc.vic.gov.au/coasttocoastproceedings/MALCOLM_Duncan_McINNES_Kathy_paper.pdf
Morse-Jones, S ., Turner, R .K ., Luisetti, T . and B . Fisher, 2011. Ecosystem valuation: some principles and a partial application, Environmetrics 22 (5):597-698
Ngunjiri C, undated. Tsunami and seismic activity in Kenya, Kenya Meteorological Department, www.seis.nagoya-u.ac.jp/kimata/jica/ngunjiri.pdf (accessed 7 March 2011)
Pernetta J, Leemans R, Elder D, and Humphrey S, (eds) 1994. Impacts of climate change on ecosystem and species: Marine and coastal ecosystems. A Marine Convseration and Development Report, IUCN, Gland, Switzerland. Vii+108pp
Robinson A, Robinson N and Soon W, 2007. Environmental effects of increased atmospheric carbon dioxide, Journal of American physician and surgeons 12:79-90
Roennbaeck P, 1999. The ecological basis for economic value of seafood production supported by mangrove ecosystems, Ecological Economics 29 (1999) 235-252
Ruitenbeek H, 1992. Mangrove management: An economic analysis of management options with a focus on Bituni Bay, Irian Jaya, Environmental Management Development in Indonesia Project (EMDI), EMDI Environmental Reports 8. http://www.island.net/~hjr/Bint_tex.pdf (accessed 7 March 2011)
Sathirathai S and Barbier E, 2001. Valuing mangrove conservation Southern Thailand, Contemporary Economic Policy Vol. 19 No. 2, April 2001
Sathirathai S, 1995. Economic valuation of mangroves and the role of local communities in the conservation of natural resources: Case Study of Surat Thani, South of Thailand, EEPSEA Research Report Series

Page
42
Economic analysis of mangrove forests: A case study in Gazi Bay, Kenya
Sato G, Fisseha A, Gebrekiros S, Karim H, Negassi S, Fischer M, Yemane E, Teclemariam J and Riley R . 2005, A novel approach to growing mangroves on the coastal mudflats of Eritrea with the potential for relieving regional poverty and hunger, Wetlands Vol. 25 No. 3, pp 776-779
Spalding M, Kainuma M, Collins L . 2010, World Atlas of Mangroves, World Atlas of Mangroves, 1. Edition, Earthscan, London 2010. 199 pp
Spalding M, Kalnuma M and Collins L . 2010, World Atlas of Mangroves. Earthscan. London, Washinton, DC. xv+319pp
Spurgeon G, 2002. Socio-economic assessment and economic valuation of Egypt’s mangroves, FAO Consultancy Report, TCP/EGY/0168 (A). ftp://ftp.fao.org/docrep/fao/007/ae212e/ae212e00.pdf (accessed 7 March 2011)
SSNC . 2006, Promotion of Mangrove Protection and Conservation in the Proposed Lake Piso Nature Reserve in NW Liberia, Farmers Associated to Conserve the Environment (FACE); Swedish Society for Nature Conservation (SSNC), www.mangrove-africa.net/Liberia_SSNC_2008.doc (accessed 20 March 2011
TEEB, 2010. The Economics of Ecosystems and Biodiversity: Ecological and Economic Foundations, Edited by Pushpam Kumar, Earthscan, London and Washington
UNEP 2009. Transboundary Diagnostic Analysis of Land-based Sources and Activities affecting the Western Indian Ocean Coastal and Marine Environment, UNEP Nairobi, Kenya 378P http://www.unep.org/NairobiConvention/docs/UNEP(DEPI)_EAF_CP_6_INF_6_Transboundary%20Diagnostic%20Analysis%20of%20Land-based%20Sources%20and%20Activities.pdf (accessed 4 April 2011)
UNEP/GPA, 2003. The economic valuation of alternative uses of mangrove forests in Sri Lanka, Report prepared by Dr. B.M.S Batagoda ,The Global Programme of Action for the Protection of the Marine Environment from Landbased Activities, GPA Coordination Office, The Netherlands. Earthprint.com
UNEP-WCMC, 2006. In the front line: Shoreline protection and other ecosystem services from mangroves and coral reefs, UNEP – WCMC, Cambridge, UK 33 pp. http://www.unep.org/pdf/infrontline_06.pdf (accessed 23 March 2011)
VPI . 2008, Reforestation in Senegal Village Projects International. http://www.villageprojectsint.org/mangrove_reforestation_senegal.html (accessed 20 April 2011)
Walters, Roennbaeck, Kovacs, Crona, Hussain, Badola, Primavera, Barbier and Dahdouh-Guebas, 2008. Ethnobiology, socio-economics and management of mangrove forests: A review, Aquatic Botany 89 (2008) 220-236
World Bank. 2011, Data: Indicators: GNI per capita, PPP (current international $), The World Bank 2011 htp://data.worldbank.org/indicator/NY.GNP.PCAP.PP.CD (accessed 6 April 2011)
Interviews conducted in March 2011:I Myanchoka – Lab technician, Kenya Marine and Fisheries Research Institute (KMFRI)II Dr. Kairo – Mangroves Management Consultant , Senior Research Officer for KMFRIIII Beach Management Unit Gazi VillageIV Wanjiru – Researcher , School of Biological and Physical Sciences, University of NairobiV Shikeli – Concessionaire of wood harvest in the Gazi mangrovesVI Hamsa – Gazi Women Boardwalk Management

Page
43
Economic analysis of mangrove forests: A case study in Gazi Bay, Kenya
Page
44
Economic analysis of mangrove forests: A case study in Gazi Bay, Kenya
Economic Analysisof Mangrove Forests:
A case study in Gazi Bay, Kenya
Job Number: DEW/1230/NAISBN: 978-92-807-3187-3
United Nations Environment ProgrammeP.O. Box 30552 - 00100 Nairobi, Kenya
Tel.: +254 20 762 1234Fax: +254 20 762 3927
e-mail: [email protected]
www.unep.org
. . . . . . . . . . . . . . . . . . . . . . . . . . . . . . . . . . . . . . . . . . . . . . . . . . . . . . . . .
The report features a detailed economic analysis of the mangrove forest in Gazi Bay, Kenya. It promotes the ecosystem as a valuable source of income for the local community. The results and methods can be applied to other sites in Africa in order to determine the importance of including the coastal forest into national accounts. Local policymakers are encouraged to consider the non-marketable services of mangroves when making decisions on coastal land use, especially at this time when we are experiencing increasing pressure on marine ecosystems due to population growth, land conversion and climate change.