Embed Size (px)
Citation preview
Easy Analysis of Traffic Bottlenecks
Michael Dannehy
©2014 TomTom North America, Inc.
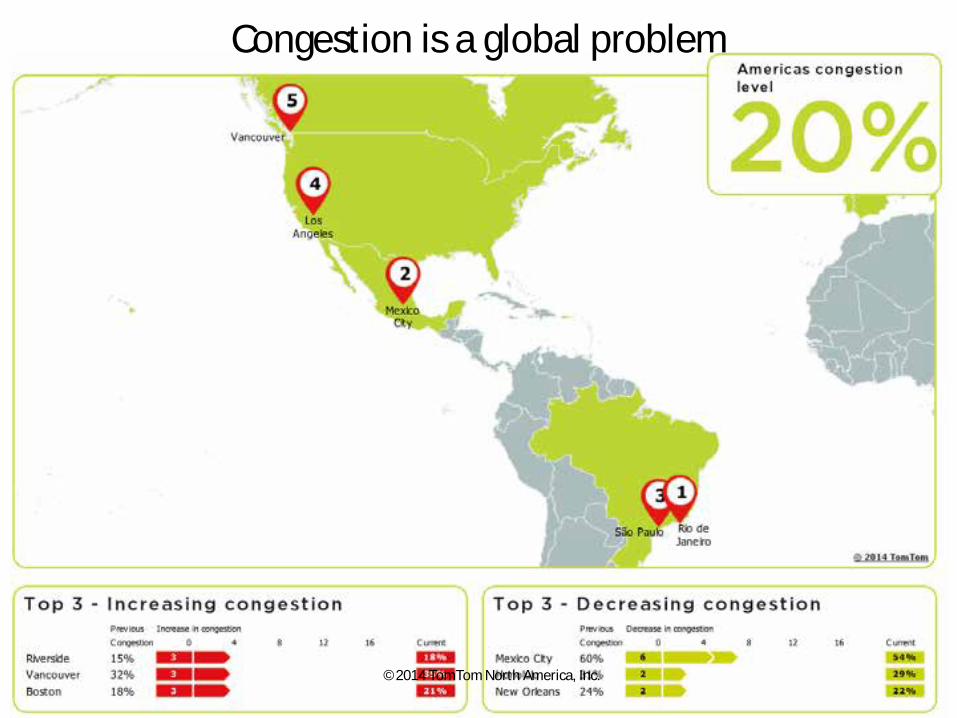
Congestion is a global problem
©2014 TomTom North America, Inc.
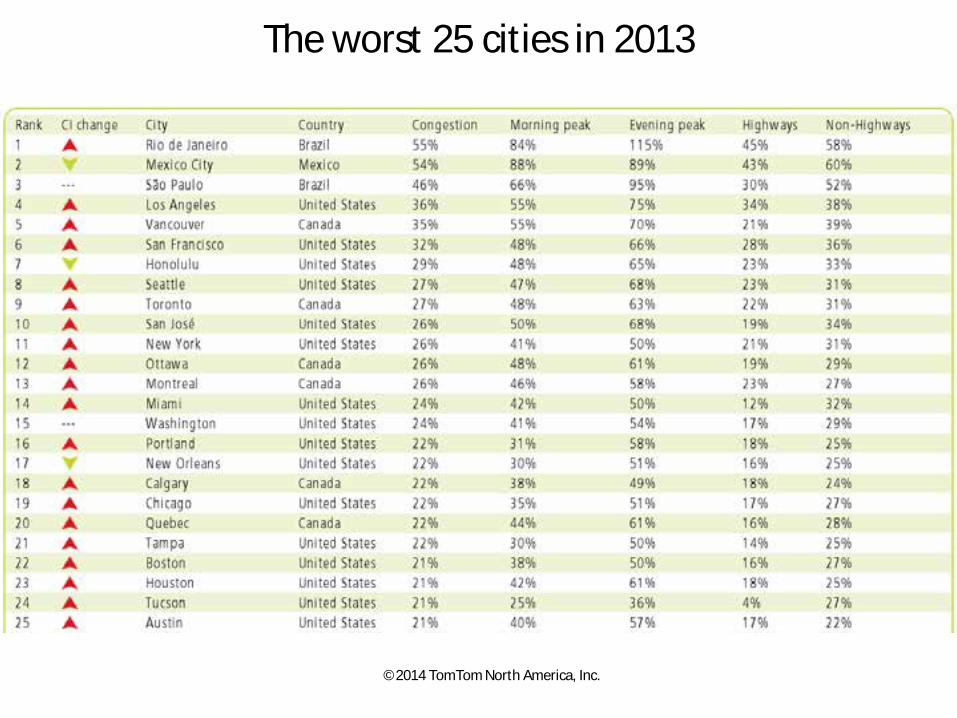
The worst 25 cities in 2013
©2014 TomTom North America, Inc.
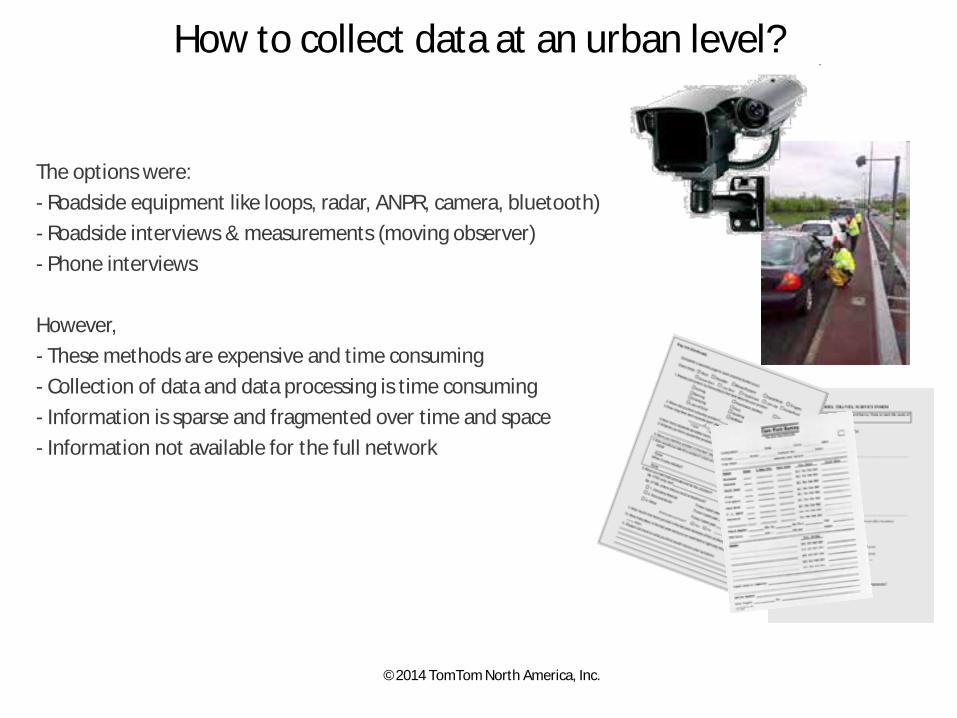
How to collect data at an urban level?
The options were: - Roadside equipment like loops, radar, ANPR, camera, bluetooth) - Roadside interviews & measurements (moving observer) - Phone interviews However, - These methods are expensive and time consuming - Collection of data and data processing is time consuming - Information is sparse and fragmented over time and space - Information not available for the full network
©2014 TomTom North America, Inc.
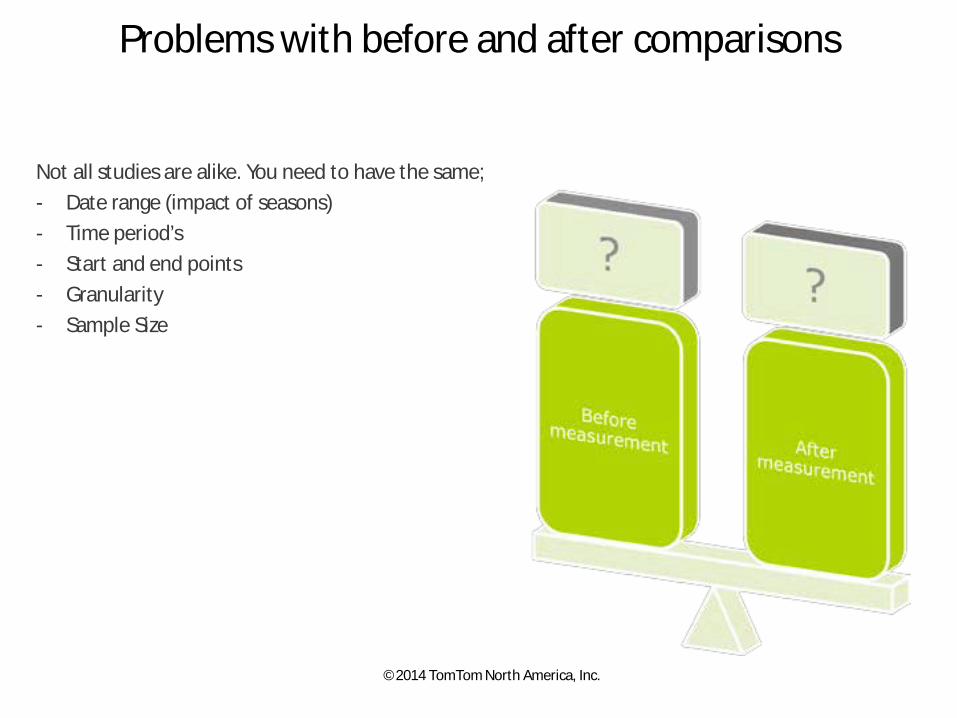
Not all studies are alike. You need to have the same; - Date range (impact of seasons) - Time period’s - Start and end points - Granularity - Sample Size
Problems with before and after comparisons
©2014 TomTom North America, Inc.
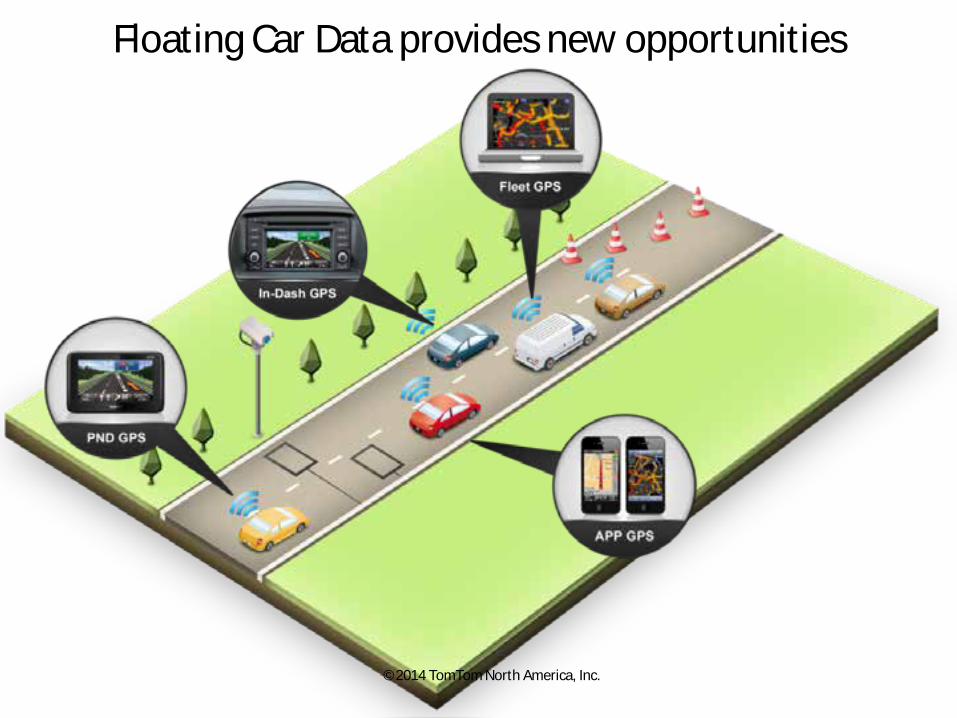
Floating Car Data provides new opportunities
©2014 TomTom North America, Inc.
©2014 TomTom North America, Inc.
Analysis Example: Amsterdam
8 ©2014 TomTom North America, Inc.
Example analysis for Amsterdam
Where: Amsterdam When: Q1 2014 What: Analyze speeds in the Morning Rushhour (06:00 – 09:00) and compare these to the speeds driven during the night (00:00 – 05:00) Purpose: identify the worst bottlenecks in the Amsterdam road network
©2014 TomTom North America, Inc.
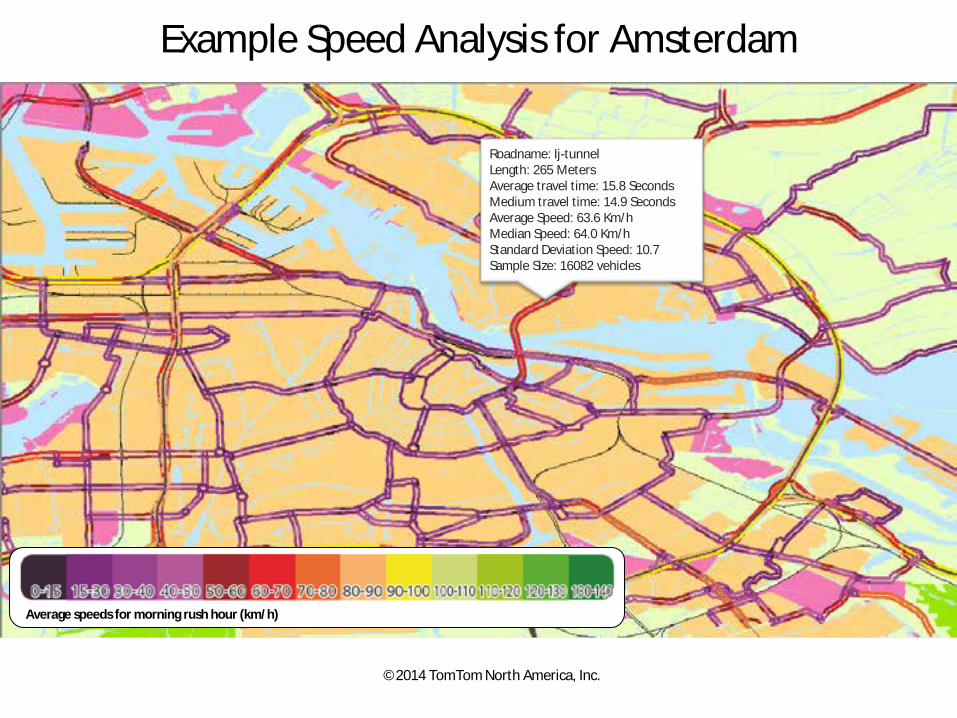
Example Speed Analysis for Amsterdam
Roadname: Ij-tunnel Length: 265 Meters Average travel time: 15.8 Seconds Medium travel time: 14.9 Seconds Average Speed: 63.6 Km/h Median Speed: 64.0 Km/h Standard Deviation Speed: 10.7 Sample Size: 16082 vehicles
Average speeds for morning rush hour (km/h)
©2014 TomTom North America, Inc.
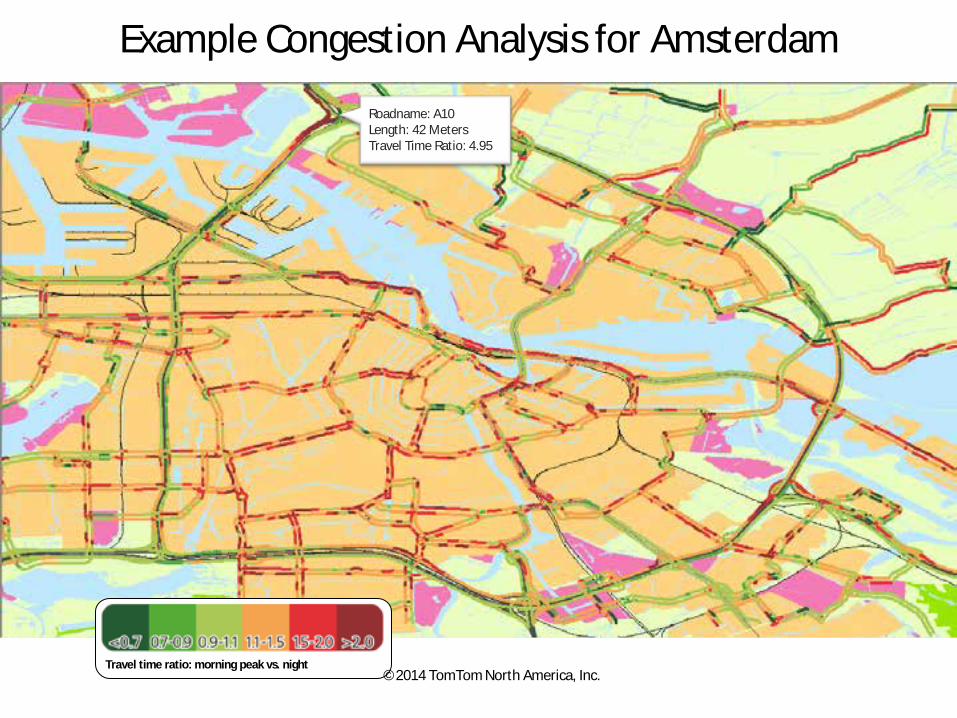
Example Congestion Analysis for Amsterdam
Travel time ratio: morning peak vs. night
Roadname: A10 Length: 42 Meters Travel Time Ratio: 4.95
©2014 TomTom North America, Inc.
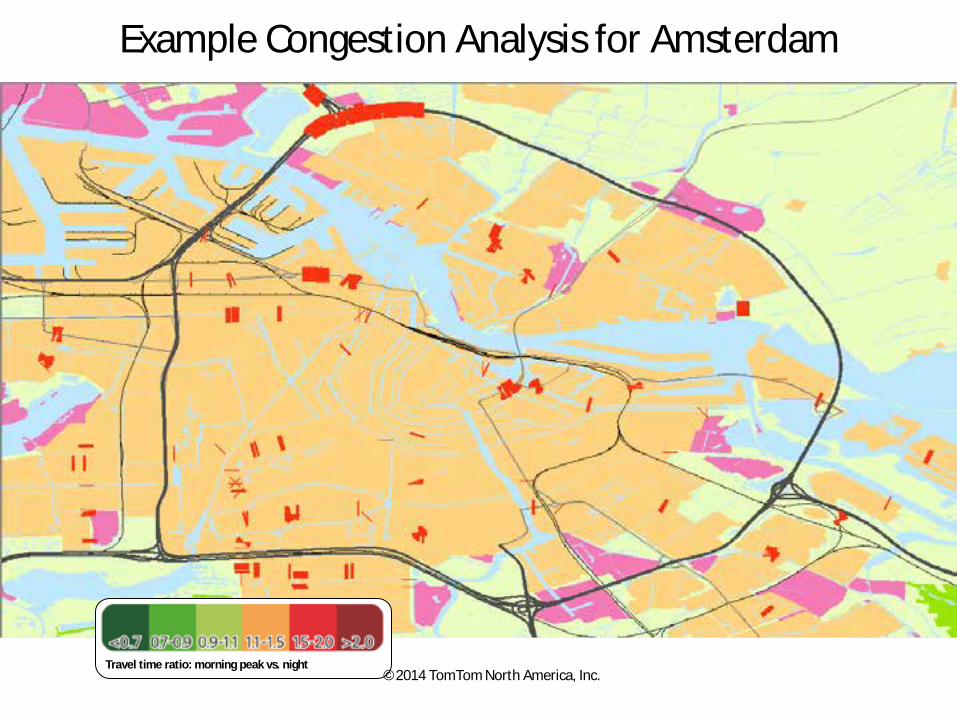
Example Congestion Analysis for Amsterdam
Travel time ratio: morning peak vs. night ©2014 TomTom North America, Inc.
Analysis Example Italy
13 ©2014 TomTom North America, Inc.
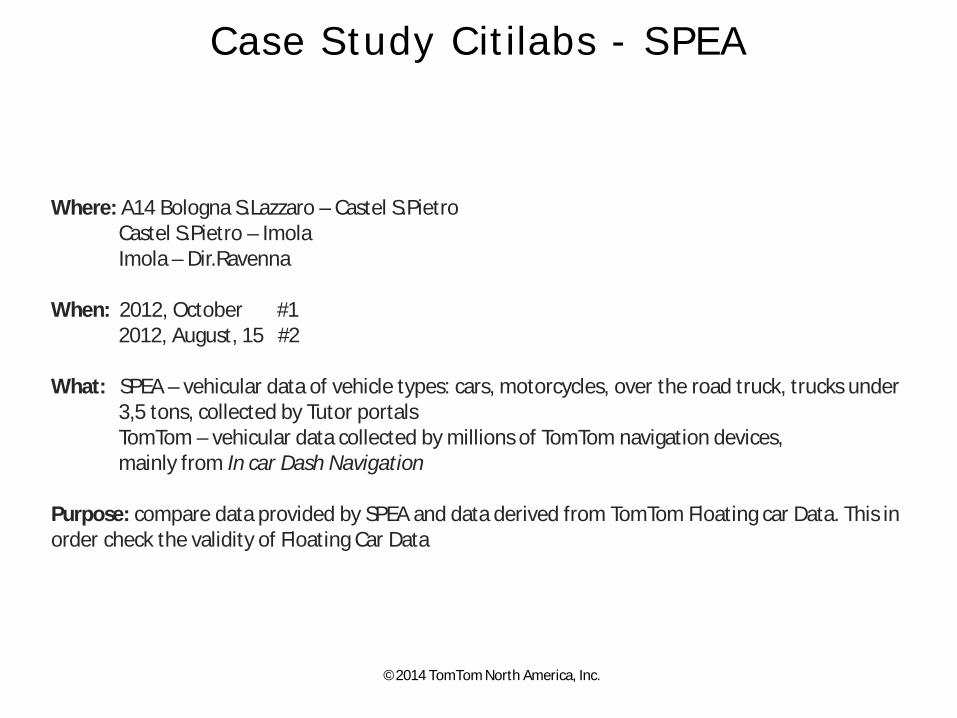
Case Study Citilabs - SPEA
Where: A14 Bologna S.Lazzaro – Castel S.Pietro Castel S.Pietro – Imola Imola – Dir.Ravenna When: 2012, October #1 2012, August, 15 #2 What: SPEA – vehicular data of vehicle types: cars, motorcycles, over the road truck, trucks under 3,5 tons, collected by Tutor portals TomTom – vehicular data collected by millions of TomTom navigation devices, mainly from In car Dash Navigation Purpose: compare data provided by SPEA and data derived from TomTom Floating car Data. This in order check the validity of Floating Car Data
©2014 TomTom North America, Inc.
©2014 TomTom North America, Inc.
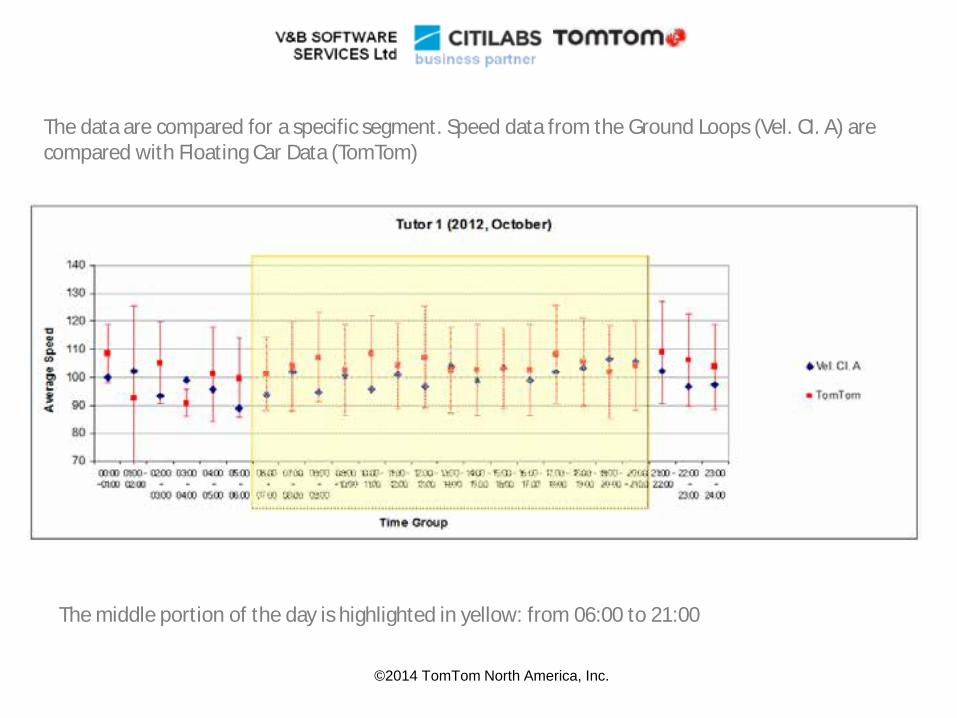
The data are compared for a specific segment. Speed data from the Ground Loops (Vel. CI. A) are compared with Floating Car Data (TomTom)
The middle portion of the day is highlighted in yellow: from 06:00 to 21:00
©2014 TomTom North America, Inc.
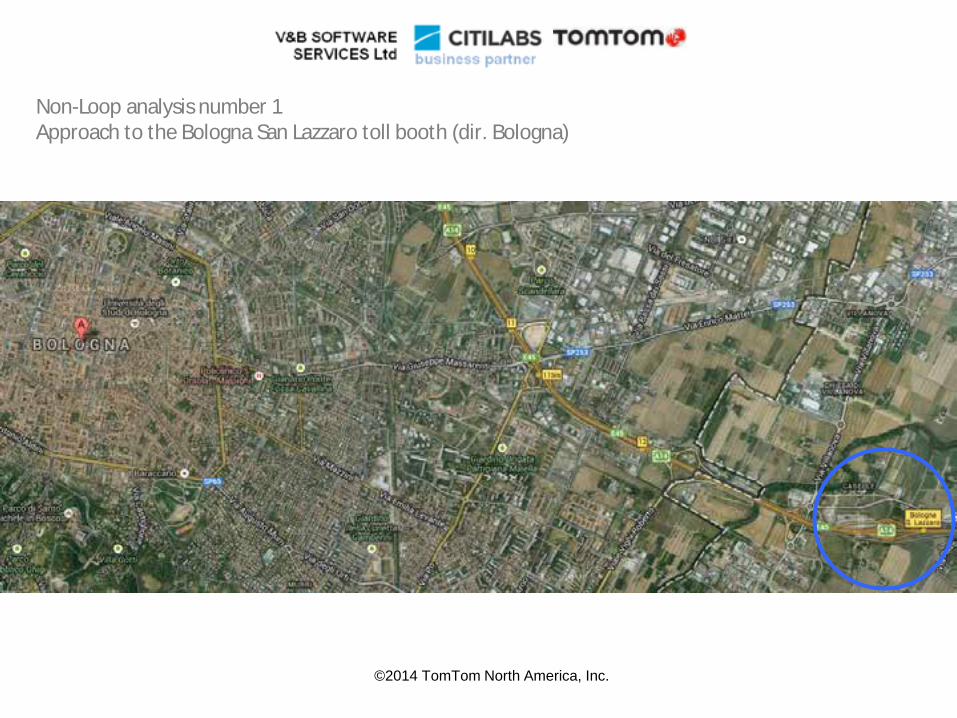
Non-Loop analysis number 1 Approach to the Bologna San Lazzaro toll booth (dir. Bologna)
©2014 TomTom North America, Inc.
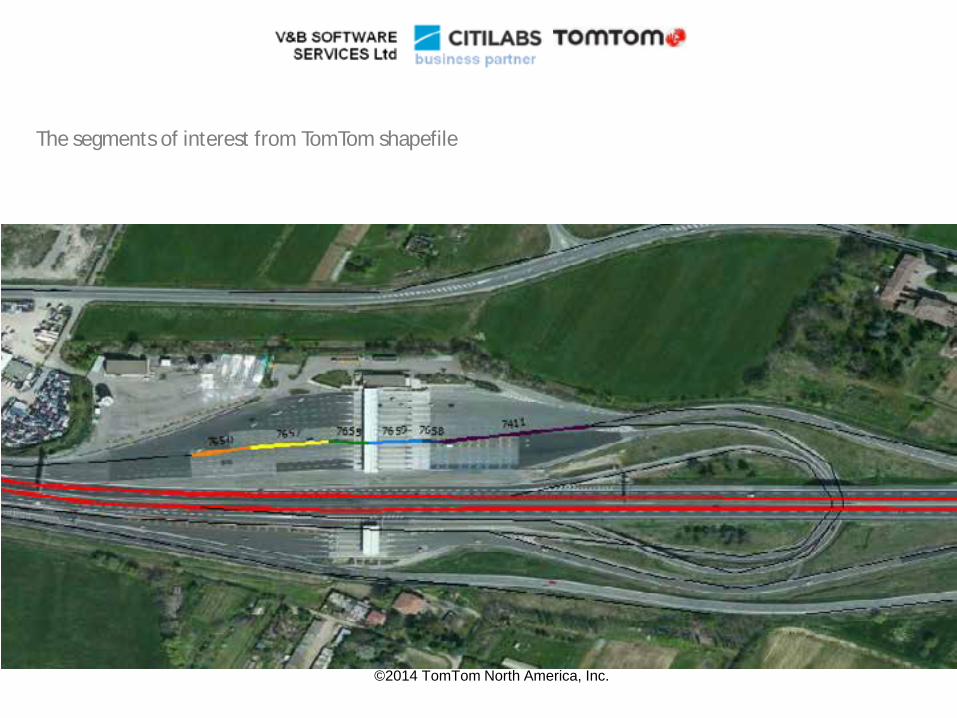
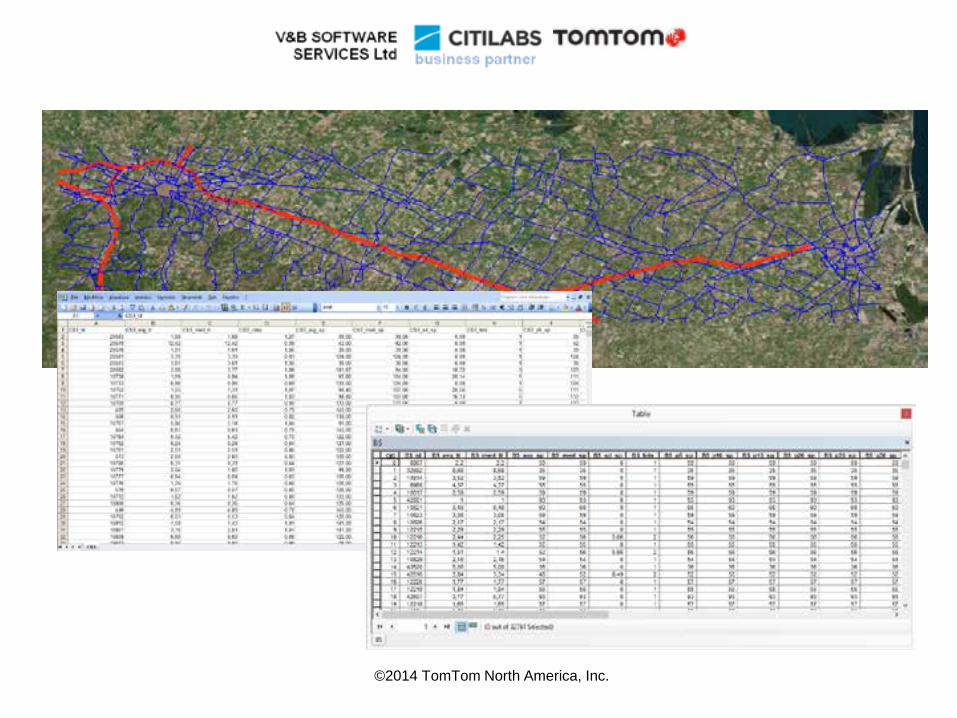
The segments of interest from TomTom shapefile
©2014 TomTom North America, Inc.
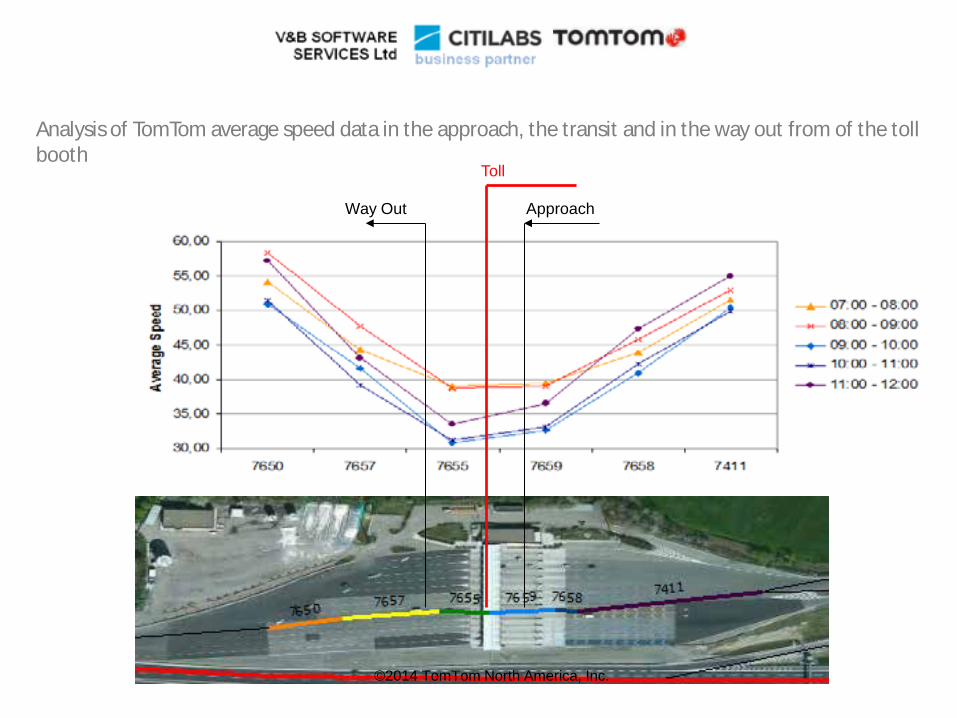
Analysis of TomTom average speed data in the approach, the transit and in the way out from of the toll booth
Toll
Approach Way Out
©2014 TomTom North America, Inc.
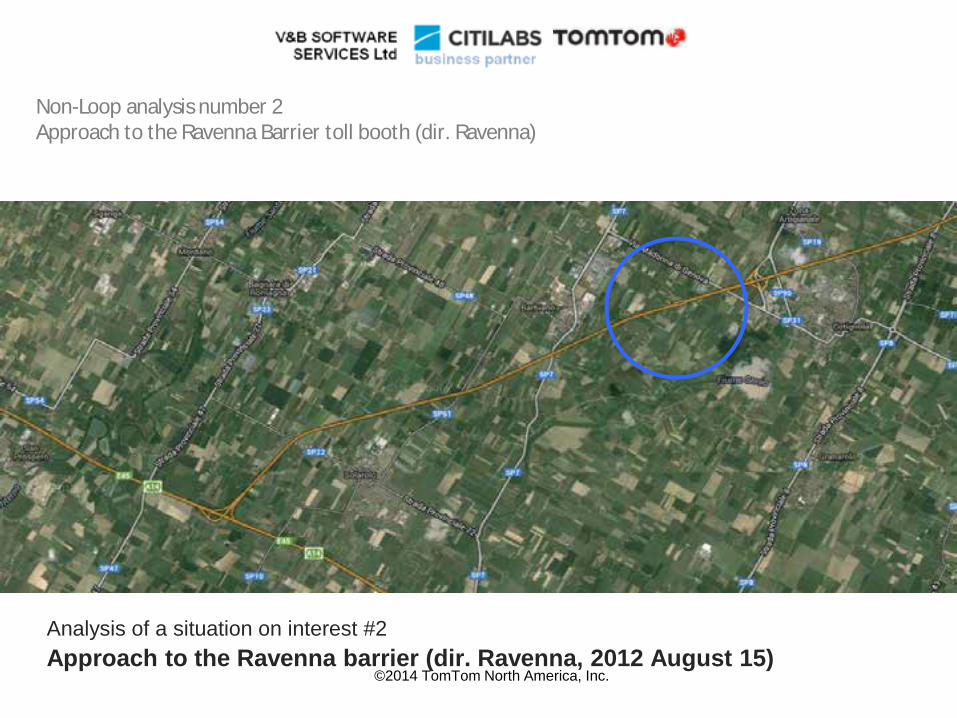
Analysis of a situation on interest #2 Approach to the Ravenna barrier (dir. Ravenna, 2012 August 15)
Non-Loop analysis number 2 Approach to the Ravenna Barrier toll booth (dir. Ravenna)
©2014 TomTom North America, Inc.
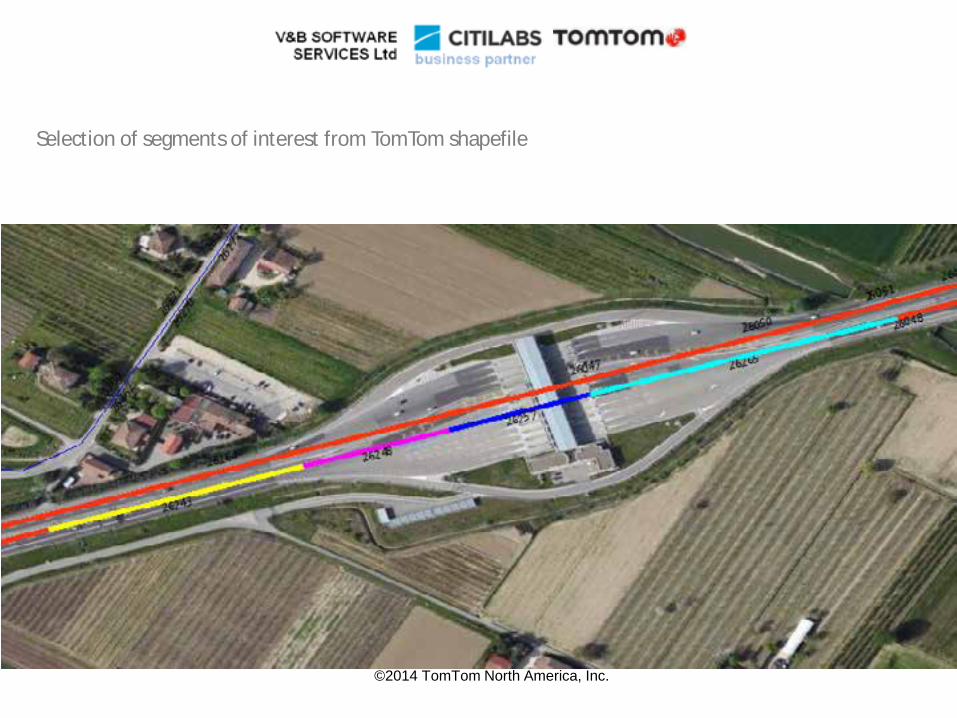
Selection of segments of interest from TomTom shapefile
©2014 TomTom North America, Inc.
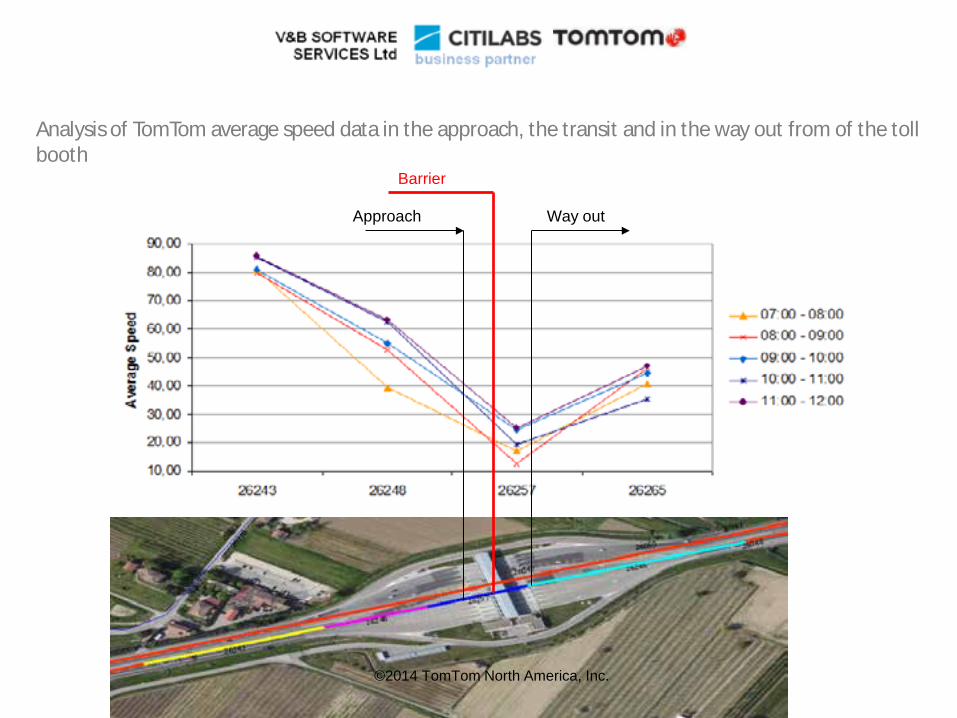
Barrier
Approach Way out
Analysis of TomTom average speed data in the approach, the transit and in the way out from of the toll booth
©2014 TomTom North America, Inc.
Questions?
23 ©2014 TomTom North America, Inc.


![How to be a RESPECTABLE traffic engineer [5 easy steps]](https://img.dokumen.tips/doc/110x75/55c33493bb61eba2218b46ba/how-to-be-a-respectable-traffic-engineer-5-easy-steps.jpg)