Embed Size (px)
Citation preview

EA/Studio 1.5
Evaluation Guide A guide to getting started with EA/Studio
Embarcadero Technologies, Inc. 100 California Street, 12th floor
San Francisco, CA 94111 Tel. 415.834.3131 Fax 415.434.1721
www.embarcadero.com

COPYRIGHT
Under the copyright laws, this documentation may not be copied, photocopied, reproduced, translated, or reduced to any electronic medium or machine readable form, in whole or in part, without the prior written consent of Embarcadero Technologies, Incorporated.
© Copyright 2007
Embarcadero Technologies, Inc. 100 California Street, 12th Floor San Francisco, CA 94111
All rights reserved. Printed in the United States.
Embarcadero, and EA/Studio Business Modeler Edition are trademarks of Embarcadero Technologies Inc. All other marks are property of their respective owners.

Contents
Introduction to Embarcadero’s EA/Studio .....................................................................................................1 Product Benefits by Audience ........................................................................................................1
About This Evaluation Guide.........................................................................................................................2 Session 1: Getting Started with EA/Studio....................................................................................................3 Session 2: Understanding the EA/Studio Infrastructure ...............................................................................4
Using the Model View.....................................................................................................................9 Session 3: Creating a Business Process Model Diagram ............................................................................9
Creating Elements in the Diagram View.........................................................................................9 Aligning in the Diagram View .........................................................................................12 Grouping Elements in the Model View...........................................................................12 Filtering...........................................................................................................................13
Creating an Element in the Model View .......................................................................................14 Changing the Properties of an Element........................................................................................15 Connecting the Elements .............................................................................................................17 Using the Impact Analysis Report ................................................................................................18 Using the Impact Analysis Filter ...................................................................................................19
Session 4: Creating a Conceptual Model Diagram.....................................................................................20 Creating Mappings........................................................................................................................23 Creating and Binding Business Elements ....................................................................................26 Creating and Binding Domains.....................................................................................................28
Session 5: Exporting Conceptual Diagrams to ER/Studio .........................................................................28 Session 6: Importing an ER/Studio Model to a Conceptual Model ............................................................30
Importing an ER/Studio Model......................................................................................................30 Updating a Conceptual Model from ER/Studio.............................................................................34
Session 7: Creating a Diagram from Selected Elements...........................................................................35 Session 8: Importing External Data Objects from ER/Studio.....................................................................36
Importing External Data Files .......................................................................................................36 Updating Imported External Data Objects....................................................................................37
Session 9: Exporting External Data Objects to ER/Studio.........................................................................37 Session 10: Using Reference Objects ........................................................................................................39
Creating Reference Objects .........................................................................................................40 External Data Objects...................................................................................................................41
Creating External Data Objects from a Palette ..............................................................41

Session 11: Using the Grid Editor...............................................................................................................41 Displaying and Editing Information in the Grid Editor...................................................................41 Using the Grid Editor for Entering Reference Objects Data.........................................................42 Customizing the Grid Editor..........................................................................................................43
Session 12: Exporting Data.........................................................................................................................43 Session 13: Importing Visio Models...........................................................................................................44
Creating Custom Mappings ..........................................................................................................46 Instance-Level Mappings..............................................................................................................47
Session 14: Importing Comma Separated Value (CSV) Files ...................................................................48 Session 15: Creating Links and Impact Analysis Diagrams ......................................................................51
Creating a Link..............................................................................................................................51 Impact Analysis Diagram..............................................................................................................53
Updated an Impact Analysis Diagram............................................................................55 Session 16: Creating Usage Relationships.................................................................................................55
Creating a Usage..........................................................................................................................55 Session 17: Using the Web Report............................................................................................................58 Session 18: Using EA/Studio Tools ...........................................................................................................61
Find and Search ...........................................................................................................................61 Find in Diagram..............................................................................................................61 Search ............................................................................................................................62
Element Grouping.........................................................................................................................64 Diagram Commands.....................................................................................................................65 Zooming........................................................................................................................................65 Toolbars........................................................................................................................................65
Layout and Alignment ....................................................................................................65 Formatting Toolbar.........................................................................................................66
Overview Window.........................................................................................................................66 Summary ......................................................................................................................................66
Additional Evaluation Resources ................................................................................................................67 Glossary ......................................................................................................................................................68

-1-
©2007, Embarcadero Technologies, Inc.
Introduction to Embarcadero’s EA/Studio
EA/Studio Business Modeler Edition is a tool for creating a graphical representation of your business -- from the core concepts that describe the business, to the processes that run the business. EA/Studio's Process Modeling capabilities allow you to easily model your business processes and how those processes use data. EA/Studio Conceptual Modeling provides an intuitive way to outline subject areas and concepts that can then drive the creation of detailed data models.
Through robust reporting, modeling, and graphical impact analysis, users are able to provide relevant information to various stakeholders within the organization in a format that makes sense to them. For example, a data analyst may wish to see a CRUD (usage) report showing what data is used by a given process for compliance. A business user may want to see a list of relevant business rules in a spreadsheet. A process modeler needs to see a semantically-rich process model. EA/Studio allows each stakeholder to see a different “slice” of information—all from the same data source and metadata model.
Product Benefits by Audience
Business Process Modelers/Analysts: EA/Studio provides a rich process modeling semantic based on the Object Management Group’s (OMG) Business Process Modeling Notation (BPMN). In addition, modelers and analysts can link their business process models with related business information such as business rules, stewardship, and data to generate impact analysis and usage (CRUD) reports.
Data Modelers: EA/Studio’s Conceptual modeling allows Data Modelers to create a high-level design of the core business concepts to gain acceptance and requirements from the business. These high-level Conceptual models can be forward and reverse engineered with detailed Logical Data Models in ER/Studio. EA/Studio also allows data modelers to relate data objects to business process information, and create Usage (CRUD) and impact analysis reports. In addition to process-specific information, data can also be related to business information such as business rules, stewardship, and business units.
Business Users: Conceptual Modeling allows Business Users to create high-level designs of the core “concepts” and subject areas that drive the business, which can be passed onto data and process modelers to drive more detailed logical and physical design. EA/Studio also provides intuitive reporting and export capabilities to provide relevant information to business users in an easy-to-understand format. Intuitive impact analysis diagrams and reports allow business users to get an understanding of the relationship between business information and key IT assets such as data, without having to be a modeling or programming expert. Information can be shared with business users in formats they are familiar with: Excel spreadsheets, HTML reports, PDF files, etc.

-2-
©2007, Embarcadero Technologies, Inc.
About This Evaluation Guide This evaluation guide is intended to help you get started using EA/Studio Business Modeler Edition and gives you the foundation you need to explore its many features and benefits. You will learn how to create a new business process and conceptual model, format and edit diagrams, import and export data, and generate a web report. You will also become familiar with some frequently used tasks and commands to make you more productive.
This guide is divided into short, easy to learn sessions. Do them all at once, or complete them individually as you have time.
Session 1: Getting Started with EA/Studio
Session 2: Understanding the EA/Studio Infrastructure
Session 3: Creating a Business Process Model Diagram
Session 4: Creating a Conceptual Model Diagram
Session 5 Exporting Conceptual Diagrams to ER/Studio
Session 6: Importing an ER/Studio Model to a Conceptual Model
Session 7: Creating a Diagram from Selected Elements
Session 8: Importing External Data Objects from ER/Studio
Session 9: Exporting External Data Objects to ER/Studio
Session 10: Using Reference Objects
Session 11: Using the Grid Editor
Session 12: Exporting Data
Session 13: Importing Visio© Models
Session 14: Importing Comma Separated Value (CSV) Files
Session 15: Creating Links and Impact Analysis Diagrams
Session 16: Creating Usage Relationships
Session 17: Using the Web Report
Session 18: Using EA/Studio Tools
You can use this basic guide as a roadmap of product highlights, but it also is provided to help you find your own path in exploring EA/Studio.
Once you’ve started, you can select Help from the menu to find many additional resources that complement and build on many of the activities shown in this brief guide.

-3-
©2007, Embarcadero Technologies, Inc.
Session 1: Getting Started with EA/Studio The following graphics illustrate the main elements of the EA/Studio Application User Interface. The first graphic shows a Business Process Model workspace, project, model, and diagram. The available palette is the Business Process Objects.
The second graphic shows a Conceptual Model workspace, project, model, and diagram with a Conceptual Objects palette.
Note: The available palette depends on the type of Model, i.e., if it is a Conceptual model, only the Conceptual Objects palette is available.

-4-
©2007, Embarcadero Technologies, Inc.
Session 2: Understanding the EA/Studio Infrastructure
Before we begin, let’s cover some of the basic constructs that help organize and display the information in EA/Studio:
Workspace: The workspace is the top level container or owner of your projects and reference objects. You can only have one workspace open at a time.
Project: The Project is a collection of items relevant to a customer including models, model objects, documents, business rules, etc. For example, a “Human Resources” project might contain a business process model describing the main functions of the Human Resources department, business rules describing the behavior of the organization can be created as reference objects and referred to in the project. You can nest a project within an existing project (i.e. one project is a parent of another project). A project need not contain a model, but is most commonly used to organize groups of models. You can have multiple projects in a workspace. However, a project is not required. You can nest models directly under a workspace without using a project to organize them.
Model: A model is a specific collection of elements/objects related to a modeling notation (Business Process Modeling Notation [BPMN], Conceptual, etc.). For example, the Human Resources BPMN model would contain those objects associated with the business processes of HR: tasks, swimlanes, gateways,

-5-
©2007, Embarcadero Technologies, Inc.
etc. A model is where the object “lives”, i.e. objects are stored within a model, but can be visualized in other formats such as a visual diagram, grid editor, etc.
Diagram: A diagram is used for creating graphical models of business operations. The main types of diagrams in EA/Studio are Business Process and Conceptual Model. The third diagram type, Impact Analysis, displays the relationships you created between objects.
Business Process Model Diagram
A Business Process Model is a visual representation of the flow of activities and their order of performance using a set of graphical elements that use shapes familiar to most modelers and business users. For example, activities are rectangles and decisions are diamonds. The result is having an easy-to-understand mechanism for creating business process models which produce complex business processes.
Conceptual Model Diagram
Conceptual modeling is used by enterprise architects, business users, and data architects to model high-level business concepts and subject areas. A common usage of a Conceptual Model is to relate the model to a Logical Data Model. However, it could include other elements like data flow, process, or information assets in addition to more abstract interactions between business ‘things’, for example, areas of a business and their associations, such as the association between Sales and Finance organizations.
Impact Analysis Diagram
The Impact Analysis Diagram is a graphical representation of the relationship between various objects based on links you create to form relationships. This diagram is discussed in Session 15.
Object: An object is a generic term for items or elements that make up business processes and conceptual models: tasks, swimlanes, gateways, flow objects, business entities, business attributes, etc.
In the following sessions, we’ll use EA/Studio to create a sample business process diagram and conceptual modeling diagram. We will also learn how to use reference objects, the grid editor, and the import/export framework. We will also create links and usages, create an Impact Analysis Diagram, and view Impact Analysis and Usage (CRUD) reports.
Beginning to Model with EA/Studio
1. From the Start > Programs menu, choose Embarcadero EAStudio 1.5 > EAStudio and the Welcome dialog opens. You can also double-click the EA/Studio shortcut that is placed on your desktop at the time of installation.

-6-
©2007, Embarcadero Technologies, Inc.
2. In the Welcome dialog, select Create a new workspace (with optional project, model, and diagram (the first option).
Note: You can also use the “express” create method. If you select this option you only need to select the model type and enter a name. A workspace, project, model, and diagram are then created for you, all with the same name.
3. Click OK and the Create a New Workspace dialog opens.
4. For purposes of this evaluation guide, take the following steps to create a new workspace, project, model, and diagram:
• Enter the workspace name “Acme Company” but leave the default directory as is.
• Enter the new project name “Compliance Reinstatement Project” under Project options.
• Create a new model named “Shipping Process Model” within the project you just created. Leave the Model type as Business Process and leave the default setting as On for the Validate against BPMN specification setting.
• Create a new diagram named “Order Picking” within the model you just created. As you enter the name of the diagram, the Name of Pool with Invisible boundary and First lane name text boxes are populated with the same name.
5. Rename the pool name as “Order Picking Pool” and rename the First lane name as “Order Picking Lane”

-7-
©2007, Embarcadero Technologies, Inc.
6. When you click OK, a new workspace, project, model, diagram, pool, and lane are created and appear in the Model View. The items are displayed in the hierarchal mode in the tree.

-8-
©2007, Embarcadero Technologies, Inc.
7. When working with Business Process models, you work with processes. A process is a collection of flow objects connected by flows that is executed in a sequence (usually depicted on a diagram). In the Business Process Modeling Notation specifications, all processes are contained by a pool. A pool contains only one process, but you can have multiple pools in a diagram which can then collaborate via messages.
To display a process in the Model View tree, go to Window>Preferences>Business Process Modeling>Processes. Select the option to “Show processes in application” and click OK. Now the elements
in a diagram or pool are displayed under the Process node ( ) in the Model View.
Reference Objects are also created at this time. We will discuss how to use Reference Objects in Session Ten.
In the Model View you have toolbar commands that make it easier to work in the tree.
Icon Command Description
Refresh Updates all the nodes in the Model View.
Collapse All Collapses all the nodes in the Model View.
Expand All Expands all the nodes in the Model View.
Sync with Diagram If this command is selected, whenever an element in the diagram is selected, the Model View automatically selects that element in the Model View.
Filter Opens the Model View Filter dialog.
Group by Object Groups items in the Model View by element type. This is a toggle switch.

-9-
©2007, Embarcadero Technologies, Inc.
Using the Model View
The Model View displays the hierarchy of workspaces, projects, models, diagrams, and elements. It also displays the hierarchy of reference elements. In the next step of this evaluation guide, we are going to create a new project that will be nested in an existing project.
1. Right-click the Workspace node labeled “Acme Company” in the Model View and select New>Project….
2. In the New Project dialog, enter the new project name “Compliance Reinstatement Project Part Two”.
3. In the Select where you want to create the project text box, select Compliance Reinstatement Project.
4. Click OK and the newly-created project is placed in the Model View nested under the Compliance
Reinstatement Project node.
Session 3: Creating a Business Process Model Diagram We will create elements for a diagram three different ways: using the palette in the Diagram View, using the Toolbar, and creating elements in the Model View.
Creating Elements in the Diagram View
You can build a business process model diagram by placing elements in the Diagram View directly from the Business Process toolbar. The diagram we are going to create shows the business flow of filling an order in a warehouse for shipping.
1. On the Business Process toolbar click the drop-down arrow next to the Start Event icon ( ).

-10-
©2007, Embarcadero Technologies, Inc.
2. Click the Message Start Event icon ( ) and then click once on the left-hand portion of the Diagram View. This message event indicates that the process must receive a message from an outside source before the event can start.
Note: The cursor is in multi-drop mode
( ) allowing you to place as many elements as you need. Press ESC or click the right mouse button to exit the multi-drop mode. The cursor
changes from to . You can disable the multi-drop option by going to Windows->Preferences->Diagrams and deselect the Enable multi-drop on object creation option.
In the Business Process Modeling Notation specification, all business process diagrams must contain at least one pool. A pool and lane with an invisible boundary were created when you created a new diagram. The pool with the invisible boundary is indicated by the icon in the Model View. In EA/Studio, when you place an object in the diagram, that object is placed in this invisible pool. This invisible pool becomes visible when you drag it to another diagram in the Diagram View.
a. The start event is shown as a presentation element under the Diagram node (this is indicated by an arrow decorator placed on the icon ).
b. The pool with the invisible boundary that you named at the time of the new workspace creation appears in the Model View hierarchy. In this case it is called Order Picking Pool.
The pool contains the Process ( ) and all elements placed in the diagram.

-11-
©2007, Embarcadero Technologies, Inc.
3. You have the option to display labels on elements. Right-click the start event on the diagram and select Show Name. You can also set a display option preference for each element type that automatically shows the label when you create an element.
To open the Formatting Preferences dialog, do the following:
a. From the main menu select Window>Preferences….
b. Expand the Formatting node and select Business Process Modeling.
d. Select the element you want to set the preference for in the list box, in this instance the End Event.
e. Under the Diagram Display Options section, select “Show name on creation” and click Apply to Diagram and then click OK.
4. Click the Task element ( ) on the Business Process Objects palette and place four tasks in the Diagram View as shown in the following graphic.
5. Next we will label the tasks. You can select a task element and then immediately start typing your label. Label each task as follows:
Task = Check Order Task1 = Check Inventory Task2 = Confirm Order Pull Task3 = Handle Fault

-12-
©2007, Embarcadero Technologies, Inc.
Aligning in the Diagram View
There is a quick and simple way to align your placed objects. In this example we want to make sure our top set of tasks are aligned and distributed evenly.
1. Select the three tasks you placed at the top of your diagram by holding down the left mouse button and drawing a box around the tasks. Notice that all three tasks are now marked with handles.
2. Place the mouse cursor on the task labeled “Check Order” and Shift+Click because you want to align all the other elements with it. That element is now highlighted with black box handles instead of hollow boxes.
3. Select the Align Top icon ( ) from the Alignment toolbar and the three tasks are now aligned.
4. With the same three tasks selected, click the Distribute Evenly icon ( ) and the three tasks are evenly distributed horizontally.
Grouping Elements in the Model View
You can group elements by object types in the Model View. This is a toggle button available on the Model View toolbar. When this button is selected all diagrams and elements in the Model View are grouped by type.
• Click the Group by Object Type button on the Model View toolbar ( ).
• The list is now grouped by type and each type node is indicated by a folder indicator ( ).

-13-
©2007, Embarcadero Technologies, Inc.
• For purposes of this Evaluation Guide, we are going to click the Group icon once again to ungroup the elements.
Filtering
You can use the filter to hide or show modeling elements, reference objects, data objects, and shapes in the Model View. You can filter out elements based on a general type, or a specific element. A status bar located in the lower right-hand corner of the application displays the status of the filter (off or on).
1. Click in the Model View toolbar to open the Model View Filter dialog. We are going to filter out several of the items listed in the Reference Objects node.
2. In the Reference Objects node deselect Business Rule and Business Unit. All the other types should be selected.

-14-
©2007, Embarcadero Technologies, Inc.
3. Click OK and the only items listed in the Reference Objects node, in addition to the External Data Objects node, are Business Elements, Domains, and Stewards. The Model View tab displays the information that the Model View has been filtered.
Creating an Element in the Model View
You can create an element in the Model View from any pool node. A diagram is not required to create elements.
1. Right-click the Order Picking Pool Process node that is a subnode of the Order Picking Pool in the Model View.
2. Select New.
3. From the list of BPMN elements, select the element you want to create in the Model View. In this case select the End Event element ( ). The element is placed in the Model View but does not appear in the diagram.

-15-
©2007, Embarcadero Technologies, Inc.
4. Once you create the element in the Model View, drag it on to the Diagram View and place it to the right of the task labeled “Confirm Order Pull”. Notice that the End Event’s name automatically shows because of the preference you set earlier.
Changing the Properties of an Element
When you double-click on an element, the Property View for that element opens. You can use the Property View to:
• Change the name or properties of an element.
• Enter a description and notes for the element, if applicable.
• View any links or usages that have been created to the element.
• View the Impact Analysis report.
• View the Usage (CRUD) report.
• Change the appearance of the object.
For purposes of this diagram, we are going to rename the End Event and change the Results type to a Message End Event.
1. Double-click the End Event object in the Diagram View to open the Property View.

-16-
©2007, Embarcadero Technologies, Inc.
2. On the General tab, change the name to “Order Filled”.
3. Click the Results tab and then click the Message icon. The End Event is now a Message End Event.
4. To place a second Message End Event in the diagram, expand the Business Process Objects palette and click the drop-down arrow to the right of the End Event icon.
5. Select Message End Event from the list and place it to the right of the “Handle Fault” task in the diagram.
6. Rename this End Event “Fault Resolved” by clicking once on the End Event label to change it to an editable field.
We are going to place an error intermediate event on a task which shows that if an error occurs, the flow will take you to the Handle Fault task where the error will be corrected.
1. On the Business Process palette, click the drop-down arrow on the Intermediate Event icon ( ) and select the Error Intermediate Event ( ) from the list.

-17-
©2007, Embarcadero Technologies, Inc.
2. Place the event on the lower edge of the task labeled “Check Order”. The icon is now docked to the task.
Connecting the Elements
There are three different types of connectors used in the Business Process Modeling Notation: Sequence Flow, Message Flow, and an Association.
To complete our diagram we are going to use the Sequence Flow connector to connect all elements in the diagram.
1. Click the Sequence Flow icon ( ) on the Business Process Toolbar.
2. Draw sequence flows between the following elements:
• Start Event to Check Order task
• Check Order task to Check Inventory task
• Check Inventory task to Confirm Order Pull task
• Confirm Order Pull task to Order Filled end event
• Error Intermediate Event to the Handle Fault task
• Handle Fault task to Fault Resolved end event
This completes the process of creating the business process diagram. Your diagram should resemble the following graphic.
The Model View now displays the outgoing or incoming relationships for the elements.

-18-
©2007, Embarcadero Technologies, Inc.
Using the Impact Analysis Report
The Impact Analysis Report can be viewed for most nodes on the tree.
1. To view this report right-click the End Event labeled “Fault Resolved” in the Order Picking Pool node.
2. Select Impact Analysis>Show…. The Property View opens for the selected end event with the Impact Analysis tab opened in the view.
The report shows the following interrelationships between elements in the Model View:
• Workspace hierarchy • Diagram usage • Heritage • Incoming and outgoing
connecting objects

-19-
©2007, Embarcadero Technologies, Inc.
3. You can view this report in a tree or table format, with tree as the default. To view the report in the
table format click located next to the Filter indicator. Double-click on any row to open the Property View for the selected element type.
Using the Impact Analysis Filter
1. In the Impact Analysis click to open the Impact Analysis Filter dialog. There are two tabs: Relationship Types and Object Types. In Relationship Types you can select the types of relationships you want included in the impact analysis. In this exercise we will filter out the Incoming and outgoing connecting objects.
2. In Object Types, all object types are in a collapsed list under this tab. You can select the entire group or select individual elements within that group. On the Objects Types table we will filter out the External Data Objects.
3. Click OK and the resulting Impact Analysis Report should resemble the following graphic.

-20-
©2007, Embarcadero Technologies, Inc.
Session 4: Creating a Conceptual Model Diagram In this session we are going to create a conceptual model and diagram. Then in the next session we will export that model to ER/Studio. We will also create and bind a Business Element and a Domain to Business Attributes.
We are going to create a conceptual model and diagram within the workspace we created earlier.
1. Right-click the workspace node labeled “Acme Company” and select New>Model….
2. Enter the Model name “Sales”.
3. In the Model Type drop-down list, select Conceptual.
4. We are going to place this model under the Compliance Reinstatement Project node, so select it.
5. Next, click the Create a diagram within this model option and enter the name “Sales Components”.
6. Click OK and the diagram Sales Components is placed in the Sales model. The Conceptual Objects
palette now appears in place of the Business Process Objects palette.
7. Expand the Conceptual Objects palette, select a Subject Area ( ) and place it in the Diagram View.

-21-
©2007, Embarcadero Technologies, Inc.
8. Name the Subject Area “Sales”. Once you have named it, enlarge the element so it is approximately three times its original size.
A subject area can reference a collection of entities. You can embed the entities in the subject area, or you can have the Subject Area reference a diagram that contains entities. For this example, we are going to embed two entities in the subject area.
9. Select Business Entity ( ) from the palette, and place two of them inside the Subject Area. Name the first one “Order” and the second one “Product”. When you place the entities in the subject area they are automatically “mapped” to that subject area.
10. Double-click on the Sales Subject Area to open the Property View.
11. Click on the Mappings tab. This hierarchy shows that both entities are mapped to Sales.
12. Select the Business Attribute element ( ) and place three (3) of them in the Order entity. Name the three attributes as follows: “Ship to Address”, “Bill to Address”, and “Order Status”.
Place three Business Attributes in the Product Entity. Name them “Product Name”, “Category”, and “Description”.

-22-
©2007, Embarcadero Technologies, Inc.
When building conceptual models, you need a way to mark attributes in an entity as a primary identifier, which is similar to a primary key identifier in a physical model. EA/Studio uses the CASE notation, which is a “#” symbol placed before the attribute name.
13. To set a unique identifier on an attribute, right click the attribute “Ship to Address” and select Unique Identifier from the shortcut menu. The attribute is now shown with the unique identifier symbol (#).
14. Click the drop-down arrow next to the Relationship icon ( ) on the palette. You can select one of four relationship types: Relationship, Many to Many, Many to One, and One to Many. For this example, we are going to set the relationship type as “One to Many”. Create a relationship between the Order and Product business entities.
15. We are now going to set the source/target optionality setting. Double-click the Relationship to open the Property View. In the Optionality drop-down list box select “Mandatory to Optional”. Notice that the “split-line” notation shows the optionality setting in the diagram.

-23-
©2007, Embarcadero Technologies, Inc.
16. Right-click the relationship and select Show>Name. The relationship is now labeled
“Order.Product”.
17. Right-click in the Sales subject area and uncheck the “Show as Expanded” command. The subject area is collapsed and shows only the name of the subject and hides its contents. You can use the subject area as a single object, or expanded to show its contents.
18. You can also change the shape of the subject area from an oval to a rectangle. In the Property View
for the Sales subject area click the Appearance tab. In the Shape options, select Rectangle and the shape is changed.
19. For purposes of this session, reset the rectangle setting to oval, and check the “Show as Expanded”
option.
Creating Mappings
A Mapping defines the transformation/association/semantic link between model layers. For example: Subject Area -> Conceptual Model -> Logical Data Model -> Physical Data Model. In an Entity/Relationship data model, we would say that a logical entity is “mapped” to a physical table when a

-24-
©2007, Embarcadero Technologies, Inc.
Logical Model is forward engineered to create a physical model. Similarly, a Subject Area can be mapped to one or many Business Entities or Conceptual diagrams.
An example of how objects are mapped from the Conceptual to Physical layers is shown in the following graphic:
You can map a Subject Area to one or more Conceptual Model diagrams. In this portion of the session we are going to create another Conceptual diagram and map the Sales Subject Area in our first diagram to the newly created diagram.
1. In the Model View, right-click the model node labeled ”Sales” and select New>Diagram.
2. Name the new diagram “Sales Components Part Two”, leave the default location of “Sales” and click OK.
3. Place two entities in this diagram and name them “Processing” and “Shipping”
4. In the Diagram View area, click the diagram tab labeled “Sales Components” and right-click in the “Sales” Subject Area.
5. Select Edit Mapping… and the Edit Mappings dialog opens. This dialog shows that two of the entities are already mapped (Order and Product). This mapping happened automatically when the “Order” and “Product” entities were placed in the “Sales” Subject Area.
6. Select “Sales Components Part Two” diagram and the two entities “Processing” and Shipping and click OK.

-25-
©2007, Embarcadero Technologies, Inc.
7. You can view the results of your diagram mapping several ways: via the shortcut menu of the
Subject Area or via the shortcut menu in the diagram. In the Property View of the subject area you can view the mappings on the Mappings tab or the Impact Analysis tab.
• Right-click in the Sales Subject Area in the first diagram and select Diagram Mappings. The pull-right displays the diagram you just mapped as well as the model of that diagram (Sales Components Part Two [Model:Sales]).
• Double-click the Sales Subject Area to open the Property View and click the Mappings tab.

-26-
©2007, Embarcadero Technologies, Inc.
• In the Property View, click the Impact Analysis tab to view the mappings. You can view the Impact Analysis either in a tree format or a table format. We will view the table format by clicking
located at the top of the panel.
Creating and Binding Business Elements
Business Elements are often used by business users to document their list of “terms and/or definitions”. While from a business user’s point-of-view, this may be no more than a list of terms, they can be used by a modeler to seed attributes of semantically-rich models. A Business Element can be bound to different business attributes across conceptual models to enforce naming and definition standards. In this section we are going to create a Business Element and bind it to an existing Business Attribute in our Conceptual Model.
1. Under the Reference Objects node, right-click on Business Elements and select New Business Element.
2. While the Business Element you just created is still in edit mode, name this Business Element “Shipping Address”.
3. Double-click this element to open its Property View. On the General tab, we will leave all the properties as is. Notice under the Enforcement options that the Name, Description, Notes, and Domain/data type properties are selected and will override the properties of the Business Attribute it is bound to.

-27-
©2007, Embarcadero Technologies, Inc.
4. Click the Description tab and enter the following description: “The shipping address contains the Customer Name.”
5. Highlight the text “Customer Name”, click , and select red from the Color dialog, and click OK. The selected text is now red in the description field.
6. In the Diagram View, double-click the Business Attribute “Ship to Address” to open the Property View. In the Business Element Bindings Option group box, click the drop-down arrow in the Bound Business Element text box and select “Shipping Address”.
7. Two things happen with the binding of the Business Attribute to the Business Element:
• The Business Attribute is now named Shipping Address.
• The description you entered in the Business Element is now the description for the Business Attribute and appears under the Description tab in the attribute’s Shipping Address property view.
8. You can view the binding action in two places. Click Bindings in the Business Attribute to show the elements the attribute is bound to. Click Bindings in the Business Element Property View to show the attributes bound to an element.

-28-
©2007, Embarcadero Technologies, Inc.
Creating and Binding Domains
Domains appear under the Reference Objects node in the Model View. Domains are similar to ER/Studio domains, which are simple attribute templates. Unlike other reference objects, domains appear only in the Model View and cannot be visualized on diagrams. So an icon does not appear in the palette or the toolbar.
Domain properties closely follow ER/Studio and their properties include data type, width (where applicable), scale (where applicable), and optionality. Each of these properties can be enforced on any attribute created based on the domain.
1. Under the Reference Objects node, right-click on Domains and select New Domain.
2. While the Domain you just created is still in edit mode, name this Business Element “Date of Order”.
3. Drag the Domain “Date or Order to the Order Business Entity in the diagram, and a Business Attribute is created. When this occurs, the Domain is ‘bound’ to the Business Attribute.
4. Double-click on the “Date of Order” attribute in the Order Business Entity to open the Property View. On the General tab you can see the bound Domain in the Domain bindings option group box. Also note that when a Domain is bound, the Business Attribute properties (Data Type, Width, Scale, and Optionality) are grayed out.
Session 5: Exporting Conceptual Diagrams to ER/Studio When we export the Conceptual model to a Logical Data model in ER/Studio, the Subject Area we created will be an ER/Studio submodel, and Business Entities will be created as Logical Entities within that submodel. Also, when you have mapped a diagram to a Subject Area, the entities of the mapped diagrams are then exported as elements of the ER submodel. 1. In the Model View, right-click the model “Sales”, select Export>Model to ER/Studio… and the
Export to ER/Studio dialog opens. The name of the ER/Studio export file is by default the model name with a file extension of .dm1. The directory where the exported file will be placed is the default workspace directory. For this example we will leave these settings the same.

-29-
©2007, Embarcadero Technologies, Inc.
2. Click . The Subject Area “Sales” and all four Business Entities are placed in the Selected elements list box and appear under the Logical node.
3. Select the option to open the generated model in ER/Studio when the export is complete.
Note: This assumes you have ER/Studio 7.0 or above installed on your computer.
4. Click OK, and ER/Studio opens with the model you exported from EA/Studio.
Note: The Shipping element may not be visible in the Diagram View because it was placed to the right off the screen. You can rearrange the elements in the Diagram View area.

-30-
©2007, Embarcadero Technologies, Inc.
Session 6: Importing an ER/Studio Model to a Conceptual Model In this session we will cover how easy it is to import an ER/Studio Model into an EA/Studio Conceptual Model. Also, once that model has been imported, we will walk through the steps of updating it from an updated ER/Studio model.
Importing an ER/Studio Model
1. In the Model View, right-click the Conceptual Model "Sales" and select Import > From ER/Studio > Create New Conceptual Objects....
2. The import type of ER/Studio diagram is selected by default. In the Location dialog, browse to the location of your EA/Studio 1.5 installation and go to the following directory: …\Program Files\EAStudio1.5\samples\ERStudio Models\. Select the file named “Northwind.dm1 and click Open.
3. Leave the model name as “Northwind”. Also, leave the default setting of “Sales” for the location of the model to be created, and click Next.

-31-
©2007, Embarcadero Technologies, Inc.
4. In the Object Selection dialog you can specify the objects you want included in the model. From the list of Available Entities, select the Entity labeled “Customers” and click . When you select a main model/submodel, all the entities inside that submodel are moved to the Selected Entities tree. A subject area and diagram are created for each submodel. In this case a Subject Area and diagram are created with the name “Customers”.
5. You can also select an individual attribute to be imported. Expand the “Territories” submodel and in “EmployeeTerritories” entity select the attribute “EmployerID”. Click and in the Selected entities tree a diagram and Subject Area are created named “Territories”. The Business Entity “Employee Territories” and the one selected attribute appear in the Selected Entities list box.

-32-
©2007, Embarcadero Technologies, Inc.
6. After you have made your selections on the Entities tab, click the Domains tab where all domains in the ER/Studio model are listed.
You have the option that if you only want to see only bound domains to selected entities, you can select that option located below the Available domains list box. In ER/Studio you can bind a domain to an entity attribute, so this option filters out domains that are not bound to entities.
7. Click the drop-down arrow in the “Import Domains As” list box. Your import options are: Business Elements, Domains, and Business Elements Referencing Domains. For purposes of this exercise, select “Business Elements”.
8. Select the Domain “Address” and click . It now appears in the Selected Domains list box as a Business Element.
9. Click Finish and once you get the message that the import was successful click OK. The imported model with all its associated diagrams, subject areas, and entities are placed in the Model View tree under the model node “Northwind”. The domain you imported appears as a Business Element under the Reference Objects node.

-33-
©2007, Embarcadero Technologies, Inc.
10. In the Model View, double-click the diagram labeled “Customers” to view it in the Diagram Area.

-34-
©2007, Embarcadero Technologies, Inc.
Updating a Conceptual Model from ER/Studio
If you are working on an ER model, you can frequently update your associated EA conceptual model, if that EA/Studio model was initially created by importing the ER model. The ER model changes can include entity name changes, adding and removing new attributes, adding and removing relationships, binding and unbinding existing domains, etc.
Because updates are based on an object’s unique identity rather than its name, you have ability to re-import just the changes, or the entire ER model, and the existing EA/Studio Conceptual Model is updated. All existing relationships are maintained, and renamed elements are updated properly. It is important to note that only the elements that were originally created by importing the ER model are updated. Any elements that are created in EA/Studio are not updated with information imported from the ER model.
Note: Since we have not updated the ER/Studio model, we will just walk through the steps of updating the Conceptual model.
1. Right-click the model “Northwind” in the Model View tree and select Import > From ER/Studio > Update Existing Conceptual Objects….
2. In the Location dialog browse once again to …EAStudio1.5\samples\ERStudio Models\ and select the diagram named “Northwind.dm1.
3. In the workspace tree, select the model “Sales”.
Note: You can select the “Delete objects in model that aren’t contained in source file.” If you enable this option, any objects in the target model that do not match an object that you select in the source model for update is deleted. If this option is not selected, (it is not selected by default), none of the objects in the target model are deleted.
4. Click Next and the Object Selection dialog opens. From the list of available entities, select the object “Customers” and click . Under the Domains tab, select “Address” and click .

-35-
©2007, Embarcadero Technologies, Inc.
5. Click Finish and you will get a dialog telling you that the import was successful. Click Details to view what items were updated. The updated information in placed in the Model View under the “Sales” node.
Session 7: Creating a Diagram from Selected Elements You can create a new diagram from selected elements in the model view tree. From the model view, you can multi-select the elements you want to create on the diagram, right click, and then select the “Create Diagram from Selected Elements…” menu option.
Any combination of Reference Objects or External Data Objects can be selected and added in combination with Business Process or Conceptual Model elements, with the following exceptions: (1) Business Process triggers; (2) External Data Object attributes, columns, and data elements; and (3) Reference Object Domains. The Create Diagram from Selected Elements command is disabled when an invalid combination of elements are selected.
In the following example, we are going to create a diagram that includes two Business Entities and a Subject Area that were imported from ER/Studio.
1. In the Model View, Ctrl+Click the business entities “CustomerCustomerDemo,” “CustomerDemographics,” and the subject area “Customers”.
2. Right-click Customers and select Create Diagram from Selected Elements… The New Diagram dialog opens.
3. Name the Diagram “Customer Information” and select the model “Sales.” A new diagram is created named “Customer Information” and placed in the Sales node in the Model View.

-36-
©2007, Embarcadero Technologies, Inc.
Session 8: Importing External Data Objects from ER/Studio You can import or update External Data Objects from ER/Studio files using a wizard. This imports entities and tables from ER/Studio to 'Table' and 'Entity' reference objects.
Importing External Data Files
1. From the main menu, select File>Import>From ER/Studio>External Data Objects>Create New....
2. In the Source name and Location dialog the ER/Studio diagram is selected by default. Browse to …EAStudio1.5\samples\ERStudio Models\ and select the file named “Northwind.dm1 and click Open.
3. Rename the Data source name as “Southwind” and click Next.
4. In Model Selection specify which models you want imported into the data source. The model selection is based on the file you selected in the previous panel. For purposes of this example expand the Logical node and select “Products”.
5. When you click Next, the Object Selection panel opens. The objects that appear are based on the selections you made in the previous panel. There are three tabs containing imported objects: Entities, Tables, and Views. We are only going to select Entities.
6. Select the “Products” folder and click . Your selection now appears in the Selected Entities list box. Notice that the folder labeled “Products” does not appear in this list, only the three entities: Categories, Products, and Suppliers.

-37-
©2007, Embarcadero Technologies, Inc.
7. Click Finish and a dialog opens telling you that the import was successful. The imported External Data Objects now appear as entities in the Model View under the “Southwind” data source, under the External Data Objects node.
Updating Imported External Data Objects
You can use the Update External Data Objects wizard to update an existing External Data Object data source that you have already imported. All existing objects that match an object you have selected will be updated. All objects that you have selected but are not in the existing data source will be brought in as new. In the following example, we will walk through the update steps even though the ER/Studio model has not been changed.
1. Right-click the External Data Objects data source node labeled “Southwind” in the Model View tree and select Import>From ER/Studio>Update Existing External Data Objects....
2. In the Location text box, browse to …EAStudio1.5\samples\ERStudio Models\ and select the file named “Northwind.dm1 and click Open.
3. Leave the data source name “Southwind”.
Note: You can select the “Delete objects in model that aren’t contained in source file.” If you enable this option, any objects in the target model that do not match an object that you select in the source model for update is deleted. If this option is not selected, (it is not selected by default), none of the objects in the target model are deleted. For purposes of this session, select this option.
4. Click Next and in the Model Selection dialog select the logical model “Territories” and click Next.
5. In the Object Selection dialog select the “Territories” folder from the Available Objects window and click . Your selection now appears in the Selected Entities list box. Notice that the folder labeled “Territories” does not appear in this list, only the four entities: Employee Territories, Region, Shippers, and Territories.
6. When you click Finish a dialog opens telling you that the import was successful. Click Details>>... for information on what was imported. You can print or save this information.
7. Click OK and the new/updated objects appear in the “Southwind” node in the External Data Objects node.
Session 9: Exporting External Data Objects to ER/Studio You can export External Data Objects to ER/Studio where all entity elements map to a logical model and all table elements map to a physical model in ER/Studio. Only entities and tables are exported. The export uses pre-defined mapping. We are going to export the “Northwind” project that we imported in Session 6.
1. Right-click the External Data Objects node labeled “Northwind” in the Model View tree and select Export>Model to ER/Studio
2. In the Export Model ‘Northwind” to ER/Studio dialog change the Name to “Eastwind.dm1”.
3. Leave the default directory as “...MyDocuments\EAStudio”.
4. From the list of Available Elements, click and all elements are moved to the Selected Elements list box.

-38-
©2007, Embarcadero Technologies, Inc.
5. Select the option to “Open generated model in ER/Studio when export is complete”, if you have ER/Studio 7.0 or above installed on your computer.
6. Click OK and the export dialog closes. The exported model is then opened automatically in ER/Studio.

-39-
©2007, Embarcadero Technologies, Inc.
Session 10: Using Reference Objects When you create a new workspace, a reference object project is automatically created as well. There are six types of reference objects used in EA/Studio. We already discussed creating and using Business Elements and Domains, so this section covers more general information on Reference Objects.
External Data Objects External Data Objects are “generic” data artifacts that can be used to show the relationship and impact between data and the activities of the process. External Data Objects are not entity relationship modeling artifacts, but an abstraction of these objects. You can import or create new external data objects and then link those objects to business process or conceptual elements.
Business Elements Business Elements are often used by business users to document their list of “terms and/or definitions”. While from a business user’s point-of-view, this may be no more than a list of terms, they can be used by a modeler to seed attributes of semantically-rich models. A business element can be bound to different business attributes across conceptual models to enforce naming and definition standards. An organization can achieve a common meaning and lineage around core business concepts such as “customer”, “customer identifier”, “trade”, etc. by using the business element concept.

-40-
©2007, Embarcadero Technologies, Inc.
Business Rules Business Rules are policies, practices, or formulas related to the operation and enforcement of business practices.
Business Units Business Units are organizational areas within or external to an enterprise, for example, Human Resources, Sales, Accounting, etc.
Domains Domains are reusable attribute templates that promote consistent domain definitions such as name and data type properties.
Stewards Stewards are people or organizations responsible or associated with model elements, for example: DBA, Auditor, Jeffrey Smith, etc.
Creating Reference Objects
There are several ways to create reference objects: on the Model View; from the Reference Objects palette; from the Reference Object toolbar; and importing from CSV files. When you create a reference object from the palette, you can select the object you want to use from the palette and then click once in the Diagram View. Once placed on the diagram, it also appears in the Model View. The following example walks you through the creation of an object on the Model View.
1. Right-click on a reference object in the Model View and select New. The command that appears depends on the reference object clicked. For example, right-click on Stewards, the command will be New Steward.
The newly created reference object appears below the selected object in the Model View in the edit mode. Name the new Steward “Order Clerk”.
When you right-click the newly created object you gain access to a shortcut menu where you have the following options: rename, delete, create or edit a link, create or edit a usage, create an impact analysis diagram, view an impact analysis report, and change the properties. You can also double-click an object to open the Property View.
2. Once you create the reference object, you can then drag that object onto the Diagram View. A representative icon is placed in the diagram. You can then connect these objects to other objects. The example below shows the Steward “Order Clerk” connected to a task via an Association Link.

-41-
©2007, Embarcadero Technologies, Inc.
External Data Objects
You can import or create External Data Objects. When you right-click an external data object you gain access to a shortcut menu where you have the following options: rename, delete, create or edit a link, create or edit a usage, create an impact analysis diagram, view an impact analysis report, and change the properties. You can also double-click an object to open the Property View. You can then create links to associate external data objects with any element in a Business Process or Conceptual Model diagram.
Creating External Data Objects from a Palette
You can place External Data Objects on a diagram from the External Data Objects palette. Select the desired object from the palette and click in the Diagram View area to place it. Once placed on the diagram, it also appears in the Model View.
Note: See Session 8 for how to import External Data Objects from ER/Studio. Session 9 steps through the process of exporting External Data Objects to ER/Studio.
Session 11: Using the Grid Editor The Grid Editor is a spreadsheet-like display format used as an alternative to the Model View. This is valuable for displaying large numbers of objects or business-related textual objects, such as business rules. Grid Editor content can be printed or exported as a report in CSV, HTML, PDF, and RTF formats.
Displaying and Editing Information in the Grid Editor
For purposes of this evaluation guide, we are going to open the grid editor of the business process diagram we created earlier.
1. In the Model View, right-click the diagram node labeled Order Picking and select Grid Editor…. The grid editor opens as a tabbed view.

-42-
©2007, Embarcadero Technologies, Inc.
The grid editor lists all elements in the diagram and is categorized by object type. Each element displays the object type, the name, a description field, and a notes field.
You can edit the name, description, and note for each record in this view by clicking once on the text in the cell. You can copy and paste text in the Description or Notes fields from another application such as Microsoft® Word.
Open the property view for each record by selecting a record and pressing Alt+Enter. You can then edit the properties, view the impact analysis hierarchy, create a link, and create a usage.
Another example of a grid editor is displayed below. This example is a grid editor of a set of business rules which shows how large amounts of information are displayed making it easy to view and edit.
Using the Grid Editor for Entering Reference Objects Data
The Grid Editor provides a fast and simple means of entering large amounts of data for Reference Objects. In this example, we will be entering data for Business Rules.
1. Right-click the Stewards subnode under the Reference Objects node in the Model View. Select Grid Editor.
2. The Grid Editor opens showing “Order Clerk” in line one.
3. When you select line two, the Name cell becomes editable. Enter the name “Processing Clerk” and tab to the Type cell.
4. Select “Individual” from the drop-down list available and click in the Description cell.
5. Enter the text “The Processing Clerk works with the Order Clerk”.
-43-
©2007, Embarcadero Technologies, Inc.
6. Tab to the Notes column and enter the text “Job responsibilities for the Processing Clerk”.
7. Tab one more time and a new row is automatically created where the Name cell is editable. Note also that a Steward labeled “Processing Clerk” now appears in the Model View under the Steward node.
8. You can quickly navigate through the rows of data. Each time you press Enter you advance down one row. When you reach the last row, you are returned to the first row.
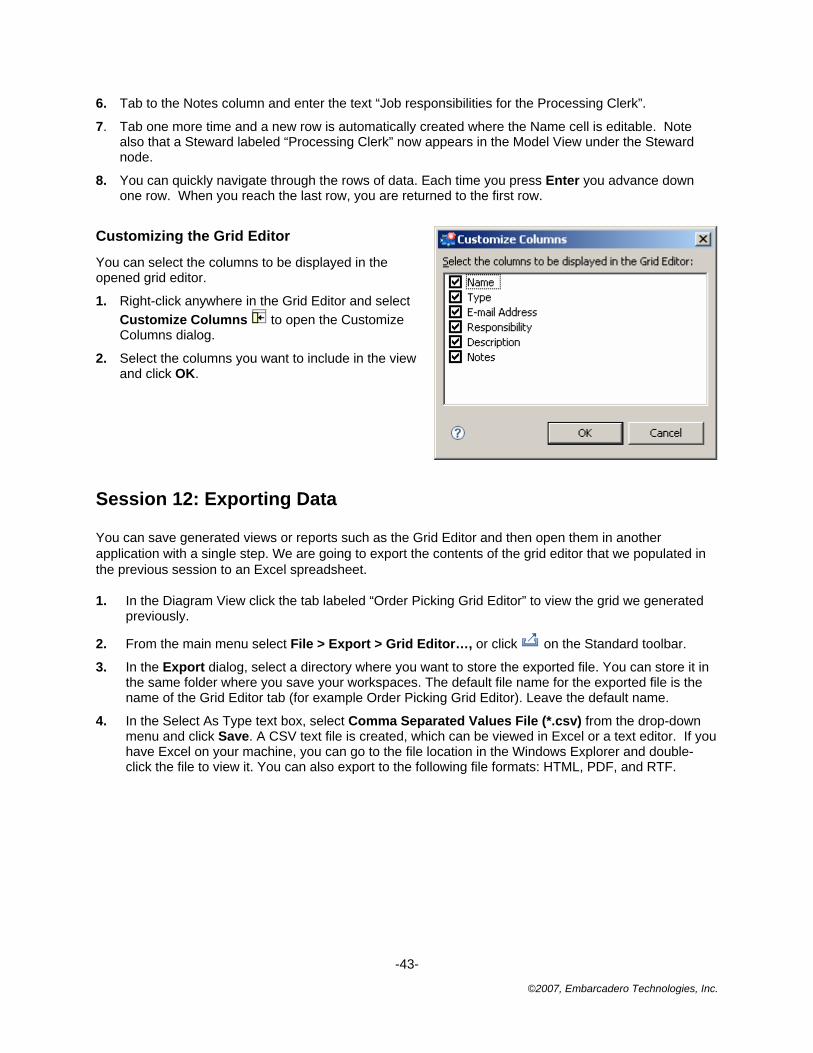
Customizing the Grid Editor
You can select the columns to be displayed in the opened grid editor.
1. Right-click anywhere in the Grid Editor and select Customize Columns to open the Customize Columns dialog.
2. Select the columns you want to include in the view and click OK.
Session 12: Exporting Data
You can save generated views or reports such as the Grid Editor and then open them in another application with a single step. We are going to export the contents of the grid editor that we populated in the previous session to an Excel spreadsheet.
1. In the Diagram View click the tab labeled “Order Picking Grid Editor” to view the grid we generated previously.
2. From the main menu select File > Export > Grid Editor…, or click on the Standard toolbar.
3. In the Export dialog, select a directory where you want to store the exported file. You can store it in the same folder where you save your workspaces. The default file name for the exported file is the name of the Grid Editor tab (for example Order Picking Grid Editor). Leave the default name.
4. In the Select As Type text box, select Comma Separated Values File (*.csv) from the drop-down menu and click Save. A CSV text file is created, which can be viewed in Excel or a text editor. If you have Excel on your machine, you can go to the file location in the Windows Explorer and double-click the file to view it. You can also export to the following file formats: HTML, PDF, and RTF.

-44-
©2007, Embarcadero Technologies, Inc.
Session 13: Importing Visio Models You can import Microsoft Visio diagrams into Business Process and Conceptual models. When you import a Visio model, the wizard walks you through the creation of a model and associated diagrams. A diagram is created for each page in the Visio model. A mapping table lists the Visio objects and the corresponding EA/Studio objects. You can also create and save user-defined mappings.
Note: You must have the Visio application installed on your computer to import a model.
1. From the main menu select File>Import>Microsoft Visio Model... to open the Microsoft Visio Import Wizard.
2. Browse to the folder where your existing Visio models are stored and select the model you want to import. For this part of the Evaluation Guide browse to …\EAStudio1.5\samples\ Visio Models\ and select the CreditApplicationProcess.vsd. Click Open to accept your selection and close the Browse dialog.
Note: Make sure that the diagram you are importing is closed in Visio.
3. Select “Business Process” as your model type and click Next to advance to the Model and Diagram Details dialog.
4. You can rename the model in the Model Name text box. We will leave the default name, which is Visio’s file name of “Credit Application Process”.
5. You can create the model in the opened workspace, project, or model. In the hierarchy, click on the node “Shipping Process Model”.
6. In the Diagram Options section, a diagram is created for each page of the Visio model. The Page name that appears is based on the page name in Visio. In this example there are two pages: “Customer Loan Application Process” and “Lender Loan Application Process”. You can edit the default names.

-45-
©2007, Embarcadero Technologies, Inc.
7. When you click Next the Mapping Visio Objects to EA/Studio Objects panel opens. The table lists the Visio object types and their corresponding EA/Studio object type.

-46-
©2007, Embarcadero Technologies, Inc.
Creating Custom Mappings
You can create and save user-defined mappings for Visio object types in the Mapping dialog.
1. Select the Visio Object Type “Event”.
2. Click the corresponding EA/Studio Object Type and a drop-down list box opens. (You can also press F2.) This list box contains all supported Modeling elements, Reference Objects, External Data Objects, as well as the settings “Default” and “None”. Select the item “Data Feed”.
Note: If you want to restore the original mappings, click the Restore Default Objects Mapping icon
( ).

-47-
©2007, Embarcadero Technologies, Inc.
3. To save your settings, click to open the Save Mappings dialog. Enter the name you want to use for the saved mappings, which will be saved as an XML file. Name the file “Loan Process” and click Save.
Note: If you want to use the custom mappings for your next Visio import, click Use Custom Object Mappings on the Mapping Visio Objects to EA/Studio Objects panel of the wizard. The Mapping File Location and Browse options are made available.
Instance-Level Mappings
You also have the ability to map each individual object in the Visio model. It is important to note that these Instance-level mappings are not saved as part of the custom mapping file and are used for this import only. You will get an “Unable to Save Instance-Level Mappings” warning dialog when you click Save.
1. Click next to the Visio Object type “Terminator” to display the individual objects.
2. Select the Visio Object type “Unnamed” and click “End Event” to open a list box.
3. Select “Off-Page Connector” from the list box which is now displayed in the EA/Studio Object type. This mapping will be used in the import process.
Note: You can set a preference to either retain Visio element sizes or use EA/Studio’s default sizes.
4. Click Finish and the Importing Visio Objects message box opens. Click OK to view the imported models in the Diagram View area. In the Model View, the imported diagrams are listed with all associated elements listed as subnodes. Click the Customer Loan Application tab in the Diagram View area to open the imported diagram.

-48-
©2007, Embarcadero Technologies, Inc.
Session 14: Importing Comma Separated Value (CSV) Files You can import large amounts of data into EA/Studio using the CSV import wizard. You can include Business Elements, Business Entities, Business Rules, Business Units, Stewards, Subject Areas, Domains, and Tasks. Using pre-existing templates you can input data into a comma separated value file and then import it into the application.
Templates exist for each object and are available in x:\Program Files\Embarcadero\ EAStudio\ samples\CSV\Templates. You can open these templates in Microsoft Excel or a text editor to enter data.
1. On the main menu, select File>Import>Comma Separated Values (CSV)… and the CSV Import Wizard opens.

-49-
©2007, Embarcadero Technologies, Inc.
2. Select “Business Elements” from the list of available object types.
3. In the Location text box browse to … EAStudio1.5\Samples\CSV\Data\Waterfront Bank\Waterfront Business Elements.csv and click Open.
4. You can import CSV files with or without headers. If the file you are importing has headers, keep the “First line in file is header” option selected.
Note: If this option is not selected and your file has headers, your first row will be imported as data. For example if your headers were Name, Data Type, Description, and Notes, when the file is imported, your first row of data would be the Name, Data, Type, Description and Notes. This may cause errors because the import values will be invalid.
5. Click Next and the Possible Duplicate Elements dialog opens informing you that the target project contains existing elements. You have two options: create a new Business Element with a unique name or update the existing business element. We will select the first option.
6. When you click Next an Import Summary dialog opens displaying all the records that have been imported.

-50-
©2007, Embarcadero Technologies, Inc.
7. Click Finish and a CSV Import Complete notification dialog opens telling you how many elements
were created in EA/Studio.
8. If you are importing reference objects, once you close the notification dialog, the imported elements are placed under the appropriate Reference Object node in the Model View. In our example, nine imported elements were placed in the Business Elements node.
9. If you are importing Subject Areas, Tasks, and Entities, they are placed in a model. You are prompted where to place them on the Model and Diagram Selection panel of the Import Wizard. You can also select the option to create the imported element on either a new or existing diagram.

-51-
©2007, Embarcadero Technologies, Inc.
Session 15: Creating Links and Impact Analysis Diagrams When you create a link, you create a generic relationship between elements that can indicate impact, association, etc. A Link is a generic, user-defined relationship that is used to simply relate objects together. However, a link is not associated with a formal modeling notation—thus you are free to use it to connect any objects within EA/Studio.
A common usage would be to show and relate stewardship with a given task or table. Once you have created these links, you can view an Impact Analysis report showing the interrelationships.
Creating a Link
We are going to link a table we imported from the ER/Studio sample model to the “Check Order” task we created in our Business Process diagram.
1. Click the Order Picking tab in the Diagram View to display the diagram you created. (If this diagram is no longer open, double-click the Order Picking node in the Model View.)
2. Right-click the task labeled Check Order, select Links>New… and the Create Link Wizard opens.
3. In the Target elements list box expand the Entities subnode in the External Data Objects node and select Suppliers.
4. We will specify the following details for a new link in the Create Link dialog:
Name Name the link Check Order Supplier Link
Verb Phrase Type a verb phrase that describes the relationship from the perspective of the target. Enter the text SUPPLIER validates ORDER.
Inverse Verb Phrase Type an inverse phrase that describes the relationship from the perspective of the element to be linked to. Enter the text ORDER is validated by CUSTOMER.
Description Enter any descriptive text you wish here.
Notes Enter any descriptive text you wish here.

-52-
©2007, Embarcadero Technologies, Inc.
5. Click OK and the Create Wizard dialog closes.
6. Right-click in the diagram and select Connections>Show>Links. The link you just created is then displayed in the Order Picking diagram.

-53-
©2007, Embarcadero Technologies, Inc.
Impact Analysis Diagram
An Impact Analysis Diagram is a way to visually represent the linkages that have been created between objects. These diagrams are automatically generated based on the link-related metadata.
1. To create an Impact Analysis Diagram right-click the Suppliers node in the External Data Objects node in the Model View.
2. Select Impact Analysis>Generate New Diagram. A diagram is created as a tabbed view in the Diagram View area and is named “Impact Analysis for Suppliers”.
3. To display the all the information on the link, right-click the link and select Show. A list of all available labels is available on the pull-right menu.

-54-
©2007, Embarcadero Technologies, Inc.
The following graphic shows a diagram where all available labels were selected.
The created Impact Analysis diagram also appears in the Model View.
You can view your Impact Analysis Diagram in a grid view.
1. Right-click in the background of an opened Impact Analysis Diagram or right-click on the Impact Analysis Diagram in the Model View.
2. Select Grid Editor.... The information now appears in a grid format with full editing capabilities.

-55-
©2007, Embarcadero Technologies, Inc.
Updated an Impact Analysis Diagram
Instead of generating a new Impact Analysis diagram each time you add links or usages, you can refresh or update your existing diagram to show new connections.
1. In the Diagram View area, click the “Impact Analysis for Suppliers” tab to open the diagram.
2. Right-click in the background of an existing Impact Analysis Diagram in the Diagram View and click Update Impact Analysis. You can also right-click the Impact Analysis diagram node in the Model View and click Update Impact Analysis.
3. The diagram is updated with any changes you have made.
Note: This menu option is available only if the Impact Analysis diagram is open and is selected on the Model View.
Session 16: Creating Usage Relationships When you create a usage, you create a generic relationship between elements that can show the relationships between data and process for Usage (CRUD) Reporting.
A Usage denotes a usage association, with attributes to represent whether the usage is Created, Read, Updated, and/or Deleted. Once you have created these usages, you can view the Usage (CRUD) reports showing the interrelationships.
Creating a Usage
We are going to show a usage between tasks and external data objects in a Business Process diagram.
1. Double-click the diagram “Order Picking” under the Shipping Process Model node to open the diagram.
2. From the External Data Objects palette click the Data Store object ( ) and place in above the Check Inventory task on the diagram and label it “Inventory Database”.
3. From the same palette click the Report object ( ) and place it above the Check Order task on the diagram and label it “Existing Orders”.
4. For our last object, click the Table object ( ) and place it above the Confirm Order Pull task on the diagram and label it “Orders Pulled”.
5. Right-click on the task “Check Inventory” and select Usage (CRUD)>New… to open the Create Usage wizard.
6. In the Target elements list box expand the Data Stores node under the External Data Objects node, and select “Inventory Database”.

-56-
©2007, Embarcadero Technologies, Inc.
7. For now, we will leave the Usage properties as selected and will edit them later. Click OK to close the wizard.
8. Repeat this procedure to create usages between the task “Check Order” task and the data feed “Existing Orders” and between the task “Confirm Order Pull” and the table “Orders Pulled”.
9. Right-click in the diagram and select Connections>Show>Usages. The Usages you just created are then displayed. Notice that the usages are automatically labeled.

-57-
©2007, Embarcadero Technologies, Inc.
10. In the diagram, double-click the Task labeled “Check Inventory” to open the Property View. Select the Usage (CRUD) tab to view the Usage information.
Note: By using the buttons located at the bottom of this panel, you can add, edit, or delete usages. You can also print, export, and show selected usages in the diagram.

-58-
©2007, Embarcadero Technologies, Inc.
11. We need to edit the Usage settings for each Receiver. Select “Inventory Database” and click in the Usage cell. Change the Usage setting to R. Note: This cell only accepts the C, R, U, D entries. All other text entries are ignored.
12. Using the same steps, change the “Existing Orders” Usage setting to R, and the “Orders Pulled” Usage setting to U. Notice that the diagram has been updated with the changes as well.
13. Your completed diagram should resemble the following:
Session 17: Using the Web Report You can create a Web report which gives you the ability to visually explore your EA/Studio projects, models, diagrams, and elements via the web browser.
1. From the main menu select Tools>Reports>Web Report… and a Web Report wizard opens. All nodes in the open workspace are selected. For purposes of this example, we will leave it as is.
2. Click Next to open the Object Type Selection dialog. Deselect the Shapes objects to exclude them from the report and click Next.
3. On the Select Report Location dialog select the directory where you want the generated report to be stored. Leave the default setting. The “Launch report upon completion” option is selected by default. Leave this setting as is, and click Next.

-59-
©2007, Embarcadero Technologies, Inc.
4. Click Finish and an HTML report is generated for all your selected items. The first page of the report displays a cover sheet with your report details. A tree containing the workspace and all projects, models, diagrams, and all elements in the workspace is displayed on the left side of the report.
Note: You may get a security message telling you that your computer is blocking access to active content files. Click once in the yellow bar with the warning icon ( ) and select Allow Blocked Content from the menu. Click Yes once again to close the Security Warning dialog.
5. You can view properties of objects by expanding the tree and clicking on the object. If you click on a
diagram node, the graphical representation of the diagram opens in the browser.
6. If you click on an object, for example the “Customers” Business Entity object, two tables are generated, one showing the details; and the second showing the attributes in that Business Entity.
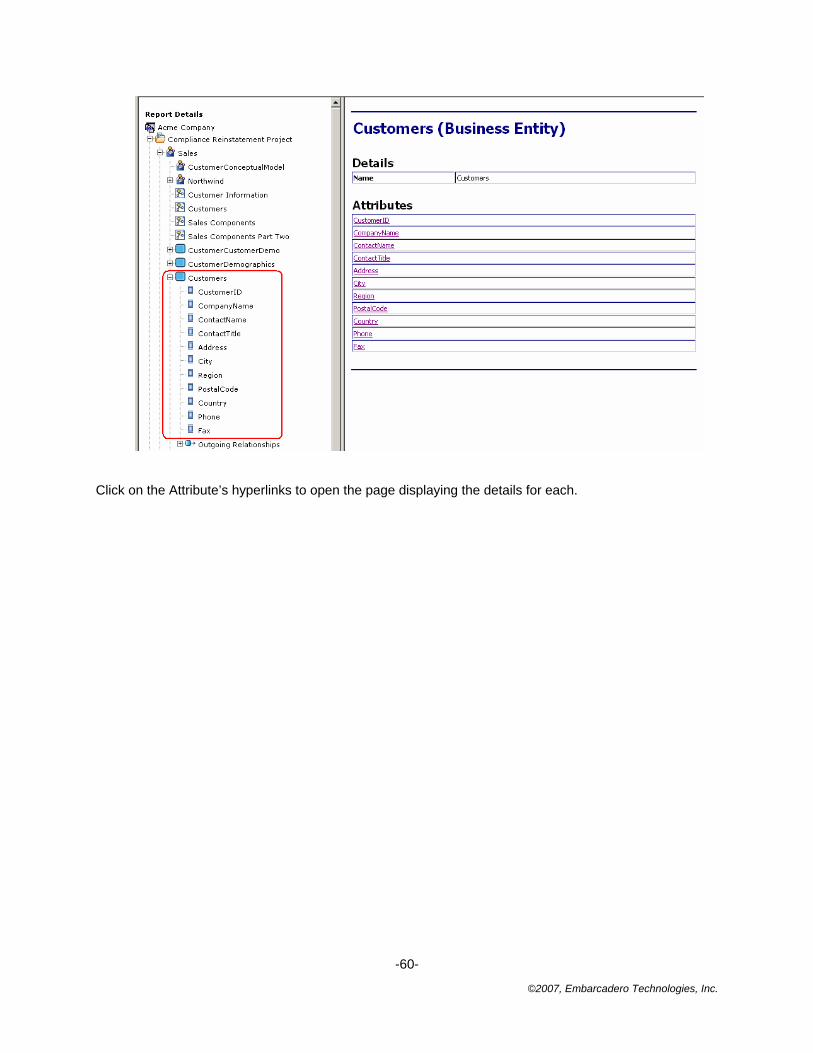
-60-
©2007, Embarcadero Technologies, Inc.
Click on the Attribute’s hyperlinks to open the page displaying the details for each.

-61-
©2007, Embarcadero Technologies, Inc.
Session 18: Using EA/Studio Tools As you work on your diagrams, EA/Studio offers many tools that make is easier to find elements, navigate, and customize your diagrams.
Find and Search
You can search for objects in your diagrams as well as searching for elements in an entire workspace.
Find in Diagram
When a diagram is active and open, a command appears under the Edit menu called “Find in Diagram”.

-62-
©2007, Embarcadero Technologies, Inc.
Once selected, a Find dialog opens allowing you to enter a name to find on the diagram.
The Find mechanism only searches for element names on the active diagram. When an element is found on the diagram, it is selected on the diagram. Direction controls allow you to navigate throughout the list of matching names on the diagram.
Search
The Search function works differently than Find in Diagram, as it searches the entire workspace and then provides a list of the objects that were found. It searches the data itself, not the element in the diagram.
To perform a search, select the ‘Search…’ menu under Edit:

-63-
©2007, Embarcadero Technologies, Inc.
You can search an entire workspace, or specific projects and models. You can also search on Names, Descriptions, or Notes. The search can be limited to specific types of objects and you can match case and whole words. In the example below we are going to search for a pool with the word “Order” in the name.

-64-
©2007, Embarcadero Technologies, Inc.
After you click the Find button, a Search view appears with all the elements that matched the search. From this view, there are several toolbar buttons available which will assist in locating the element in active diagram, all diagrams, or the model view. There are also toolbar buttons to modify the search and filter out the results.
Element Grouping
This feature provides the ability to group elements together into a single entity that can be moved around a diagram in the Diagram View. Once items are grouped, a bounding box appears around the group items. The grouped elements move together in a block and are essentially “locked” together, movement-wise. The Ungroup feature removes the grouping and allows the elements to be moved separately again.
1. Select the elements you want to group by clicking and dragging a box around the selected items. You can also select each item by doing a Ctrl+click on each element in the diagram.
2. Right-click in any of the selected elements and select Grouping>Group. This command is also available on the Alignment and Layout toolbar and on the Format main menu.
3. A bounding box appears around the selected elements.
4. Place the cursor on the bounding box and the cursor changes to the move cursor ( ).
5. Hold down the left mouse button and move the grouped items in the diagram.

-65-
©2007, Embarcadero Technologies, Inc.
Note: You can move elements within the bounding box. Click on the element you want to move and handles appear around the element. You can then move the selected element within the box.
Diagram Commands
There are four commands available under Diagram on the main menu that you can use to customize your diagrams:
Case Shift You can set the default case shift for all element labels. You have three options: Lower: All text appears in lower case lettering, including the initial letter of the label. Preserve: Text appears as entered. Upper: All text appears in upper case lettering.
Grid When working in the Diagram View you have the option to display grid lines in the view. You also can ‘snap objects to grid’ so that when you place an object in the Diagram View, it automatically snaps to the nearest grid line. When an element is moved, it also snaps to the nearest grid.
1. With a diagram open in the Diagram View, select Diagram > Grid > Show Grid Lines from the main menu.
2. Select Diagram > Grid > Snap Objects to Grid to activate this feature. This feature is active even if the grid lines are not displayed.
Layout You can set what type of connection style you want to use: curved, straight or elbowed. The default setting is curved. When you change this setting to straight you get a Change Diagram Layout dialog, warning you that this selection overrides any changes you have made to individual relationships.
Connections Show or hide all connections: associations, interactions, line shapes, links, message flows, relationships, and sequence flows. The available items on the list depend on the type of model, either Business Process or Conceptual.
Zooming
From the main menu select View>Zoom Level to adjust the zoom level of any diagram. You have several different options available:
Fit to page: Zoom level is reduced in the Diagram View so that the entire diagram fits in the visible screen area.
Custom Zooming: Lets you custom zoom into and out of any Diagram window by specifying a zoom
percentage on the custom toolbar . The custom zoom feature lets you type a specific zoom percentage.
Zoom with preset percentages: You can enlarge or reduce a diagram using a preset percentage.
Toolbars
Layout and Alignment
Use this toolbar to align, evenly distribute, evenly size, stack, or group the elements in a diagram.

-66-
©2007, Embarcadero Technologies, Inc.
Formatting Toolbar
Use this toolbar to: (1) select font style and size; (2) format and justify text, (3) change the colors of both elements and text; and (4) align text in an element.
Overview Window
This is a ‘thumbnail’ view of your model and is useful when working with large diagrams that appear on more than one screen. You have the ability to pan the entire model. As you move the blue shaded box in the Overview window, the portion in the highlighted area appears in the Diagram View. Also, if you click an object in the Overview pane, that object appears in the Diagram View.
For large diagrams, the Overview window is a much more powerful navigation tool than using a combination of EA/Studio scroll bars and zoom features.
Summary
This completes the EA/Studio Evaluation Guide. For more information please refer to the online help in the application.

-67-
©2007, Embarcadero Technologies, Inc.
Additional Evaluation Resources Embarcadero Technologies provides a variety of resources to help support your evaluation and selection of a Data Modeling product for your organization.
Web site
Visit our Web site for current product and company information, educational materials and supporting information. Visit www.embarcadero.com.
Electronic Documentation
Detailed reference documentation is available on the EA/Studio Evaluation CD or online at www.embarcadero.com/support
Email Support
You can contact EA/Studio support engineers, consultants and engineers directly by sending inquiries to [email protected] or log a case through embarcadero.com at: http://www.embarcadero.com/support/open_case.jsp
Telephone Support
We encourage you to call us anytime you would like help or have questions during your evaluation. Please call 415.834.3131 ext. 2, Monday to Friday, 6:00am - 6:00pm PST, Saturday and Sunday, 8:00am - 5:00 PST.

-68-
©2007, Embarcadero Technologies, Inc.
Glossary Binding
Instantiate an instance of an object from a “parent” object instance to enforce standards based on the source element/domain. Bindings are used to enforce standards for Naming, Data Types, Definitions, etc. For example, Business Attributes can be “bound” to a business element to enforce naming standards.
Business Elements A singular element of the business that can be bound to different business attributes across conceptual models. Can be used to seed business attributes in a business entity.
Business Process Models A Business Process Model is a network of graphical elements, which track the flow of activities and their order of execution.
Business Rules A Business Rule is a policy, practice, or formula related to the operation and enforcement of business practices.
Business Units Business Units are organizational areas within or external to an enterprise, for example, Human Resources, Sales, Accounting, etc.
Conceptual Model Conceptual Modeling allows Business Users to create high-level designs of the core “concepts” and subject areas that drive the business, which can be passed onto data and process modelers to drive more detailed logical and physical design.
Domains Domains are reusable attribute templates that promote consistent domain definitions. You construct domains as you would attributes, specifying a name, datatype properties, null status, default values, and validation rules.
Link A user-defined association
Mapping Defines the transformation/association/semantic link between model layers. For example: CDM->LDM->PDM. In the ER world, we would say that a logical entity is “mapped” to a physical table when a Logical Model is forward engineered to create a physical model.
Object An object is a generic term for items or elements that make up business processes and conceptual models: tasks, swimlanes, gateways, flow objects, business entities, business attributes, etc.
Stewards Stewards are people or organizations responsible or associated with model elements, for example: DBA, Auditor, Jeffrey Smith, etc.
Usage You can show the create, read, update, or delete database attributes on a connection. When this connection is created they are labeled with the attributes you selected at the time of creation. These elements can consist of reference objects, data objects, and elements within a diagram.