Embed Size (px)
Citation preview

1
EASTLEIGH LOCAL AREA COMMITTEE
20 March 2018
EASTLEIGH AIR QUALITY MANAGEMENT AREA ACTION PLAN
- UPDATE
REPORT OF THE ENVIRONMENTAL LEAD SPECIALIST
Recommendation
It is recommended that the Eastleigh Local Area Committee note the update provided.
Summary
Following the January 2015 ELAC a request was made for regular updates on progress with the Eastleigh Air Quality Management Area Action Plan. This report gives this update and identifies key issues at the current time.
Statutory Powers
Environment Act 1995, Part IV
Air Quality Strategy for England 2007
Air quality plan for nitrogen dioxide (NO2) in UK (2017)
Introduction
1. All ‘District’ Councils have a duty to carry out reviews and monitor current and future air quality within their area and take action where objectives are being breached. Areas which exceed pollutant objectives must be designated as an Air Quality Management Area (AQMA) and a 5 year Action Plan produced.
Background
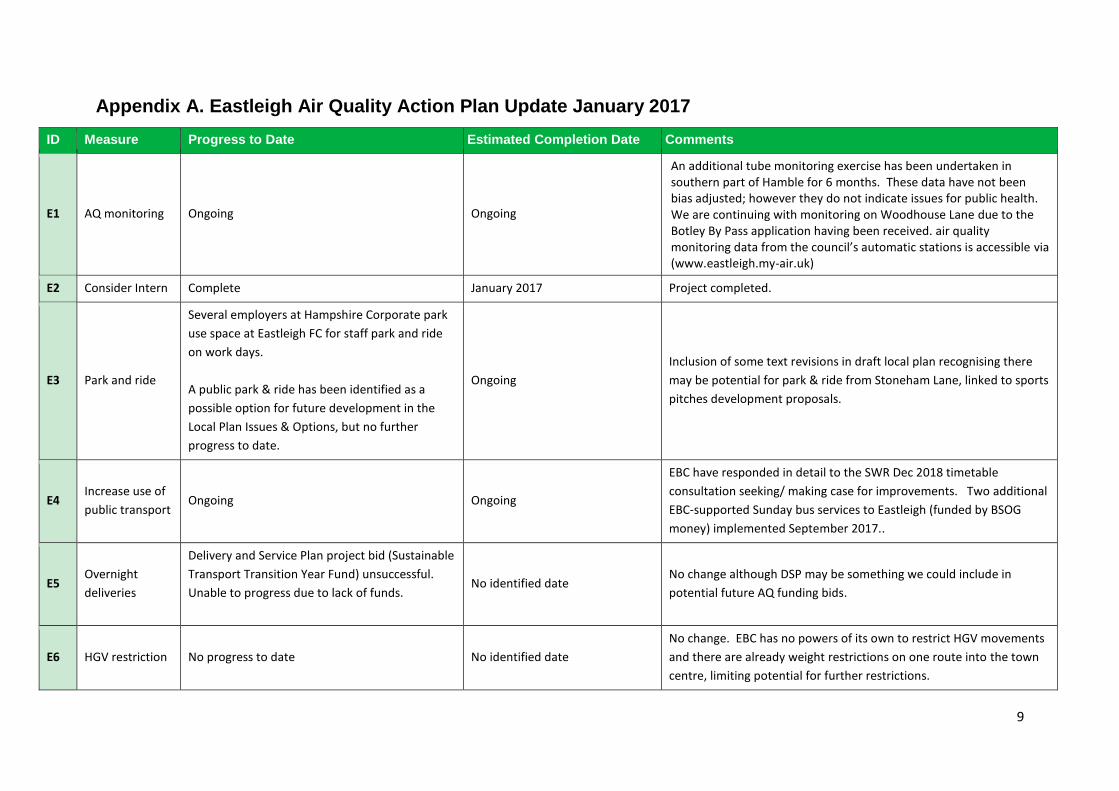
2. An update for the Eastleigh Air Quality Action Plan is provided in Appendix 1. This gives an overview of the progress and activity in support of the action plan to date.
Activity since the last update report
3. Looking specifically at actions carried out in support of the Eastleigh Air Quality Action Plan and other activities the Council has undertaken with respect to air quality in Eastleigh, the following should be noted:
2
4. The joint bid to provide financial support to replace older, more polluting taxis in Eastleigh and in partnership with Southampton City Council has been successful and was approved by Defra’s Joint Air Quality Unit. A sum of £350,000 was approved in February 2017. This will be spilt approximately 2:1 between Southampton and Eastleigh, this reflects the size of the taxi fleets and expected demand. The scheme will be administered by Southampton Licensing Team as they currently manage the taxi licensing for both authorities. A number of events have been held to seek the views of the taxi operators and to publicise the scheme, a survey in July / August 2017 seeking the views of taxi operators, and an update seminar was held in December. To date there has been one grant awarded for an Eastleigh based taxi (a Euro 5 diesel replaced with a petrol electric hybrid vehicle). The scheme is to be further publicised with information on the licensing website, leafletting of taxi stands across the two authorities and further forums.
5. The scheme provides eligible operators of Hackney Carriages and Private Hire vehicles with financial incentives to purchase low emission vehicles to replace eligible higher emission taxis in their current fleets, and to retain these for at least three years. This is beneficial for air quality as taxi’s drive more miles than the average vehicle and more frequently within the built up area, and the nature of the journeys mean taxis stop and start more frequently which can result in higher pollutant emissions and contribute proportionally more to local air pollution. Eastleigh’s fleet of private hire and hackney carriage taxis are responsible for approximately 3 tonnes of NOx emissions per year. We estimate that the vehicle replacement scheme can reduce this value by approximately 23.5%. Furthermore, increased uptake of low emission vehicles will reduce emissions that arise from burning fossil fuels including carbon dioxide.
6. The airAlert service has continued to operate since its launch in October 2016. There are now 450 active subscribers across both Eastleigh and Southampton who receive our free alerts of potential air pollution events ahead of time. The chart below shows the uptake of the service by age. It has reached older groups most successfully with 78% of subscribers aged 46 or older. Clearly we need to focus on how we can reach younger age groups who whilst they may be (or be perceived to be) ‘healthier’ are also susceptible to poor air quality, especially younger children. (See next item). The service is designed to help those with health problems effectively manage their condition. It is also a tool to help raise awareness of air quality in general and encourage more sustainable and active forms of travel. (www.airalert.info/hants).

3
7. Since November 2017 we have been working with Hampshire County Council Schools Travel Planning Officer to promote awareness and understanding of the issues around air pollution with school children across the Borough, in Eastleigh this has included The Crescent Primary school which is just off Leigh Road and adjacent to the Eastleigh Air Quality Management Area, AQMA. The children have been, and continue to, monitor air pollution using tubes provided by EBC, and now they are working to plan their own Air Quality (AQ) Campaign that will inform people about air pollution and the problems associated with it, and persuade them to change their behaviour to help to improve air quality.
8. Eastleigh Borough Council’s my-air webpage contains the results of continuous and monthly monitoring data (www.eastleigh.my-air.uk). It is a simple and accessible way for members of the public to view and explore the data produced by the Council’s air quality monitoring network.
9. In December 2017 we started working with a local business Iknaia to help the trial new low cost technology to measure vehicle speeds and numbers and to monitor air quality. Sensors have been located within the Eastleigh AQMA at The Point and Eastleigh House. The objective of the project is to see how well their pollution monitor performs when compared to the laboratory standard equipment that we operate, and to look to see how pollution levels relate to traffic counts and average road speeds recorded. When we have the results of this study we will update the committee.
10. Air quality monitoring data for the three automatic monitoring stations in Eastleigh for 2016 can be found in appendix 2. The Council currently monitors

4
nitrogen dioxide (NO2) and particulate matter which is 10 micrometres or less (PM10) concentrations in Eastleigh. In summary:
Site Pollutant Air Quality Objective
Measured as
Value or Exceedances*
Objective Achieved
Southampton Road
NO2 40 µgm-3 Annual Mean
37 µgm-3 Yes
Southampton Road
NO2 200 µgm-3 not to be exceeded more than 18 times per year
Hourly Mean
4 Exceedances Yes
Southampton Road
PM10 40 µgm-3 Annual Mean
24 µgm-3 Yes
Southampton Road
PM10 50 µgm-3 not to be exceeded more than 35 times per year
Daily Mean 0 Exceedances Yes
Steele Close NO2 40 µgm-3 Annual Mean
27 µgm-3 Yes
Steele Close NO2 200 µgm-3 not to be exceeded more than 18 times per year
Hourly Mean
0 Exceedances Yes
The Point NO2 40 µgm-3 Annual Mean
28.2 µgm-3 Yes
The Point NO2 200 µgm-3 not to be exceeded more than 18 times per year
Hourly Mean
0 Exceedances Yes
* This data is provisional and can therefore only offer an indication to the year’s results.
11. The Environment Specialist Post which replaced the Scientific Officer Post with a focus on air quality, is currently vacant.
12. We are continuing to engage with Southampton City Council, SCC with regards to their introduction of a Clean Air Zone in the City as part of Defra’s plans for improving air quality in the UK. A Clean Air Network was launched in February 2018, which will be run by the Environment Centre, a local environmental charity, who will work with a network of organisations including businesses, charities, educational institutions and many others from across Southampton to form a partnership called Clean Air Network (CAN). Together this group is committed to doing what it can to reduce levels of air pollution in the city through changes in personal and organisational actions, encouraging all those who they meet and do business with to do the same, and by actively supporting each other to find ways that help to improve air quality in the city. This network will extend to and work with, neighbouring authorities, including Eastleigh.

5
13. SCC have also been successful in attracting funding from the Clean Bus Technology Fund to the tune of £2.6M to retrofit around 145 buses with pollution abatement equipment which will reduce each buses emissions of nitrogen oxides by 99%. Eastleigh will benefit from improved buses which operate out of the Hants and Dorset depot on Chickenhall Lane and which pass along Southampton Road within the Eastleigh AQMA every day.
14. Members have requested advice on what actions can be taken to reduce air
pollution levels within the Eastleigh AQMA as speedily as possible. Current guidance issued by the Govt. and its various departments and bodies have highlighted the following areas and actions to deal with air pollution, both in terms of reducing the levels of air pollution and in terms of reducing the exposure of the public. A list of the actions that may fall within a Clean Air Zone is given in Annex 3. The headline measures are as follows:
Planning and Development Management – promoting low emissions infrastructure, e.g. Electric Charging Points, minimising journeys, promoting alternate to car usage, siting sensitive new development away from busy roads, avoiding creating street canyons, promoting vegetation in open spaces Voluntary Clean Air Zone – restrictions on vehicle types (use of traffic orders), increasing parking charges for most polluting vehicles, reduce parking charges for ULEV vehicles, encouragement and promotion of walking and cycling and facilitating this. Encouraging low emissions deliveries, support for park and ride schemes, support for school and business Travel Plans, driver training and awareness schemes, Reducing emissions from Public Sector vehicles – training for staff that drive for work on fuel efficient driving, vehicles to display real time fuel efficiency data, Procurement – procuring low vehicle emissions, apply air quality criteria when assessing procurement decisions, including ULEVs Walking and Cycling – provide support for active travel; provide a choice of cycle routes avoiding highly polluted roads, improving cycle lanes on busy roads, use foliage to screen busy roads Awareness raising – work with health professionals to raised awareness and share information on air pollution, provide updates on air pollution through local media, consider initiatives such as Clean Air Day (21/6/18) or car free days,
Vulnerable Groups - Healthcare professionals should be aware of vulnerable groups who are particularly affected by poor outdoor air quality. When notified of poor outdoor air quality, during any contact with vulnerable groups healthcare professionals should give general advice on how to avoid

6
contributing to levels of air pollution and raise awareness of how to minimise exposure
15. Graphical information is presented in Appendix 4 showing the relative
contributions of vehicle types to road side air pollution and showing emissions by vehicle type and by engine type.
16. The only measure we are aware of at this time which could reduce air pollution levels along the AQMA at a stroke is the Chickenhall Lane Relief Road, at this time we are not aware of any funding available to implement this in the short term. The next most effective measure would be a charging Clean Air Zone as is being considered as part of the measures to reduce air pollution in Southampton and other large cities. However, this option is only open to nominated cities and areas, of which Eastleigh borough is not included, and then only allowable if a detailed assessment of all the other viable options to reduce air pollution have been considered and shown to be ineffective.
17. Current guidance issued by the Govt. and its various departments and bodies
have highlighted the following areas and actions to deal with air pollution, both in terms of reducing the levels of air pollution and in terms of reducing the exposure of the public. A full list is given in Annex 3. The headline areas of measures are as follows:
Planning and Development Management – promoting low emissions infrastructure, e.g. Electric Charging Points, minimising journeys, promoting alternate to car usage, siting sensitive new development away from busy roads, avoiding creating street canyons, promoting vegetation in open spaces Voluntary Clean Air Zone – restrictions on vehicle types (use of traffic orders), increasing parking charges for most polluting vehicles, reduce parking charges for ULEV vehicles, encouragement and promotion of walking and cycling and facilitating this. Encouraging low emissions deliveries, support for park and ride schemes, support for school and business Travel Plans, driver training and awareness schemes, Reducing emissions from Public Sector vehicles – training for staff that drive for work on fuel efficient driving, vehicles to display real time fuel efficiency data, Procurement – procuring low vehicle emissions, apply air quality criteria when assessing procurement decisions, including ULEVs Walking and Cycling – provide support for active travel; provide a choice of cycle routes avoiding highly polluted roads, improving cycle lanes on busy roads, use foliage to screen busy roads Awareness raising – work with health professionals to raised awareness and share information on air pollution, provide updates on air pollution through

7
local media, consider initiatives such as Clean Air Day (21/6/18) or car free days. Vulnerable Groups - Healthcare professionals should be aware of vulnerable groups who are particularly affected by poor outdoor air quality. When notified of poor outdoor air quality, during any contact with vulnerable groups healthcare professionals should give general advice on how to avoid contributing to levels of air pollution and raise awareness of how to minimise exposure
18. Looking at the above and the actions identified in Annex 1 and Annex 3 it can
be seen that we are already engaging with many of these activities. Without a ‘magic bullet’ to deal with air pollution at a stroke we will need to maintain this work and continue to do more to ensure that we bring down levels of air pollution to legal levels as quickly as we can. To focus our efforts we consider that detailed air pollution modelling and source apportionment work is carried out to ensure that we can correctly identify the actions that will give the best return in pollution reduction; this would also help shape action planning. The Govt have also signalled that they will look more favourably at those authorities that have adopted voluntary Clean Air Zones when evaluating bids for resources to tackle air apollution.
19. The following actions might be considered to bring about progress to reduce
air pollution more speedily:
a. Voluntary Clean Air Zone, V-CAZ: - multiple strategies across Eastleigh to
bring down air pollution and to reduce exposure and raise awareness of air
pollution, linked to existing Air Quality Management Area Action Plan and
supporting Local Plan and Corporate Plan policies. Cost: Mainly officer time
but would likely entail a considerable amount of it, so consider Intern Post
or similar to support / assist development.
b. Air quality Intern post funding: Assistance with funding a borough or LAC
wide post to support with monitoring and acting on CAZ and/or AQMA
Action Plan progress, implementation and development £5k.
c. Source apportionment: study of traffic passing through and in the
neighbourhood of the Eastleigh AQMA: vehicle fleet make up and relative
pollution emissions, qualitative / quantitative evaluation of mitigation options
This may be partially covered by Local Plan work in this area, so perhaps a
study designed to supplement the Local Plan work focussing more closely
on Eastleigh. £15k to £30k.
d. Delivery Service Planning – directed at businesses generating / receiving
large volumes of delivery vehicles through the AQMA, aim to reduce and
change activities to reduce emissions to air. Circa £6k each.
e. Support for Clean Air Day (21/6/18) or car free days.
f. Funding Electric Charging Points in the town Cost£???
8
g. Funding to support variable car parking charges - increasing parking
charges for most polluting vehicles, reduce parking charges for ULEV
vehicles. Cost£???
h. Identify and promote cycling and walking routes around the town avoid the
most heavily trafficked roads
Financial Implications
20. There are no direct financial implications of this report.
Risk Assessment
21. No direct implications of this report.
Equality and Diversity Implications
22. No equality and diversity issues are envisaged.
Conclusion
23. Eastleigh Borough Council continues to work towards the delivery of the Eastleigh AQMA Action Plan.
BRET WILLERS
ENVIRONMENT LEAD SPECIALIST
Date: 09 March 2018
Contact Officer: Neil Scott
Tel No: 023 8068 8304
E-mail: [email protected]
Appendices Attached: 4
LOCAL GOVERNMENT ACT 1972 - SECTION 100D
The following is a list of documents which disclose facts or matters on which this report or an important part of it is based and have been relied upon to a material extent in the preparation of this report. This list does not include any published works or documents which would disclose exempt or confidential information.
9
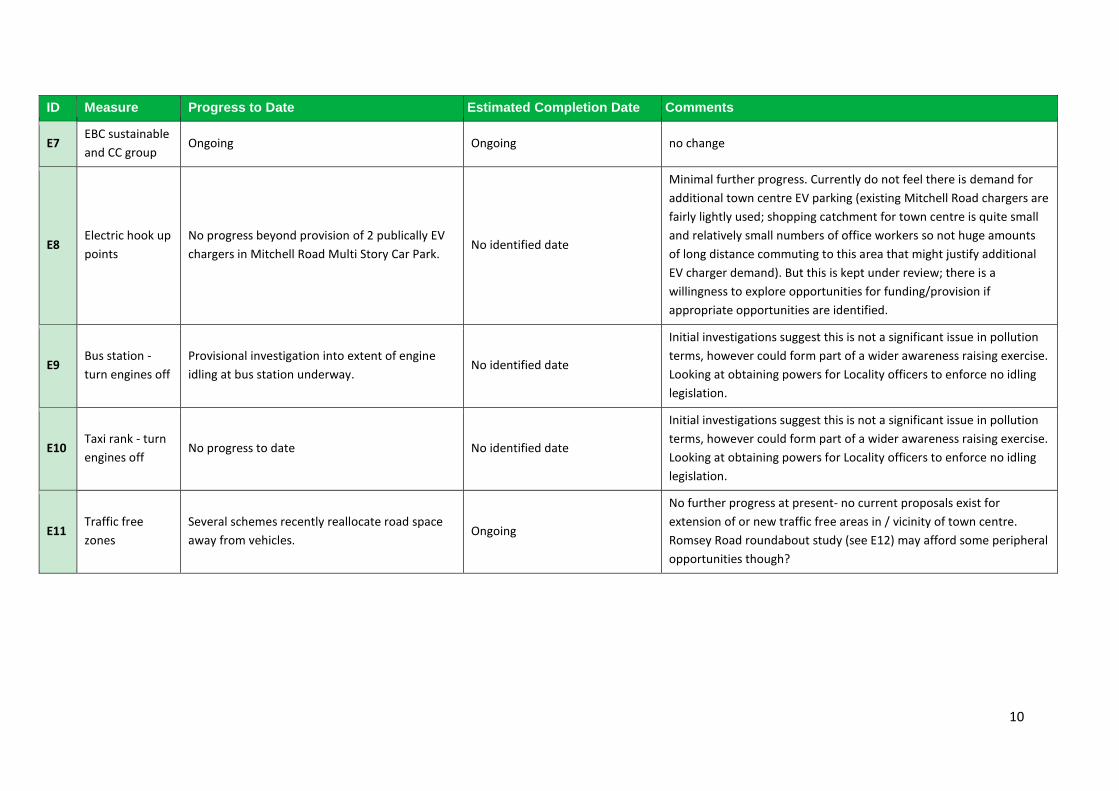
Appendix A. Eastleigh Air Quality Action Plan Update January 2017
ID Measure Progress to Date Estimated Completion Date Comments
E1 AQ monitoring Ongoing Ongoing
An additional tube monitoring exercise has been undertaken in southern part of Hamble for 6 months. These data have not been bias adjusted; however they do not indicate issues for public health. We are continuing with monitoring on Woodhouse Lane due to the Botley By Pass application having been received. air quality monitoring data from the council’s automatic stations is accessible via (www.eastleigh.my-air.uk)
E2 Consider Intern Complete January 2017 Project completed.
E3 Park and ride
Several employers at Hampshire Corporate park
use space at Eastleigh FC for staff park and ride
on work days.
A public park & ride has been identified as a
possible option for future development in the
Local Plan Issues & Options, but no further
progress to date.
Ongoing
Inclusion of some text revisions in draft local plan recognising there
may be potential for park & ride from Stoneham Lane, linked to sports
pitches development proposals.
E4 Increase use of
public transport Ongoing Ongoing
EBC have responded in detail to the SWR Dec 2018 timetable
consultation seeking/ making case for improvements. Two additional
EBC-supported Sunday bus services to Eastleigh (funded by BSOG
money) implemented September 2017..
E5 Overnight
deliveries
Delivery and Service Plan project bid (Sustainable
Transport Transition Year Fund) unsuccessful.
Unable to progress due to lack of funds.
No identified date No change although DSP may be something we could include in
potential future AQ funding bids.
E6 HGV restriction No progress to date No identified date
No change. EBC has no powers of its own to restrict HGV movements
and there are already weight restrictions on one route into the town
centre, limiting potential for further restrictions.
10
ID Measure Progress to Date Estimated Completion Date Comments
E7 EBC sustainable
and CC group Ongoing Ongoing no change
E8 Electric hook up
points
No progress beyond provision of 2 publically EV
chargers in Mitchell Road Multi Story Car Park. No identified date
Minimal further progress. Currently do not feel there is demand for
additional town centre EV parking (existing Mitchell Road chargers are
fairly lightly used; shopping catchment for town centre is quite small
and relatively small numbers of office workers so not huge amounts
of long distance commuting to this area that might justify additional
EV charger demand). But this is kept under review; there is a
willingness to explore opportunities for funding/provision if
appropriate opportunities are identified.
E9 Bus station -
turn engines off
Provisional investigation into extent of engine
idling at bus station underway. No identified date
Initial investigations suggest this is not a significant issue in pollution
terms, however could form part of a wider awareness raising exercise.
Looking at obtaining powers for Locality officers to enforce no idling
legislation.
E10 Taxi rank - turn
engines off No progress to date No identified date
Initial investigations suggest this is not a significant issue in pollution
terms, however could form part of a wider awareness raising exercise.
Looking at obtaining powers for Locality officers to enforce no idling
legislation.
E11 Traffic free
zones
Several schemes recently reallocate road space
away from vehicles. Ongoing
No further progress at present- no current proposals exist for
extension of or new traffic free areas in / vicinity of town centre.
Romsey Road roundabout study (see E12) may afford some peripheral
opportunities though?
11
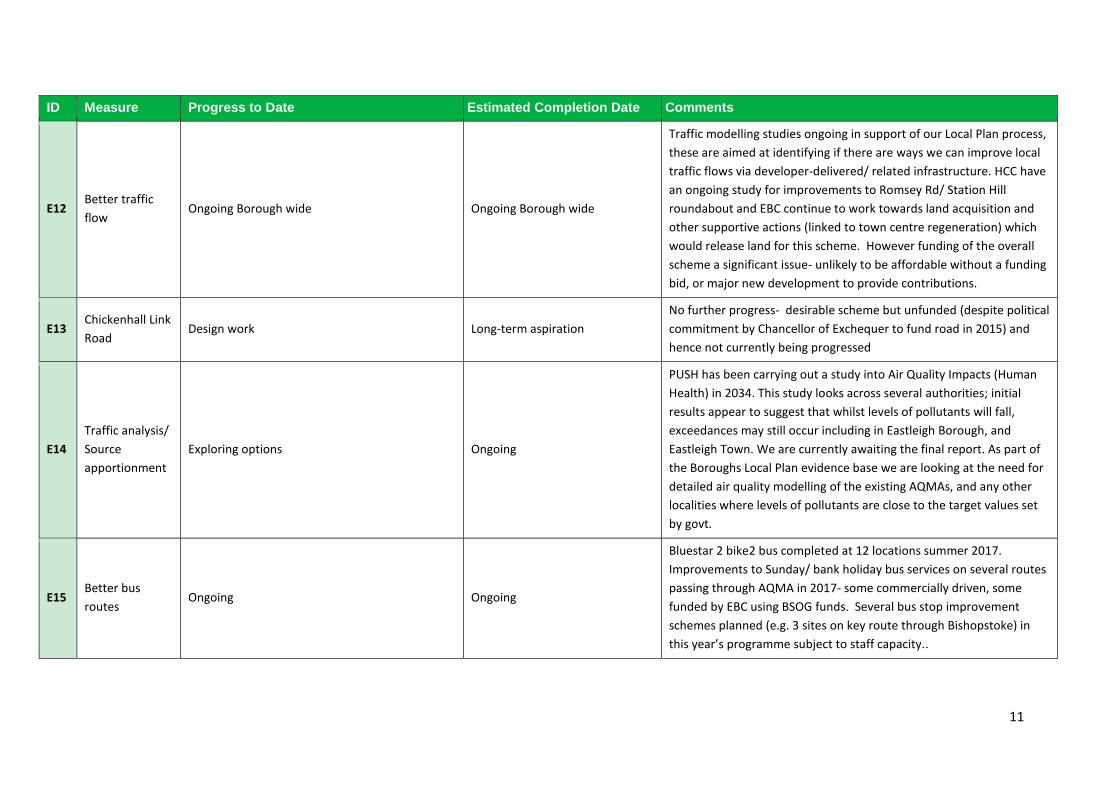
ID Measure Progress to Date Estimated Completion Date Comments
E12 Better traffic
flow Ongoing Borough wide Ongoing Borough wide
Traffic modelling studies ongoing in support of our Local Plan process,
these are aimed at identifying if there are ways we can improve local
traffic flows via developer-delivered/ related infrastructure. HCC have
an ongoing study for improvements to Romsey Rd/ Station Hill
roundabout and EBC continue to work towards land acquisition and
other supportive actions (linked to town centre regeneration) which
would release land for this scheme. However funding of the overall
scheme a significant issue- unlikely to be affordable without a funding
bid, or major new development to provide contributions.
E13 Chickenhall Link
Road Design work Long-term aspiration
No further progress- desirable scheme but unfunded (despite political
commitment by Chancellor of Exchequer to fund road in 2015) and
hence not currently being progressed
E14
Traffic analysis/
Source
apportionment
Exploring options Ongoing
PUSH has been carrying out a study into Air Quality Impacts (Human
Health) in 2034. This study looks across several authorities; initial
results appear to suggest that whilst levels of pollutants will fall,
exceedances may still occur including in Eastleigh Borough, and
Eastleigh Town. We are currently awaiting the final report. As part of
the Boroughs Local Plan evidence base we are looking at the need for
detailed air quality modelling of the existing AQMAs, and any other
localities where levels of pollutants are close to the target values set
by govt.
E15 Better bus
routes Ongoing Ongoing
Bluestar 2 bike2 bus completed at 12 locations summer 2017.
Improvements to Sunday/ bank holiday bus services on several routes
passing through AQMA in 2017- some commercially driven, some
funded by EBC using BSOG funds. Several bus stop improvement
schemes planned (e.g. 3 sites on key route through Bishopstoke) in
this year’s programme subject to staff capacity..

12
ID Measure Progress to Date Estimated Completion Date Comments
E16 Bus day ticket
for Eastleigh No progress to date No identified date
Solent go card provides framework for a day ticket for Eastleigh but
an Eastleigh area ticket would require considerable resource to set up
(especially regarding revenue sharing and commercial agreements
with bus operators).
E17 Cycle network
improvement Ongoing Ongoing
Work ongoing to deliver cycle infrastructure on various routes in
vicinity of AQMA. Hut Hill phase 1 still in HCC delivery plan (to be
delivered by EBC) for 2017/18, but being held up by an outstanding
land transfer). Study work on improvements related to development
on Stoneham Lane undertaken; this will lead to improved design of
some parts of developer-delivered cycle links in the area (to be
delivered in coming years). Bishopstoke Rd "missing link" - funding
identified and now working with HCC towards delivery of this key
missing section of route. Lakeside cycle route (related to south of
Chestnut Ave development)- design work being undertaken for
new/improved links in this area (for which funding is available). ..
E18 More secure
cycle storage No progress to date No identified date
Secure cycle storage at stations within the Borough has been removed
due to low usage.
Non-secure bike rack provision increased at stations, town centres
and bus stops but no provision of secure parking.

13
ID Measure Progress to Date Estimated Completion Date Comments
E19 Increase trees Ongoing Ongoing
Emerging Local Plan 2011-2036 Issues and Options document
identifies the need for ‘green infrastructure’, which encompasses the
provision of street trees. Eastleigh Railway station forecourt
improvements were accompanied by an increase in trees in the area.
Market Place public realm scheme which has retained trees as part of
a scheme to create more public space in the town centre. Latest
iteration of the Draft Local Plan proposes a 2 for 1 replacement policy
for lost trees.
E20 Improved eco
engines Ongoing Ongoing
Ultra-low emission taxi grant project (which we jointly secured £350k
for in Jan 2017 with SCC) launched with first grant issued in EBC
already. Further work to promote the scheme in plan.
We also supported Solent Transport in resubmitting a previous bid to
OLEV for ultra-low emission buses (at the request of OLEV) but this
bid was once again unsuccessful in securing funding..
E21 New improved
buses
OLEV funding bid for Euro VI hybrid buses
unsuccessful
Ongoing
Resubmission for funding from OLEV for ultra-low emission vehicles
for Bluestar 2 was unsuccessful. We also explored possible
participation in SCC bid to clean bus technology fund (October/
November 2017) however SCC wished to submit a city-only bid and
EBC was unable to progress an independent bid with local operators
for a variety of reasons.
The SCC bid was successful in attracting £2.6M for the upgrade of 145
buses, benefits to EBC expected accrue from reduced emissions from
buses based in Eastleigh entering and leaving service on Southampton
Road having lower emissions..
14
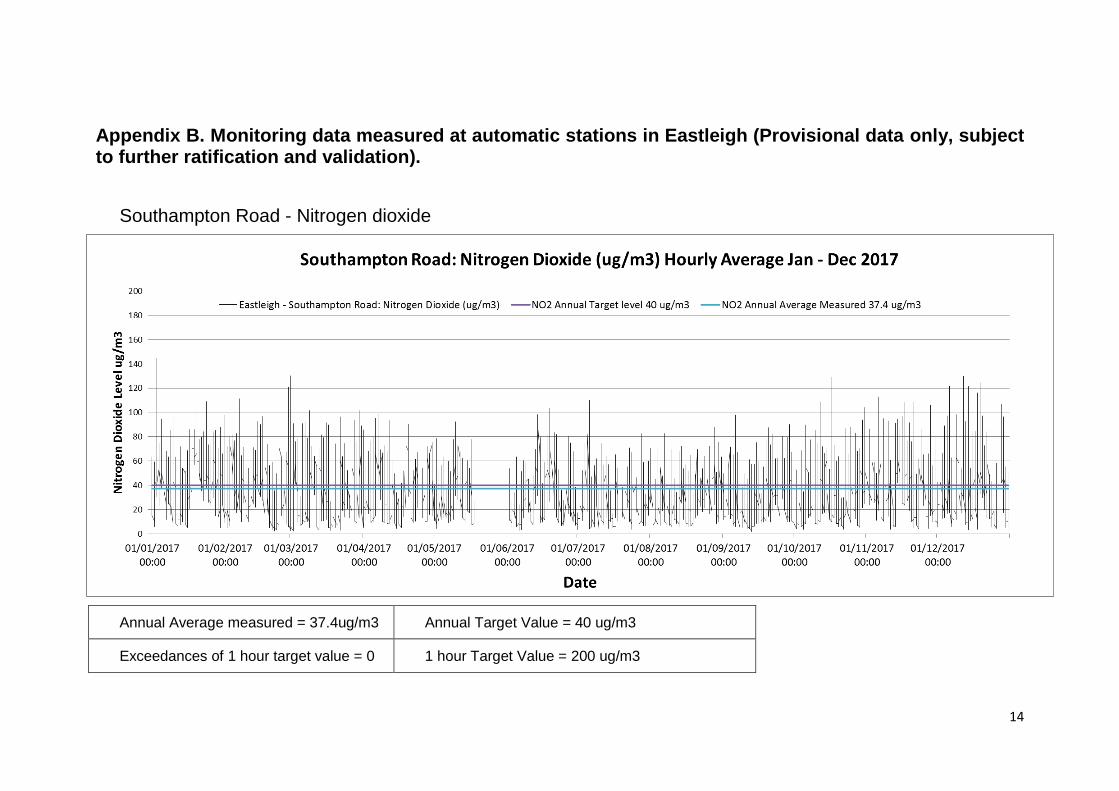
Appendix B. Monitoring data measured at automatic stations in Eastleigh (Provisional data only, subject to further ratification and validation).
Southampton Road - Nitrogen dioxide
Annual Average measured = 37.4ug/m3 Annual Target Value = 40 ug/m3
Exceedances of 1 hour target value = 0 1 hour Target Value = 200 ug/m3

15
Data Capture Rate = 93.9%
Southampton Road - Particulate Matter PM10
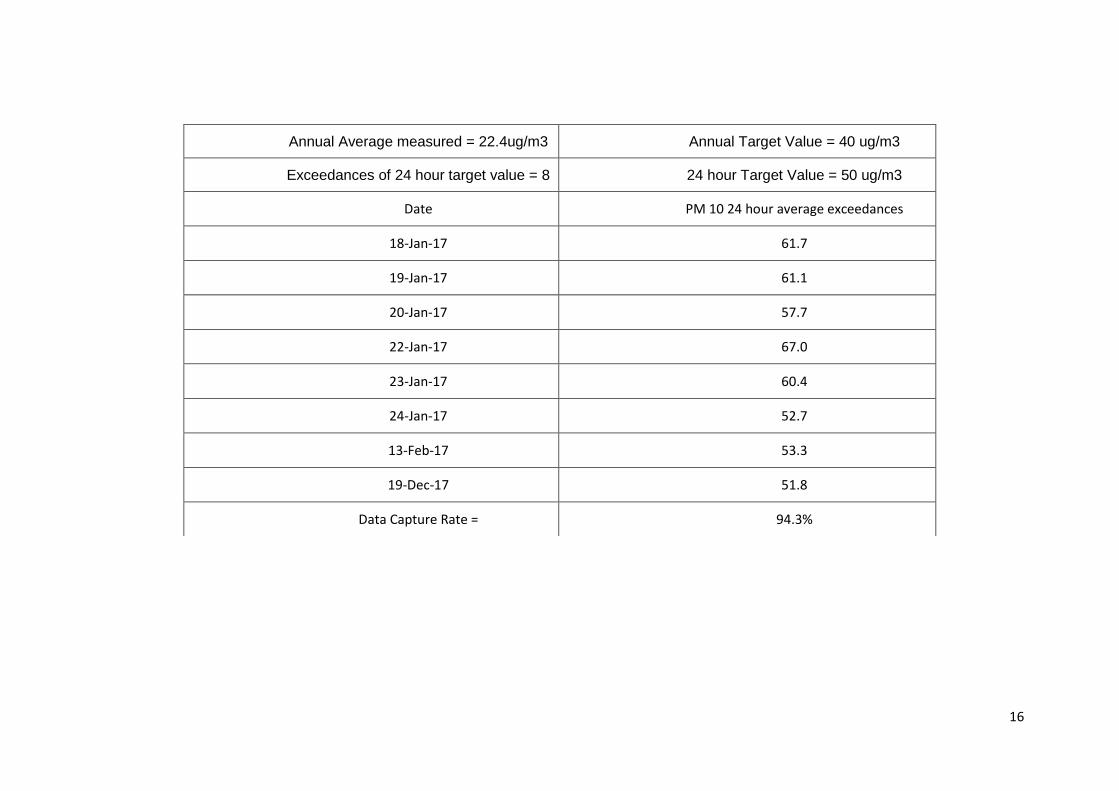
16
Annual Average measured = 22.4ug/m3 Annual Target Value = 40 ug/m3
Exceedances of 24 hour target value = 8 24 hour Target Value = 50 ug/m3
Date PM 10 24 hour average exceedances
18-Jan-17 61.7
19-Jan-17 61.1
20-Jan-17 57.7
22-Jan-17 67.0
23-Jan-17 60.4
24-Jan-17 52.7
13-Feb-17 53.3
19-Dec-17 51.8
Data Capture Rate = 94.3%

17
Steele Close - Nitrogen Dioxide
Annual Average measured = 27.0ug/m3 Annual Target Value = 40 ug/m3
Exceedances of 1 hour target value = 0 1 hour Target Value = 200 ug/m3
Data Capture Rate = 99.1%

18
The Point - Nitrogen Dioxide
Annual Average measured = 28.1ug/m3 Annual Target Value = 40 ug/m3
Exceedances of 1 hour target value = 1* 1 hour Target Value = 200 ug/m3
Data Capture Rate = 98.5%
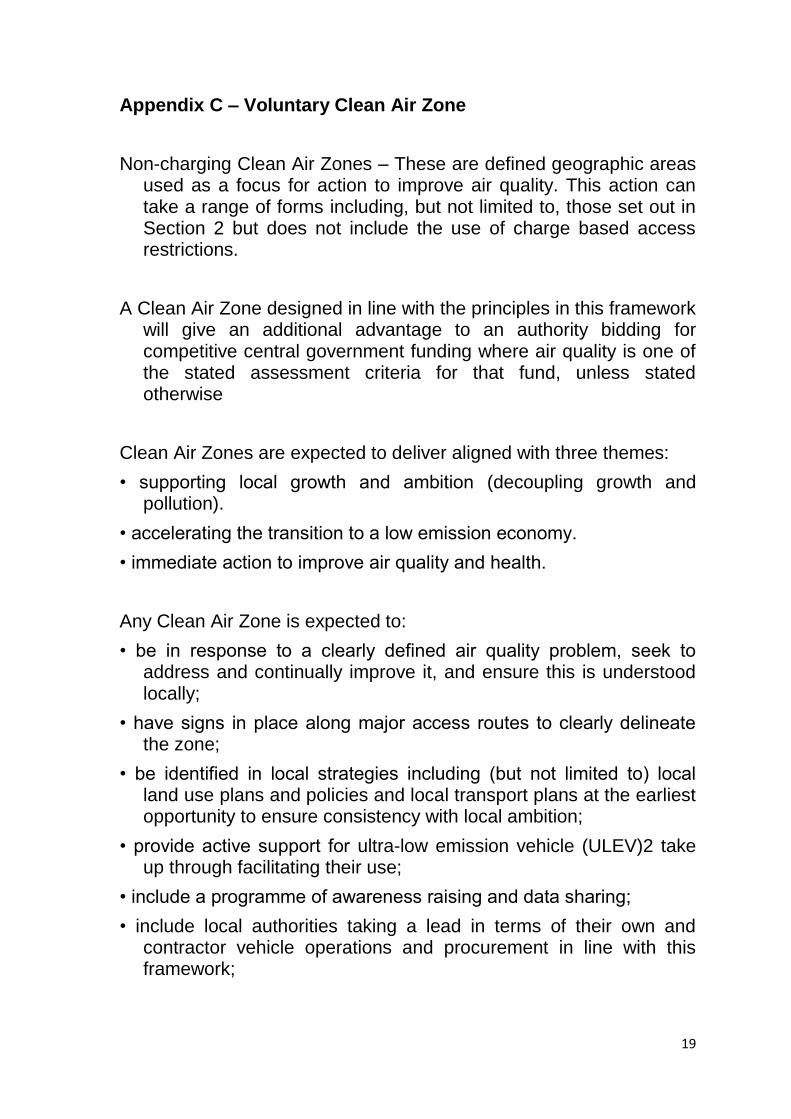
19
Appendix C – Voluntary Clean Air Zone
Non-charging Clean Air Zones – These are defined geographic areas used as a focus for action to improve air quality. This action can take a range of forms including, but not limited to, those set out in Section 2 but does not include the use of charge based access restrictions.
A Clean Air Zone designed in line with the principles in this framework will give an additional advantage to an authority bidding for competitive central government funding where air quality is one of the stated assessment criteria for that fund, unless stated otherwise
Clean Air Zones are expected to deliver aligned with three themes:
• supporting local growth and ambition (decoupling growth and pollution).
• accelerating the transition to a low emission economy.
• immediate action to improve air quality and health.
Any Clean Air Zone is expected to:
• be in response to a clearly defined air quality problem, seek to address and continually improve it, and ensure this is understood locally;
• have signs in place along major access routes to clearly delineate the zone;
• be identified in local strategies including (but not limited to) local land use plans and policies and local transport plans at the earliest opportunity to ensure consistency with local ambition;
• provide active support for ultra-low emission vehicle (ULEV)2 take up through facilitating their use;
• include a programme of awareness raising and data sharing;
• include local authorities taking a lead in terms of their own and contractor vehicle operations and procurement in line with this framework;

20
• ensure bus, taxi and private hire vehicle emission standards (where they do not already) are improved to meet Clean Air Zone standards using licensing, franchising or partnership approaches as appropriate; and
• support healthy, active travel
General approach to Clean Air Zones
Emission standards
• Clean Air Zones should be designed to deliver the cleanest possible fleet (this could cover all or some of the following):
o Bus Euro VI
o Coach Euro VI
o HGV Euro VI
o Large Van Euro 6 (diesel), Euro 4 (petrol)
o Taxi / Private hire Euro 6 (diesel), Euro 4 (petrol)
o Minibus Euro 6 (diesel), Euro 4 (petrol
o Small van / light commercial Euro 6 (diesel), Euro 4 (petrol
o Motorcycles / mopeds Euro 3
Raising awareness and understanding
• Raising awareness and understanding of air quality issues
• Demonstrating progress and maintaining engagement
• Campaigns should help highlight the health and environmental benefits, and stimulate action by demonstrating alternatives and ways people can reduce and avoid pollution.
o communications campaigns and ‘Clean Air’ days.
o interactive websites, using real time pollution monitoring.
o education activities using schools, community groups, health centres and doctors surgeries.
o disseminating advice and alerts during high air pollution episodes.
o working with local businesses to help raise awareness among employees.
o open data and sharing of information.

21
o engaging the public through citizen science projects
o Publicising the zone
o Monitoring
Delivering local ambition
o Making the best use of the local authority role in land use planning
o encourage more sustainable behaviour, for example in the way people use electric vehicles and
o by making cycling and walking easier and more attractive.
o make strong links to approaches to other environmental behaviours including nature conservation, waste minimisation and energy efficiency.
o include steps to support ULEVs in developments in Clean Air Zones;
o requirements to support parking and recharging of Clean Air Zone compliant vehicles; and
o design and support for public transport, walking and cycling accessibility
Optimising traffic management
• improving road layouts and junctions to improve traffic flow and create safer more convenient conditions for active travel.
• improved traffic signing strategies to highlight pollution levels and alternative routes.
• improving road layouts and junctions to optimise traffic flow, for example by considering removal of road humps.
• bus priority schemes to improve reliability and journey times, making buses more attractive as an alternative mode.
• public realm improvements to create town centre environments that are attractive to cyclists and walkers.
• optimising traffic signal operation to reduce unnecessary traffic queues, and the associated emissions.
• creating safe, continuous and convenient cycling and walking networks.

22
• developing connected vehicle and smart infrastructure strategies which improve traffic conditions and support sustainable urban mobility.
• using real-time information to better inform travellers of their choices and to manage demand for transport
Local authority and public sector leadership in fleet procurement and operations
o Local authorities and other public bodies operating within a Clean Air Zone should ensure the fleet they operate, or is operated on their behalf, in a Clean Air Zone, and ideally in the wider authority, meets the standards for the zone
o There is also an opportunity to demonstrate how new technologies and approaches can go further than the standards.
o The use of ULEVs, alternative fuels and approaches to ‘grey fleet’7 can all demonstrate a lead
In procuring vehicles and services operating in a Clean Air Zone, local authorities should:
• ensure vehicles related to local authority use conform to at least the Clean Air Zone standards.
• set minimum supplier requirements related to air quality in procurement award criteria and for contract operations.
• develop approaches to incentivise and encourage employees to address air quality impacts.
• develop approaches to minimise the air quality impact of their day to day operations.
• seek to publicise their approaches to demonstrate and encourage others to follow their lead.

23
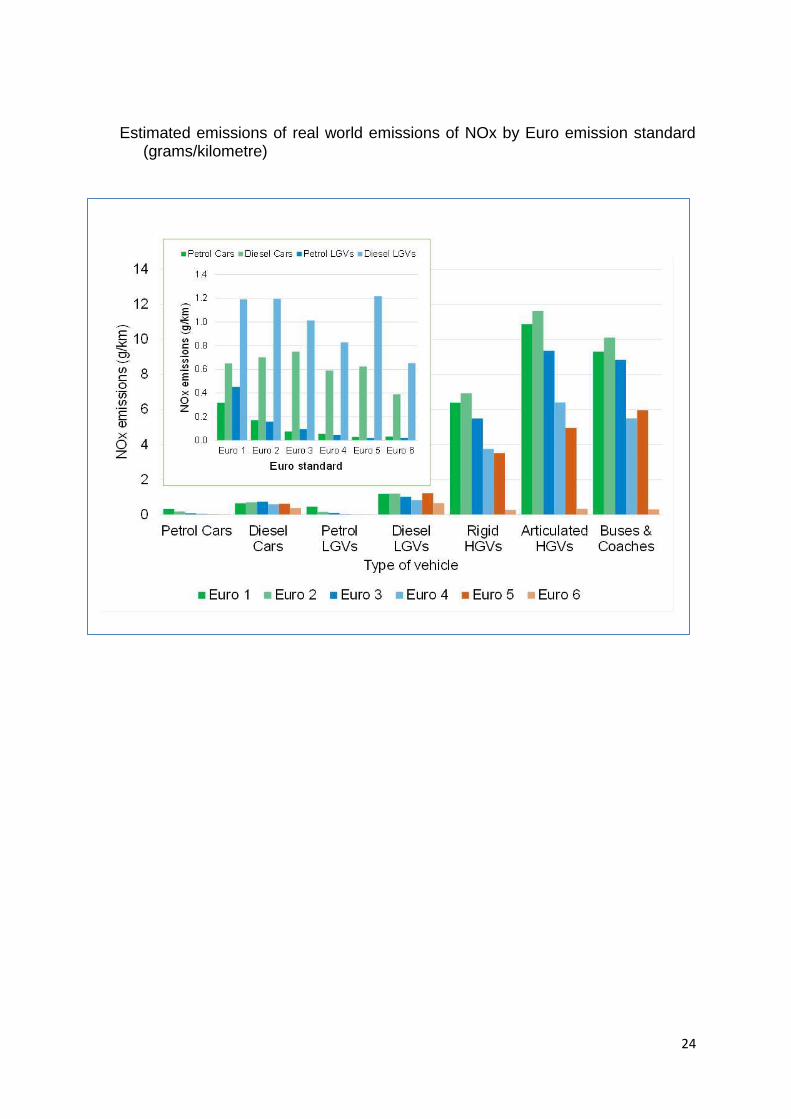
Appendix D. Vehicle Emissions data
UK national average NOx roadside concentration apportioned by source of NOx emissions, 2015
Average emissions of NOx by vehicle type (grams/kilometre) and number of licensed vehicles in the UK in 2016
24
Estimated emissions of real world emissions of NOx by Euro emission standard (grams/kilometre)