Embed Size (px)
Citation preview
EAST MIDLANDS BREAST SCREENING PROGRAMME
MONTHLY CONTRACT MONITORING DATA REPORT
NOVEMBER 2014
1
Contents
Contents & Contact Details 1
Minimum Standards Met 2
Monthly CMD – Screen Round Length 7
Monthly CMD – Tech Repeats & Recalls 9
Monthly CMD – Waits for Results 11
Monthly CMD – Waits for Assessment 13
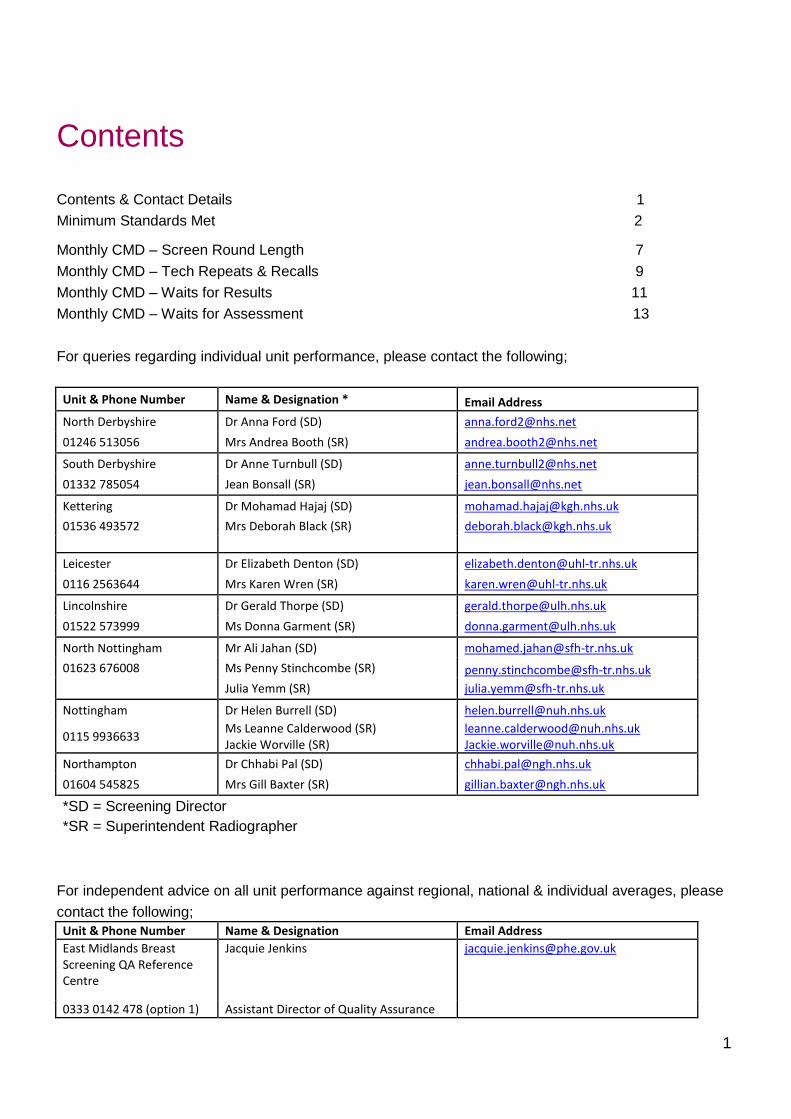
For queries regarding individual unit performance, please contact the following;
Unit & Phone Number Name & Designation * Email Address
North Derbyshire Dr Anna Ford (SD) [email protected]
01246 513056 Mrs Andrea Booth (SR) [email protected]
South Derbyshire Dr Anne Turnbull (SD) [email protected]
01332 785054 Jean Bonsall (SR) [email protected]
Kettering Dr Mohamad Hajaj (SD) [email protected]
01536 493572 Mrs Deborah Black (SR) [email protected]
Leicester Dr Elizabeth Denton (SD) [email protected]
0116 2563644 Mrs Karen Wren (SR) [email protected]
Lincolnshire Dr Gerald Thorpe (SD) [email protected]
01522 573999 Ms Donna Garment (SR) [email protected]
North Nottingham Mr Ali Jahan (SD) [email protected]
01623 676008 Ms Penny Stinchcombe (SR) [email protected]
Julia Yemm (SR) [email protected]
Nottingham Dr Helen Burrell (SD) [email protected]
0115 9936633 Ms Leanne Calderwood (SR) Jackie Worville (SR)
[email protected] [email protected]
Northampton Dr Chhabi Pal (SD) [email protected]
01604 545825 Mrs Gill Baxter (SR) [email protected]
*SD = Screening Director
*SR = Superintendent Radiographer
For independent advice on all unit performance against regional, national & individual averages, please
contact the following;
Unit & Phone Number Name & Designation Email Address
East Midlands Breast Screening QA Reference Centre
Jacquie Jenkins [email protected]
0333 0142 478 (option 1) Assistant Director of Quality Assurance
2
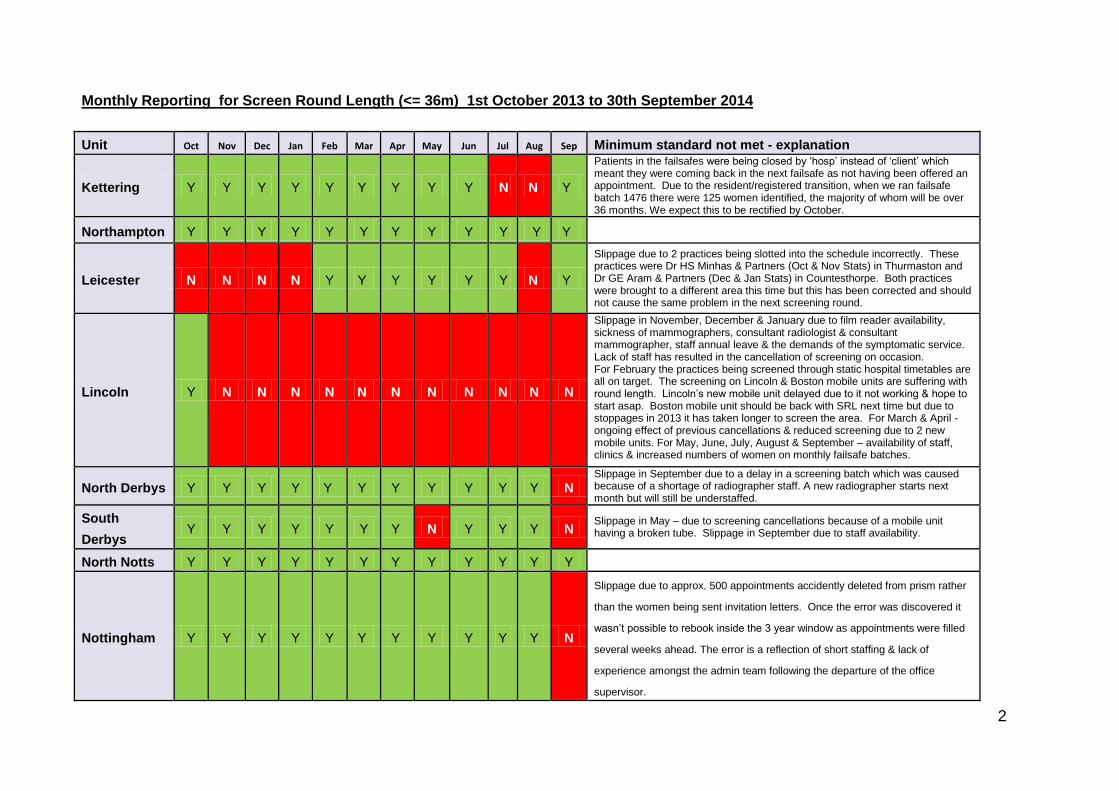
Monthly Reporting for Screen Round Length (<= 36m) 1st October 2013 to 30th September 2014
Unit Oct Nov Dec Jan Feb Mar Apr May Jun Jul Aug Sep Minimum standard not met - explanation
Kettering Y Y Y Y Y Y Y Y Y N N Y
Patients in the failsafes were being closed by ‘hosp’ instead of ‘client’ which meant they were coming back in the next failsafe as not having been offered an appointment. Due to the resident/registered transition, when we ran failsafe batch 1476 there were 125 women identified, the majority of whom will be over 36 months. We expect this to be rectified by October.
Northampton Y Y Y Y Y Y Y Y Y Y Y Y
Leicester N N N N Y Y Y Y Y Y N Y
Slippage due to 2 practices being slotted into the schedule incorrectly. These practices were Dr HS Minhas & Partners (Oct & Nov Stats) in Thurmaston and Dr GE Aram & Partners (Dec & Jan Stats) in Countesthorpe. Both practices were brought to a different area this time but this has been corrected and should not cause the same problem in the next screening round.
Lincoln Y N N N N N N N N N N N
Slippage in November, December & January due to film reader availability, sickness of mammographers, consultant radiologist & consultant mammographer, staff annual leave & the demands of the symptomatic service. Lack of staff has resulted in the cancellation of screening on occasion. For February the practices being screened through static hospital timetables are all on target. The screening on Lincoln & Boston mobile units are suffering with round length. Lincoln’s new mobile unit delayed due to it not working & hope to start asap. Boston mobile unit should be back with SRL next time but due to stoppages in 2013 it has taken longer to screen the area. For March & April - ongoing effect of previous cancellations & reduced screening due to 2 new mobile units. For May, June, July, August & September – availability of staff, clinics & increased numbers of women on monthly failsafe batches.
North Derbys Y Y Y Y Y Y Y Y Y Y Y N Slippage in September due to a delay in a screening batch which was caused because of a shortage of radiographer staff. A new radiographer starts next month but will still be understaffed.
South
Derbys Y Y Y Y Y Y Y N Y Y Y N
Slippage in May – due to screening cancellations because of a mobile unit having a broken tube. Slippage in September due to staff availability.
North Notts Y Y Y Y Y Y Y Y Y Y Y Y
Nottingham Y Y Y Y Y Y Y Y Y Y Y N
Slippage due to approx. 500 appointments accidently deleted from prism rather
than the women being sent invitation letters. Once the error was discovered it
wasn’t possible to rebook inside the 3 year window as appointments were filled
several weeks ahead. The error is a reflection of short staffing & lack of
experience amongst the admin team following the departure of the office
supervisor.

3
Monthly Reporting for Technical Recall/Repeat Rates (<3%) – 1st October 2013 to 30th September 2014
Unit Oct Nov Dec Jan Feb Mar Apr May Jun Jul Aug Sep Minimum standard not met – explanation
Kettering N N N N N Y Y Y Y Y Y Y
The superintendent radiographer has audited performance and identified two main reasons for failure to achieve the target standard of performance. Firstly the way technical repeats are reviewed has led to more being recorded on NBSS than previously. Secondly, 4 staff are individual “outliers” who have a higher tendency for doing repeat images. (One of these staff members is an Assistant Practitioner who completed training in October, and therefore would be expected to have a higher repeat rate). The service has identified a training need for these staff and this will be addressed in the near future. Rates fell in February but still below the minimum standard. The unit has confirmed they are actively trying to reduce these rates & have an action plan in place which includes some staff training.
Northampton Y Y Y N Y Y Y Y Y Y Y Y Standard not met in January; two trainee radiographers commenced at unit.
Leicester N N N N N N Y Y Y Y Y Y
Audit has been undertaken with radiographers and assistant practitioners to look at previous images to find trends & explanations for the high rate of recalls/repeat images.
Over all the months where the standard is not met, some of the trainee’s repeats have been undertaken on a radiographer's log on (which should be excluded) and some of the examinations recorded as repeats are not repeats as there are no additional images in the woman's file. Hence this is due to data errors on the NBSS computer system. Where there are repeats, some are due to blurring. Problems regarding NBSS were resolved in January. The standard was not met this month due to further problems; partly due to blurring still, but also the unit has had some new paddles, which they are adjusting to. For February & March – the unit have a lot of newly qualified staff & so they expected a higher repeat rate. They are actively doing everything they can to try to reduce this including staff training.
Lincoln Y Y Y Y Y Y Y Y Y Y Y Y
North Derbys Y Y Y Y Y Y Y Y Y Y Y Y
South Derbys Y Y Y Y Y Y Y Y Y Y Y Y
North Notts Y Y Y Y Y Y Y Y Y Y Y Y
Nottingham Y Y Y Y Y Y Y Y Y Y Y Y
4
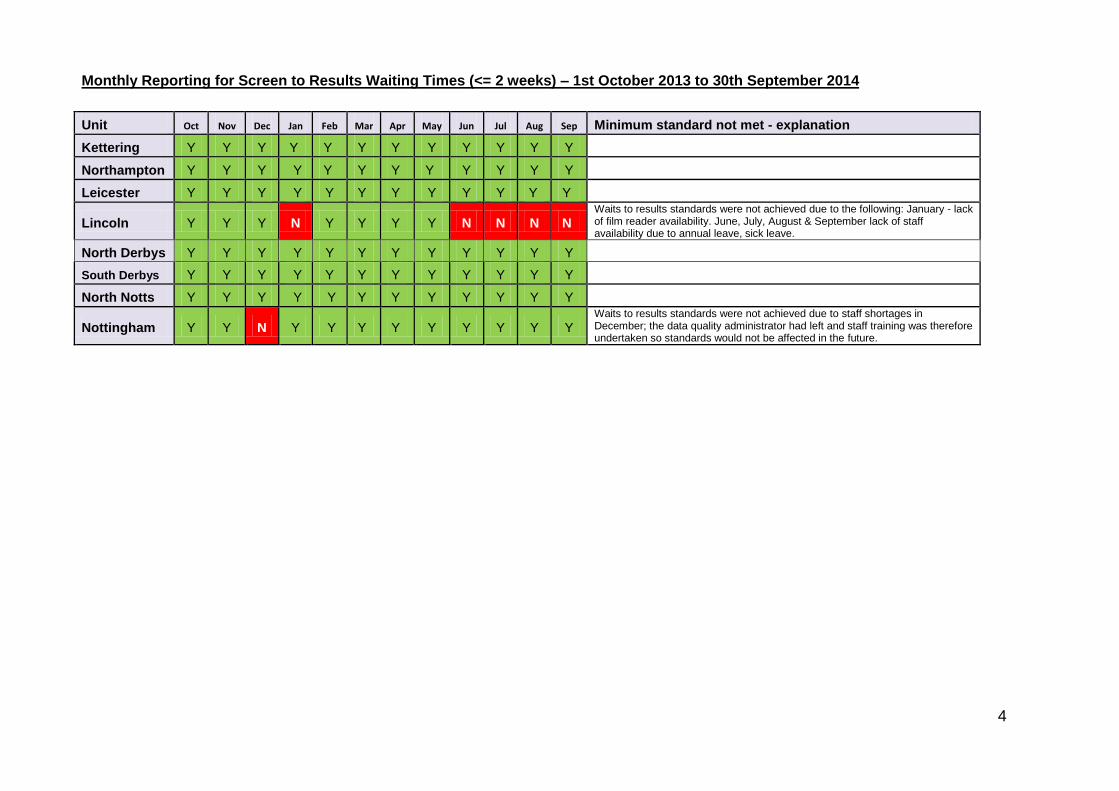
Monthly Reporting for Screen to Results Waiting Times (<= 2 weeks) – 1st October 2013 to 30th September 2014
Unit Oct Nov Dec Jan Feb Mar Apr May Jun Jul Aug Sep Minimum standard not met - explanation
Kettering Y Y Y Y Y Y Y Y Y Y Y Y
Northampton Y Y Y Y Y Y Y Y Y Y Y Y
Leicester Y Y Y Y Y Y Y Y Y Y Y Y
Lincoln Y Y Y N Y Y Y Y N N N N Waits to results standards were not achieved due to the following: January - lack of film reader availability. June, July, August & September lack of staff availability due to annual leave, sick leave.
North Derbys Y Y Y Y Y Y Y Y Y Y Y Y
South Derbys Y Y Y Y Y Y Y Y Y Y Y Y
North Notts Y Y Y Y Y Y Y Y Y Y Y Y
Nottingham Y Y N Y Y Y Y Y Y Y Y Y Waits to results standards were not achieved due to staff shortages in December; the data quality administrator had left and staff training was therefore undertaken so standards would not be affected in the future.
5
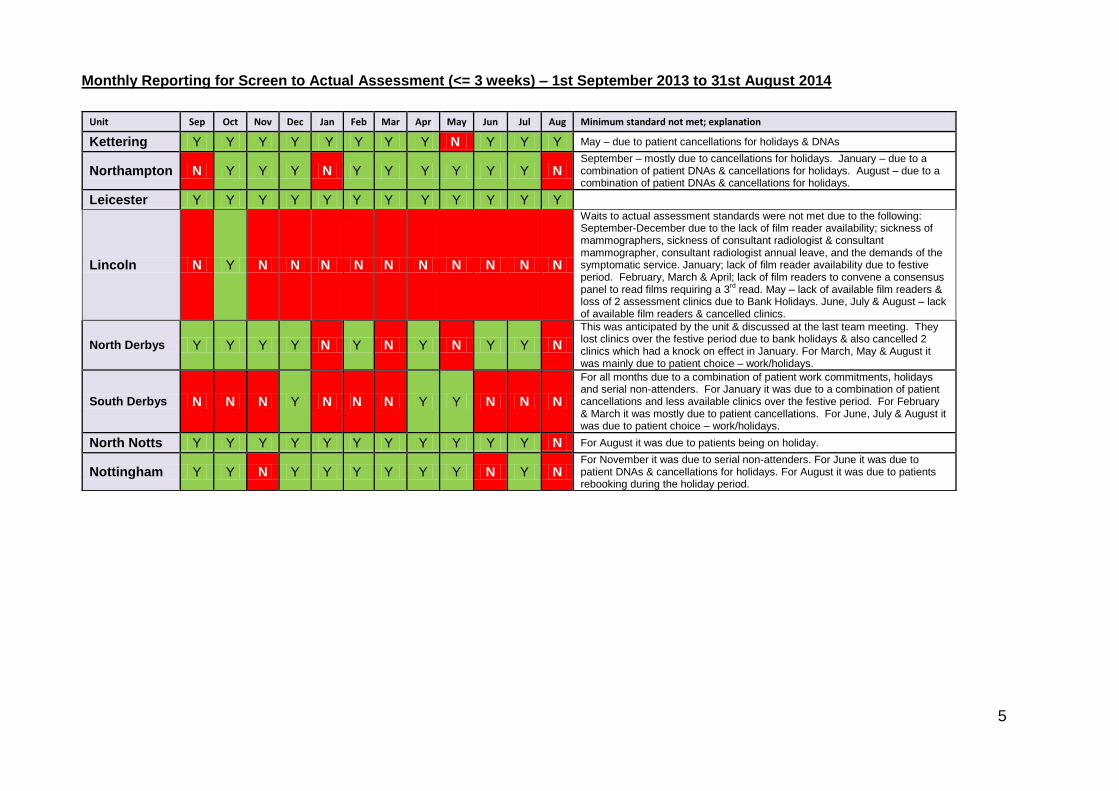
Monthly Reporting for Screen to Actual Assessment (<= 3 weeks) – 1st September 2013 to 31st August 2014
Unit Sep Oct Nov Dec Jan Feb Mar Apr May Jun Jul Aug Minimum standard not met; explanation
Kettering Y Y Y Y Y Y Y Y N Y Y Y May – due to patient cancellations for holidays & DNAs
Northampton N Y Y Y N Y Y Y Y Y Y N September – mostly due to cancellations for holidays. January – due to a combination of patient DNAs & cancellations for holidays. August – due to a combination of patient DNAs & cancellations for holidays.
Leicester Y Y Y Y Y Y Y Y Y Y Y Y
Lincoln N Y N N N N N N N N N N
Waits to actual assessment standards were not met due to the following: September-December due to the lack of film reader availability; sickness of mammographers, sickness of consultant radiologist & consultant mammographer, consultant radiologist annual leave, and the demands of the symptomatic service. January; lack of film reader availability due to festive period. February, March & April; lack of film readers to convene a consensus panel to read films requiring a 3
rd read. May – lack of available film readers &
loss of 2 assessment clinics due to Bank Holidays. June, July & August – lack of available film readers & cancelled clinics.
North Derbys Y Y Y Y N Y N Y N Y Y N
This was anticipated by the unit & discussed at the last team meeting. They lost clinics over the festive period due to bank holidays & also cancelled 2 clinics which had a knock on effect in January. For March, May & August it was mainly due to patient choice – work/holidays.
South Derbys N N N Y N N N Y Y N N N
For all months due to a combination of patient work commitments, holidays and serial non-attenders. For January it was due to a combination of patient cancellations and less available clinics over the festive period. For February & March it was mostly due to patient cancellations. For June, July & August it was due to patient choice – work/holidays.
North Notts Y Y Y Y Y Y Y Y Y Y Y N For August it was due to patients being on holiday.
Nottingham Y Y N Y Y Y Y Y Y N Y N For November it was due to serial non-attenders. For June it was due to patient DNAs & cancellations for holidays. For August it was due to patients rebooking during the holiday period.
6
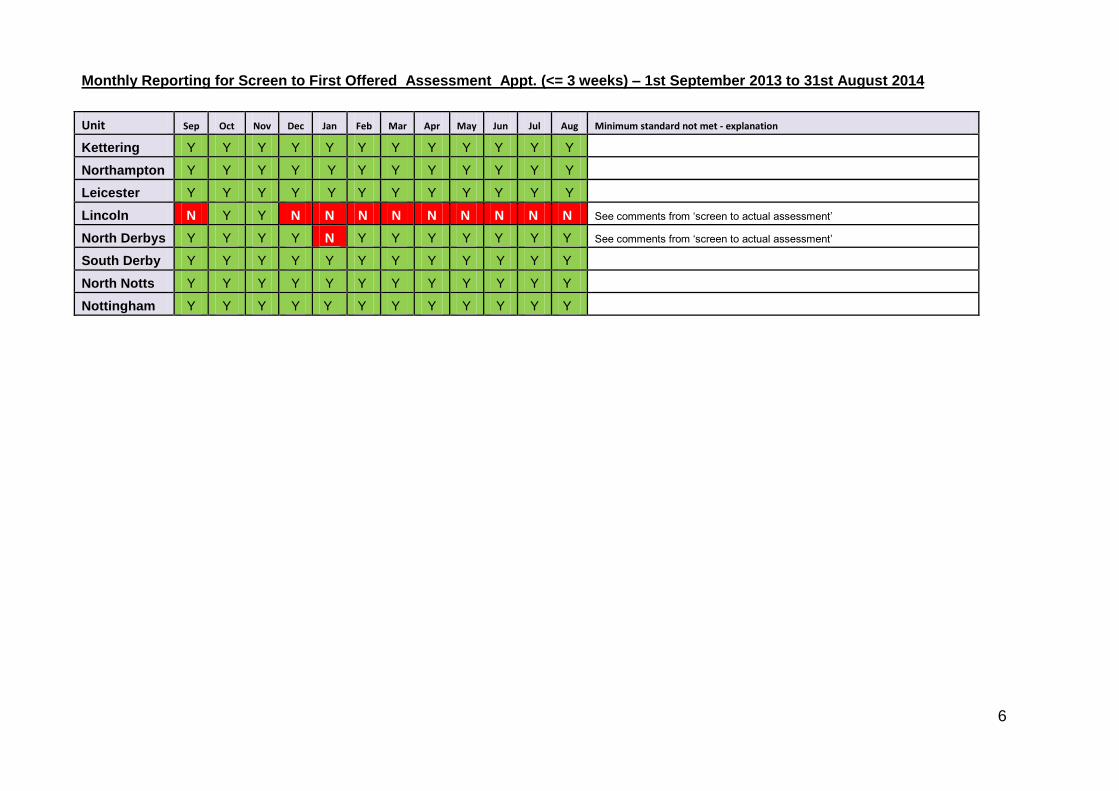
Monthly Reporting for Screen to First Offered Assessment Appt. (<= 3 weeks) – 1st September 2013 to 31st August 2014
Unit Sep Oct Nov Dec Jan Feb Mar Apr May Jun Jul Aug Minimum standard not met - explanation
Kettering Y Y Y Y Y Y Y Y Y Y Y Y
Northampton Y Y Y Y Y Y Y Y Y Y Y Y
Leicester Y Y Y Y Y Y Y Y Y Y Y Y
Lincoln N Y Y N N N N N N N N N See comments from ‘screen to actual assessment’
North Derbys Y Y Y Y N Y Y Y Y Y Y Y See comments from ‘screen to actual assessment’
South Derby Y Y Y Y Y Y Y Y Y Y Y Y
North Notts Y Y Y Y Y Y Y Y Y Y Y Y
Nottingham Y Y Y Y Y Y Y Y Y Y Y Y
7
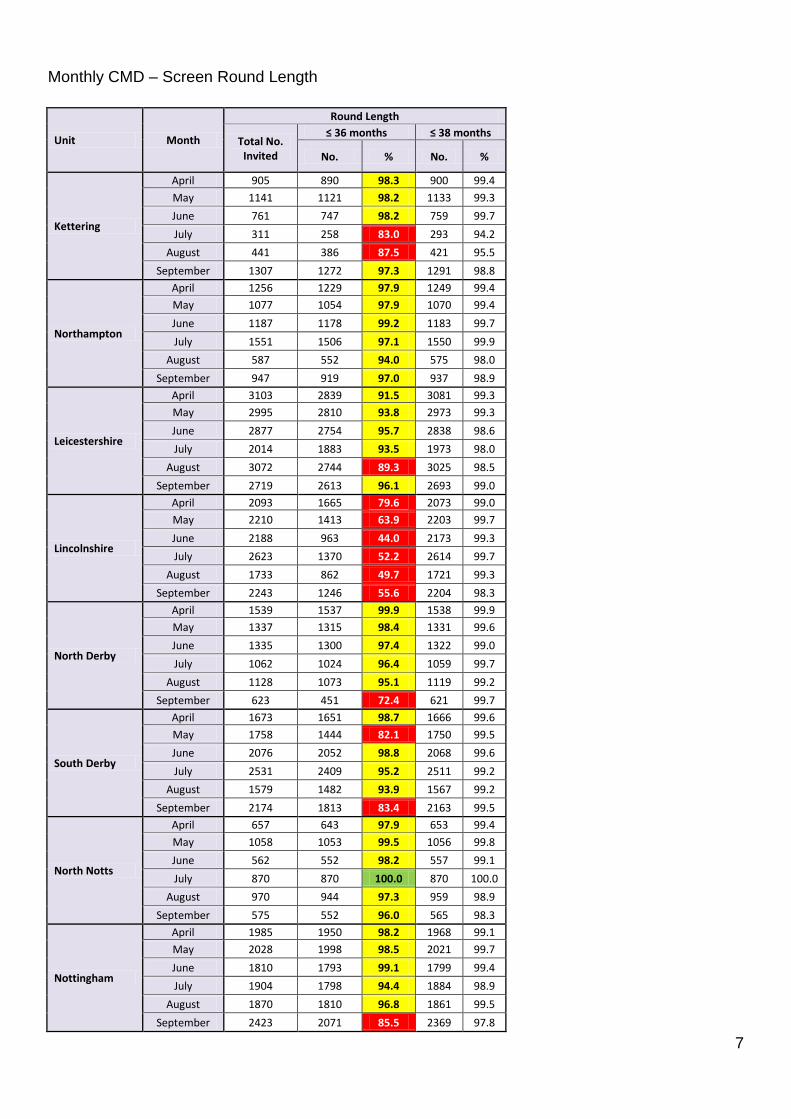
Monthly CMD – Screen Round Length
Unit Month
Round Length
Total No. Invited
≤ 36 months ≤ 38 months
No. % No. %
Kettering
April 905 890 98.3 900 99.4
May 1141 1121 98.2 1133 99.3
June 761 747 98.2 759 99.7
July 311 258 83.0 293 94.2
August 441 386 87.5 421 95.5
September 1307 1272 97.3 1291 98.8
Northampton
April 1256 1229 97.9 1249 99.4
May 1077 1054 97.9 1070 99.4
June 1187 1178 99.2 1183 99.7
July 1551 1506 97.1 1550 99.9
August 587 552 94.0 575 98.0
September 947 919 97.0 937 98.9
Leicestershire
April 3103 2839 91.5 3081 99.3
May 2995 2810 93.8 2973 99.3
June 2877 2754 95.7 2838 98.6
July 2014 1883 93.5 1973 98.0
August 3072 2744 89.3 3025 98.5
September 2719 2613 96.1 2693 99.0
Lincolnshire
April 2093 1665 79.6 2073 99.0
May 2210 1413 63.9 2203 99.7
June 2188 963 44.0 2173 99.3
July 2623 1370 52.2 2614 99.7
August 1733 862 49.7 1721 99.3
September 2243 1246 55.6 2204 98.3
North Derby
April 1539 1537 99.9 1538 99.9
May 1337 1315 98.4 1331 99.6
June 1335 1300 97.4 1322 99.0
July 1062 1024 96.4 1059 99.7
August 1128 1073 95.1 1119 99.2
September 623 451 72.4 621 99.7
South Derby
April 1673 1651 98.7 1666 99.6
May 1758 1444 82.1 1750 99.5
June 2076 2052 98.8 2068 99.6
July 2531 2409 95.2 2511 99.2
August 1579 1482 93.9 1567 99.2
September 2174 1813 83.4 2163 99.5
North Notts
April 657 643 97.9 653 99.4
May 1058 1053 99.5 1056 99.8
June 562 552 98.2 557 99.1
July 870 870 100.0 870 100.0
August 970 944 97.3 959 98.9
September 575 552 96.0 565 98.3
Nottingham
April 1985 1950 98.2 1968 99.1
May 2028 1998 98.5 2021 99.7
June 1810 1793 99.1 1799 99.4
July 1904 1798 94.4 1884 98.9
August 1870 1810 96.8 1861 99.5
September 2423 2071 85.5 2369 97.8
8
Unit Month
Round Length
Total No. Invited
≤ 36 months ≤ 38 months
No. % No. %
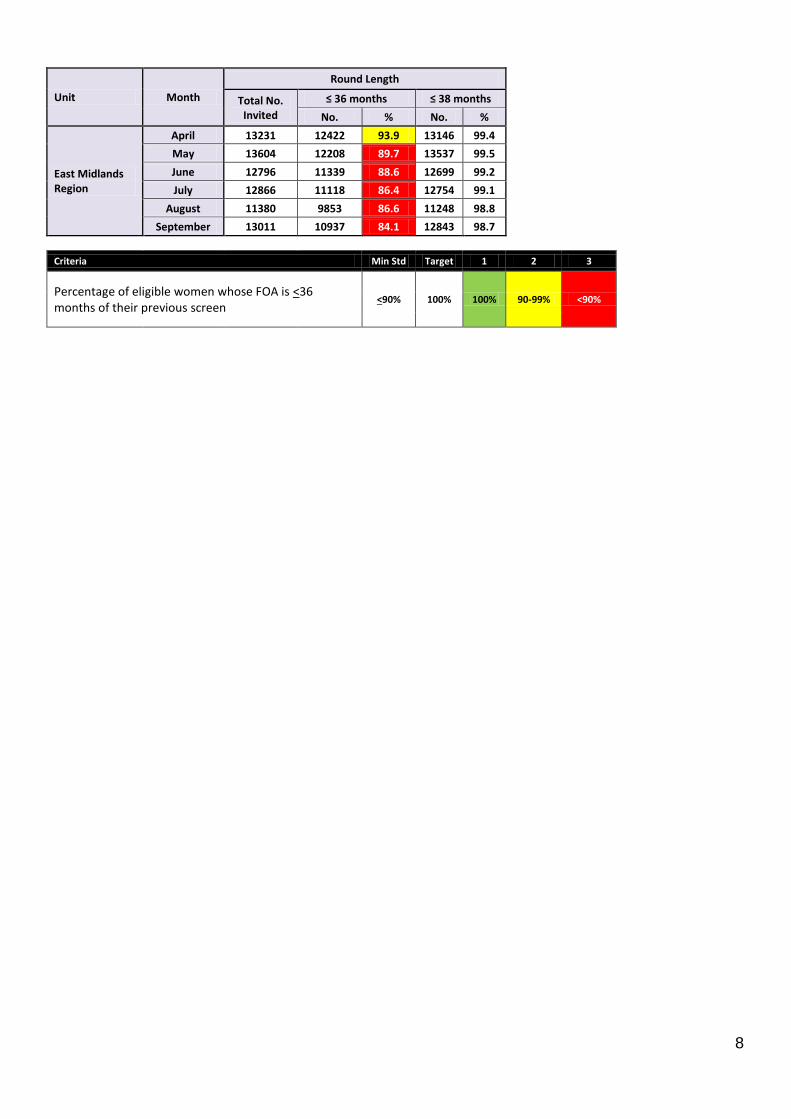
East Midlands Region
April 13231 12422 93.9 13146 99.4
May 13604 12208 89.7 13537 99.5
June 12796 11339 88.6 12699 99.2
July 12866 11118 86.4 12754 99.1
August 11380 9853 86.6 11248 98.8
September 13011 10937 84.1 12843 98.7
Criteria Min Std Target 1 2 3
Percentage of eligible women whose FOA is <36 months of their previous screen
<90% 100% 100% 90-99% <90%
9
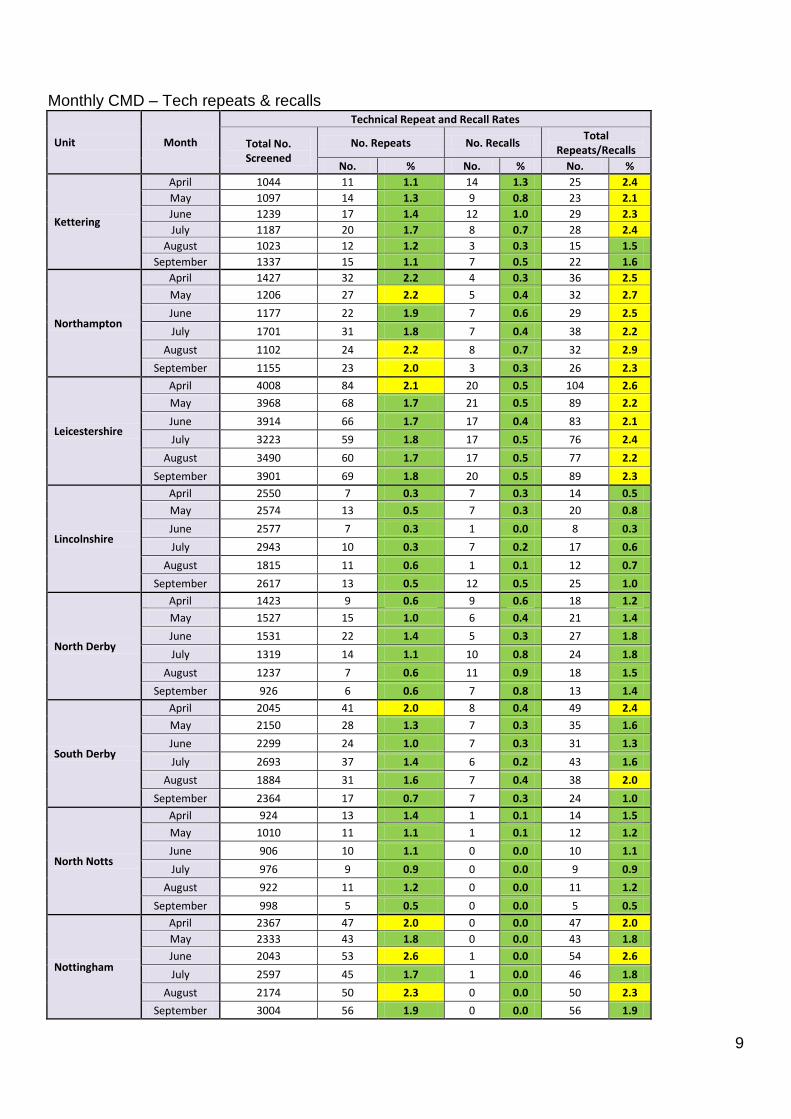
Monthly CMD – Tech repeats & recalls
Unit Month
Technical Repeat and Recall Rates
Total No. Screened
No. Repeats No. Recalls Total
Repeats/Recalls
No. % No. % No. %
Kettering
April 1044 11 1.1 14 1.3 25 2.4
May 1097 14 1.3 9 0.8 23 2.1
June 1239 17 1.4 12 1.0 29 2.3
July 1187 20 1.7 8 0.7 28 2.4
August 1023 12 1.2 3 0.3 15 1.5
September 1337 15 1.1 7 0.5 22 1.6
Northampton
April 1427 32 2.2 4 0.3 36 2.5
May 1206 27 2.2 5 0.4 32 2.7
June 1177 22 1.9 7 0.6 29 2.5
July 1701 31 1.8 7 0.4 38 2.2
August 1102 24 2.2 8 0.7 32 2.9
September 1155 23 2.0 3 0.3 26 2.3
Leicestershire
April 4008 84 2.1 20 0.5 104 2.6
May 3968 68 1.7 21 0.5 89 2.2
June 3914 66 1.7 17 0.4 83 2.1
July 3223 59 1.8 17 0.5 76 2.4
August 3490 60 1.7 17 0.5 77 2.2
September 3901 69 1.8 20 0.5 89 2.3
Lincolnshire
April 2550 7 0.3 7 0.3 14 0.5
May 2574 13 0.5 7 0.3 20 0.8
June 2577 7 0.3 1 0.0 8 0.3
July 2943 10 0.3 7 0.2 17 0.6
August 1815 11 0.6 1 0.1 12 0.7
September 2617 13 0.5 12 0.5 25 1.0
North Derby
April 1423 9 0.6 9 0.6 18 1.2
May 1527 15 1.0 6 0.4 21 1.4
June 1531 22 1.4 5 0.3 27 1.8
July 1319 14 1.1 10 0.8 24 1.8
August 1237 7 0.6 11 0.9 18 1.5
September 926 6 0.6 7 0.8 13 1.4
South Derby
April 2045 41 2.0 8 0.4 49 2.4
May 2150 28 1.3 7 0.3 35 1.6
June 2299 24 1.0 7 0.3 31 1.3
July 2693 37 1.4 6 0.2 43 1.6
August 1884 31 1.6 7 0.4 38 2.0
September 2364 17 0.7 7 0.3 24 1.0
North Notts
April 924 13 1.4 1 0.1 14 1.5
May 1010 11 1.1 1 0.1 12 1.2
June 906 10 1.1 0 0.0 10 1.1
July 976 9 0.9 0 0.0 9 0.9
August 922 11 1.2 0 0.0 11 1.2
September 998 5 0.5 0 0.0 5 0.5
Nottingham
April 2367 47 2.0 0 0.0 47 2.0
May 2333 43 1.8 0 0.0 43 1.8
June 2043 53 2.6 1 0.0 54 2.6
July 2597 45 1.7 1 0.0 46 1.8
August 2174 50 2.3 0 0.0 50 2.3
September 3004 56 1.9 0 0.0 56 1.9
10
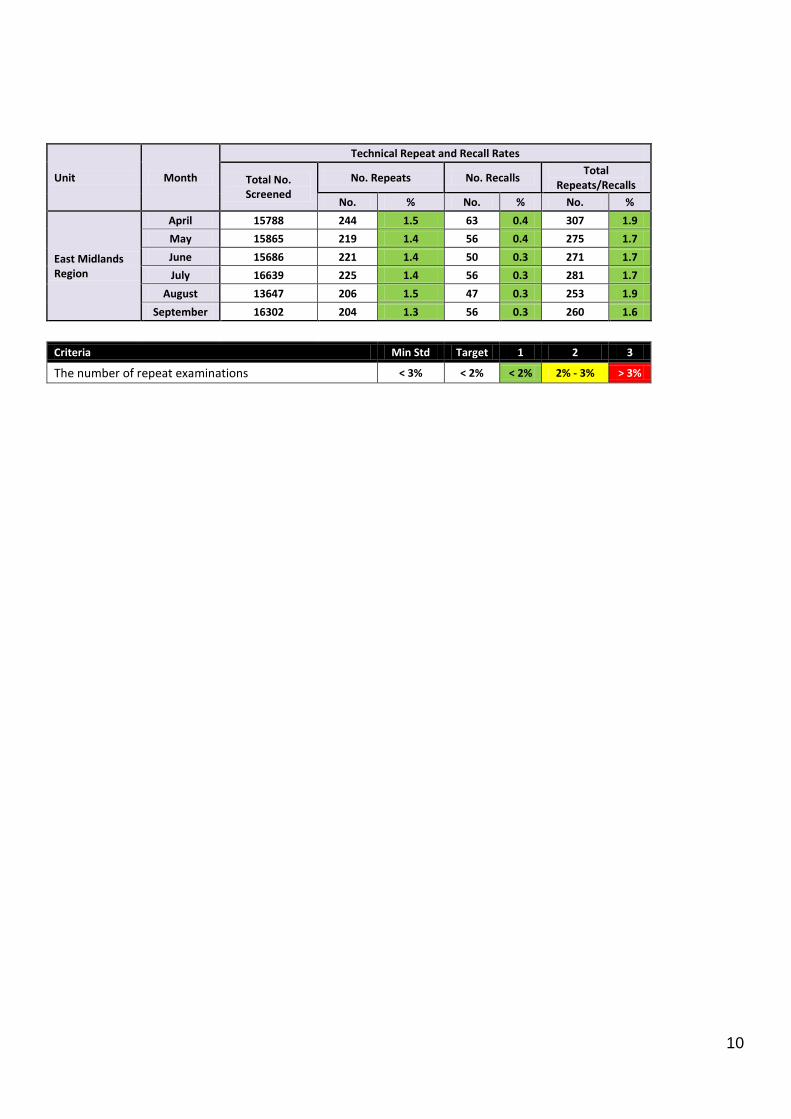
Unit Month
Technical Repeat and Recall Rates
Total No. Screened
No. Repeats No. Recalls Total
Repeats/Recalls
No. % No. % No. %
East Midlands Region
April 15788 244 1.5 63 0.4 307 1.9
May 15865 219 1.4 56 0.4 275 1.7
June 15686 221 1.4 50 0.3 271 1.7
July 16639 225 1.4 56 0.3 281 1.7
August 13647 206 1.5 47 0.3 253 1.9
September 16302 204 1.3 56 0.3 260 1.6
Criteria Min Std Target 1 2 3
The number of repeat examinations < 3% < 2% < 2% 2% - 3% > 3%
11
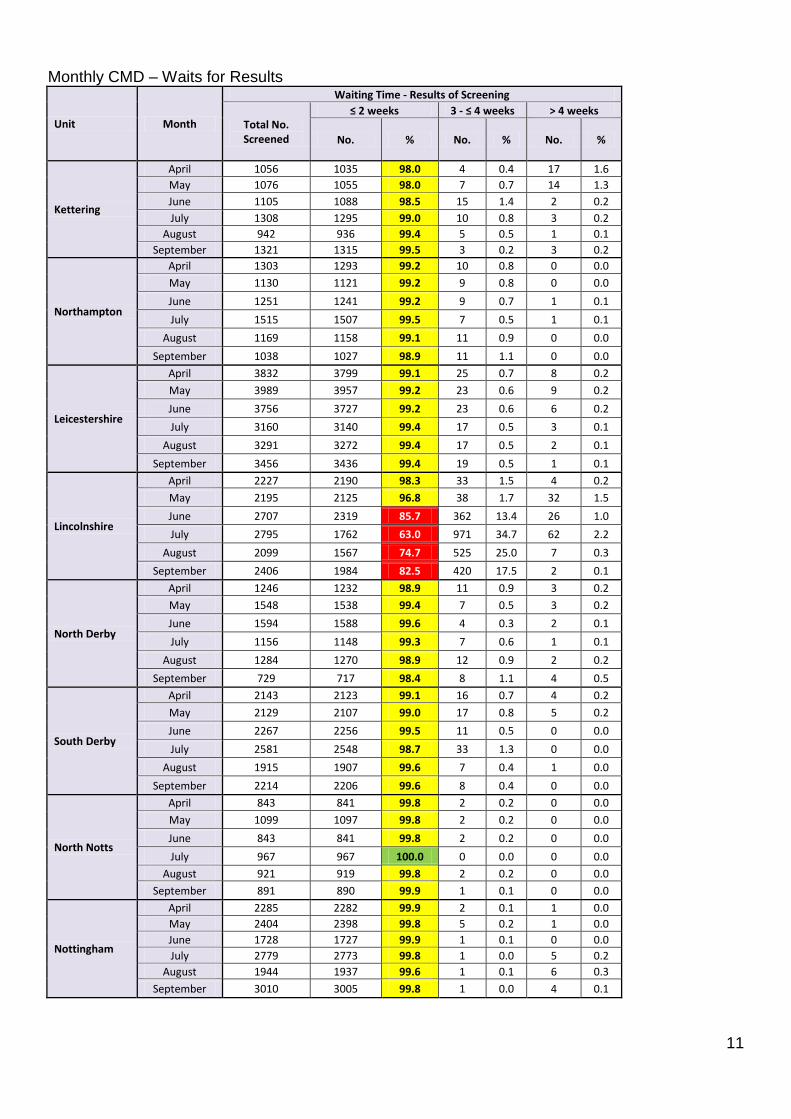
Monthly CMD – Waits for Results
Unit Month
Waiting Time - Results of Screening
Total No. Screened
≤ 2 weeks 3 - ≤ 4 weeks > 4 weeks
No. % No. % No. %
Kettering
April 1056 1035 98.0 4 0.4 17 1.6
May 1076 1055 98.0 7 0.7 14 1.3
June 1105 1088 98.5 15 1.4 2 0.2
July 1308 1295 99.0 10 0.8 3 0.2
August 942 936 99.4 5 0.5 1 0.1
September 1321 1315 99.5 3 0.2 3 0.2
Northampton
April 1303 1293 99.2 10 0.8 0 0.0
May 1130 1121 99.2 9 0.8 0 0.0
June 1251 1241 99.2 9 0.7 1 0.1
July 1515 1507 99.5 7 0.5 1 0.1
August 1169 1158 99.1 11 0.9 0 0.0
September 1038 1027 98.9 11 1.1 0 0.0
Leicestershire
April 3832 3799 99.1 25 0.7 8 0.2
May 3989 3957 99.2 23 0.6 9 0.2
June 3756 3727 99.2 23 0.6 6 0.2
July 3160 3140 99.4 17 0.5 3 0.1
August 3291 3272 99.4 17 0.5 2 0.1
September 3456 3436 99.4 19 0.5 1 0.1
Lincolnshire
April 2227 2190 98.3 33 1.5 4 0.2
May 2195 2125 96.8 38 1.7 32 1.5
June 2707 2319 85.7 362 13.4 26 1.0
July 2795 1762 63.0 971 34.7 62 2.2
August 2099 1567 74.7 525 25.0 7 0.3
September 2406 1984 82.5 420 17.5 2 0.1
North Derby
April 1246 1232 98.9 11 0.9 3 0.2
May 1548 1538 99.4 7 0.5 3 0.2
June 1594 1588 99.6 4 0.3 2 0.1
July 1156 1148 99.3 7 0.6 1 0.1
August 1284 1270 98.9 12 0.9 2 0.2
September 729 717 98.4 8 1.1 4 0.5
South Derby
April 2143 2123 99.1 16 0.7 4 0.2
May 2129 2107 99.0 17 0.8 5 0.2
June 2267 2256 99.5 11 0.5 0 0.0
July 2581 2548 98.7 33 1.3 0 0.0
August 1915 1907 99.6 7 0.4 1 0.0
September 2214 2206 99.6 8 0.4 0 0.0
North Notts
April 843 841 99.8 2 0.2 0 0.0
May 1099 1097 99.8 2 0.2 0 0.0
June 843 841 99.8 2 0.2 0 0.0
July 967 967 100.0 0 0.0 0 0.0
August 921 919 99.8 2 0.2 0 0.0
September 891 890 99.9 1 0.1 0 0.0
Nottingham
April 2285 2282 99.9 2 0.1 1 0.0
May 2404 2398 99.8 5 0.2 1 0.0
June 1728 1727 99.9 1 0.1 0 0.0
July 2779 2773 99.8 1 0.0 5 0.2
August 1944 1937 99.6 1 0.1 6 0.3
September 3010 3005 99.8 1 0.0 4 0.1
12
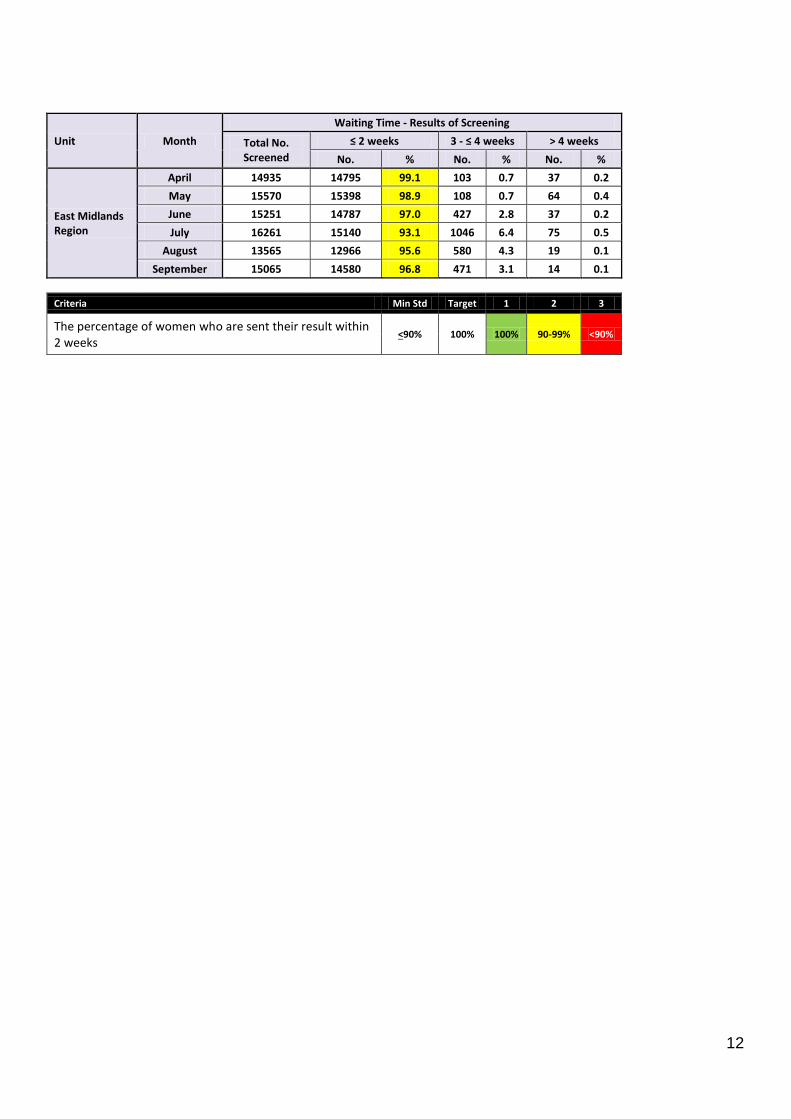
Unit Month
Waiting Time - Results of Screening
Total No. Screened
≤ 2 weeks 3 - ≤ 4 weeks > 4 weeks
No. % No. % No. %
East Midlands Region
April 14935 14795 99.1 103 0.7 37 0.2
May 15570 15398 98.9 108 0.7 64 0.4
June 15251 14787 97.0 427 2.8 37 0.2
July 16261 15140 93.1 1046 6.4 75 0.5
August 13565 12966 95.6 580 4.3 19 0.1
September 15065 14580 96.8 471 3.1 14 0.1
Criteria Min Std Target 1 2 3
The percentage of women who are sent their result within 2 weeks
<90% 100% 100% 90-99% <90%
13
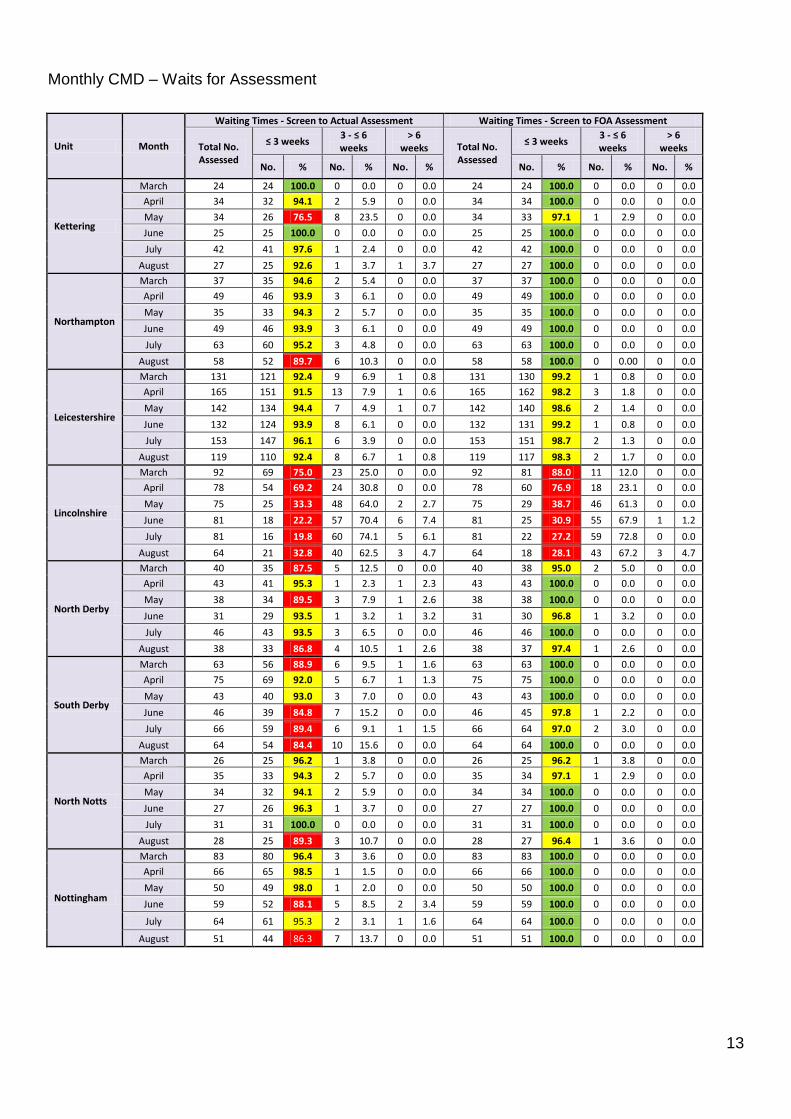
Monthly CMD – Waits for Assessment
Unit Month
Waiting Times - Screen to Actual Assessment Waiting Times - Screen to FOA Assessment
Total No. Assessed
≤ 3 weeks 3 - ≤ 6 weeks
> 6 weeks Total No.
Assessed
≤ 3 weeks 3 - ≤ 6 weeks
> 6 weeks
No. % No. % No. % No. % No. % No. %
Kettering
March 24 24 100.0 0 0.0 0 0.0 24 24 100.0 0 0.0 0 0.0
April 34 32 94.1 2 5.9 0 0.0 34 34 100.0 0 0.0 0 0.0
May 34 26 76.5 8 23.5 0 0.0 34 33 97.1 1 2.9 0 0.0
June 25 25 100.0 0 0.0 0 0.0 25 25 100.0 0 0.0 0 0.0
July 42 41 97.6 1 2.4 0 0.0 42 42 100.0 0 0.0 0 0.0
August 27 25 92.6 1 3.7 1 3.7 27 27 100.0 0 0.0 0 0.0
Northampton
March 37 35 94.6 2 5.4 0 0.0 37 37 100.0 0 0.0 0 0.0
April 49 46 93.9 3 6.1 0 0.0 49 49 100.0 0 0.0 0 0.0
May 35 33 94.3 2 5.7 0 0.0 35 35 100.0 0 0.0 0 0.0
June 49 46 93.9 3 6.1 0 0.0 49 49 100.0 0 0.0 0 0.0
July 63 60 95.2 3 4.8 0 0.0 63 63 100.0 0 0.0 0 0.0
August 58 52 89.7 6 10.3 0 0.0 58 58 100.0 0 0.00 0 0.0
Leicestershire
March 131 121 92.4 9 6.9 1 0.8 131 130 99.2 1 0.8 0 0.0
April 165 151 91.5 13 7.9 1 0.6 165 162 98.2 3 1.8 0 0.0
May 142 134 94.4 7 4.9 1 0.7 142 140 98.6 2 1.4 0 0.0
June 132 124 93.9 8 6.1 0 0.0 132 131 99.2 1 0.8 0 0.0
July 153 147 96.1 6 3.9 0 0.0 153 151 98.7 2 1.3 0 0.0
August 119 110 92.4 8 6.7 1 0.8 119 117 98.3 2 1.7 0 0.0
Lincolnshire
March 92 69 75.0 23 25.0 0 0.0 92 81 88.0 11 12.0 0 0.0
April 78 54 69.2 24 30.8 0 0.0 78 60 76.9 18 23.1 0 0.0
May 75 25 33.3 48 64.0 2 2.7 75 29 38.7 46 61.3 0 0.0
June 81 18 22.2 57 70.4 6 7.4 81 25 30.9 55 67.9 1 1.2
July 81 16 19.8 60 74.1 5 6.1 81 22 27.2 59 72.8 0 0.0
August 64 21 32.8 40 62.5 3 4.7 64 18 28.1 43 67.2 3 4.7
North Derby
March 40 35 87.5 5 12.5 0 0.0 40 38 95.0 2 5.0 0 0.0
April 43 41 95.3 1 2.3 1 2.3 43 43 100.0 0 0.0 0 0.0
May 38 34 89.5 3 7.9 1 2.6 38 38 100.0 0 0.0 0 0.0
June 31 29 93.5 1 3.2 1 3.2 31 30 96.8 1 3.2 0 0.0
July 46 43 93.5 3 6.5 0 0.0 46 46 100.0 0 0.0 0 0.0
August 38 33 86.8 4 10.5 1 2.6 38 37 97.4 1 2.6 0 0.0
South Derby
March 63 56 88.9 6 9.5 1 1.6 63 63 100.0 0 0.0 0 0.0
April 75 69 92.0 5 6.7 1 1.3 75 75 100.0 0 0.0 0 0.0
May 43 40 93.0 3 7.0 0 0.0 43 43 100.0 0 0.0 0 0.0
June 46 39 84.8 7 15.2 0 0.0 46 45 97.8 1 2.2 0 0.0
July 66 59 89.4 6 9.1 1 1.5 66 64 97.0 2 3.0 0 0.0
August 64 54 84.4 10 15.6 0 0.0 64 64 100.0 0 0.0 0 0.0
North Notts
March 26 25 96.2 1 3.8 0 0.0 26 25 96.2 1 3.8 0 0.0
April 35 33 94.3 2 5.7 0 0.0 35 34 97.1 1 2.9 0 0.0
May 34 32 94.1 2 5.9 0 0.0 34 34 100.0 0 0.0 0 0.0
June 27 26 96.3 1 3.7 0 0.0 27 27 100.0 0 0.0 0 0.0
July 31 31 100.0 0 0.0 0 0.0 31 31 100.0 0 0.0 0 0.0
August 28 25 89.3 3 10.7 0 0.0 28 27 96.4 1 3.6 0 0.0
Nottingham
March 83 80 96.4 3 3.6 0 0.0 83 83 100.0 0 0.0 0 0.0
April 66 65 98.5 1 1.5 0 0.0 66 66 100.0 0 0.0 0 0.0
May 50 49 98.0 1 2.0 0 0.0 50 50 100.0 0 0.0 0 0.0
June 59 52 88.1 5 8.5 2 3.4 59 59 100.0 0 0.0 0 0.0
July 64 61 95.3 2 3.1 1 1.6 64 64 100.0 0 0.0 0 0.0
August 51 44 86.3 7 13.7 0 0.0 51 51 100.0 0 0.0 0 0.0
14
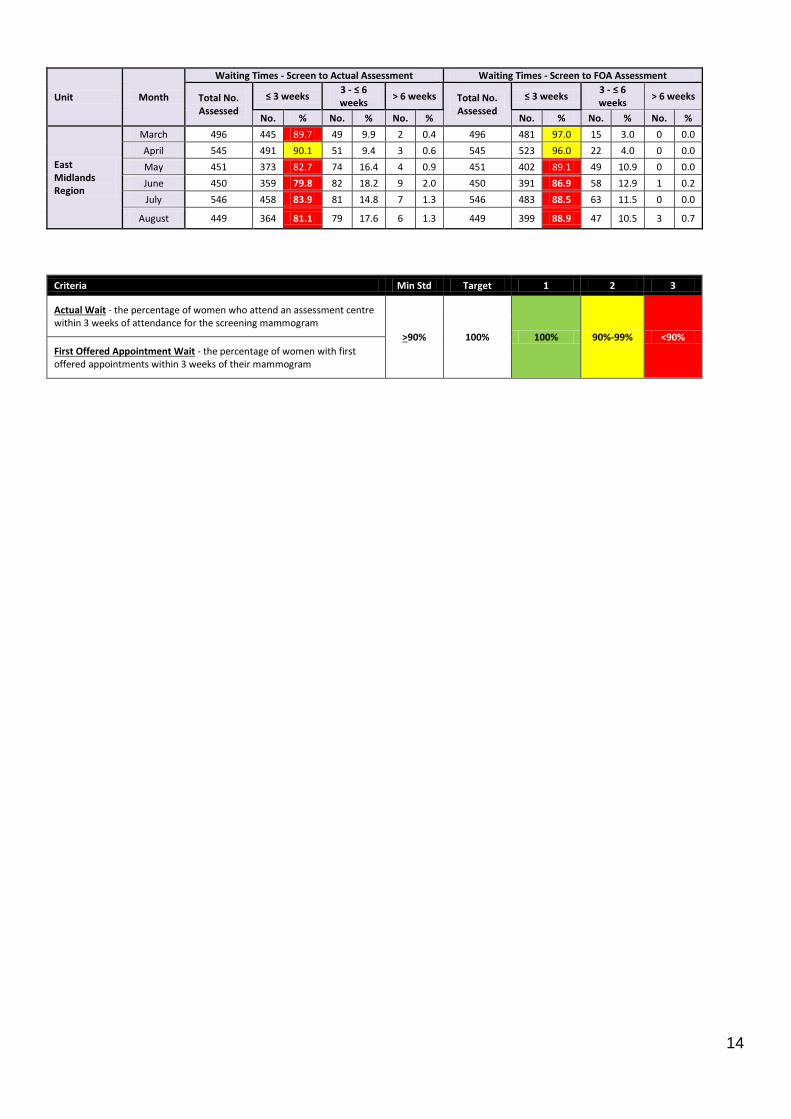
Unit Month
Waiting Times - Screen to Actual Assessment Waiting Times - Screen to FOA Assessment
Total No. Assessed
≤ 3 weeks 3 - ≤ 6 weeks
> 6 weeks Total No. Assessed
≤ 3 weeks 3 - ≤ 6 weeks
> 6 weeks
No. % No. % No. % No. % No. % No. %
East Midlands Region
March 496 445 89.7 49 9.9 2 0.4 496 481 97.0 15 3.0 0 0.0
April 545 491 90.1 51 9.4 3 0.6 545 523 96.0 22 4.0 0 0.0
May 451 373 82.7 74 16.4 4 0.9 451 402 89.1 49 10.9 0 0.0
June 450 359 79.8 82 18.2 9 2.0 450 391 86.9 58 12.9 1 0.2
July 546 458 83.9 81 14.8 7 1.3 546 483 88.5 63 11.5 0 0.0
August 449 364 81.1 79 17.6 6 1.3 449 399 88.9 47 10.5 3 0.7
Criteria Min Std Target 1 2 3
Actual Wait - the percentage of women who attend an assessment centre within 3 weeks of attendance for the screening mammogram
>90% 100% 100% 90%-99% <90%
First Offered Appointment Wait - the percentage of women with first offered appointments within 3 weeks of their mammogram


![Screening for Breast Cancer[1]](https://img.dokumen.tips/doc/110x75/577d2c841a28ab4e1eac7094/screening-for-breast-cancer1.jpg)