Embed Size (px)
Citation preview

East Central NewMexico
Updated January 1, 2018
1

2

Contents
Stronger Economies Together Initiative
4 - Executive Summary
5 - Regional Description
6 - Introduction
6 - Acknowledgements
6 - Regional Collaboration
8 - Evidence Base for Plan
8 - Regional Demographic Data
10 - Regional Economic Data
11 – Identifying the Targets of Opportunity within the Region
11 – Identifying the Performance of Industries within the Region
20 - Regional Assets
21 - Potential Barriers and Related Strategies
23 - Regional Economic Goals
23 - Goal 1: WORKFORCE DEVELOPMENT
25 - Goal 2:TOURISM
27 - Goal 3:HEALTHCARE AND TRANSPORTATION
29 - Goal 4:AGRIBUSINESS AND ENERGY
3

Stronger Economies Together Initiative
The Stronger Economies Together (SET) Initiative was launched in 2010 by USDA Rural Development in collaboration with the nation’s Regional Rural Development Centers (RRDC) and their land-grant university partners. The purpose of the SET Initiative is to strengthen the capacity of communities in rural America to work together in developing and implementing an economic development blueprint that strategically builds on the current and emerging economic strengths of their region.SET provides economic analyses tailored to help capture the region’s current or emerging clusters and comparative economic advantages, and is supported by technical assistance provided by the land-grant university extension service over a period of 15 months including the SET training.
The East Central New Mexico (ECNM) SET collaboration is a newly organized four county (Quay, Guadalupe, De Baca and Torrance) partnership with several shared characteristics and interests: allare facing the same economic downturn; all are struggling with education, workforce development, and adequate and affordable housing challenges; and all are with limited financial and technical resources. As such, instead of using our limited resources for individual projects, we believe our SET partnership provides us a great opportunity to combine our efforts for the greater good of the region.
While this is a newly formed partnership,the organizations and communities have collaborated successfully in past years on many different projects and initiatives. From public safety, to natural resource management, to providing emergency services for our region, we have all always worked well together. For example, Guadalupe, Torrance and Quay Counties have successfully worked together recently to address solid waste issues in the region. Additionally, the region's water resources, in the Pecos River Basin, are managed jointly by De Baca and Guadalupe Counties. The most important collaborative work done has occurred in healthcare and emergency medical systems and services, coordinating emergency procedures and preparedness in the region,and maintaining vital emergency access points for the traveling public.
Challenges and barriers have been overcome through a strong commitment to cooperation and collaboration including navigating the bureaucratic rules and regulations of government entities in the region. The SET process has provided us an opportunity to gain additional knowledge about our communities and region that can be used to strengthen our regional economy. Most important of all, the SET process has allowed us to get to know each other and learn new ways to work together to build a better life for the people of our region.
East Central New Mexico
Executive Summary
This Regional Economic Development Plan will serve as the roadmap for the future economic development efforts of East Central New Mexico. Key regional stakeholders embrace a spirit of regionalism to support this initiative.Implementing the action items described within this document will strengthen the ability of East Central New Mexico to secure its economic future and position it as a competitive region. This plan reflects a five module curriculum planning process with active participation
4

from business, civic, and community leaders. Significant research and discussions have led to the development of this plan.
East Central New Mexico Description
The East Central New Mexico SET Partnership is made up of Quay, Guadalupe, De Baca and Torrance counties, all rural counties. These counties have several characteristics in common from interstates and railways, to demographics and industries. Along with multiple other highways, Interstate-40 (Route 66) passes through Torrance, Guadalupe and Quay Counties. Also, the region is traversed by two major railways, BNSF and Union Pacific. Each county has at least one airport facility.
The region's primary electric energy sources are Central New Mexico Electric Cooperative, Farmer's Electric Cooperative and Xcel Energy. Plateau Telecommunications and Century Link are the primary sources for telecommunications. Both the energy and telecommunications industries are strong and expanding. Renewable energy is an emerging industry in the region.
Agriculture (farming and ranching) is a major sector in our regional economy. While the agricultural industry is a major economic driver,it has not seen significant growth in recent years,with the exception of the dairy and cheese industry in Quay County. In fact, the cattle industry is still recovering from recent droughts and a deadly December 2015 snow storm.
Not unlike the rest of rural America, this region has seen a carving out of the middle, with young educated persons and families leaving to urban areas with better job opportunities. The region’s poverty rate remains high (23.75%), and educational attainment levels are low (80% graduate from high school and only 13% have a Bachelor’s degree or higher). This population makes up the work force of the region’s primary and growing economic sectors- services and tourism.
5

Introduction
Acknowledgements
The East Central New Mexico SET Partnership would like to thank the staff from the United States Department of Agriculture Rural Development, Regional Rural Development Centers, and New Mexico State University Extension Service for support throughout the course of this project. We would also like to show our appreciation to Mayor Campos of Santa Rosa,Mayor Ingram of Ft. Sumner,Mayor Litchfield of Tucumcari, and Mayor Hart of Moriarty for their gracious hospitality,the distinguished individuals that took part in the training sessions, and numerous other individuals, for their invaluable insight and ideas that led to the creation of this plan.
Regional Collaboration
This plan has been developed through the leadership of key decision makers in the region including:
Timothy Dodge, City Manager, Santa Rosa Joseph Campos, Mayor, City of Santa Rosa Christina Campos, Hospital Administrator, Guadalupe County Hospital George Dodge, Jr., County Manager, Guadalupe County Roman Garcia, Mayor Town of Vaughan Ted Hart, Mayor, City of Moriarty Richard Primrose, County Manager, Quay County Ruthann Litchfield, Mayor, City of Tucumcari Jared Langenegger, City Manager, Tucumcari Adolfo Lucero, Chairman, De Baca County Commission Justin Ingram, Mayor, Village of Ft. Sumner Patrick Vanderpool. Executive Director, Greater Tucumcari EDC
Key decision makers (identified above) have expressed commitment to support theplan’s implementation by (1) theirletters ofsupport (available on request),and(2)their generous participation in the development of this plan. (Due to the emergency legislative session and the state budget process, and the accelerated timeline for submission of this plan we were not able to include those with this submission.) All have committed to serve on working groups associatedwiththe plan’sgoals,strategies andplansof action (see individual plans of action).
Weareconfident that by sharingthisplan with ourrespectivecommunitiesthroughout the region, others will wantto participatein theimplementation oftheplan’sgoalsand strategiesthatwillbe true game changersintheir communities.
Additionally, public input and support was garnered through participation by many local entities in the SET sessions held in each of the four counties in the region. Input was regularly sought from those who could not attend the sessions via phone and email, and invitations to participate were widely distributed through media (radio and newspaper), meetings of city and
6

county commissions, local chambers of commerce events, economic development board meetings, and Rotary meetings and other local service clubs.
While the Civic Forum attracted 53participants from all sectors, an additional29participants joined different planning sessions throughout the planning process.
We want to thank those businesses, government entities, and community organizations for their commitment and participation.
Name Organization Name Organization Brenda Bishop Quay County Extension Service Gail Houser Tucumcari Mainstreet Gail Sanders Tucumcari/Quay County
Chamber of Commerce Gary King Moriarty Rotary Club
Ben Salazar Senator Tom Udall Gilbert Romero City of Santa Rosa Robert Hockaday Energy Related Devices David Hamby David Hamby Design Harold Sexton City of Santa Rosa Jude Gallegos City of Santa Rosa Tim Hagaman NM Economic Development Debbie Pogue Retro 66 Tom Sullivan Moriarty Edgewood Schools Toni Stoner Village of San Jon Charles Burke Tucumcari resident Paul Mischuk UR Recycling Berna Velasquez City of Santa Rosa Laurie Coats Tucumcari Robert Lumpkin Tucumcari Mayor Pro Tem Steve Hansen Tucumcari EDC Michael Valverde City of Moriarty Ernest Sanchez City of Santa Rosa Rebecca Maes City of Santa Rosa Garth Tallman NM Rural Development Monica Abeyta Guadalupe County Dina Martinez Moise Library Richard Perea Santa Rosa Schools Marjorie
McKenzie Quay County citizen
Kenton Perkins FNB New Mexico Charles Garcia City of Santa Rosa Mary S. Baca Anton Chico ECD Luis Sanchez Anton Chico ECD Edwin Hewett Torrance County Ron Wilmot Rep. Ben Ray Lujan Richard Randals NM Property Group Marilyn Dodge Vecino Sanos Anastacia Baca Lake City Diner Yolanda Garcia City of Santa Rosa Pearl Maestas ACED Bea Laredo Tucumcari Andrea Chavez City of Santa Rosa Danica Gonzales City of Santa Rosa Ryan Eustice NM Economic Development Myra Pancrazio EVEDA Betty Cabber EVEDA Leigh Ann Marez Guadalupe CES Javier Sanchez Torrance County Jace Alderson City of Moriarty Kevin Pohl City of Moriarty Raymond Lopez County of De Baca Bill Wertheim County of De Baca David White LAMM Ministries Teresa Salazar Moriarty Edgewood Schools Jean-Marc
Gandonou ENMU
Mark Micelli City of Santa Rosa Bill Bess NM Rural Dev. Co. Wade Holdeman Fort Sumner ISD
7

EvidenceBasisforPlan
What follows is documentation of the path we followed in the East CentralNew Mexico region in deriving targets, goals, and actionable strategies designed to take advantage of economic opportunities and address economic challenges within the region.
1. We began the process with an open discussion of strengths and weaknesses (both real and perceived), a listing of assets and barriers (and strategies to overcome them) (see those listed below) and a listing opportunities we felt were presented to us at our Civic Forum.
2. We then began to delve into our regional demographic and economic data, including identifying the Top Ten industry growth sectors, the Top Five declining industry sectors, and, utilizing location quotients, a list of industry clusters for consideration as targets of opportunity.
3. Comparing the opportunities we identified early in the process with the data provided, we selected Agribusiness, Energy, Arts and Entertainment, and Biomedical/Biotech as initial targets, with Workforce and Transportation as key elements underlying and supporting those clusters.
4. Once we received detailed data on the selected clusters, we were able to refine our achievable targets to the “Final Answer”: Agribusiness/Energy, Health Care/Transportation, Tourism, and Workforce (the most critical element underlying all the chosen Targets of Opportunity).
5. Several obvious opportunities and needs stood out in these targets. Discussions and a review of the data helped us identify Goals for each and Strategies to address those goals.
Regional Assets
• Water/Wind/Solar
o Four significant wind farms have been developed in the region and more are in the planning stages. The Caprock solar farm (25MW) was brought on line in November, 2016. The low cost of land, proximity to transmission lines and demand for renewable energy bode well for the future of this sector.
o As in most parts of the west, the region has experienced severe drought in recent years. Three of the past four years have seen rainfall amounts return to normal, however, bringing about agricultural and livestock expansion.
o There are three medium sized lakes in the area: Conchas, Ute and Sumner. The lakes and rivers attract fishermen and other recreational users.
• Transportation
o Two major railroads pass through the region. The Burlington Norther Santa Fe and Union Pacific main lines intersect in Guadalupe County. Both lines have high traffic and provide jobs for maintenance and train crews.
8

o Interstate 40, a major east-west corridor, passes through Quay, Guadalupe and Torrance counties. There are several large truck stops, including three in Santa Rosa, that result in truckers and tourists stopping for breaks and refueling. Additional tourist facilities and services near the truck stoops result in increased spending for other businesses.
• Tourism
o The region is home to world renowned museums and historical sites. Billy The Kid’s gravesite and Bosque Redondo Memorial are located outside Fort Sumner, in De Baca county. Quay, Guadalupe and Torrance counties are along the world famous Route 66. Many of the most memorable attractions along Route 66 are in the region.
o Fishing and hunting opportunities are plentiful in the area. The Pecos and Canadian Rivers, as well as area lakes, are popular recreational destinations. Santa Rosa is home to the famous Blue Hole, a natural lake that is popular with scuba divers. They come from throughout the state and beyond to do practice dives and become certified scuba divers.
• Agriculture
o Farming and ranching are major industries in all counties within the region. Fort Sumner produces alfalfa that is in high demand and Torrance county has several large producers of vegetables. Cattle and sheep ranching is prevalent in all counties. Some of these ranches are large operations that have employees and managers.
o There is an opportunity to expand the agriculture sector in the region.Although limited somewhat by the water situation, unless there is a severe drought as experienced in 2012-2013, there is sufficient water to support an increase in agriculture crops. There is a growing number of small farmers committed to organic and natural farming. A local group is moving forward with fish farming, which could be a growing industry.
• Climate
o Eastern New Mexico is blessed with abundant sunshine and opportunity for outdoor recreation. Winds can be blustery at times, and careful planning is advised.
o Average temperatures in eastern New Mexico are: lows in the 20s and highs in the 50s in January, with lows in the 60s and highs in the 90s in July.
o Annual average precipitation is approximately 14” in the region.
• LowCostofLiving o The average cost of living index in the East Central New Mexico region is 85 (national index of
100)
o Housing costs are below 50 on the index, making a significant reduction in the local cost of living.
o The health care index averages 114, higher than the national average.
9
o Groceries and transportation are slightly above the national average.
Potential Barriers and Related Strategies
• Workforce
o Thecounties in theregion areperceived as having a lack of skilled workers, both quantity and quality
STRATEGY: Assess theworkforcetodevelop accuratedata on theskills availablein the region’s workforce. Make improvements where needed. Tell the story about the region’sworkforcequality.
• AvailableHousing
o Thereis a lack of housing in theregion, especially for minimum and medium wage workers.
STRATEGY: Utilize USDA Rural Development Housing Rehab and Home Ownership programs to develop new and improved housing within the region. Market those programs to local contractors and developers.
• Substance Abuse
o New Mexico's drug overdose death rate has been one of the highest in the nation for most of the last two decades. New Mexico's death rate has more than tripled since 1990. While deaths due to illicit drugs have remained steady during the past decade, deaths due to prescription drugs (particularly opioid pain relievers) have increased dramatically. The counties in eastern New Mexico are no exception to the rule.
STRATEGY: Work with schools in the region to improve drug education. Work with doctors to identify ways the business community can assist.
• OverregulationofBusiness
o Over regulation of business occurs at all levels of government, local, state, and federal. Excessive regulation costs business through additional paperwork requirements and in some cases can be the cause of businesses deciding not to hire additional employees.
STRATEGY: Work with businesses to identify issues they have with excessive regulation. Share this information with local, state, and federal government representatives. Work collectively to find resolutions to these burdens.
10

NM County, NM County, NM County, NM New Mexico
• Poverty o According to the census bureau American Factfinder, the poverty rate in Quay County is
21.4%, De Baca County 23.5%, Guadalupe County 17.5%, and Torrance County 28.6%.
STRATEGY: Work with schools to increase the graduation rate. Develop a regional workforce initiative to develop new skillsets in the workforce. Engage employers as partners in identifying new opportunities for workers to raise their standard of living.
Regional Demographic Data
The ECNM SET region is facing the same economic decline and population loss issues as other rural regions of the country, but they are more pronounced here because they are unfavorable even in comparison with New Mexico, which, overall has fared worse in many socio-economic measures than almost all other states.
Summary Quay Guadalupe De Baca Torrance ECNM U.S.
Population, 2015 8,455 4,371 1,828 15,485 30,139 321,418,820
Trends Population % change, 1970-2015 -23.2% -11.8% -28.5% 193.6% 26.6% 57.7% Employment % change, 1970-2015 -14.3% 22.8% -5.8% 181.0% 32.1% 108.4% Personal Income % change, 1970-2015 52.2% 63.8% 71.2% 426.1% 134.3% 196.4%
Prosperity Unemployment rate, 2015 7.2% 7.1% 5.0% 9.0% 7.9% 5.3% Average earnings per job, 2015 (2015 $s) $32,911 $29,948 $40,070 $37,951 $35,062 $58,228 Per capita income, 2015 (2015 $s) $35,162 $30,873 $42,078 $28,753 $31,667 $48,112
Economy Non-Labor % of total personal income, 2015 60.6% 57.1% 54.1% 52.6% 55.9% 36.1% Services % of total employment, 2015 ῀53.2% 58.9% 41.3% ῀54.3% ῀53.7% 72.5% Government % of total employment, 2015 22.9% 19.4% 19.8% 19.5% 20.6% 12.7%
(NOTE: Regional population growth is being driven by Torrance County, a suburb of Albuquerque.)
We are rapidly losing our productive adult population. Our senior population is rising. Individuals and families are receiving more income from non-labor sources (SocialSecurity, disability, investment income) than from jobs, as witnessed by non-labor income accounting for nearly 56% of allfamily income in the region.
The median age in the region has increased by 8%,compared with 6.5% nationwide. The largest increase was in Torrance County, median age 43.3 in 2015, compared to 34.8 in 2015. That’s a 24% increase. Per capita income in the region is rising and per-job income is rising, indicating that those who are working, even though their numbers may be declining, are earning more. Still, however, the region’s average per-job income is only 60 % of the nation’s average income.
Population losses in the region are due to out-migration more than any other factor. Most leave to nearby regions where prospects seem to be better. The region has experienced large declines in
11

children under 18 and of adults between 35-40 years of age. A large number of job holders in the region, about 6,300, commute out of the region to work. (That number is significantly affected by Torrance County residents commuting to jobs in Albuquerque.
The region’s population has gained slightly 18-34 year old age group since 2000. That is a reflection of job prospects for young people, especially those without college degrees, declining elsewhere.
Further, in the recovery from the 2009 recession, the ECNM region has lost 2,170 jobs. During the recession,we lost only 472 jobs. In previous recessions,1980 and 1991,the region gained jobs. This follows New Mexico’s historical trend of trailing the national economy by up to two years.
Demographic Trends (Source: Headwater Economics Economic Profile System – https://headwaterseconomics.org/tools/economic-profile-system)
• All counties except Torrance have lost population since 1970. Torrance’s gain, however makes up for the losses in other counties.
• Quay has highest percentage of population loss (14.3%) between 2000 and 2015. Guadalupe had the smallest with 3.3%. De Baca lost 9.8% and Torrance, 6.3%. The U.S. gained 12.5% during that period.
• In the age groups, only the 45 and older groupings showed gains in region. The over-65 population increased by 1,248 between 2000 and 2015.
• The largest population loss between 2000 and 2105 was in the under-18 age group (2,717). The next largest was in the 35-44 year old age group (2,062).
• As a percentage of the population, the under 18 year old age group had the largest loss (6.2%) between 2000 and 2015. The 18-34 year old age group scored a gain of 1.1%. The 35-44 year old group lost 5.2%. The largest gain (5.3%) was in the 65+ years old group.
• The median age in the region increased 8% between 2000 and 2015 compared to 6.5% nationwide. Largest increase (24%) was in Torrance County, where the median age was 43.3 years in 2015, compared to 34.8 in 2000.
• All of the region’s decline in population is from outmigration, since births and deaths cancel each other out. Possible reasons include the loss of employment in specific industries, youth leaving for education or new opportunities, and elderly people leaving for better medical facilities
• Hardship-related transfer payments (TANF, SNAP) in the region are up by $106.4 million since 1970, a 154.6 % increase. Age related transfer payments are up by $77.6 million (82%) since 1970.
• Since 2010, personal income earnings in the region have risen by $15.2 million (3.5%). Farm earnings have risen the most - $3.2 million (36.9%). The largest decline in earnings percent-wise
12

(422%) has occurred in the construction sector - $20.9 million. Retail trade has posted the largest dollar loss - $5.4 million (12.8%).
• Between 2000 and 2015, the region performed below the nation on several socio-economic measures: population growth (-10.9% vs. 13.9%). On other socio-economic measures, the region performed better than the nation: per capita income growth (25.2% vs. 14.3%), growth in non-services related jobs (22.1% vs. 14.8%); growth in government jobs (20.6% vs. 12.7%) and average earnings per job (7.4% vs. 5.8%).
Regional Economic Data
13

• Average earnings per job in the ECNM region is only 60% of the national average; Guadalupe County 51%, and Quay 57%.
• Per capita earnings in Quay, Guadalupe and De Baca counties are higher per capita than “per job” earnings. In Torrance County, per job earnings are higher than the per capita. Nationally, per capita is about 82 % of per job earnings.
• The portion that non-labor income makes up of totalpersonalincome in the region is 55.9% compared to 36.1% nationally. Quay is the highest with 60.6%. The higher percentage of non-labor income in the region is probably due to an aging population receiving socialsecurity, retirement benefits and returns on investments.
• Leading occupations in Quay, Guadalupe and Torrance counties are management, professional and related jobs.
• Total employment in the region declined by 413 jobs (3.2%) between 2000 and 2015. Proprietors increased by 94 (2.4%). Wage and salary employment decreased by 507 (5.5%). The increase in the number of proprietors in the region at the same time there is a decline in wage and salary employment suggests an increase in self-employment in response to a weak regional economy.
• If proprietors’ employment is rising and realpersonalincome is falling in the region, this can be a sign of economic stress. Between 2000 and 2015, proprietors’ income in the region declined by $30 million (37%), from $81.1 million to $51 million.
• Labor earnings in the region are down $134.7 million (24.2%) since 1970. Total personal income, however, rose by $98.7 million (11.5%) and non-labor income increased by $219.9 million (70.2%) since 1970.
• Since 2015, total employment is up 336 jobs or 2.7%. Farm jobs are up 172 jobs (10.2%). Retail trade up 172 jobs or 1.1 %. Government is down by 278 jobs (9.6%).
• Earnings are higher than the national average in eight industry sectors in the region: mining where jobs pay 56.1% above the nationalaverage, accounting for 9.7 % of totalemployment in the region; manufacturing jobs that pay 271.3 %, almost triple, above the national average but accounts for only 2% of the region’s jobs; financial services pay 16.3% above the national average and account for 2.2% of jobs; professional and business services pay 17.5 % above the national average and account for 4.6% of jobs;education and health services pay 9.6% above the national average and account for 11.4% of jobs, federal government jobs pay 40.8% above the national average and accounts for 1.6% of total jobs; and state government jobs pay 19.5 % above the national average and account for 6.1% of jobs. Taken together, the 8 sectors account for about 38% of the region’s jobs.
• The industry sectors in the region with earnings below the national average include: leisure and hospitality jobs pay 60.3% below the national average and accounts for 14.3% of jobs; agriculture, forestry, fishing and hunting pays 19% below the national average and accounts for
14
2% of employment; and local government pays 1.6% below the national average but accounts for 23.1% of the total jobs in the region. These sectors account for 39% of the region’s jobs.
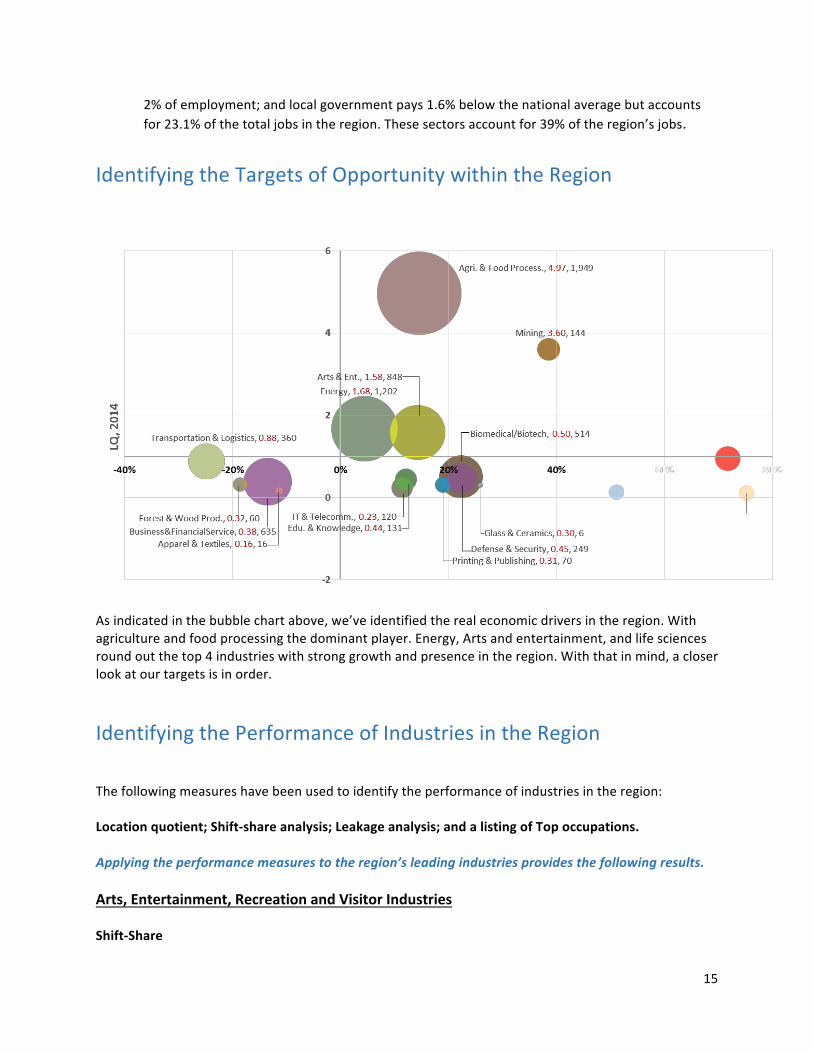
Identifying the Targets of Opportunity within the Region
As indicated in the bubble chart above, we’ve identified the real economic drivers in the region. With agriculture and food processing the dominant player. Energy, Arts and entertainment, and life sciences round out the top 4 industries with strong growth and presence in the region. With that in mind, a closer look at our targets is in order.
Identifying the Performance of Industries in the Region
The following measures have been used to identify the performance of industries in the region:
Location quotient; Shift-share analysis; Leakage analysis; and a listing of Top occupations.
Applying the performance measures to the region’s leading industries provides the following results.
Arts, Entertainment, Recreation and Visitor Industries
Shift-Share
15

The Star performer in this cluster with 515 jobs is “Hotels and motels (except casinos)”. This industry produced 27 more jobs in the ECNM region than national and industry trends would predict. Independent writers, artists and performers accounted for 73 jobs, two less than nationaland industry trends would predict. In the “allother amusement and recreation industries” category, there were 46 jobs, 23 more than trends would predict. “RV parks and campgrounds” and “Fitness and recreations sports centers” also posted more jobs, 15 and 25 respectively, than trends would predict.
Location Quotient Based on exports alone, the leader in this area is “hotels (except casinos)”, which accounts for $28.8 million in exports. The location quotient is 4.5, making this industry a strong net exporter for the region. In terms of LQ alone, the leader is “RV parks and campgrounds”, with an LQ of 11.7. Exports in this area total $4.7 million. “Bed and Breakfast Inns” showed an LQ of 11.8, with total exports of $3.8 million. “Fitness and recreational sports centers” and “independent artists, writers and performers”, showed LQs of 0.6 and 0.9 respectively, indicating they are not self-sufficient within the region. “Fitness and sport exports” totaled $100,000 in 2014, while “independent artists, writers and performers” showed exports of $500,000.
Leakage Only one input in arts, entertainment, recreation and visitor industries had more than $1 million in business. That was “corporate, subsidiary and regional managing offices”, which accounted for $2.57
16

million in business, all but 1 % of which was obtained from outside the region. Only “post office services” were met more than 50% within the region, with 48% provided outside. This area accounted for $200,000 in inputs. All other areas accounted for $500,000 or less each, but were obtained from outside the region between 76% and 100% in each case. These areas include “legal services”, “lessors of residential and non-residential buildings”, “real estate agents”, “advertising agencies”, “cheese manufacturing”, “janitorial services”, “landscaping services”, “temporary help services” and “wineries”.
Top occupations In terms of numbers, the top occupations in this sector are “maids and housekeeping cleaners”, and “hotel, motel and resort desk clerks”. There were 157 maids and cleaners, and 112 desk clerks and both showed a 13% rise from 2009 to 2014. Median hourly wages were only $8.40 for maids and cleaners and $8.70 for desk clerks. “Lodging managers” fared far better, there 61 of them working in 2014, a 39% rise from 2009, and their median hourly pay was $18.50 per hour, the second-highest paid category in the cluster. The highest-paid group was “tour guides and escorts”. There were 12 of them working in 2009, a 200% increase from 2009, and their average pay was $20 per hour.
Biomedical/Biotechnical
Shift-Share Analysis
“General medical and surgical hospitals” showed 173 employees, the largest employer in this cluster, that is 28 employees more than would be expected given national and industry trends from 2009-2014. A net total of 31 new jobs were created between 2009 and 2014 (The new Guadalupe County Medical Center may have accounted for most of this growth). “Home health care services” employed 90 persons, about 17 more than would have been expected between 2009 and 2014. There were 32 jobs added in this area between 2009 and 2014. “Pharmacies and drug stores” accounted for 57 jobs in 2014, and this is one less than expected considering national and industry trends.
“Other outpatient care centers”, “skilled nursing homes”, “outpatient mental health and substance abuse centers”, and “continuing care retirement communities” all showed more employment than expected, with “other outpatient centers” showing 28 more than expected and total employment of 52 in 2014.
17

Location Quotient Only one industry group in the cluster showed a location quotient indicating “exporting” status. That was “other outpatient care centers”, with an LQ of 5.1 based on $5.2 million in exports and 52 jobs in 2014. “Pharmacies” and “outpatient mental health services” showed self-sufficiency with LQ’s of 1.1 each. “Pharmacies” had $3.7 million in exports in 2014 and hired 57 employees. “Outpatient mental health centers” did $1.1 million in export business with 17 employees. All other areas, including “hospitals”, “home health care services”, “skilled nursing care facilities”, “assisted living facilities” and “continuing care retirement communities”, showed less than self-sufficient LQ scores, ranging from 0.3 (“continuing care”), and 0.8 (“assisted living facilities”).
Leakage While inputs in this area are relatively small, less than $1 million a year each, they are all obtained primarily from outside the region. From 83 % (“office administrative services”) to 100 % (“insurance” and “medical instruments”).
Top occupations “Registered nurses” top this list in both numbers and in pay, exceeded in pay only by “pharmacists” in the occupations listed. The occupations listed do not include physicians. The region hosted 66 RNs in 2014, 47% more than in 2009, and their median per-hour earnings were $27.60 per hour. The 11 pharmacists in the region earned a median of $54 per hour.
18

“Personal care” and “home health aide” followed with 41 % each. There were 2% fewer “personal care aides” and 17% more of “home health aides” in 2014 than in 2009. “Personal care aides” earn a median $8.70 per hour. “Home health care aides” earn a median $9.90 per hour.
The 11 “licensed practical and vocational nurses” working in the region in 2014 earned a median $19.90 per hour. “Pharmacy technicians”, 19 of them, earned a median $13.10 per hour.“Nursing assistants” earned a median $10.40. There were 25 of them working in the region in 2014.
Transportation and Logistics
Shift-share analysis “Rail transportation” is both the largest employer and shows the best regional performance in the transportation/logistics sector. Its 127 employees represent 52 more than would be expected, given national and industry trends from 2009-2014. On the other hand, the next-largest employer in the cluster, “general freight trucking, long-distance, truckload,” with 75 employees, totals 90 fewer than would be expected from national and industry trends.
In general, “trucking industries” within the cluster showed negative numbers in regionalperformance against national and industry trends, but much smaller deficiencies than in the “general freight trucking” sector. They include local “general freight trucking”, “specialized freight trucking”, and “less-than-truckload”, “long distance general freight trucking”, where shortages ranged from 5 to 16. “Couriers and express delivery services”, “vehicle towing services” and “interurban and rural bus transportation” all showed positive performance against expectation from 2009-2014.
19

Location quotient Led by “rail transportation” and “motor vehicle towing”, all of the sectors in the transportation/logistics cluster showed at least self-sufficiency, except “couriers and express deliver services”, which showed and LQ of 0.9.
“Motor vehicle towing” and “interurban and rural bus transportation” showed LQs of 5.6 and and 8.5 respectively, with exports of $2.4 million and $1.3 million, making both strong exporters. “Specialized, long distance trucking”, with $2.2 million in exports, showed an LQ of 2.2.
Leakage While only “petroleum refineries” and “couriers and express delivery services” required more than $1 million in inputs in 2014, “rail transportation” alone obtained more of its inputs from the region, 61%, from outside. “Petroleum refineries” inputs totaled $10.95 million in 2014 and allwere from outside the region. “Couriers and express services” accounted for $1.37 million in 2014, and 36% of these inputs originated inside the region. Other areas, including “railroad rolling stock manufacturing”, “wholesale trade agents and brokers”, “construction”, “freight transportation arrangements”, “engineering services”, “lawyers”, and “computer design services”, showed more than 80% of inputs obtained from outside the region.
Top occupations Overall, the transportation/logistics sector seems to be well-paid. The lowest-paid occupation seems to be “laborers” and “freight, stock and material movers”, who earn a median $12.60 per hour. There were 16 of them employed the region in 2014, an 11% drop since 2009.
The best paid occupation in the cluster is “railroad conductor” and “yardmaster”, which earns a median $34.30 per hour, followed closely by “locomotive engineers”, who earn a median $31.70 per hour. There were 23 “conductors” and “yardmasters”, and 21 “locomotive engineers” in 2014. There were 92% more “conductors” and “yardmasters” employed in 2014 than in 2009, and 75% more “railroad engineers”.
Another railroad occupation— “railroad brake, signal and switch operators”—earned a median $27.40 per hour. There were 10 employees in this occupation in 2014, up two-thirds from 2009-2014. There were 25 “light truck or delivery services employees” in 2014 earning a median $14.90 per hour, up 25% between 2009 and 2014. There were 23 “couriers and messengers” employed in 2014, up 10% from 2009’s level.
Agribusiness, Food Processing and Technology
Location quotient In the agribusiness, food processing and technology cluster,the largest exporters ranked by number of jobs were:
• “Animal production and aquaculture”, which exported $318.7 million in 2014, and accounted for 1,069 jobs in the region. Its LQ is 13, making it a very strong exporter
• “Crop production”, which exported $68.7 million in 2014 and accounted for 612 jobs. Its LQ is 5.7, making it a strong exporter.
20

• “Farm labor contractors and crew leaders”, which exported $300,000 but accounted for 35 jobs. Its LQ was 1.5, enough to classify it as an exporter.
• “Farm supplies merchant wholesalers” exported $3.7 million in 2014 and accounted for 32 jobs. Its LQ was 3.7,making it a strong exporter.
In LQ alone, the best performers were “other farm product raw materialmerchant wholesalers,” with an LQ of 19.1 (Exports, $1 million with 14 jobs), and “tobacco manufacturing” (the Sandia Tobacco Manufacturing plant in Moriarty) with an LQ of 17.1 ($15.1 million in exports and 17 jobs).
Shift-share analysis
The best performers in the agribusiness, food processing and technology cluster in the region , ranked by number of jobs in 2014 are:
• “Animal production and aquaculture”,which accounted for 1,069 jobs and between 2009 and 2014 produced 96 more jobs than expected, creating 77 jobs, which bucked a trend that would have predicted a loss of 19 jobs in the area. Again, this is very strong area in ECNM.
• “Crop production” accounted for 612 jobs in 2014, creating 125 jobs in the 2009-2014 period, against a trend that was expected to net only eight jobs in the region. The actual net gain in crop production for the region was 117.
• “Farm Labor contractors and crew leader” accounted for 35 jobs in 2014. It produced 12 jobs from 2009-2014, nine more than expected in the region .
• Other stars were “Farm Supplies Merchant Wholesalers”, where 17 jobs were created from 2009-2014, where trends showed 1, netting a gain of 16, and cheese manufacturing, where six more jobs than expected were created from 2009-2014.
• Nine of 11 industries in this cluster showed better-than-expected performance.
21

Leakage Animal production and aquaculture inputs totaled $77.92 million in goods and services and only 6% came from sources within the region. “Other animal food manufacturing,” inputs totaled $46.3 million, all from outside the region. “Crop production” inputs totaled $19.47 million, and 90% came from outside sources. Only in “cheese manufacturing” and “rail transportation” do the industries obtain more than half of their needs locally. That’s 55% for “cheese manufacturing” and 53% for “rail transportation”.
Top occupations Farmers, ranchers and other managers dominate the cluster, accounting for1,369 jobs. There was a 9% increase in this category from 2009-2014. Median earnings; $13 per hour. The next highest number of jobs in the cluster are in “Farmworkers and laborers, crop nursery and greenhouse,” accounting for 179 jobs and a 48% growth rate from 2009-2014. Median hourly wage, however, is only $9.50.
The highest-paid occupation in this cluster is “sales representatives, wholesale and manufacturing, except technical and scientific products.” There are only 16 jobs in this cluster, representing a 129% increase 2009-2014. Median hourly pay is $21.20.
Energy (Fossil and Renewable)
Shift-Share analysis As befits the region’s location on the I-40 corridor, “automotive fuels” dominate the jobs picture. “Other gasoline stations” hired 307 persons in 2014, representing 57 more jobs than national and industry trends would predict.“Petroleum bulk stations and terminals” hired 96 persons, 91 more than expected. Mysteriously, “gasoline stations with convenience stores” accounted for 256 jobs in 2014, but that total was 83 less than national and industry trends would have anticipated.
The region’s “electric power distribution” and “plumbing/HVAC” contractors had 78 and 73 employees respectively, but these totals were less than would be expected. “Electric distribution” came 57 employees short of expectations, while “plumbing/HVAC” saw a shortage of 11 employees.
Out of 12 industries listed, only four showed less-than-expected employment in the energy cluster. Besides “electric distribution” and “plumbing/HVAC”, “Power and communication line and related structures construction” showed 26 employees, about 20 less than expected. “Engineering services” showed 14 employees, which was 14 less than expected.
“Electrical contracting”, “Crude petroleum and natural gas extraction”, “other heavy and civil engineering and construction,” “fuel dealers”, “water and sewer line and related structures construction” and “electric bulk power transmission and control” all showed employment in excess of expectations.
22

Location Quotient “Other gasoline stations” and “petroleum bulk stations and terminals” each scored location quotients of 39.2, indicating huge export trade. “Gasoline stations” accounted for $19.3 million in exports and “bulk stations and terminals” accounted for $30.3 million in exports. “Gasoline stations with convenience stores” scored an LQ of 4.5, accounting for 256 jobs in the region and $12.7 million in exports.
The region also shows export strength in the “basic energy sources of electricity and natural gas”, scoring an LQ of 8.6 in “power transmission and control” employees ($8.8 million in exports); of 5.4 in “natural gas distribution” (45 employees, $29.6 million in exports); and an LQ of 5.1 in “electric power distribution” (78 employees, $29.6 million in exports).
Leakage Only in the area of “other professional, scientific and technical services” does the energy sector obtain close to half of the resources it needs from regional sources. It receives 48% of its needed resources locally of the $640,000 in inputs required.
No other input area is provided more than 20% from local sources. The percentages range from 81% (“Commercial banking”, $1.55 million, 19% local) to “refineries”, “general warehouse and storage”, “pipeline transportation of natural gas” and “lessors of nonfinancial intangible assets,” all of which are obtained 100% from outside the region. “Refineries” require $3.4 million in inputs. The rest are under $1 million each.
23

Top occupations In terms of numbers, the top occupation is cashiers in the energy category. There were 350 of them in 2014, earning a median $8.80 per hour. There were 3% more “cashiers” working in 2014 than in 2009. In terms of pay, the top occupation was “electricalengineers”, who earn a median $39.60 per hour. There were 14 of them in 2014, representing a 17% increase since 2009. “General and operations managers” earned a median $33.50 per hour, experiencing a 38% increase between 2009 and 2014. There were 29 “general and operations managers” working in the region in 2014.
The lowest paid group was “combined food preparation and service workers, including fast food,” who earned a median $8.30 per hour in 2014. There were only 20 of them working in 2014, representing an 11% increase since 2009.
There was a large increase in demand for “heavy and tractor-trailer truck drivers”, 213% between 2009 and 2014. There were 25 employed in 2014, earning a median $19.60 per hour. The largest decrease in employment was among “electricians”. There were 25% fewer in 2014 than in 2009, leaving 18 employed in 2014. Median pay was $17.40 per hour. “Managers, all other” also experienced a large gain from 2009-2014 with 89%. There were 17 working in the region, earning a median $17.20 per hour.
24

Regional Economic Development Goals
Our Vision
“By working together our East Central New Mexico communities and regionwill growand prosper.”
ABCs of Successful Planning
Economic development is a process that requires a change in stakeholder behavior, which comes from the acquisition of new information, knowledge and skills. The ABC of Successful Planning tool shows the connection between (A) attitudes, knowledge and skills; (B) behavior and (C) conditions in the strategies chosen to achieve an economic development goal. The goals, strategies, and plans of action outlined below were developed utilizing that process.
Example: The economic development goal is to build a stronger small business base in the region. The strategy to accomplish this is to increase e-commerce in the region. The ABC connections include small business owners attending a training session (strategy) where they learn how a Web presence could enhance their business sales (knowledge). They then decide to create a well-designed website (attitude), and they learn the ‘how to’ principles of building and maintaining the site (skills). Because of these changes in attitude, knowledge and skills,the business owners build business websites (behavior) and, as a result, their annual sales and profits increased (condition). This condition,then,helped to successfully reach the overall goal of building a stronger small business base in the region.
Goal 1: WORKFORCE DEVELOPMENT -THE ECNM SET REGION WILL BE RECOGNIZED AS A HIGH-QUALITY WORKFORCE REGION BY 2020.
Regional Economic Benefits: Increased ability to identify and address the needs of existing employers and prospective business considering the region as a home for business relocation or expansion, and the ability of the region’s workforce to meet those needs will provide opportunities for personal and regional economic growth.
STRATEGIES
1.1 Achieve certified Work Ready Community status in all the ECNM SET Region counties by 2019 via media campaigns, one-on-one meetings and educational programs leading to buy-in evidenced by formation of workforce development groups, resolutions of support from governmental bodies and pursuit by all counties of Work Ready Community Status from ACT.
25

Plan of Action
Steps to accomplish Responsibility Key contact Goal date Form workforce development groups
County EDCs, Chambers of Commerce, Education leaders
Pat Vanderpool -Tucumcari
June 30, 2017
Media campaigns, one-on-one meetings
County workforce teams’ designees
Pat Vanderpool -Tucumcari
Dec. 30, 2017
Resolutions of support, education programs
County workforce teams, county and city representatives
Steve Hansen – Tucumcari Teresa Salazar – Moriarty Wade Holdeman – FSID Richard Perea – Santa Rosa
Dec. 30, 2017
Achieve buy-in from businesses and other employers
All workforce team members
Steve Hansen – Tucumcari Teresa Salazar – Moriarty Wade Holdeman – FSID Richard Perea – Santa Rosa
March 30, 2018
Achieve buy-in from job-seekers and the unemployed
All workforce team members, DWS
Steve Hansen – Tucumcari Teresa Salazar – Moriarty Wade Holdeman – FSID Richard Perea – Santa Rosa
March 30, 2018
Increase hope among job-seekers and chronically unemployed
Workforce team, employers, educational leaders, school officials
Steve Hansen – Tucumcari Teresa Salazar – Moriarty Wade Holdeman – FSID Richard Perea – Santa Rosa
June 30, 2018
Recruit enough employers to qualify for initial Work Ready Community designation in all ECNM counties.
Workforce team, employers, educational leaders, school officials
Steve Hansen – Tucumcari Teresa Salazar – Moriarty Wade Holdeman – FSID Richard Perea – Santa Rosa
June 30, 2018
Administer the WorkKeys test to enough job-seekers and employees to qualify for initial Work Ready Community designation in all ECNM counties.
Workforce team, employers, education leaders, school officials
Reba Zollars – NM DWS June 30, 2018
Reports on individual successes
Workforce team, employers, educational leaders, school officials
Steve Hansen -Tucumcari
Dec. 30, 2018
Programs in place to maintain WRC designation in allECNM counties.
Workforce teams Steve Hansen -Tucumcari
Dec. 30, 2018
26

Additional Strategies
1.2 Conduct employer outreach in the ECNM SET region for the purpose of job profiling and skill-gap analysis by 2020.
1.3 Implement employability, customer service and skills gap training programs by 2021.
TARGET OUTCOMES Short Term (Year 1)
o An ECNM SET workforce group has been formed including key stakeholders from education and the business community.
o County level workforce groups have been formed including key stakeholders from education and the business community.
Intermediate (Year 2-3) o All four counties in the ECNM SET region are participating in the ACT Work
Ready Communities initiative o County teams are conducting media campaigns and one-on-one meetings with
targeted employers
Long Term (Year 4 and beyond) o All four counties in the ECNM SET region have achieved “Certified Work Ready
Communities” status o Regional and county level workforce teams are conducting outreach to existing
employers and developing their “workforce story” to provide to prospective businesses
The ABCs of Successful Planning Elements A(Attitudes, Behavior and Skills) –Strategy 1.1 and 1.2 B(Behavior) – Strategy 1.3 C(Condition) – Target Outcomes (Short, Intermediate, Long Term)
Evaluation Plan/Progress Indicators
Goal 1: Workforce Development – The ECNM SET Region will be recognized as a high-quality workforce region by 2020. Progress indicators include:
• Number of meetings and educational programs conducted • Number of attendees at the meetings and educational programs • Number of workforce development groups formed • Number of resolutions from governmental bodies and educational institutions received • Number of employer job profiling and skill-gap analysis surveys completed • Number of employability, customer service and skills gap training programs conducted • Number of attendees at the training programs
27

Goal 2: TOURISM – INCREASE ATTENDANCE AT TOURISM-RELATED ACTIVITIES IN THE ECNM SET REGION BY 50% BY APRIL 2020
Regional Economic Benefits Increased attendance at tourism-related activities and events through the promotion of existing attractions and the creation of new ones will bring additional revenues into the region creating jobs and promoting economic development in the region.
STRATEGIES 2.1 Promote attendance at tourism-related activities and events in the region through the use of maps, calendar of activities and events, apps, and web-site.
STRATEGY 2.1:Promote attendance at tourism-related attractions and events in the region through the use of maps, calendar of activities and events, apps, and web-site.
Steps to Accomplish Responsibility Key Contact Goal Date Work with Chambers of commerce, small businesses, museums, art galleries, Mainstreet organizations in the region to form a tourism promotion committee
Gail Sanders, Gail Houser, Danica Gonzales, Debbie Pogue, Justin Ingram
Debbie Pogue -Moriarty
April 2018
Hold public meetings to obtain information on tourism-related activities and events.
Gail Sanders, Gail Houser, Danica Gonzales, Debbie Pogue, Justin Ingram
Debbie Pogue – Moriarty Gail Sanders – Tucumcari Karmen Sandoval – Santa Rosa Justin Ingram – Ft. Sumner
April 2018
Develop maps and calendar of tourism-related activities and events for the region
Chambers of commerce – local tourism officials
Debbie Pogue – Moriarty Gail Sanders – Tucumcari Karmen Sandoval – Santa Rosa Justin Ingram – Ft. Sumner
April 2018
Hold public meetings to distribute and promote the maps and calendar.
Tourism Promotion Committee
Debbie Pogue – Moriarty Gail Sanders – Tucumcari Karmen Sandoval – Santa Rosa Justin Ingram – Ft. Sumner
June 2018
Update map and calendar.
Tourism Promotion Committee
Debbie Pogue -Moriarty
Annually
Develop apps and website to promote tourism in the region.
Tourism Promotion Committee
Debbie Pogue – Moriarty Gail Sanders – Tucumcari Karmen Sandoval – Santa Rosa Justin Ingram – Ft. Sumner
April 2019
28

Update apps and website.
Tourism Promotion Committee
Debbie Pogue – Moriarty Gail Sanders – Tucumcari Karmen Sandoval – Santa Rosa Justin Ingram – Ft. Sumner
Annually
Develop and conduct customer service and hospitality training for staff of tourism-related businesses and venues
Tourism Promotion Committee
Debbie Pogue -Moriarty
Developed by April 2018 – training quarterly beginning May 2018
Additional Strategies
2.2 Expand current tourism-related activities and events and create new attractions in the region
TARGET OUTCOMES Short Term (Year 1)
o Promote attendance at tourism-related activities and events in the region through the use of maps, calendar of activities and events, apps, and web-site.
o Expand current tourism-related activities and events and create new attractions in the region
Intermediate (Year 2-3) o Develop and conduct customer service and hospitality training for staff of
tourism-related businesses and venues
Long Term (Year 4 and beyond) o Increased attendance at tourism-related activities and events through the
promotion of existing attractions and the creation of new ones will bring additional revenues into the region creating jobs and promoting economic development in the region.
The ABCs of Successful Planning Elements A (Attitudes, Behavior and Skills) –Strategy 2.1 B (Behavior) – Strategy 2.2 C (Condition) – Target Outcomes (Short, Intermediate, Long Term)
Evaluation Plan/Progress Indicators
Goal 2: Tourism – Increase attendance at tourism-related activities in the ECNM SET Region by 50% by April 2020. Progress indicators include:
• Regional tourism promotion committee formed • Number of informational meetings held • Number of attendees at the meetings • Number of organizations providing information on tourism-related events • Regional calendar of events developed
29

• Number regional calendar of events distributed • Regional tourism website developed and launched • Number of people attending tourism-related events in the region
Goal 3: HEALTHCARE – ESTABLISH A REGIONAL EMS STRUCTURE TO BETTER SERVE THE NEEDS OF RURAL COMMUNITIES IN THE ECNM SET REGION BY 2019 TO ASSIST ISOLATED RESIDENTS IN THE OBTAINING ACCESS TO HEALTHCARE SERVICES.
Regional Economic Benefits: Increased access to health care will improve quality of life in the region and make the region more attractive to new industries. The development of a regional EMS academy will provide opportunities for employment in itself.
STRATEGIES 3.1 Develop a regional stakeholder team to evaluate EMS critical needs and develop training goals.
Coordinate with existing training programs to improve access and increase in number the training classes provided.
3.2 Work with local and state colleges to develop a regional EMS Academy.
STRATEGY 3.1: 3.1 Develop a regional stakeholder team to evaluate EMS critical needs and develop training goals. Coordinate with existing training programs to improve access and increase in number the training classes provided.
Steps to Accomplish Responsibility Key Contact Goal Date Develop steering Members of the SET Christina Campos – Santa
committee to include regional stakeholders.
health care planning team and the
Rosa Justin Ingram – Ft. Sumner Jared Langenegger –
Including EMS directors, regional medical Tucumcari City Administrators, EMS services coalition – Ted Hart - Moriarty
Medical Directors and team leadership to Regional EMS be designated representatives. Identify training needs EMS Steering Christina Campos – Santa
regionally to improve EMS services.
Committee Rosa Justin Ingram – Ft. Sumner Jared Langenegger – Tucumcari Ted Hart - Moriarty
Coordinate with air (same) Christina Campos – Santa
ambulances, regional trainers, and other EMS
Rosa Justin Ingram – Ft. Sumner Brenda Bishop – Tucumcari
programs to develop Ted Hart - Moriarty rotating regional
30
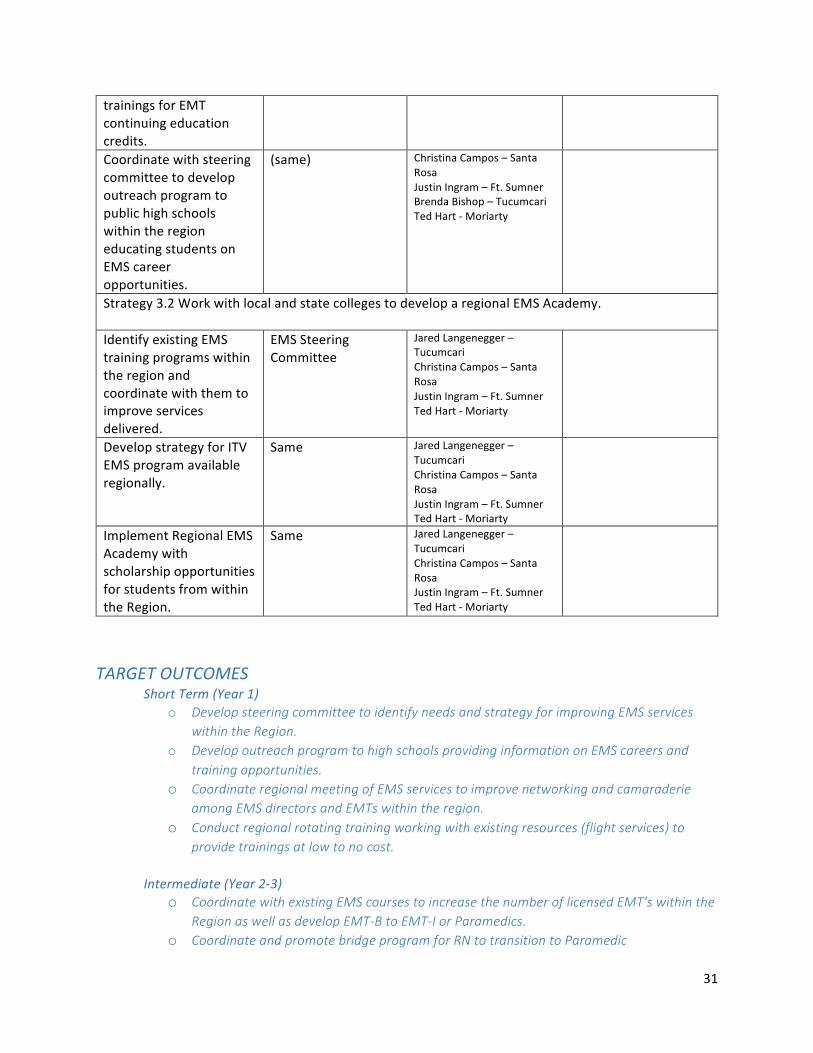
trainings for EMT continuing education credits. Coordinate with steering committee to develop outreach program to public high schools within the region educating students on EMS career opportunities.
(same) Christina Campos – Santa Rosa Justin Ingram – Ft. Sumner Brenda Bishop – Tucumcari Ted Hart - Moriarty
Strategy 3.2 Work with local and state colleges to develop a regional EMS Academy.
Identify existing EMS EMS Steering Jared Langenegger –
training programs within the region and
Committee Tucumcari Christina Campos – Santa Rosa
coordinate with them to Justin Ingram – Ft. Sumner improve services Ted Hart - Moriarty
delivered. Develop strategy for ITV Same Jared Langenegger –
EMS program available regionally.
Tucumcari Christina Campos – Santa Rosa Justin Ingram – Ft. Sumner Ted Hart - Moriarty
Implement RegionalEMS Same Jared Langenegger –
Academy with scholarship opportunities
Tucumcari Christina Campos – Santa Rosa
for students from within Justin Ingram – Ft. Sumner the Region. Ted Hart - Moriarty
TARGET OUTCOMES Short Term (Year 1)
o Develop steering committee to identify needs and strategy for improving EMS services within the Region.
o Develop outreach program to high schools providing information on EMS careers and training opportunities.
o Coordinate regional meeting of EMS services to improve networking and camaraderie among EMS directors and EMTs within the region.
o Conduct regional rotating training working with existing resources (flight services) to provide trainings at low to no cost.
Intermediate (Year 2-3) o Coordinate with existing EMS courses to increase the number of licensed EMT’s within the
Region as well as develop EMT-B to EMT-Ior Paramedics. o Coordinate and promote bridge program for RN to transition to Paramedic
31

o Developscholarshipsforparamedic andadvancedtrainingwithintheRegion.
Long Term (Year 4 and beyond) o Coordinate with a local college to develop ITV EMT training program available regionally. o Evaluate operations on a continual basis to ensure sustainability. o Residents in the region improve their health status
The ABCs of Successful Planning Elements A (Attitudes, Behavior and Skills) –Strategy 3.1 B (Behavior) – Strategy 3.2 C (Condition) – Target Outcomes (Short, Intermediate, Long Term)
Evaluation Plan/Progress Indicators
Goal 3: Healthcare – Establish a regional EMS structure to better serve the needs of rural communities in the ECNM SET Region by 2019 to assist isolated residents in the obtaining access to healthcare services. Progress indicators include:
• Establishment of a stakeholder group to provide input regarding specific EMS needs
• Establishment of rotating regional training opportunities to improve EMS knowledge and skills
• Outreach to high schools within the region recruiting future EMT’s
• Number of new EMT licenses obtained
• Number of advanced classes provided within the region
• Development of local scholarships for individuals to attend paramedic training
• Establishment of a regional EMS academy to increase the number of licensed EMT’s and improve accessibility to training
Goal 4: AGRIBUSINESS AND ENERGY – INCREASE BY 30% THE NUMBER OF PRODUCERS IN THE ECNM SET REGION ENGAGED IN LIVESTOCK, IRRIGATED AND AQUA-CROP PRODUCTION AND VALUE-ADDED PRODUCTS BY 2020.
Regional Economic Benefits Increased production of livestock, irrigated and aqua-crop production and value-added product activities will increase income and employment opportunities contributing to the economic development of the region.
Strategies 4.1 Conduct research to determine: (1) current livestock, irrigated and aqua-crop production levels and number of producers in the region; (2) current value-added activities by type and number of business in
32

the region; and (3) education and training activities and resources available to increase the number producers and value-added businesses in the region. 4.2 Develop plans to encourage, promote and support new livestock, irrigated and aqua-crop producers and value-added businesses as well as the expansion of existing operations in the region.
STRATEGY 4.1: Conduct research to determine: (1) current livestock, irrigated and aqua-crop production levels and THE number of producers in the region; (2) current value-added activities by type and number of business in the region; and (3) education and training activities and resources available to increase the number producers and value-added businesses in the region.
Steps to Accomplish Responsibility Key Contact Goal Date Establish research team and protocols
Bob Hockaday,David White, Tim Hagaman, Mary Baca, Luis Sanchez,Aspen Achen, Leigh Ann Marez
Leigh Ann Marez – Santa Rosa
October,2017
Conduct research Bob Hockaday, David White, Tim Hagaman, Mary Baca, Luis Sanchez,Aspen Achen, Leigh Ann Marez
Leigh Ann Marez – Santa Rosa
November, 2017
Hold public meetings to present research findings. Solicit input for designing plans and securing resources
Bob Hockaday, David White, Tim Hagaman, Mary Baca, Luis Sanchez,Aspen Achen, Leigh Ann Marez
Leigh Ann Marez – Santa Rosa
December, 2017
STRATEGY 4.2: Develop plans to encourage, promote and support new livestock, irrigated and aqua-crop producers and value-added businesses as well as the expansion of existing operations in the region.
Develop plans County Extension agents Bob Hockaday, David White, Tim Hagaman, Mary Baca, Luis Sanchez,Aspen Achen, Leigh Ann Marez
Leigh Ann Marez – Santa Rosa Aspen Achen – Ft. Sumner
December 2017
Implement plans County Extension agents Bob Hockaday, David White, Tim Hagaman, Mary Baca, Luis Sanchez,Aspen Achen, Leigh Ann Marez
Leigh Ann Marez – Santa Rosa Aspen Achen – Ft. Sumner
February 2018
Monitor and adjust planned activities as needed
County Extension agents Bob Hockaday, David White, Tim Hagaman, Mary Baca, Luis Sanchez,Aspen Achen, Leigh Ann Marez
Leigh Ann Marez – Santa Rosa Aspen Achen – Ft. Sumner
February 2019
TARGET OUTCOMES Short Term (Year 1) o Determine current livestock, irrigated and aqua-crop production levels and number
of producers in the region
33

o Determine current value-added activities by type and number of business in the region
o Hold public meetings to present research findings. Solicit input for designing plans and securing resources
Intermediate (Year 2-3) o Develop plans to encourage, promote and support new livestock, irrigated and aqua-
crop producers and value-added businesses as well as the expansion of existing operations in the region.
Long Term (Year 4 and beyond) o Increase production of livestock, irrigated and aqua-crop production and value-
added product activities in the region. o Increase income and employment opportunities contributing to the economic
development of the region.
ABCs of Successful Planning Elements A (Attitudes, Behavior and Skills) –Strategy 4.1 B (Behavior) – Strategy 4.2 C (Condition) – Target Outcomes (Short, Intermediate, Long Term)
Evaluation Plan/Progress Indicators
Goal 4: Agribusiness and Energy – Increase by 30% the number of producers in the ECNM SET Region engaged in livestock, irrigated and aqua-crop production, and value-added products by 2020. Progress indicators include:
• Research establishing current livestock, irrigated and aqua-crop production levels and number of producers in the region completed
• Research establishing current value-added activities by type and number of businesses completed
• Research to identify current education and training activities and resources available to increase the number producers and value-added businesses in the region completed
• Plans to encourage, promote and support new producers and value-added businesses completed.
• Number of new livestock producers in the region • Number of new irrigated crop producers in the region • Number of new aqua-crop producers in the region • Number of new value-added businesses in the region
34

EAST CENTRAL NEW MEXICO SET REGION
Patrick Vanderpool, Member, Leadership Team Greater Tucumcari EDC
P.O. Box 1392 Tucumcari, NM 88401
575-461-4079
National Partnership for Stronger Economies Together
35