Embed Size (px)
Citation preview

1
Earthquake Machine & Elastic ReboundBackground page to accompany the animations on the website: IRIS Animations
IntroductionThe outer hard shell of the Earth is broken into
about dozen major plates. Large earthquakes are generated at the contact between the plates. The plates can glide along at a few centimeters per year over the hot materials below them. Earthquakes are not generated at this lower boundary because at 80-km depth the high temperature and pressure allows the rocks to slowly and permanently deform (think Big Hunk candy bar: brittle when cold, ductile when warm). At shallow depths, however, along the faults that form the boundary between the plates, the rocks deform and rebound as the plates move past one another. As deformation increases, stress also increases, until fault slippage releases the stored elastic energy. This process is called elastic rebound.
ConceptsStudents work cooperatively to develop and test
a hypothesis, make measurements, and write a short report on the results with graphs. They learn the concept of elastic rebound: energy is first stored and later released with an “earthquake”. Earthquakes can provide a useful context for teaching or reviewing many basic physics concepts, such as sliding and static friction, forms of energy and conversion from one form to another, and the elastic properties of materials. This lab could be part of an Earth science course, but could also be used in general science or physics. Consider spending one period in inquiry with the rubber bands and blocks of wood, and then a second one doing this more directed experiment.
Description of the ModelThe sandpaper contact represents the contact
between two plates where a fault occurs; sandpaper creates the friction between the blocks. The blocks are the mass that is going to be moved in an earthquake. The movement of the hand represents the motion of a plate interior as the tectonic plates movie around at a steady rate. But they are stuck at the plate boundaries. These boundaries can break and skid along with many small earthquakes, or they can build up stress and let go with a great earthquake.
The strain is building up on the rubber band, and eventually it overcomes the frictional resistance (stress) at the fault contact. When the stress overcomes the resistance we have an earthquake. Even though the hand is moving at a steady rate, we still get stick slip along the fault and the exact second that the friction will be overcome cannot be predicted.
Figure 1: Basic single-block model of the “earthquake machine.” The hand represents the regional force acting on the plate which, in this case, pulls on a rubber band. The force applied is proportional to the length of the rubber band. Even though the hand is moving at a steady rate, we still get stick slip along the fault and the exact second that the friction will be overcome cannot be predicted.
Link to Vocabulary (Page 15)
Resources for background information on elastic rebound:
Activity: Earthquake Machine, P 4 Activity: Earthquake Machine Lite-1
Activity: Earthquake Machine Lite-2
AnimationsElastic Rebound on a Strike-slip Fault
Elastic Rebound in a Subduction Zone

2
Stress and Friction*Stress is force divided by the area of the fault (or wood block in this case). Since the area is constant, the length of the spring is also proportional to the stress applied to the fault. The frictional strength of the fault depends on the roughness of the sandpaper on the block and the board, on the area of the block, and on the force pushing the block against the board. This force is simply the weight of a rock (or any other weight) placed on top of the block. Note that there is a difference between static friction and dynamic friction. When at rest, the strength of the fault is determined by the static friction. However, as soon as the block
starts moving, the strength (the stress which stops the mo-tion) is determined by the dynamic friction. Static friction is always greater than dynamic friction; the friction is stronger when the block is at rest than when it is when moving. Finally, the displacement of the fault is simply the position of the block measured on the centimeter scale on the board. The slip during a particular “earthquake” is simply the dif-ference in displacement before and after the earthquake.
[*From Jeff Barker, Binghamton University}
Questions to ask students
In this model, what does the wood block represent? (The plates)
What does the rubber band represent? (The forces acting on the plate)
What does the sandpaper represent? (The contact between one plate and another plate)
What does a moving block represent? (An earthquake)
What kind of energy does the rubber band have? (Potential OR elastic potential)
What kind of energy does the moving block have? (Kinetic)
Describe the energy changes that occur with the model. (The potential energy in the rubber band is transformed into kinetic energy when the block moves.)
Draw a diagram of observations (story board?)
Describe what parts of the model have balanced forces (the unmoving block) and unbalanced forces (when the block speeds up from resting, accelerates, and then stops).
Time vs. Distance and Time vs. Strain—These shows the “Earthquake Machine” using two blocks with different grit sandpaper, thus different friction. Animation illustrates the build up and release of strain in locked and slow slip zones. The first block, in red, has fine sandpaper on its bottom and simulates the slow slip zone between tectonic plates. The second block with coarse sandpaper on its bottom side, simulates the locked zone of two plates. As the first rubber band is slowly pulled, strain builds up. Once enough energy is stored in the rubber band to overcome the friction of the sandpaper under the red block, the red block slips slightly. Once the red block slips, the rubber band between the red and blue wood block stretches slightly. As this rubber band continues to stretch, the strain between the blocks builds until the blue block finally moves. The movement of the blue block would be equivalent to a major earthquake.

3
Slip Predictable— Similar to Time Predictable, in this model the stress always drops to the same level after an earthquake. In this model the stress always drops to the same level after an earthquake. Once an earthquake has occurred, then one knows that the slip during the next earthquake will be equal to the plate motion that has subsequently occurred. The longer the time since the last event, the larger the next event will be.
Time Predictable— This means that the larger the slip in the last earthquake, the longer the wait until the next one. In this model an earthquake always happens when the stress level reaches the same high value. The slip during each earthquake is variable, so the stress level after each earthquake is not always the same. Once the slip in one event has been measured, then it is known that the next event will happen when exactly this amount of plate motion has occurred.
Perfectly Periodic— This means that the larger the slip in the last earthquake, the longer the wait until the next one. In this model an earthquake always happens when the stress level reaches the same high value; and during the earthquake the stress always drops to the same low value. All of the earthquakes have the same slip, and they are equally spaced in time.
Earthquake Hypotheses That Can Be Explored With The Model*
These graphs illustrate four idealized models of earthquake recurrence for a fault that bounds two plates that are in steady motion with respect to each other.
Creeping— There are fault seg-ments that move by creep rather than by large earthquakes. This appears to be the case for the San Andreas fault where is passes through Hollister, California. The fault moves by a series of creep events, and each year the total slip from creep is the same as the amount of relative plate motion.
4
IntroductionEarthquakes can provide a useful context for teaching
or reviewing many basic physics concepts, such as sliding and static friction, forms of energy and conversion from one form to another, and the elastic properties of materials. Conducting the following lesson provides an opportunity for students to work cooperatively together, develop and test a hypothesis, make measurements, and write a short report on the results with graphs. This lab could be part of an earth science course, but could also be used in general science or physics. Depending on the instructions given, this lesson could be made more “inquiry based” than what I describe below. One possibility would be to spend one period in inquiry with the rubber bands and blocks of wood, and then a second one doing this more directed experiment.
Grade level
I believe the level of this lab is about right for 7-9th grade, but it could be adapted for higher or lower grades as well. In fact, there is a published version suitable for college students (Hall-Wallace, 1998).
Timing: Best time for students to do this investigation
Although this lab could be done after a unit on energy or friction, these topics could also be introduced following when a large earthquake has been reported in the news. At this time the students will be particularly interested in what causes earthquakes, and this curiosity would help them learn more about the basic science concepts of energy and friction, review their knowledge of plate tectonics, practice undertaking a guided inquiry, and writing a report on their results.
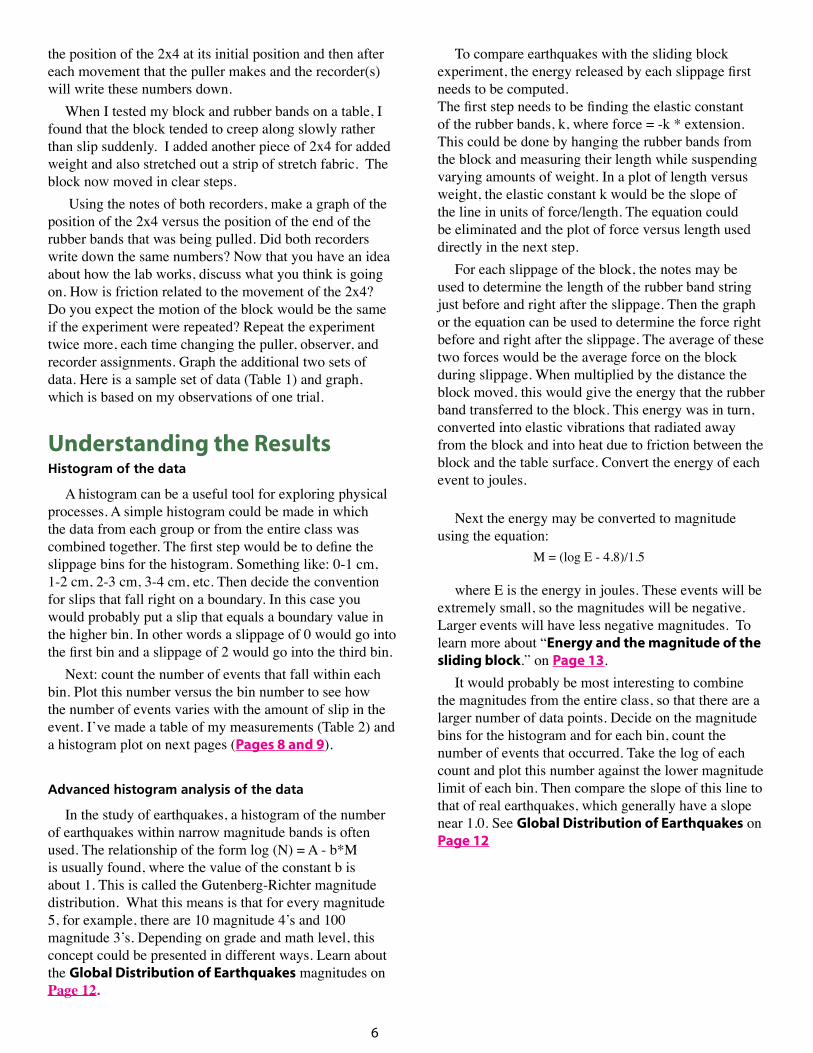
Background Information
The Earth’s outer, hard shell is very thin as compared to the radius of the Earth, about 80 km as compared with 6380 km. That’s similar to comparing the thickness of an apple’s skin to its radius. During the past 35 years, scientists in the fields of geophysics, geology, and oceanography have discovered that this hard outer shell is broken into about a dozen major “plates” that are slowly sliding about with respect to each other (figure at right).
Tectonic earthquakes are caused by a sudden slippage along the boundary (fault) between two plates. The type of motion that occurs between two plates is used to classify faults as strike-slip (one plate slides past another), thrust (one plate slides under another) or normal (plates that are
Earthquake Slip Classroom Activity and Quiz
From John Lahr’s website: http://jclahr.com/science/earth_science/tabletop/earthshaking/
Table of ContentsIntroduction Timing: Best time for students to do this investigation Background Information Discussion and research topics
The Activity Page 5 Teacher preparation In-class inquiry Student instructionsUnderstanding the Results Page 6 Histogram of the data Advanced histogramQuiz Page 10
Answers to questions Scoring Rubric
References Acknowledgements Links
MaterialsIf this is used for demonstration, only one set of materials
is needed. Otherwise, a set per each group of 3-4 students.A piece of 2x4 wood, cut approximately 13 cm long.• 10 thin rubber bands (looped together for a total length • of about 16 cm)A meter stick or tape measure• A flat working surface about 1.5-m long, such as • a wooden tabletop. (If all of the tabletops are very smooth, such as plastic laminate, then a 1-m long 1”x6” pine board should be used as the sliding sur-face, because a very hard and smooth surface may not generate stick-slip events. The Earth doesn’t always generate stick-slip events either, such as in the creeping section of the San Andreas fault in Holister, California.)
pulling apart from each other). Although one might expect earthquakes at the base of the plates, where they slide over the materials of the Earth’s mantle, the high temperature and material properties at 80 km depth are such that plates slide along without generating earthquakes on their lower surfaces.
Typical rates of plate motion are a few cm per year. Why then, might someone ask, do destructive earthquakes occur in which many meters of fault slip happen so quickly that the vibrations are recorded by seismographs all around the world and are sometimes strong enough to destroy nearby buildings and bridges? This is where

5
friction and elasticity come into play. Since the shallow portions of the plates are relatively cool, two plates cannot flow past each other, but rather the faults that form their boundaries tend to stick or lock up for years or centuries at a time. Each year the portions of plates near locked faults deform elastically by a few more cm. The more the plates are bent and deformed, the greater the force is on the fault (shear stress). Eventually the force is sufficient to make the plates break free of one another and the elastic energy that has been stored up is released as frictional heating on the fault and ground vibrations. (seismic waves). This process of faulting is called stick-slip or elastic rebound.
The initial force on the fault must be able to overcome static friction. Once the fault starts slipping, then slip will continue until the force drops below the resistance of sliding friction. The force available to keep the fault slipping decreases as the distorted plates return to their original shape.
Discussion and research topics
This topic could also lead to discussions and/or reports on the topic of earthquake hazards that contain elements of both science and social studies. These could include the spectrum from preparations that an individual or family could make, such as maintaining a supply of food and water, to government policy decisions, such as adopting and enforcing building codes or funding studies to assess earthquake hazards. Questions could be raised, such as, “should schools, hospitals, and fire stations be built to the same safety standards as homes?” “How about bridges and apartment buildings?” If the internet is available, students could try to look for answers to questions such as, “What is the largest earthquake that has occurred in this state?” or “How does the seismic hazard of my community compare with that of California?” or “Which were the largest 10 earthquakes to occur within the United States and how much damage did they cause?”
The Activity
Teacher preparation
In addition to gathering the materials needed for each group, as indicated in the next section, it is important to experiment with some of the blocks of wood and the table surfaces that the student will be using. If the surfaces are very smooth, then the block will tend to slide as the rubber band is stretched, rather than stick and then slip. There are places along the San Andreas fault where the fault creeps rather than sticking and then generating an earthquake, so this type of behavior is possible for faults as well as for blocks of wood. However, this lab would not be very interesting if the block moved by creep rather than by stick-slip motion.
Stick slip motion is more likely if the rubber bands are thin and the string of rubber bands is long. If the tables have very smooth tops, it may be necessary to purchase boards on which to slide the 2x4 blocks. The boards could be pieces of 1”x6” pine, or 1/4” plywood cut into 6”-wide strips. Boards that are 1 m long would be sufficient. It isn’t necessary for the end of the string of rubber bands that is being pulled remain on the board, but just that the block does so. If a board is used, then sand paper can be attached to the 2x4 block to increase the friction (but don’t scratch the table top!).
Another option to increase the friction is to cut a strip of elastic faberic (such as Spandex) that is a bit wider than the block and 1 meter long. The faberic can be taped to the table to provide a runway for the block.
In-class inquiry
Divide the class into groups of 3 or 4 students. Each group will need the materials in materials list.
Student instructions
Take a few minutes to make a string of rubber bands by looping them together. Loop one completely around the block of wood and try pulling the block along the table (or along the board if one is furnished) with the string of rubber bands. Test the effect of various pulling speeds on the motion of the block.
In this lab, one student will be the puller, one will be the observer, and one or two will take notes. The puller will start with the rubber bands pulled out so that there is almost no tension on the 2x4. This initial position on the meter stick of the leading edge of the block and the leading end of the string of rubber bands needs to be recorded by the recorder(s). Then when everyone is ready, the puller will move the end of the rubber bands 1 cm and then count slowly out loud, “one one one,” move the end of the rubber bands 1 more cm and then count slowly out loud, “two two two,” move 1 cm, count slowly out loud, “three three three” and so forth. The observer will read out loud
Teachers making measurements at an IRIS workshop in 2004.
6
the position of the 2x4 at its initial position and then after each movement that the puller makes and the recorder(s) will write these numbers down.
When I tested my block and rubber bands on a table, I found that the block tended to creep along slowly rather than slip suddenly. I added another piece of 2x4 for added weight and also stretched out a strip of stretch fabric. The block now moved in clear steps.
Using the notes of both recorders, make a graph of the position of the 2x4 versus the position of the end of the rubber bands that was being pulled. Did both recorders write down the same numbers? Now that you have an idea about how the lab works, discuss what you think is going on. How is friction related to the movement of the 2x4? Do you expect the motion of the block would be the same if the experiment were repeated? Repeat the experiment twice more, each time changing the puller, observer, and recorder assignments. Graph the additional two sets of data. Here is a sample set of data (Table 1) and graph, which is based on my observations of one trial.
Understanding the Results Histogram of the data
A histogram can be a useful tool for exploring physical processes. A simple histogram could be made in which the data from each group or from the entire class was combined together. The first step would be to define the slippage bins for the histogram. Something like: 0-1 cm, 1-2 cm, 2-3 cm, 3-4 cm, etc. Then decide the convention for slips that fall right on a boundary. In this case you would probably put a slip that equals a boundary value in the higher bin. In other words a slippage of 0 would go into the first bin and a slippage of 2 would go into the third bin.
Next: count the number of events that fall within each bin. Plot this number versus the bin number to see how the number of events varies with the amount of slip in the event. I’ve made a table of my measurements (Table 2) and a histogram plot on next pages (Pages 8 and 9).
Advanced histogram analysis of the data
In the study of earthquakes, a histogram of the number of earthquakes within narrow magnitude bands is often used. The relationship of the form log (N) = A - b*M is usually found, where the value of the constant b is about 1. This is called the Gutenberg-Richter magnitude distribution. What this means is that for every magnitude 5, for example, there are 10 magnitude 4’s and 100 magnitude 3’s. Depending on grade and math level, this concept could be presented in different ways. Learn about the Global Distribution of Earthquakes magnitudes on Page 12.
To compare earthquakes with the sliding block experiment, the energy released by each slippage first needs to be computed. The first step needs to be finding the elastic constant of the rubber bands, k, where force = -k * extension. This could be done by hanging the rubber bands from the block and measuring their length while suspending varying amounts of weight. In a plot of length versus weight, the elastic constant k would be the slope of the line in units of force/length. The equation could be eliminated and the plot of force versus length used directly in the next step.
For each slippage of the block, the notes may be used to determine the length of the rubber band string just before and right after the slippage. Then the graph or the equation can be used to determine the force right before and right after the slippage. The average of these two forces would be the average force on the block during slippage. When multiplied by the distance the block moved, this would give the energy that the rubber band transferred to the block. This energy was in turn, converted into elastic vibrations that radiated away from the block and into heat due to friction between the block and the table surface. Convert the energy of each event to joules.
Next the energy may be converted to magnitude using the equation:
M = (log E - 4.8)/1.5
where E is the energy in joules. These events will be extremely small, so the magnitudes will be negative. Larger events will have less negative magnitudes. To learn more about “Energy and the magnitude of the sliding block.” on Page 13.
It would probably be most interesting to combine the magnitudes from the entire class, so that there are a larger number of data points. Decide on the magnitude bins for the histogram and for each bin, count the number of events that occurred. Take the log of each count and plot this number against the lower magnitude limit of each bin. Then compare the slope of this line to that of real earthquakes, which generally have a slope near 1.0. See Global Distribution of Earthquakes on Page 12

7
Figure See also the graphs four idealized models of earthquake recurrence for a fault that bounds two plates that are in steady motion with respect to each other: “Earthquake Hypotheses that can be Explored with the Model” on Page 3.
Table 1—Data Table and Plot of Fault Slip versus Plate Motion
Fault Slip vs. Plate Motion

8
Table 2—Histogram Data and Plot

9
Table 2 continued
Histogram of Slip Events

10
QuizNow, each student working alone answers the following questions:
1) Trace the flow of energy. Describe the flow of energy through a complete cycle of stick and slip. Include energy stored in your muscles.
2) Is energy conserved in this experiment? Explain your answer.
3) How would the results be different if a string were used instead of a rubber band?
4) In what way does the force between the block and the rubber band vary as the rubber bands are stretched? Describe an experiment that could be conducted to test this relationship.
5) Does the probability that the block will slip during the next interval of time depend on the history of past block movements? Explain your answer.
6) Compare and contrast this lab with the elastic-rebound process that generates earthquakes in the Earth.
Answers to questions and Scoring Rubric (100 Points total)1) Trace the flow of energy. Describe the flow of energy through a complete cycle of stick and slip. Include the energy stored in your muscles. The body uses chemical energy to cause the muscles to contract, thus stretching the rubber bands. Some of this chemical energy is also converted to heat within muscles. The rubber bands store this energy as elastic potential energy. The more the rubber bands are stretched, the more energy they store and the harder they pull on the 2x4 block. When the force on the block exceeds the static friction force, the block begins to slide, converting the elastic energy of the rubber bands into kinetic energy of the block. As the block slides, it’s kinetic energy is transformed into heat energy on the sliding surfaces and elastic wave energy as vibrations radiate away from the sliding block. The block stops sliding when the force is reduced the about the level of sliding friction. The elastic waves become weaker as they move away from the block, both because they spread out and because during each cycle of motion some of their energy is converted to heat. Eventually all of the elastic energy that was given up by the rubber bands is converted to heat energy.
10 points: The answer indicates an understanding that energy is stored in the rubber bands for later release when the block slips.
5 Points: The block gains kinetic energy.5 Points: The block’s energy is converted to heat and vibration energy.
2) Is energy conserved in this experiment? Explain your answer. Yes, energy is conserved. The original source of energy, which was chemical potential energy within muscles, was converted to heat, both in the muscles, in the block, in the table surface, and in the surrounding area where the elastic waves traveled. If, during a given interval of time, the rubber bands became more stretched, then energy was also stored as elastic potential energy.
5 points: The answer is yes. Energy is conserved but converted to heat and elastic potential energy.

11
3) How would the results be different if a string were used instead of a rubber band? The string would not stretch very much, so the block would just move the same amount as the end of the string that is being pulled. No measurable amount of energy would be stored in the string, so large “earthquakes” would not occur.
10 points: The answer indicates an understanding of the role of the elasticity of the rubber bands in storing energy for later release.
5 points: The block would always move when the string was pulled.
4) In what way does the force between the block and the rubber band vary as the rubber bands are stretched? Describe an experiment that could be conducted to test this relationship. The more the rubber bands are stretched, the more energy they store and the harder they pull on the 2x4 block. The block could be positioned so that the rubber bands hang down from the table. Then the length of the string of rubber bands could be measured with various amounts of weight hanging from them. A plot of length versus weight should be linear, with a slope equal to the elastic constant of the rubber bands.
10 points: The force increases as the rubber bands are stretched.5 points: The increase in the force is directly proportional to the increase in length of the rubber bands.5 points: The answer suggests a reasonable method of measuring the elastic constant of the rubber bands.
5) Does the probability that the block will slip during the next interval of time depend on the history of past block movements? Explain your answer. Yes. The more the rubber bands have been stretched from past movement of their free end, the greater the force on the 2x4 block and the greater the chance that the block will slip during the next interval of time. This is similar to the situation with the Earth’s faults. If a fault is known to be active, then the longer it has resisted slip, the more dangerous is becomes. Unfortunately, if this time interval is 100 years or more, people that live near the fault tend reduce their concern for future earthquakes, even as the concern should be increasing year by year. Seismologists today can not predict exactly when or where an earthquake will occur, but they can make decade-long* forecasts about the probability of earthquakes within a given region.10 points: The answer is yes.
10 points: The explanation indicates an understanding that the more the rubber bands are stretched the greater the probability that and further stretching will cause the block to slip.
6) Compare and contrast this lab with the elastic-rebound process that generates earthquakes in the Earth. The block in this lab is connected by an elastic element to a point that is moving at a uniform velocity, and yet it moves in rapid slips rather than with a uniform velocity. This is similar to the way that the rocks at a plate boundary move rapidly past each other during earthquakes, even though the bulk of the plates move at a constant velocity. One difference is that in the case of earthquakes the elastic element is the plate itself, which can bend to store energy and then return to its original shape during earthquake fault rupture. Another difference is that it’s the block lower surface that is sticking on the tabletop. In the case of the Earth, the high temperature and material properties at 80 km depth are such that creep rather than stick-slip motion takes place on lower surfaces. The motion is stick-slip only along the shallower and cooler upper portions of the boundaries between plates.10 points: The answer indicates an understanding that elastic-rebound involves slow storage of elastic energy fol-
lowed by rapid release.10 points: The answer indicates that the rubber bands in the lab are analogous to the elastic deformation of the Earth’s
plates.5 points: The answer includes the fact that the Earth’s plates creep on their lower surfaces and stick-slip on their
boundaries, whereas the block was stick-slipping on its lower surface.
12
Gutenberg-Richter Frequency-Magnitude
Distribution
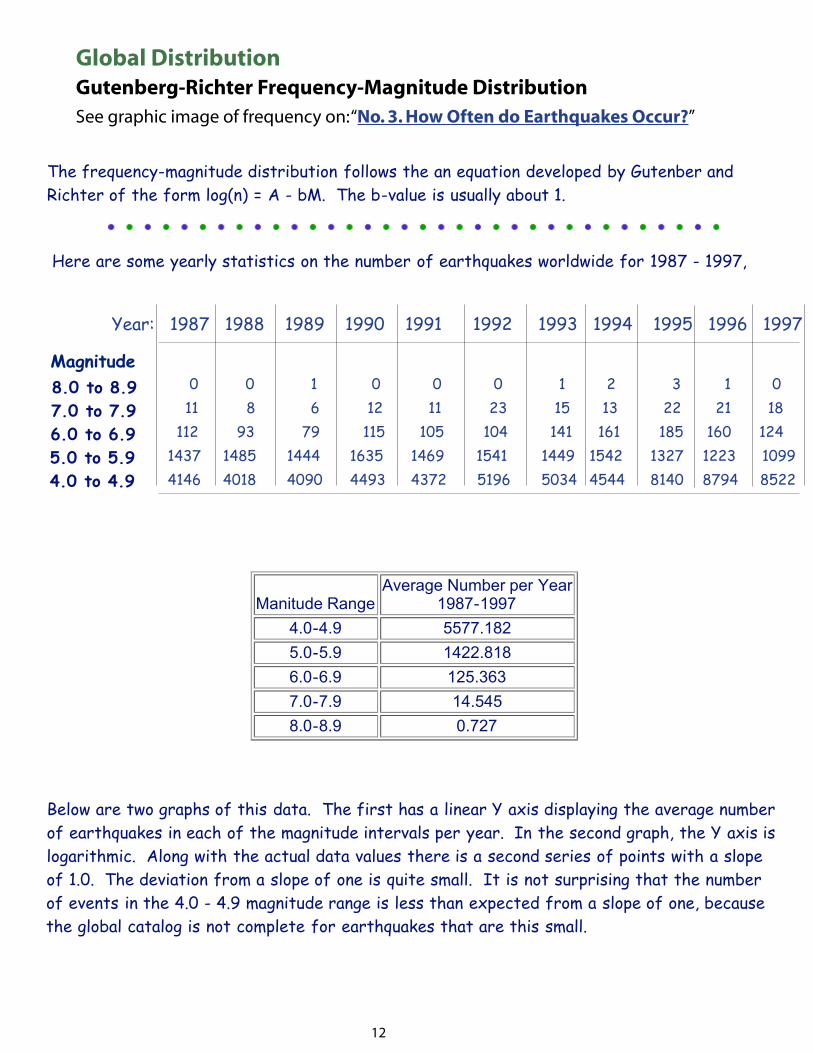
The frequency-magnitude distribution follows the an equation developed by Gutenber and
Richter of the form log(n) = A - bM. The b-value is usually about 1.
Here are some yearly statistics on the number of earthquakes worldwide for 1987 - 1997,
from the web site http://www.geo.lsa.umich.edu/~crlb/COURSES/117/Lec15/eqfreq.html
Magnitude 1987 1988 1989 1990 1991 1992 1993 1994 1995 1996
1997
8.0 to 8.9 0 0 1 0 0 0 1 2 3 1 0
7.0 to 7.9 11 8 6 12 11 23 15 13 22 21 18
6.0 to 6.9 112 93 79 115 105 104 141 161 185 160 124
5.0 to 5.9 1437 1485 1444 1635 1469 1541 1449 1542 1327 1223 1099
4.0 to 4.9 4146 4018 4090 4493 4372 5196 5034 4544 8140 8794 8522
Manitude RangeAverage Number per Year
1987-1997
4.0-4.9 5577.182
5.0-5.9 1422.818
6.0-6.9 125.363
7.0-7.9 14.545
8.0-8.9 0.727
Below are two graphs of this data. The first has a linear Y axis displaying the average number
of earthquakes in each of the magnitude intervals per year. In the second graph, the Y axis is
logarithmic. Along with the actual data values there is a second series of points with a slope
of 1.0. The deviation from a slope of one is quite small. It is not surprising that the number
of events in the 4.0 - 4.9 magnitude range is less than expected from a slope of one, because
the global catalog is not complete for earthquakes that are this small.
0 0 1 0 0 0 1 2 3 1 0 11 8 6 12 11 23 15 13 22 21 18 112 93 79 115 105 104 141 161 185 160 1241437 1485 1444 1635 1469 1541 1449 1542 1327 1223 10994146 4018 4090 4493 4372 5196 5034 4544 8140 8794 8522
Year: 1987 1988 1989 1990 1991 1992 1993 1994 1995 1996 1997
Magnitude
Global Distribution Gutenberg-Richter Frequency-Magnitude DistributionSee graphic image of frequency on: “No. 3. How Often do Earthquakes Occur?”
13
0 0 1 0 0 0 1 2 3 1 0 11 8 6 12 11 23 15 13 22 21 18 112 93 79 115 105 104 141 161 185 160 1241437 1485 1444 1635 1469 1541 1449 1542 1327 1223 10994146 4018 4090 4493 4372 5196 5034 4544 8140 8794 8522
Year: 1987 1988 1989 1990 1991 1992 1993 1994 1995 1996 1997
Energy and Magnitude of the Sliding BlockThe following unit definitions are from: http://www.unc.edu/~rowlett/units/index.html
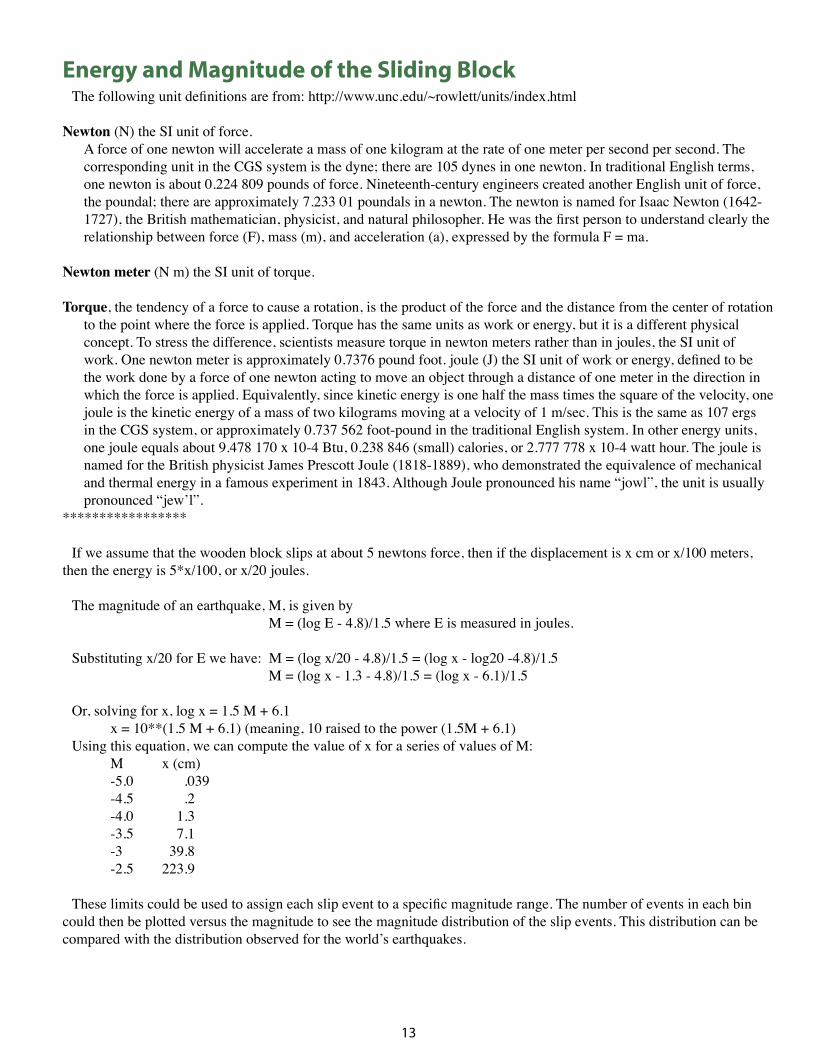
Newton (N) the SI unit of force. A force of one newton will accelerate a mass of one kilogram at the rate of one meter per second per second. The corresponding unit in the CGS system is the dyne; there are 105 dynes in one newton. In traditional English terms, one newton is about 0.224 809 pounds of force. Nineteenth-century engineers created another English unit of force, the poundal; there are approximately 7.233 01 poundals in a newton. The newton is named for Isaac Newton (1642-1727), the British mathematician, physicist, and natural philosopher. He was the first person to understand clearly the relationship between force (F), mass (m), and acceleration (a), expressed by the formula F = ma.
Newton meter (N m) the SI unit of torque.
Torque, the tendency of a force to cause a rotation, is the product of the force and the distance from the center of rotation to the point where the force is applied. Torque has the same units as work or energy, but it is a different physical concept. To stress the difference, scientists measure torque in newton meters rather than in joules, the SI unit of work. One newton meter is approximately 0.7376 pound foot. joule (J) the SI unit of work or energy, defined to be the work done by a force of one newton acting to move an object through a distance of one meter in the direction in which the force is applied. Equivalently, since kinetic energy is one half the mass times the square of the velocity, one joule is the kinetic energy of a mass of two kilograms moving at a velocity of 1 m/sec. This is the same as 107 ergs in the CGS system, or approximately 0.737 562 foot-pound in the traditional English system. In other energy units, one joule equals about 9.478 170 x 10-4 Btu, 0.238 846 (small) calories, or 2.777 778 x 10-4 watt hour. The joule is named for the British physicist James Prescott Joule (1818-1889), who demonstrated the equivalence of mechanical and thermal energy in a famous experiment in 1843. Although Joule pronounced his name “jowl”, the unit is usually pronounced “jew’l”.
*****************
If we assume that the wooden block slips at about 5 newtons force, then if the displacement is x cm or x/100 meters, then the energy is 5*x/100, or x/20 joules.
The magnitude of an earthquake, M, is given by M = (log E - 4.8)/1.5 where E is measured in joules.
Substituting x/20 for E we have: M = (log x/20 - 4.8)/1.5 = (log x - log20 -4.8)/1.5 M = (log x - 1.3 - 4.8)/1.5 = (log x - 6.1)/1.5 Or, solving for x, log x = 1.5 M + 6.1 x = 10**(1.5 M + 6.1) (meaning, 10 raised to the power (1.5M + 6.1)Using this equation, we can compute the value of x for a series of values of M: M x (cm) -5.0 .039 -4.5 .2 -4.0 1.3 -3.5 7.1 -3 39.8 -2.5 223.9
These limits could be used to assign each slip event to a specific magnitude range. The number of events in each bin could then be plotted versus the magnitude to see the magnitude distribution of the slip events. This distribution can be compared with the distribution observed for the world’s earthquakes.

14
References
Lahr, John, 1999, Table-Top Earthquakes, USGS Open-File Report 98-767. This report describes a more elaborate demonstration that can be built to generate “earthquakes.” Included is a sensor and AD computer interface so that the waves that are generated by the “earthquakes” can be monitored.
Hall-Wallace, M.K., 1998, Can earthquakes be predicted?, Journal of Geoscience Education, v. 46, p. 439-449. This paper describes a sliding block experiment that can be conducted to explore whether either the time of the next earthquake or the amount of slip in the next earthquake can be predicted. There is a version of this lab that uses this concept with the blocks and rubber bands described above.
USGS Information on Earthquake Hazards and Preparedness:http://quake.wr.usgs.gov/hazprep/
The Gutenberg-Richter Magnitude Distribution is described in more detail on this web site published by the Southern California Earthquake Center: http://www.scecdc.scec.org/Module/s2act08.html
Acknowledgements
This activity was prepared for a Colorado State University class entitled “Science Assessment: Tools and Strategies” that was given by Nancy Kellogg and Karen Hunter on January 26-27, 2000. This was an excellent class and I’ve attempted to apply some of the things I learned to this earthquake exercise. The report has also benefited from suggestions offered by Nancy Kellogg.

15
VocabularyTo accompany Background files for IRIS’ Animation page. (Definitions from usgs.gov; nasa.gov; and fema.gov)
Crust—the outermost major layer of the earth, ranging from about 10 to 65 km in thickness worldwide. The uppermost 15-35 km of crust is brittle enough to produce earthquakes. Oceanic crust is thinnest; continental crust is thickest.
Earthquake—shaking or trembling of the earth that accompanies rock movements extending anywhere from the crust to 680 km below the Earth’s surface. It is the release of stored elastic energy caused by sudden fracture and movement of rocks inside the Earth. Part of the energy released produces seismic waves, like P, S, and surface waves, that travel outward in all directions from the point of initial rupture. These waves shake the ground as they pass by. An earthquake is felt if the shaking is strong enough to cause ground accelerations exceeding approximately 1.0 centimeter/second squared. Types of earthquakes include:
Elastic Properties—the measure of an objects ability to change shape when a force is applied to it, and return to its original shape when the force on it is released.
Elastic Rebound—an objects ability to return to its original shape after being broken apart. See Strike Slip and Subduction
Elastic strain—Earthquakes are caused by the sudden release of energy within some limited region of the rocks of the Earth. The energy can be released by elastic strain, gravity, chemical reactions, or even the motion of massive bodies. Of all these the release of elastic strain is the most important cause, because this form of energy is the only kind...
Fault—a fracture or zone of fractures in rock along which the two sides have been displaced relative to each other. If the main sense of movement on the fault plane is up (compressional; reverse) or down (extensional;normal), it is called a dip-slip fault. Where the main sense of slip is horizontal the fault is known as a strike-slip fault. Oblique-slip faults have both strike and dip slip.
Fault plane—The plane along which the break or shear of a fault occurs. It is a plane of differential movement, that can be vertical as in a strike slip fault or inclined like a subduction zone fault.
Lithosphere—solid, rocky, outer part of the Earth, ~100 km thick (50 miles) comprised of the crust and the solid portion of the mantle. The thickness is age dependent with older lithosphere is thicker than younger oceanic lithosphere. The lithosphere below the crust is brittle enough at some locations to produce earthquakes by faulting, such as within a subducted oceanic plate.
Magnitude—The magnitude is a number that characterizes the relative size of an earthquake. Magnitude is based on measurement of the maximum motion recorded by a seismograph. Several scales have been defined, but the most commonly used are (1) local magnitude (ML), commonly referred to as “Richter magnitude,” (2) surface-wave magnitude (Ms), (3) body-wave magnitude (Mb), and (4) moment magnitude (Mw). Scales 1-3 have limited range and applicability and do not satisfactorily measure the size of the largest earthquakes. The moment magnitude (Mw) scale, based on the concept of seismic moment, is uniformly applicable to all sizes of earthquakes but is more difficult to compute than the other types. All magnitude scales should yield approximately the same value for any given earthquake..
Plate—a large, relatively rigid segment of the Earth’s lithosphere that moves in relation to other plates over the asthenosphere.
Plate Tectonics—the theory supported by a wide range of evidence that considers the earth’s crust and upper mantle to be composed of several large, thin, relatively rigid plates that move relative to one another. Slip on faults that define the plate boundaries commonly results in earthquakes..
Seismicity—the geographic and historical distribution (the “where?” and “how often?”) of earthquakes.
Slip Fault—the relative motion of one face of a fault relative to the other.
Strain—change in the shape or volume of a material, often recorded in three-dimensions. Strain is defined as the amount of deformation an object experiences compared to its original size and shape. For example, if a block 10 cm on a side is deformed so that it becomes 9 cm long, the strain is (10-9)/10 or 0.1 (sometimes expressed in percent, in this case 10 percent). Learn more
Stress—a measure of forces acting on a body. Stress is defined as force per unit area. It has the same units as pressure, and in fact pressure is one special variety of stress. However, stress is a much more complex quantity than pressure because it varies both with direction and with the surface it acts on. Learn more