Embed Size (px)
Citation preview

April 25, 2016
SMBC Nikko Securities Inc.
Earnings Announcement for FY2015 ended
March 31, 2016 (JGAAP)

The information contained in this document is based on data available as of April 25th, 2016 and this document is intended to provide information on the
business results of SMBC Nikko Securities Inc. Any information and opinions contained in this document reflect our judgment as of the date of
preparation of the document (April 25th, 2016) and are subject to change without notice. No guarantees, representations or warranties are made as to
the accuracy or completeness of such information.
(*) Information in this document is presented on a consolidated basis unless otherwise specified.
1
※Terminologies have changed due to the reform of accounting standards (see
the table). Note for “Net Income” is substituted by “Profit attributable to
owners of parent“.
Preceding fiscal year Current fiscal year (reformed)
Income before minority interests Profit
Minority Interests in Income Profit attributable to non-controlling interests
Net Income Profit attributable to owners of parent
Summary of business results for the FY ended Mar. 2016 2
Net operating revenue / Product sales 3
Business Results (Quarterly Trend) 4
Equity brokerage commissions 5
Commissions on investment trusts 6
Net trading income 7
Underwriting commissions (Equities / Bonds) 8
M&A 9
Business collaboration with Sumitomo Mitsui Banking Corporation 10
SG&A 11
Balance sheet / Capital Adequacy Ratio 12
Client Assets / Net Inflow (Outflow) of Assets 13
Business Trends of Overseas Offices (Securities Product Group) 14
Overseas Network 15
Topics 16
[ Reference Data ]
Consolidated Business Results (Quarterly Trend) 18
Stand-alone Business Results (Quarterly Trend) 19
Operational Indicators-1 20
Operational Indicators-2 21
Operational Indicators-3 22

Summary of business results for the FY ended Mar. 2016
(*1) Profit attributable to owners of parent
(*2) Source: prepared by SMBC Nikko based on the information published by THOMSON REUTERS
(*3) Source: prepared by SMBC Nikko based on the information published by THOMSON REUTERS
2
FY ended
Mar. 2016
Net operating revenue ¥ 292.8 B (-11% Y on Y), Ordinary income ¥ 55.8 B (-42%), Profit (*1) ¥ 42.1 B (-35%).
Decline of sales of products through uncertain global economy caused decrease in income and profit.
Equity brokerage amounts was ¥ 24.9 trillion (+18%).
Aggregate sales of products was ¥ 8.8 trillion (-2%).
Sale of investment trusts was ¥ 2.6 trillion (-8%), foreign bonds was 2.7 trillion (-12%) and domestic bonds was 2.9 trillion (+13%).
Underwriting commission was ¥ 34.0 B (+4%).
League table rankings for Apr. 2015 - Mar. 2016
4th place(*2) in Global Equity & Equity-Related-Japan
5th place(*3) in All Bonds in Yen
3rd place(*4) in terms of values and 2nd in terms of number of deals for M&A announced deals
SG&A was ¥ 241.5 B (+3%).
An extraordinary income from stock transfer of Nikko Global Wrap Ltd. ¥ 6.5 B (1Q)
and loss on sale of investment securities ¥ 2.3 B (2Q) were posted in extraordinary income and loss.
As of the end of Mar. 2016, total assets was ¥ 10.4 trillion, net assets was ¥ 697.8 B, capital adequacy ratio (on a stand-alone basis) was 396%,
reflecting a sound financial base of the company.
(*4) Source: THOMSON REUTERS, M&A announced deals with any Japanese involvement
League tables have changed to be ranked by group performance since FY2015 1Q.
FY ending
Mar. 2016 4Q
Net operating revenue ¥ 57.6 B (-21% Q on Q), Ordinary income ¥ 1.8 B (-87%), Profit (*1) ¥ 1.9 B (-81%).
Aggregate sales of products was ¥ 1,664.4 B (-30%), especially sale of investment trusts ¥ 497.2 B (-33%) and domestic bonds ¥ 491.9 B (-34%) .
Operating revenue 79.5 64.0 -19% 352.6 318.7 -10%
Net operating revenue 72.8 57.6 -21% 329.2 292.8 -11%
SG&A 59.8 57.2 -4% 235.2 241.5 +3%
Ordinary income / loss 13.4 1.8 -87% 96.2 55.8 -42%
Income before taxes 13.4 1.5 -88% 95.6 59.2 -38%
Profit / loss(*1) 10.6 1.9 -81% 64.7 42.1 -35%
Total assets (Tril l ions of yen) 11.1 10.4 -0.7 9.3 10.4 +1.1
Total net assets (Bill ions of yen) 705.6 697.8 -7.8 666.6 697.8 +31.1
Mar.-end '16
Billions of YenFY2015
Dec.-end '15 Y on YQ on Q Mar.-end '15 Mar.-end '16
Q on Q Y on Y3Q 4Q Mar. 31 2015
FY ended FY ended
Mar. 31 2016

Net operating revenue Product Sales
Net operating revenue for this quarter was ¥ 57.6 B (-21% Q on Q) and sales of product was ¥ 1,664.4 B(-30%).
Although subscription commissions on investment trusts and underwriting commissions were decreased,
net trading income supported ¥ 23.2 B (-10%) the profit.
For the FY 2015 ended Mar. 2016, net operating revenue was ¥ 292.8 B (-11% Y on Y) and aggregate sales of product was ¥ 8,833.2 B (-2%).
Though underwriting commissions and other commissions increased, decrease of subscription commissions on investment trusts
and net trading income led to decrease in net operating revenue.
(*2) Sale of foreign bonds includes already-issued bonds and yen-denominated foreign bonds. (*1) Other sales minus cost of sales
【on a stand-alone basis】
3
(Billions of yen) (Billions of yen)
Net operating revenue / Product sales
FY2015 FY ended FY ended
1Q 2Q 3Q 4Q Mar. 31 2015 Mar. 31 2016
Equity brokerage commissions 10.7 8.9 8.7 7.0 -20% 36.4 35.4 -3%
Subscription commissions
on investment trusts11.3 10.1 9.8 3.9 -60% 51.4 35.3 -31%
Agent commissions
on investment trusts8.0 7.7 7.6 7.0 -9% 31.1 30.6 -2%
Underwriting commissions 8.9 10.7 10.0 4.2 -58% 32.7 34.0 +4%
Other commissions 7.0 8.4 8.0 7.5 -6% 22.1 31.0 +40%
Net trading income 40.0 22.0 25.8 23.2 -10% 140.2 111.2 -21%
Net financial incomes 1.8 4.6 2.0 4.0 +97% 12.2 12.5 +2%
Net sales (*1) 0.5 0.8 0.6 0.6 -2% 2.7 2.6 -4%
Total 88.6 73.7 72.8 57.6 -21% 329.2 292.8 -11%
Q on Q Y on Y
0
200
400
Equity brokerage commissions Subscription commissions
on investment trusts
Agent commissions
on investment trusts
Underwriting commissions
Other commissions Net trading income Net financia l incomes Net sales (*1)
0
60
120
FY2015 FY ended FY ended
1Q 2Q 3Q 4Q Mar. 31 2015 Mar. 31 2016
Inv estment trusts 788.4 654.2 739.4 497.2 -33% 2,915.5 2,679.2 -8%
Foreign bonds(*2) 817.5 588.8 687.9 621.6 -10% 3,090.6 2,715.9 -12%
Domestic bonds 746.3 947.6 740.9 491.9 -34% 2,589.8 2,926.7 +13%
(Retail - targeted JGBs) (129.7) (151.7) (115.3) (143.7) (+25%) (408.0) (540.3) (+32%)
Subscription of equities 121.3 94.1 186.4 37.4 -80% 411.2 439.3 +7%
Variable annuities/insurances 19.1 18.9 18.0 16.2 -10% 49.0 72.2 +47%
Total 2,492.5 2,303.7 2,372.6 1,664.4 -30% 9,056.1 8,833.2 -2%
Q on Q Y on Y
0
6,000
12,000
Investment trusts Foreign bonds(*2) Domestic bonds Subscription of equities Variable annuities/insurances
0
2,000
4,000

53.7 56.261.2
63.9 64.060.2 59.8 57.2
0
20
40
60
80
FY20141Q 2Q 3Q 4Q
FY20151Q 2Q 3Q 4Q
67.677.6
94.289.6 88.6
73.7 72.8
57.6
0
30
60
90
120
FY20141Q 2Q 3Q 4Q
FY20151Q 2Q 3Q 4Q
Net operating revenue SG&A
Ordinary income Profit (*)
Business Results (Quarterly Trend)
(Billions of yen) (Billions of yen)
(Billions of yen) (Billions of yen)
4
(*) Profit attributable to owners of parent
14.5
21.9
33.1
26.5 25.4
15.0 13.4
1.8
0
25
50
FY20141Q 2Q 3Q 4Q
FY20151Q 2Q 3Q 4Q
9.814.1
22.018.7
21.5
7.910.6
1.9
0
25
50
FY20141Q 2Q 3Q 4Q
FY20151Q 2Q 3Q 4Q

1.50% 1.55%
0
15,000
30,000
Equity brokerage amounts (*2) TSE share
1.56% 1.49% 1.58% 1.57%
0
5,000
10,000
Equity brokerage amounts for this quarter was ¥ 6,326.4 B (+7% Q on Q) and equity brokerage commissions was ¥ 7.0 B (-20%). Although overseas investors expanded their transactions, individual investors were decreased contrarily.
For the FY 2015 ended Mar. 2016, equity brokerage amounts was ¥ 24,948.3 B (+18% Y on Y) and equity brokerage commissions was ¥ 35.4 B (-3%). Expansion of equity business contributed to the increase equity brokerage amounts, and TSE share and retail market share were in an expanding trend.
Equity brokerage commissions Equity brokerage amounts / TSE share
Equity brokerage commissions
【on a stand-alone basis】
(*1) Adjusted brokerage commissions / brokerage amounts
(Scope: cash and margin transactions) (*2) All stock exchanges
(*3) Total of 1st and 2nd sections of Tokyo and Nagoya stock exchanges
5
(Billions of yen) (Billions of yen)
FY2015 FY ended FY ended
1Q 2Q 3Q 4Q Mar. 31 2015 Mar. 31 2016
Equity brokerage Commissions 10.7 8.9 8.7 7.0 -20% 36.4 35.4 -3%
Equity commissions rate(*1) 15.3bp 12.4bp 13.3bp 9.7bp - 3.6bp 15.7bp 12.7bp - 3.0bp
Q on Q Y on Y
0.0
7.5
15.0
0
25
50
FY2015 FY ended FY ended
1Q 2Q 3Q 4Q Mar. 31 2015 Mar. 31 2016
Equity brokerage amounts (*2) 6,412.8 6,285.5 5,923.6 6,326.4 +7% 21,156.5 24,948.3 +18%
TSE share 1.56% 1.49% 1.58% 1.57% -0.02pt 1.50% 1.55% +0.05pt
Retail market share (*3) 2.57% 2.54% 2.88% 2.61% -0.27pt 2.25% 2.64% +0.38pt
Q on Q Y on Y

8,120.7
7,431.77,718.3
7,232.3
0
750
1,500
7,785.5
7,232.3
0
2,000
4,000
Sale of investment trusts Client Assets of Investment trusts
0
60
120
Agent and other commissions Subscription commissions
Subscription commissions / Agent and other commissions Sales / Client Assets of Investment trusts
Mainly because of decline of the stock market, sale of investment trusts for this quarter was ¥ 497.2 B (-33% Q on Q) and subscription commissions on investment trusts was ¥ 3.9 B (-60%).
For the FY 2015 ended Mar. 2016, sale of investment trusts was ¥ 2,679.2 B (-8% Y on Y) and subscription commissions on investment trusts was ¥ 35.3 B (-31%).
Commissions on investment trusts
6
【on a stand-alone basis】 (Billions of yen) (Billions of yen)
FY2015 FY ended FY ended
1Q 2Q 3Q 4Q Mar. 31 2015 Mar. 31 2016
Subscription commissions 11.3 10.1 9.8 3.9 -60% 51.4 35.3 -31%
Agent and other commissions 8.0 7.7 7.6 7.0 -9% 31.1 30.6 -2%
Q on Q Y on Y
0
15
30
FY2015 FY ended FY ended
1Q 2Q 3Q 4Q Mar. 31 2015 Mar. 31 2016
788.4 654.2 739.4 497.2 -33% 2,915.5 2,679.2 -8%
Q on Q Y on Y

0
30
60
0
600
1,200
0
100
200
Bonds, others(*2) Equities, etc.(*1)
0
2,000
4,000
Net trading income (adjusted net financial incomes) Sale of foreign bonds
Net trading income (adjusted net financial incomes) for this quarter was ¥ 27.2 B (-2% Q on Q). Due to the sale of foreign bonds corresponding to fall interest rates, net trading income remained at same level as previous quarter. Sale of foreign bonds was ¥ 621.6 B (-10%).
For the FY 2015 ended Mar. 2016, net trading income (adjusted net financial incomes) was ¥ 123.6 B (-19% Y on Y).
Net trading income
(Billions of yen)
7
【on a stand-alone basis】 (Billions of yen)
・Net trading income (adjusted net financial incomes) is supplemented with the ex dividend, etc from FY 2015 3Q.
(*1) include dividend from trading position, etc
(*2) include interest income from trading position
(*3) exclude funding costs
FY2015 FY ended FY ended
1Q 2Q 3Q 4Q Mar. 31 2015 Mar. 31 2016
817.5 588.8 687.9 621.6 -10% 3,090.6 2,715.9 -12%
Q on Q Y on YFY2015 FY ended FY ended
1Q 2Q 3Q 4Q Mar. 31 2015 Mar. 31 2016
Equities, etc.(*1) 4.7 3.8 4.6 5.6 +19% 16.8 18.8 +12%
(div idend,etc) (1.0) (3.7) (0.8) (2.9) (3.6x) (9.4) (8.5) (-10%)
Bonds, others(*2) 37.3 22.7 23.1 21.6 -6% 136.0 104.8 -23%
(interest) (0.9) (0.7) (1.1) (1.0) (-16%) (3.1) (3.8) (+22%)
Total(*3) 42.0 26.5 27.8 27.2 -2% 152.9 123.6 -19%
Q on Q Y on Y
00

0
25
50
Equit ies Bonds Subscription and Distribution commissions (EQs/Bonds)
Others(*)
Underwriting commissions (Equities / Bonds) Global Equity & Equity-Related-Japan Apr. 2015 - Mar. 2016
Underwriting commissions for this quarter was ¥ 4.2 B (-58% Q on Q), both market scale of equity and bond shrank.
For Apr. 2015 - Mar. 2016, book runner in Global Equity & Equity-Related-Japan: share 13.2% in 4th place,
lead manager in All Bonds in Yen: share 15.7% in 5th place.
Underwriting commissions (Equities / Bonds)
(*) include Revenues related to securitization arrangements
All Bonds in Yen Apr. 2015 - Mar. 2016
Source: prepared by SMBC Nikko based on the information published by THOMSON REUTERS
(including overseas entities)
Source: prepared by SMBC Nikko based on the information published by THOMSON REUTERS
(corporate bonds, FILP agency/municipality bonds(proportional shares as lead manager)
samurai bonds)
【on a stand-alone basis】
(Billions of yen)
8
FY2015 FY ended FY ended
1Q 2Q 3Q 4Q Mar. 31 2015 Mar. 31 2016
Underwriting commissions 8.9 10.7 10.0 4.2 -58% 32.7 34.0 +4%
Equities 5.4 4.7 5.7 1.5 -74% 18.6 17.5 -6%
Bonds 3.3 6.0 4.1 2.7 -34% 14.0 16.2 +16%
Subscription and Distribution
commissions (EQs/Bonds)0.8 0.8 0.5 0.7 +28% 2.5 3.0 +20%
Others(*) 0.2 0.5 0.0 0.2 2.4x 0.9 1.1 +20%
Q on Q Y on Y
0
7.5
15.0
Rank Book runner Mkt.Share
(%)
1 Nomura Securities 1,511.1 27.8%
2 Mitsubishi UFJ Morgan Stanley 901.2 16.6%
3 Mizuho Securities 726.5 13.4%
4 SMBC Nikko Securities 716.0 13.2%
5 Daiwa Securities 584.2 10.7%
Proceeds
(bill of yen)
Rank Manager Mkt.Share
(%)
1 Mitsubishi UFJ Morgan Stanley 3,577.0 24.0%
2 Nomura Securities 2,563.6 17.2%
3 Mizuho Securities 2,496.1 16.7%
4 Daiwa Securities 2,357.2 15.8%
5 SMBC Nikko Securities 2,350.3 15.7%
Proceeds
(bill of yen)

Financial Advisor Rank value basis Apr. 2015 - Mar. 2016 (*)
For Apr. 2015 - Mar. 2016 in the league table of M&A financial advisor for any Japanese involvement announced deals: With 164 deals acquired in total, ranked 3rd in terms of value (market. share 24.8%) and 2nd in terms of number of deals (market share 5.1%).
Source: THOMSON REUTERS, any Japanese involvement announced
M&A
9
TOYOTA MOTOR CORPORATION
/ DAIHATSU MOTOR CO., LTD.
TOYOTA MOTOR CORPORATION has reached an agreement
with DAIHATSU MOTOR CO.,LTD. on a wholly owned
subsidiary via stock exchange.
(SMBC Nikko serves as an advisor
for DAIHATSU MOTOR CO., LTD.)
SHIP HEALTHCARE HOLDINGS Co.,Ltd.
/ Konishi Kyowa Holding Co., Ltd.
SHIP HEALTHCARE HOLDINGS Co.,Ltd. and
Konishi Kyowa Holding Co., Ltd. set business integration via a
share purchase agreement and stock exchange.
(SMBC Nikko serves as an advisor
for SHIP HEALTHCARE HOLDINGS Co.,Ltd.)
COCA-COLA WEST COMPANY, LIMITED
/ SHIKOKU COCA-COLA BOTTLING CO., LTD.
(Nippon Paper Industries Co., Ltd. )
Nippon Paper Industries Co., Ltd. transferred all the shares of
its wholly owned subsidiary
SHIKOKU COCA-COLA BOTTLING CO., LTD. to
COCA-COLA WEST COMPANY, LIMITED
(SMBC Nikko serves as an advisor
for Nippon Paper Industries Co., Ltd.)
NGK SPARK PLUG CO., LTD.
/ UCI Acquisition Holdings NGK SPARK PLUG CO., LTD. acquired 100% shares of UCI Acquisition Holdings (NO.2) Corp
from UCI Holdings Limited. (SMBC Nikko serves as an advisor for NGK SPARK PLUG CO., LTD.)
Major announced deals Apr. 2015 - Mar. 2016
(*) League tables have changed to be ranked by group performance since FY2015 1Q.
Nippon Life Insurance Company
/ MITSUI LIFE INSURANCE COMPANY LIMITED
Nippon Life Insurance Company agreed to integration of their
management. As a part of this integration,
Nippon Life Insurance Company executed TOB to
MITSUI LIFE INSURANCE COMPANY LIMITED.
(SMBC Nikko serves as an advisor and TOB agent
for Nippon Life Insurance Company.)
FT Holdings, Inc. (Freudenberg SE /
Toray Industries, Inc.)
/ Japan Vilene Company, Ltd.
Freudenberg SE and Toray Industries, Inc. launched TOB for Japan
Vilene Company, Ltd. through FT Holdings, Inc.
(SMBC Nikko serves as an advisor for
Freudenberg SE and Toray Industries, Inc.
and TOB agent for FT Holdings, Inc.)
Sumitomo Mitsui Finance and Leasing
Company, Limited / GE Japan LLC
Sumitomo Mitsui Finance and Leasing Company, Limited has
reached an agreement with GE Ireland, a subsidiary of
General Electric Company, on the acquisition of
GE group’s leasing business in Japan.
(SMBC Nikko serves as an advisor for Sumitomo Mitsui
Finance and Leasing Company, Limited.)
ORIX・VINCI Airports Consortium
/ NEW KANSAI INTERNATIONAL AIRPORT COMPANY, LTD
NEW KANSAI INTERNATIONAL AIRPORT COMPANY, LTD
set the operation right of public facilities to Kansai Airports and
signed the project right agreement. Kansai Airports is SPC
which ORIX・VINCI Airports Consortium established.
(SMBC Nikko serves as an advisor for NEW KANSAI
INTERNATIONAL AIRPORT COMPANY, LTD.)
Financial Advisor No. of deals Apr. 2015 - Mar. 2016 (*)
Rank AdvisorRank value
(bill of yen)
Mkt.Share
(%)
1 Morgan Stanley 9,827.7 45.1%
2 Nomura Securities 6,502.7 29.8%
3 Sumitomo Mitsui Financial Group 5,397.4 24.8%
4 Goldman Sachs 4,453.3 20.4%
5 Citi 4,252.2 19.5%
Rank Advisor No. DealsMkt.Share
(%)
1 Mizuho Financial Group 179 5.6%
2 Sumitomo Mitsui Financial Group 164 5.1%
3 Nomura Securities 130 4.0%
4 Morgan Stanley 70 2.2%
5 Daiwa Securities 63 2.0%

Corporate clients (No. of deals) (*3)
As the bank-securities retail integration strategy, nationwide cross-referral of individual customers between all branches of SMBC and SMBC Nikko have been performed continuously with a seamless service in asset management. Strengthening the service for the needs of inheritance, responding to population aging.
Collaboration with SMBC keeps on track as the number of individual customer’s accounts and the referral of corporate clients are growing.
Business collaboration with Sumitomo Mitsui Banking Corporation 【on a stand-alone basis】
10
Asset management (Referral service and financial products intermediary service (*1)) Investment banking (Referral service)
Individual customer (No. of accounts) (*2) Corporate clients (No. of deals)
Note) No. of accounts shows the number of the accounts existed at the end of respective quarters. No. of deals shows accumulated acquired deals in either asset management or investment banking since its inception.
(*2) The number of accounts at the end of each quarter with regards to individual customer who either was referred by SMBC to SMBC Nikko or opened an account with SMBC Nikko
via SMBC's financial products intermediary service.
(*3) The number of the accumulated acquired deals on asset management with corporate clients via SMBC's referral services and financial products intermediary services on
behalf of SMBC Nikko since the inception of respective services.
(*1) Financial products intermediary services by SMBC: SMBC Nikko commissions SMBC to solicit and intermediate securities transactions to customers.
200,000
220,000
240,000
260,000
280,000
300,000
320,000
340,000
FY20141Q 2Q 3Q 4Q
FY20151Q 2Q 3Q 4Q
0
4,000
8,000
12,000
16,000
20,000
24,000
FY20141Q 2Q 3Q 4Q
FY20151Q 2Q 3Q 4Q
0
1,000
2,000
3,000
4,000
5,000
6,000
7,000
FY20141Q 2Q 3Q 4Q
FY20151Q 2Q 3Q 4Q

0
150
300
Trading related expenses Personnel expenses Real estate expenses
Outsourcing and stationery expenses Depreciation and amortizat ion Other
0
50
100
SG&A for this quarter was ¥ 57.2 B (-4% Q on Q).
For the FY 2015 ended Mar. 2016, SG&A was ¥ 241.5 B (+3% Y on Y). Trading related expenses and fixed expenses along with system investment cost increased.
SG&A
(Billions of yen)
11
(単位:億円) FY2015 FY ended FY ended
(Billions of yen) 1Q 2Q 3Q 4Q Mar. 31 2015 Mar. 31 2016
Trading related expenses 11.8 10.5 10.2 10.4 +3% 38.5 43.1 +12%
Personnel expenses 30.8 28.1 28.0 24.9 -11% 118.0 111.9 -5%
Real estate expenses 5.7 5.5 5.2 5.2 +0% 20.7 21.8 +5%
Outsourcing and stationery expenses 5.7 6.2 6.3 6.6 +4% 23.0 25.0 +9%
Depreciation and amortization 5.1 5.3 5.5 5.7 +4% 18.6 21.7 +17%
Other 4.7 4.4 4.4 4.1 -7% 16.2 17.8 +9%
SG&A / Fixed expense 64.0 60.2 59.8 57.2 -4% 235.2 241.5 +3%
SG&A / Net operating revenue 72% 82% 82% 99% +17pt 71% 82% +11pt
Q on Q Y on Y

Credit ratings on Long Term
Moody's S&P R&I JCR
A1 A AA- AA
[ Stable ] [ Stable ] [ Stable ] [ Stable]
Variance Variance
Current assets 9,124.9 10,220.3 +1,095.3 Basic items 623.5 656.6 +33.1
Trading products 3,079.6 3,673.1 +593.5 Supplementary items 105.1 14.9 -90.2
Loans secured by securities 4,165.3 5,007.4 +842.0 Deductible assets 139.2 162.3 +23.1
Other current assets 1,879.9 1,539.8 -340.1 Net capital 589.4 509.2 -80.1
Noncurrent assets 227.9 258.7 +30.8 Risk total 123.2 128.6 +5.3
Tangible assets 26.4 26.7 +0.2 Market Risk 44.9 43.8 -1.0
Intangible assets 77.5 84.6 +7.0 Counterparty Risk 21.7 22.9 +1.1
Investments and other assets 123.9 147.4 +23.5 Basic Risk 56.5 61.7 +5.2
Total assets 9,352.9 10,479.1 +1,126.2 Capital Adequacy Ratio 478% 396% -82pt
Current liabilities 8,144.1 9,147.3 +1,003.2
Trading products 2,324.3 2,464.5 +140.1
Loans payable secured by securities 3,336.2 5,104.8 +1,768.5
Short-term loans pay able / Commercial papers 1,996.3 1,054.7 -941.6
Other current liabilities 487.0 523.1 +36.0
542.1 634.0 +91.8
Total liabilities 8,686.3 9,781.3 +1,095.0
Total net assets 666.6 697.8 +31.1
Total liabilities and net assets 9,352.9 10,479.1 +1,126.2
Noncurrent liabilities /
Reserves under the special laws
(Billions of Yen) Mar.15 Mar.16 (Billions of Yen) Mar.15 Mar.16
Balance sheet / Capital Adequacy Ratio
(as of April 25th, 2016)
【on a stand-alone basis】
【on a stand-alone basis】
12

0
10
20
30
40
50
Equity Bond Investment trust Others
-500
0
500Net inflow (outflow) of assets
Overall client assets at the end of Mar. 2016 was ¥ 42.2 trillion (-5% Q on Q).
Net inflow of assets at sales division for this quarter was ¥ 264.9 B. For the FY 2015 ended Mar. 2016, net inflow of assets at sales division was ¥1,161.0 B (+34% Y on Y). Focusing on inflow of assets resulted in large increase compare to the previous year’s.
Client Assets / Net Inflow (Outflow) of Assets
(Billions of yen)
(Trillions of yen)
【on a stand-alone basis】
13
(*1) Treasury stocks owned by corporate clients have been included in the client assets since FY 2014 Jun.
(*2) Net inflow has been recalculated as sales division since FY 2014 1Q.
FY2014 FY2015
Jun. Sep. Dec. Mar. Jun. Sep. Dec. Mar.
Equity 19.1 20.0 21.4 23.2 24.1 23.3 23.9 22.1
Bond 14.9 14.3 13.4 13.1 12.9 12.8 12.7 12.6
Investment trust 6.6 7.0 7.5 7.8 8.1 7.4 7.7 7.2
Others 0.2 0.2 0.2 0.3 0.3 0.3 0.3 0.3
Client assets(*1) 40.8 41.5 42.6 44.3 45.4 43.8 44.6 42.2
(Billions of yen) 1Q 2Q 3Q 4Q 1Q 2Q 3Q 4Q
Net inf low (outf low) of assets <sales div ision>(*2) 303.1 267.4 27.4 270.7 206.9 393.0 296.2 264.9
Inflow of assets 915.5 1,111.3 1,108.0 1,301.0 1,380.2 1,376.4 1,316.9 1,392.4
Outflow of assets -612.5 -843.9 -1,080.6 -1,030.3 -1,173.3 -983.3 -1,020.7 -1,127.5
(Trillions of yen)
0
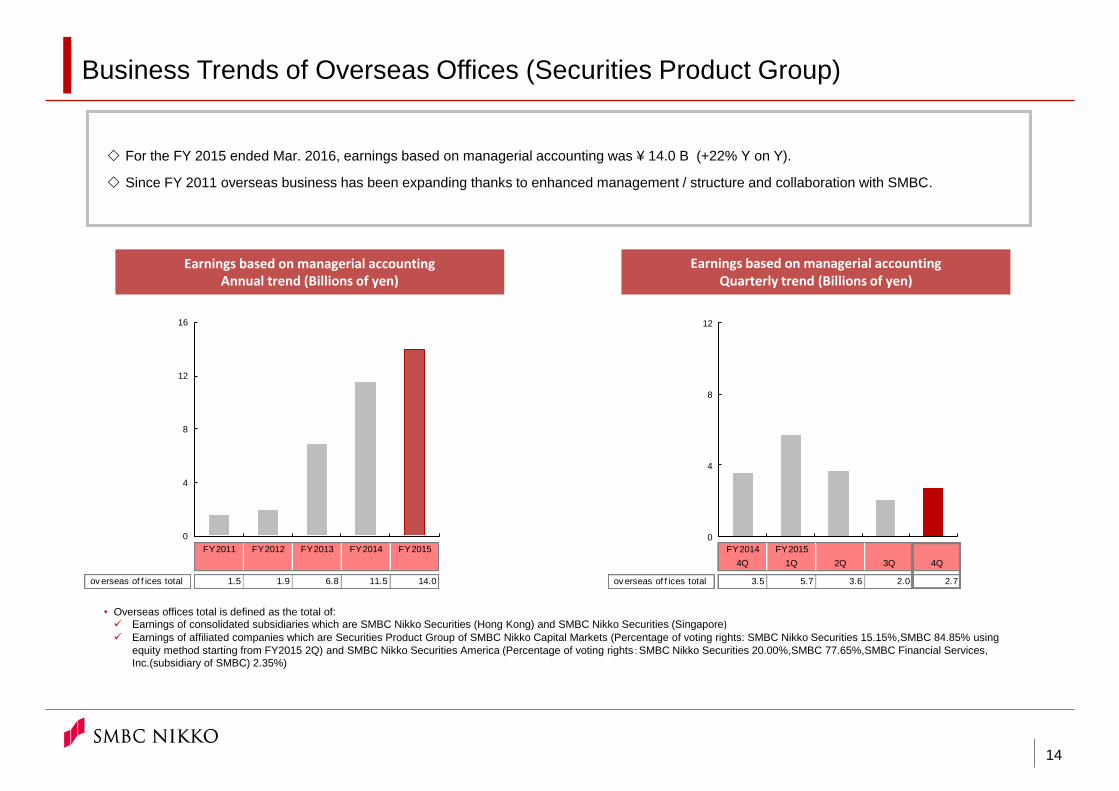
Business Trends of Overseas Offices (Securities Product Group)
For the FY 2015 ended Mar. 2016, earnings based on managerial accounting was ¥ 14.0 B (+22% Y on Y).
Since FY 2011 overseas business has been expanding thanks to enhanced management / structure and collaboration with SMBC.
Earnings based on managerial accounting Annual trend (Billions of yen)
Earnings based on managerial accounting Quarterly trend (Billions of yen)
• Overseas offices total is defined as the total of: Earnings of consolidated subsidiaries which are SMBC Nikko Securities (Hong Kong) and SMBC Nikko Securities (Singapore) Earnings of affiliated companies which are Securities Product Group of SMBC Nikko Capital Markets (Percentage of voting rights: SMBC Nikko Securities 15.15%,SMBC 84.85% using
equity method starting from FY2015 2Q) and SMBC Nikko Securities America (Percentage of voting rights:SMBC Nikko Securities 20.00%,SMBC 77.65%,SMBC Financial Services,
Inc.(subsidiary of SMBC) 2.35%)
14
0
4
8
12
16
FY2011 FY2012 FY2013 FY2014 FY2015
ov erseas of f ices total 1.5 1.9 6.8 11.5 14.0
FY2014 FY2015
4Q 1Q 2Q 3Q 4Q
ov erseas of f ices total 3.5 5.7 3.6 2.0 2.7
00
4
8
12

London
Shanghai
Jakarta
Sydney
New York
Luxembourg
Hong Kong
San Francisco
Singapore
SMBC Nikko Securities
(Hong Kong) Limited
SMBC Nikko Securities
America, Inc. SMBC Nikko
Capital Markets Limited
PT. Nikko Securities
Indonesia
SMBC Nikko Bank
(Luxembourg) S.A.
SMBC Nikko Investment
Consulting (Shanghai) Limited SMBC Nikko Capital Markets
Limited (Sydney Office)
SMBC Nikko Securities
(Singapore) Pte. Ltd.
KB Investment & Securities
PetroVietnam Securities
Alliance in M&A advisory,
DCM and IPO business
Market entry consulting
for Japanese companies
in Vietnam
M&A advisory related services
Japanese equity and
fixed-income sales and
trading
Equity and bond
underwriting
M&A advisory
IR arrangement
Swap related business
Fund custody
Fund administration
Japanese equity
brokerage
M&A advisory
Private wealth business
IR arrangement
Indonesian equity brokerage
Equity and bond underwriting
M&A advisory
Market entry consulting for
Japanese companies in
Indonesia
Asset management business
Kotak Mahindra Group
Moelis & Company
BTG Pactual
Alliance in M&A advisory
Alliance in M&A advisory
Alliance in M&A advisory
SMBC Nikko Securities
America, Inc.
(San Francisco Branch)
Japanese equity brokerage
M&A advisory
SMBC Nikko Investment Fund
Management Company S.A.
Fund management
SMBC Nikko Group Company
SMBC Nikko Business Partner
Sumitomo Mitsui Banking Corporation
Japanese equity brokerage Fixed-income sales and
trading Equity and bond
underwriting Structured finance M&A advisory IR arrangement
Coverage of bond underwriting
Phatra Securities
Alliance in M&A advisory
and bond underwriting
and sales
First Metro Securities
Alliance in M&A advisory
and DCM/ECM business
Citigroup
Overseas Network
15
Collaboration in various
business worldwide
Japanese / Hong Kong equity and
fixed-income brokerage Coverage of bond underwriting M&A advisory
Market entry consulting for
Japanese companies in Greater
China
IR arrangement
• Note:SMBC Nikko Capital Markets and SMBC Nikko Securities America are SMBC Nikko’s affiliated companies.

Topics
16
Analyst Rankings
At Institutional Investor “2016 All-Japan Research Team", ranked
3rd three years in a row in the category of firm, and 5 analysts
selected as top analysts in the category of industry.
・Auto Parts : Kunihiro Matsumoto
・Shipbuilding/Plant : Taku Ouchi
・Strategist : Ryota Sakagami
・Chemical : Shinobu Takeuchi
・REIT : Hiroshi Torii
At Nikkei Veritas "The 28th Popular Analyst Ranking", ranked 3rd
three years in a row in the category of firm, and 6 (5 in previous
year) analysts selected as top analysts in the category of industry.
・Auto Parts : Kunihiro Matsumoto
・Chemical/Textile : Shinobu Takeuchi
・Shipbuilding/Plant : Taku Ouchi
・Business Solution : Satoru Kikuchi
・REIT : Hiroshi Torii
・Strategist : Ryota Sakagami
Ranked 4th for two years in a row as a firm/group at the Nikkei
Veritas "21st Popularity Survey of Bond/Currency Analysts and
Economists”
Selected as a Good Practices of Principles for Financial Action for the 21st Century
Distribute the textbook 2016 , ”Dream, Reality and Money for university students”
Efforts toward the realization of a friendly society to human through the employment
of the handicapped are selected as the 4th “Good Practice(the department of The
Asset Management/Securities/Investment Banking)※”in the periodic meeting, which
was held on 9 Mar 2016, of principles for financial action towards a sustainable
society (principles for financial action for the 21st century) by Ministry of the
Environment. Principles for financial action for the 21st century are a set of principles,
which was formulated by Ministry of the Environment in 2011, which was drawn up as
guidelines for action by financial institutions that intend to fulfil their roles and
responsibilities in shaping a sustainable society. On 31 Mar 2016, two hundred
financial institutions have signed the principles.
※Financial institutions that have signed the principles voted on each other’s efforts towards a
Sustainable Society and efforts having the large number of votes in each department are selected as
「Good Practice 」 .The department are made up of 「 The Asset Management/Securities/Investment
Banking」,「Insurance」,「Deposits/Loans/ Leasing」.
SMBC Nikko and Oceanize, inc. produced “Dream, Reality and
Money for university students” together with university students as
a new project (UNISA※) to improve financial literacy for university
students. From this Apr, the textbooks are distributed when they
buy their new textbooks in bookstores of National Federation of
University Co-operative Associations in Universities nationwide (57
Universities, 74 campuses). SMBC Nikko and Oceanize, inc. hope
university students pleasantly learn financial intelligence with the
textbooks.
※ UNISA is a title of a project to improve financial literacy for university students.
SMBC Nikko and Oceanize, inc. coined a new word「UNISA」 which is combination of 「University」 and
「NISA」.

Reference Data

Consolidated Business Results (Quarterly Trend)
18
(Millions of yen) 1Q 2Q 3Q 4Q Total 1Q 2Q 3Q 4Q Total
Operating revenue 73,804 82,671 101,066 95,065 352,607 95,827 79,319 79,570 64,074 318,791
Commissions received 38,176 39,580 46,668 49,492 173,918 46,160 46,153 44,403 29,787 166,504
Brokerage commissions 6,815 8,589 12,326 11,146 38,877 11,435 10,297 9,602 7,859 39,195
Underwriting and distribution
commissions8,611 6,650 7,908 9,571 32,741 8,962 10,799 10,001 4,237 34,000
Flotation and distribution fees 12,858 13,234 13,493 14,364 53,950 12,223 11,023 10,490 4,692 38,430
Other commissions 9,890 11,106 12,940 14,410 48,347 13,539 14,032 14,309 12,996 54,877
Net trading income 27,499 31,645 45,367 35,759 140,272 40,067 22,079 25,813 23,263 111,224
Equities 2,236 -117 3,691 1,574 7,384 3,684 104 3,877 2,611 10,278
Bonds / Others 25,263 31,763 41,675 34,185 132,888 36,382 21,974 21,936 20,651 100,945
Financial revenue 5,593 8,636 6,181 7,151 27,563 7,120 7,914 6,549 7,607 29,191
Other sales 2,534 2,808 2,847 2,660 10,852 2,479 3,172 2,803 3,416 11,871
Financial expenses 4,302 3,014 4,708 3,249 15,274 5,241 3,303 4,520 3,604 16,671
Cost of sales 1,839 2,042 2,093 2,123 8,097 1,938 2,306 2,174 2,801 9,221
Net operating revenue 67,662 77,614 94,264 89,692 329,234 88,647 73,708 72,875 57,667 292,899
SG&A 53,744 56,295 61,275 63,953 235,268 64,095 60,298 59,878 57,276 241,548
Operating income / loss 13,918 21,319 32,989 25,738 93,966 24,552 13,410 12,996 390 51,350
Ordinary income / loss 14,549 21,995 33,193 26,503 96,242 25,478 15,076 13,456 1,816 55,826
Extraordinary income / loss -118 -140 -123 -184 -567 6,246 -2,506 -18 -253 3,468
Income before income taxes 14,431 21,854 33,070 26,318 95,675 31,724 12,569 13,438 1,563 59,294
Income taxes-current 123 604 9,496 12,502 22,727 708 6,464 5,878 398 13,450
Income taxes-deferred 4,475 7,074 1,537 -4,903 8,184 9,418 -1,808 -3,089 -804 3,715
Profit / loss 9,832 14,174 22,036 18,719 64,763 21,597 7,912 10,648 1,969 42,128
Profit attributable to owners of parent 9,831 14,170 22,028 18,716 64,747 21,593 7,904 10,639 1,969 42,106
FY2014 FY2015

Stand-alone Business Results (Quarterly Trend)
19
(Millions of yen) 1Q 2Q 3Q 4Q Total 1Q 2Q 3Q 4Q Total
Operating revenue 69,191 77,694 95,547 90,181 332,615 90,922 73,941 74,431 58,633 297,929
Commissions received 36,395 37,722 44,317 47,473 165,908 44,041 44,169 42,256 27,913 158,380
Brokerage commissions 6,300 7,944 11,442 10,361 36,050 10,636 9,516 8,854 7,191 36,198
Underwriting and distribution
commissions8,611 6,650 7,906 9,571 32,740 8,962 10,799 10,001 4,237 34,000
Flotation and distribution fees 12,628 13,128 13,465 14,308 53,530 12,037 10,982 10,489 4,665 38,175
Other commissions 8,854 9,998 11,502 13,232 43,587 12,405 12,870 12,911 11,818 50,005
Net trading income 27,499 31,645 45,367 35,759 140,272 40,067 22,079 25,813 23,263 111,223
Equities 2,236 -117 3,691 1,574 7,384 3,684 104 3,877 2,611 10,278
Bonds / Others 25,263 31,763 41,675 34,185 132,888 36,382 21,974 21,935 20,651 100,945
Financial revenue 5,295 8,327 5,862 6,947 26,433 6,813 7,693 6,361 7,456 28,324
Financial expenses 4,031 2,732 4,418 3,066 14,249 4,962 3,111 4,360 3,483 15,918
Net operating revenue 65,159 74,962 91,129 87,114 318,365 85,959 70,830 70,070 55,149 282,010
SG&A 52,970 54,878 59,398 61,945 229,191 62,816 58,885 58,269 55,057 235,029
Operating income / loss 12,189 20,084 31,730 25,169 89,174 23,143 11,945 11,801 91 46,981
Ordinary income / loss 12,490 20,502 31,684 28,600 93,278 23,390 12,507 11,804 611 48,313
Extraordinary income / loss -206 -140 -123 -413 -884 4,611 -4,588 -15 -243 -236
Income before income taxes 12,283 20,362 31,561 28,186 92,393 28,001 7,919 11,788 367 48,077
Income taxes-current 19 39 9,005 12,113 21,177 561 5,932 5,518 -2,086 9,925
Income taxes-deferred 4,052 7,174 1,583 -4,150 8,659 8,548 -3,201 -1,703 1,390 5,034
Profit / loss 8,212 13,148 20,973 20,222 62,557 18,892 5,187 7,973 1,064 33,117
FY2014 FY2015

Operational Indicators -1
Sales of Products
Market Share
【on a stand-alone basis】
20
Source: prepared by SMBC Nikko based on the information published by THOMSON REUTERS
Source: prepared by SMBC Nikko based on the information published by THOMSON REUTERS
Source: prepared by THOMSON REUTERS
(Billions of yen) 1Q 2Q 3Q 4Q Total 1Q 2Q 3Q 4Q Total
Investment trusts 605.5 705.3 749.5 855.3 2,915.5 788.4 654.2 739.4 497.2 2,679.2
(Equity investment trusts) ( 436.1 ) ( 522.2 ) ( 556.3 ) ( 608.0 ) ( 2,122.6 ) ( 531.6 ) ( 436.7 ) ( 453.4 ) ( 298.4 ) ( 1,720.1 )
(Foreign registered investment trusts) ( 116.4 ) ( 129.5 ) ( 143.0 ) ( 144.0 ) ( 532.9 ) ( 126.7 ) ( 92.9 ) ( 112.8 ) ( 63.9 ) ( 396.3 )
Foreign bonds (*) 758.3 758.9 802.0 771.3 3,090.6 817.5 588.8 687.9 621.6 2,715.9
(Foreign currency bonds) ( 202.5 ) ( 193.6 ) ( 287.5 ) ( 216.8 ) ( 900.4 ) ( 236.7 ) ( 193.5 ) ( 276.3 ) ( 200.5 ) ( 907.0 )
Domestic bonds 798.9 649.5 590.9 550.5 2,589.8 746.3 947.6 740.9 491.9 2,926.7
(Retail target JGBs) ( 102.8 ) ( 92.2 ) ( 76.5 ) ( 136.5 ) ( 408.0 ) ( 129.7 ) ( 151.7 ) ( 115.3 ) ( 143.7 ) ( 540.3 )
Public offering 117.9 70.1 94.7 128.4 411.2 121.3 94.1 186.4 37.4 439.3
Annuity / insurance 4.1 12.3 15.4 17.2 49.0 19.1 18.9 18.0 16.2 72.2
Total 2,284.8 2,196.1 2,252.5 2,322.8 9,056.1 2,492.5 2,303.7 2,372.6 1,664.4 8,833.2
(*) Sale of foreign bonds includes already-issued bonds and yen-denominated foreign bonds.
FY2015FY2014
1Q 2Q 3Q 4Q 1Q 2Q 3Q 4Q
ECM Global Equity (*1) 23.1% 17.8% 17.2% 17.0% 12.5% 13.7% 14.0% 13.2%
DCM All bonds in Yen (*2) 15.5% 16.1% 15.5% 15.6% 15.9% 16.8% 16.9% 15.7%
M&A Japan related (*3) 1.9% 7.5% 6.7% 7.8% 18.0% 17.4% 28.4% 24.8%
( *1 )Global Equity & Equity-Related-Japan : Book runner
( *2 )All Bonds in Yen, Lead manager
( *3 )Any Japanese involvement announced : Rank value
League tables have changed to be ranked by group performance since FY 2015 1Q.
FY2014 FY2015
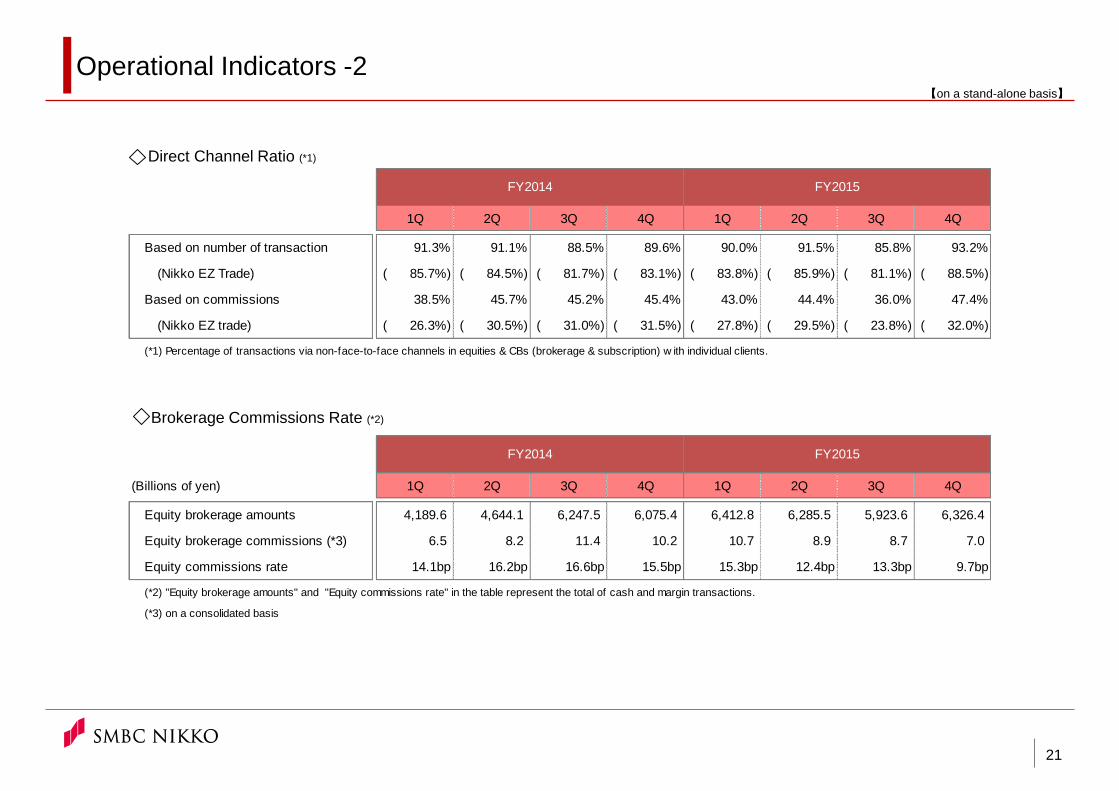
1Q 2Q 3Q 4Q 1Q 2Q 3Q 4Q
Based on number of transaction 91.3% 91.1% 88.5% 89.6% 90.0% 91.5% 85.8% 93.2%
(Nikko EZ Trade) 85.7%) ( 84.5%) ( 81.7%) ( 83.1%) ( 83.8%) ( 85.9%) ( 81.1%) ( 88.5%) (
Based on commissions 38.5% 45.7% 45.2% 45.4% 43.0% 44.4% 36.0% 47.4%
(Nikko EZ trade) 26.3%) ( 30.5%) ( 31.0%) ( 31.5%) ( 27.8%) ( 29.5%) ( 23.8%) ( 32.0%) (
(*1) Percentage of transactions via non-face-to-face channels in equities & CBs (brokerage & subscription) w ith individual clients.
(Billions of yen) 1Q 2Q 3Q 4Q 1Q 2Q 3Q 4Q
Equity brokerage amounts 4,189.6 4,644.1 6,247.5 6,075.4 6,412.8 6,285.5 5,923.6 6,326.4
Equity brokerage commissions (*3) 6.5 8.2 11.4 10.2 10.7 8.9 8.7 7.0
Equity commissions rate 14.1bp 16.2bp 16.6bp 15.5bp 15.3bp 12.4bp 13.3bp 9.7bp
(*2) "Equity brokerage amounts" and "Equity commissions rate" in the table represent the total of cash and margin transactions.
(*3) on a consolidated basis
FY2015
FY2014 FY2015
FY2014
Direct Channel Ratio (*1)
Brokerage Commissions Rate (*2)
Operational Indicators -2
21
【on a stand-alone basis】

(Thousands of accounts) Jun.14 Sep.14 Dec.14 Mar.15 Jun.15 Sep.15 Dec.15 Mar.16
Total accounts 2,517 2,546 2,575 2,605 2,629 2,666 2,712 2,731
Cash management accounts 2,186 2,215 2,243 2,271 2,294 2,332 2,372 2,396
Newly opened accounts 31 45 48 51 42 55 59 37
Jun.14 Sep.14 Dec.14 Mar.15 Jun.15 Sep.15 Dec.15 Mar.16
Number of branches 112 116 121 123 123 123 123 123
Jun.14 Sep.14 Dec.14 Mar.15 Jun.15 Sep.15 Dec.15 Mar.16
Number of employees 9,586 9,528 9,464 9,367 10,022 9,936 9,829 9,685
Number of 4 overseas employees (SPG) 326 340 349 362 378 396 413 427
FY2015
FY2014 FY2015
FY2014
FY2015FY2014
Number of Accounts
Number of Branches
Number of Employees
Operational Indicators -3
【on a stand-alone basis】
【on a stand-alone basis】
22 22
• Overseas offices total is defined as the total of: Employees of consolidated subsidiaries which are SMBC Nikko Securities (Hong Kong) and SMBC Nikko Securities (Singapore) Employees of affiliated companies which are Securities Product Group of SMBC Nikko Capital Markets and SMBC Nikko Securities America.


