Embed Size (px)
Citation preview
Early-life Exposureto Income Inequality and
Adolescent Health and Well-being:Evidence from the Health Behaviour
in School-aged Children Study
Frank J. Elgar and Candace Currie
Office of Research - Innocenti Working Paper
WP-2016-07 | March 2016
IWP7 - INCOME INEQUALITY.qxp_Layout 1 04/03/16 15:11 Pagina 1
INNOCENTI WORKING PAPERS
UNICEF Office of Research Working Papers are intended to disseminate initial researchcontributions within the programme of work, addressing social, economic and institutional aspectsof the realization of the human rights of children.
The findings, interpretations and conclusions expressed in this paper are those of the authors anddo not necessarily reflect the policies or views of UNICEF.
This paper has been peer reviewed both externally and within UNICEF.
The text has not been edited to official publications standards and UNICEF accepts no responsibilityfor errors.
Extracts from this publication may be freely reproduced with due acknowledgement. Requeststo utilize larger portions or the full publication should be addressed to the Communication Unitat [email protected].
For readers wishing to cite this document we suggest the following form:
Elgar, F.J. and C. Currie (2016). Early-life Exposure to Income Inequality and Adolescent Healthand Well-being: Evidence from the Health Behaviour in School-aged Children Study,Innocenti Working Paper No.2016-07, UNICEF Office of Research, Florence.
© 2016 United Nations Children’s Fund (UNICEF)
ISSN: 1014-7837
2
IWP7 - INCOME INEQUALITY.qxp_Layout 1 04/03/16 15:11 Pagina 2

THE UNICEF INNOCENTI OFFICE OF RESEARCH
In 1988 the United Nations Children’s Fund (UNICEF) established a research centre to supportits advocacy for children worldwide and to identify and research current and future areasof UNICEF’s work. The prime objectives of the Office of Research are to improve internationalunderstanding of issues relating to children’s rights and to help facilitate full implementation ofthe Convention on the Rights of the Child in developing, middle-income and industrialized countries.
The Office aims to set out a comprehensive framework for research and knowledge withinthe organization, in support of its global programmes and policies. Through strengthening researchpartnerships with leading academic institutions and development networks in both the North andSouth, the Office seeks to leverage additional resources and influence in support of effortstowards policy reform in favour of children.
Publications produced by the Office are contributions to a global debate on children and child rightsissues and include a wide range of opinions. For that reason, some publications may notnecessarily reflect UNICEF policies or approaches on some topics. The views expressed are those ofthe authors and/or editors and are published in order to stimulate further dialogue on child rights.
The Office collaborates with its host institution in Florence, the Istituto degli Innocenti, in selectedareas of work. Core funding is provided by the Government of Italy, while financial supportfor specific projects is also provided by other governments, international institutions andprivate sources, including UNICEF National Committees.
Extracts from this publication may be freely reproduced with due acknowledgement.Requests to translate the publication in its entirety should be addressed to: Communications Unit,[email protected].
For further information and to download or order this and other publications, please visitthe website at www.unicef-irc.org.
Correspondence should be addressed to:
UNICEF Office of Research - InnocentiPiazza SS. Annunziata, 1250122 Florence, ItalyTel: (+39) 055 20 330Fax: (+39) 055 2033 [email protected]@UNICEFInnocentifacebook.com/UnicefOfficeofResearchInnocenti
3
IWP7 - INCOME INEQUALITY.qxp_Layout 1 04/03/16 15:11 Pagina 3
EARLY-LIFE EXPOSURE TO INCOME INEQUALITY AND ADOLESCENT HEALTHAND WELL-BEING: EVIDENCE FROM THE HEALTH BEHAVIOURIN SCHOOL-AGED CHILDREN STUDY
Frank J. Elgar,1 Candace Currie2
1 Institute for Health and Social Policy, McGill University, Montreal, Canada2 Child and Adolescent Health Research Unit, School of Medicine, University of St. Andrews, St Andrews, Scotland
Abstract: The health of children and adolescents in high income countries negatively relates to income inequality.Theoretical interpretations of this association suggest that inequality intensifies social hierarchies, erodes socialor material resources that support health, or impacts socioemotional development in childhood andsubsequently harms health. The evidence in support of this causal interpretation is limited by a relianceon cross-sectional, ecological studies. Using multilevel panel data from the Health Behaviour in School-agedChildren (HBSC) study, this paper examines lagged and contemporaneous associations between nationalincome inequality and health and well-being during adolescence. Health symptoms and life satisfactionwere measured in successive surveys of 11- to 15-year-olds in Europe and North America between 1994and 2014. These data were linked to country-level income inequality for each survey year (contemporaneouseffects) and for earlier developmental periods, at 0-4 years and 5-9 years (lagged effects), dating back to 1979 –the birth year of 15-year-olds in the 1994 survey cycle. Societal growth curve modelling was used to pool datafrom successive survey cycles and to isolate age, period, and cohort effects.
The results show evidence of lagged effects of income inequality during childhood (5-9 years) on healthsymptoms and life satisfaction in adolescents (11-15 years), after differences in concurrent income inequalityand income per capita, cohort, time period, and individual gender, age, and affluence were held constant.This period of development for income inequality exposure coincides with the early school years when socialrelationships extend from the family to school and community settings. Inequality may shape childdevelopmental trajectories in ways that later manifest in reduced health and well-being. Though not causalevidence in the strictest sense, these findings establish antecedent-consequence conditions in the associationbetween income inequality and health. The practical and theoretical implications of these results are discussed.
Keywords Income inequality; adolescents; children; health; well-being; causal inference; Health Behaviourin School-aged Children.
Acknowledgements:The Health Behaviour in School-aged Children (HBSC) study is a World Health Organizationcollaborative study and is supported by each member country of the HBSC network. The HBSC studyis coordinated internationally by Dr. Joanna Inchley, University of St. Andrews, Scotland, with internationaldata coordination performed by Dr. Oddrun Samdal, University of Bergen, Norway. The countries involved inthis analysis (current responsible principal investigator) were Armenia (S. Sargsyan), Austria (R. Felder-Puig),Belgium (D. Piette, C. Vereecken), Canada (W. Pickett, J. Freeman), Croatia (M. Kuzman),Czech Republic (M. Kalman), Denmark (M. Rasmussen) Estonia (K. Aasvee), Finland (J. Tynjälä),France (E. Godeau), Germany (P. Kolip), Greece (A. Kokkevi), Hungary (Á. Németh), Iceland (Á. Arnarsson),Ireland (S. Nic Gabhainn), Israel (Y. Harel-Fisch), Italy (F. Cavallo), Latvia (I. Pudule), Lithuania (A. Zaborskis),Luxembourg (Y. Wagner), Macedonia (L. Kostarova Unkovska), Netherlands (W. Vollebergh),Norway (O. Samdal), Poland (J. Mazur), Portugal (M.G.D.M.), Russia (O. Churganov),Slovakia (A. Madarasova Geckova), Slovenia (H. Jericek), Spain (C. Moreno), Sweden (L. Augustine),Switzerland (E. Kuntsche), Turkey (O. Ercan), Ukraine (O. Balakireva), United Kingdom (A. Morgan, F. Brooks;J. Inchley; C. Roberts), and United States (R. Iannotti).
The writing of this Paper was supported by grants from the Canadian Institutes of Health Research(MOP 235688) and Canada Research Chairs Programme awarded to the first author. The authors also thank(in alphabetical order), Margreet de Looze, Matthias Richter, Gonneke Stevens, and Richard Wilkinsonfor their feedback on earlier drafts of the paper.
4
IWP7 - INCOME INEQUALITY.qxp_Layout 1 04/03/16 15:11 Pagina 4

TABLE OF CONTENTS
1. Introduction ........................................................................... 6
2. Methods ................................................................................ 8
3. Results ................................................................................. 10
4. Discussion .......................................................................... 16
5. Conclusions ........................................................................ 18
6. References ...........................................................................19
Acronyms
AIC Akaike’s information criterion
BIC Bayesian information criterion
FAS Family Affluence Scale
GNI Gross national income
HBSC Health Behaviour in School-aged Children
SEP Socio-Economic Position
5
Early-life Exposure to Income Inequality and Adolescent Health and Well-being: Evidence from the Health Behaviour in School-aged Children StudyInnocenti Working Paper 2016-07
IWP7 - INCOME INEQUALITY.qxp_Layout 1 04/03/16 15:11 Pagina 5
1. INTRODUCTION
Social inequalities in children’s health and well-being relate to their socioeconomic position (SEP) insociety. A large body of empirical evidence shows that growing up in economically disadvantagedconditions worsens health, limits academic achievement, and shortens lifespans.1,2,3 Children andadolescents living in relative poverty – regardless of overall material conditions – tend toexperience more interpersonal violence, family turmoil, and environmental hazards that increaserisk of injury, engage in more health compromising behaviours (e.g., physical inactivity, poornutrition, smoking), report lower subjective well-being, and exhibit more social skills deficits andemotional and behavioural problems.2,4 Simply put, the likelihood that young people are happy,healthy and doing well in school significantly improves as their SEP rises. These inequalities existacross the full range of SEP in many rich, economically developed countries,5 and recent evidencesuggests that these divisions in health and well-being have widened in recent years.6
One interpretation of these differences focuses on children’s access to basic material resourcesthat support health, which has been a dominant focus during the past 15 years in the MillenniumDevelopment Goals.7 UNICEF’s Report Card 13, Fairness for Children, focuses instead on internationaldifferences in “bottom-end” inequality in children’s income, education, health, and well-being(i.e., differences between the average below the median and the median).8 The emphasis here ison relative disparities within high- and middle-income countries and specifically on the experienceof growing up excluded from a standard of living that is experienced by the rest of society.
Another line of research on the structural determinants of health examines the association betweeninequalities in income and inequalities in health. Studies have found that children and adults wholive in countries with smaller income differences tend to have better health and social outcomes.9,10
An analysis of adolescent health in 34 mostly high-income countries found that income inequalityrelated to higher body mass indices, less physical activity, and more mental and physical healthsymptoms.6 These associations held up to numerous controls including national income per capitaand individual SEP. Similar research on children and adolescents has found that income inequalityrelates to alcohol misuse,11 school bullying,12,13 physical assaults,14 teenage pregnancy,15 and childmaltreatment.16 Using country data shown in previous Unicef Report Cards, Pickett and Wilkinsonhave found that international differences in child well-being correlate with income inequalitymore strongly than with country wealth.17,18 Based on these and similar studies on inequality,these authors concluded that further improvements in child well-being in rich countries maydepend more on reductions in income inequality than on further economic growth.18
While the link between national income inequality and child well-being has been replicated inseveral independent studies, the mechanisms underlying this association remain unclear.The prevailing psychosocial interpretation is that income inequality is socially corrosive.10
It intensifies social hierarchies, erodes social capital that supports health, and consequentlycontributes to stress-related health problems and social disorder.10,19,20 This explanation isconsistent with developmental perspectives that describe how early life exposure to inequalityshapes social and moral development in children. Arsenio and Gold proposed that children’s
6
Early-life Exposure to Income Inequality and Adolescent Health and Well-being: Evidence from the Health Behaviour in School-aged Children StudyInnocenti Working Paper 2016-07
IWP7 - INCOME INEQUALITY.qxp_Layout 1 04/03/16 15:11 Pagina 6
exposure to unfairness biases how social information is processed such that instrumental goals arevalued more than relational goals and violence and intimidation are learned to be effective ways tosucceed in an unjust world.21This explanation helps to explain the robust association betweenincome inequality and prevalence of school bullying.12,13 An alternative, “materialist” explanation ofthe association focuses on the relation between income inequality and the quality of public servicesand infrastructure that support health and well-being, like benefits and cash transfers to familiesand good quality public schools and public health services. The idea here is that as incomeinequality increases, social expenditures decline due to increased support for conservativegovernments and opposition to taxation among the upper classes who stand to benefit less fromwealth redistribution for the common good,22 all leading to an economic rift in society thateconomist Robert Evans calls “private affluence and public squalor.”23
There is a lack of consensus about the relative importance of these psychosocial and materialpathways, and it is possible that both are involved in linking income inequality to poor health.For policymakers, a more significant question about this area of research is the lack of robustcausal evidence. A criterion of causal inference is temporality; the putative cause must precedethe effect.24,25 A limitation in the available evidence is that most studies of income inequality andhealth have used a cross-sectional research design. Any causal interpretation of the health impactsof income inequality implies antecedent-consequence conditions that have not yet been thoroughlytested. Other limitations of previous studies are their reliance on aggregate health indicators andthe limited number of country observations. Ecological studies sometimes lack the statistical powerneeded to detect macro-level contextual effects on health and adequately control differences incountry wealth, individual SEP, and other individual characteristics.
The goal of the present study was to address the issue of temporality using panel data on nationalincome inequality and health data from the World Health Organisation’s Health Behaviour inSchool-aged Children (HBSC) study. We hypothesised that early life exposure to income inequalityhas a lagged effect on health and well-being in adolescence. Our hypothesis for such an effect wasbased on developmental consequences of early childhood stress and socioeconomic disadvantage.Developmental and epigenetic studies have traced the origins of SEP differences in mental andphysical health to early life experiences, specifically to neuroendocrine stress pathways,26
neuroregulatory centres of the brain that govern attention, social interaction, and emotion,27 andthe cumulative nature of chronic stress and its risks to health.28 For example, longitudinal studiesby Evans and colleagues found that low SEP at age 9 prospectively predicts physiological stressdysregulation, emotion dysregulation, and emotional and behavioural problems in adolescence(ages 13 and 17) after differences in concurrent SEP were controlled.29,30 The ‘biological embedding’of childhood poverty and the durability of socioeconomic differences in health across the life courseboth suggest that early life stressors – like income inequality – could impact health and well-beingthrough similar stress pathways and sensitive periods of development.31
Additional support for this lagged effect hypothesis comes from adult studies of income inequalityon health in later life. Karlsson et al. studied income inequality and adult health, activities of dailyliving, and life expectancy in 19 countries in 1990 and 2006 and found a significant lagged effect of
7
Early-life Exposure to Income Inequality and Adolescent Health and Well-being: Evidence from the Health Behaviour in School-aged Children StudyInnocenti Working Paper 2016-07
IWP7 - INCOME INEQUALITY.qxp_Layout 1 04/03/16 15:11 Pagina 7
income inequality on health but only in rich countries.32 Another study of national income inequalityand physical health in old age in 16 countries found a significant relation between averagedinequality over a 46-year period (1960 to 2006) and later health.33 Blakely et al. used US state-leveldata on income inequality and self-reported adult health and found that in adults aged 45 years andolder, income inequality experienced up to 15 years previously related more strongly to poor healththan inequality measured contemporaneously.34 More recently, Lillard et al. reported on smallbut statistically significant effects of early life exposure (0 to 4 years) to national income inequalityon health later in life.35 However, this study involved a single cohort in just one country and thusconfounded age, cohort, and period effects because income inequality varied synchronouslyover time with developmental stages and not between settings or individuals. Not all studies havefound such effects. Leigh and Jencks examined life expectancy, infant mortality, homicide,and suicide in a sample of 12 countries and found no association (concurrently or with a 5-year lag)with income inequality.36 Similarly, Mellor and Milyo found no significant lagged effects ofUS state-level income inequality on adult self-rated health after controlling for state fixed-effects.37
We are unaware of any previous research on lagged effects of income inequality in childhood onhealth and well-being in adolescence. The small number of studies that have investigated early lifeexposures to income inequality has involved different sample characteristics, analytic approaches,statistical controls, and measures of income inequality and health. None of these studies useddatasets that provided sufficient heterogeneity in income inequality between populations,time periods, and age groups. This study aims to address this knowledge gap using a seriesof repeated, cross-national surveys of adolescent health that were carried out in 40 countries as partof the HBSC study (www.hbsc.org). We link individual records on the health and well-being of11, 13 and 15-year-olds from six survey cycles (1994 to 2014) to country-level data on incomeinequality for each survey year (contemporaneous effects) and earlier developmental periods,at 0-4 years and 5-9 years (lagged effects). These two early age groups were chosen to distinguishinfancy and early childhood stages of development when social influences on health and well-beingbegin to extend from the family to school and community settings. We apply Fairbrother’s ‘societalgrowth curve model’ of country-level changes in income inequality in order to maximizethe statistical sensitivity of our analysis to contextual-level effects. This multilevel design poolsrepeated cycles of complex survey data while retaining their multilevel structure, which helpsto delineate age, cohort, and period effects.38 Our hypothesis is that exposure to income inequalityin infancy and early childhood relates to health symptoms and low well-being in adolescence,after controlling differences in contemporaneous income inequality, national wealth,and individual-level family affluence.
2. METHODS
Data sources
Health Behaviour in School-aged Children Study. Self-report data on health symptoms and familyaffluence were collected in the 1994, 1998, 2002, 2006, 2010, and 2014 cycles of the HBSC study.Data on life satisfaction were collected in the 2002, 2006, 2010, and 2014 cycles. Each cycle included
8
Early-life Exposure to Income Inequality and Adolescent Health and Well-being: Evidence from the Health Behaviour in School-aged Children StudyInnocenti Working Paper 2016-07
IWP7 - INCOME INEQUALITY.qxp_Layout 1 04/03/16 15:11 Pagina 8

nationally representative samples of 11-, 13- and 15-year-olds from a growing network of countriesin Europe and North America. The analysis of health symptoms involved a pooled sampleof 888,841 adolescents from 180 country/survey year groups. The analysis of life satisfactioninvolved a sample of 678,031 adolescents from 137 country/survey year groups. Greenlandwas omitted from the study due to the lack of publicly available economic data. Survey data fromEngland, Scotland and Wales were combined with equal weight to correspond to economic data onthe United Kingdom and data from French and Flemish samples in Belgium were also combined.
Health and well-being. In all HBSC survey cycles, an eight-item health symptom checklist measuredfour psychological symptoms (irritability or bad temper, feeling low, feeling nervous, and difficultysleeping) and four physical symptoms (headache, stomach ache, back ache, and feeling dizzy).39
Respondents reported the frequency of each symptom during the previous six months (0 = rarelyor never, 1 = every month, 2 = every week, 3 = more than once a week, 4 = every day). These scoreswere summed to create a health symptom scale that ranged from 0 to 32 points. The validity of thishealth symptom checklist was supported by cross-national studies and qualitative interviewswith adolescents.39,40 Since 2002, the HBSC survey included Cantril’s life satisfaction ladderto measure how respondents felt about their life at present on an 11-point scale ranging from 0(worst possible life) to 10 (best possible life).41
Socioeconomic position. The HBSC Family Affluence Scale (FAS) was used in our study to accountfor some socioeconomic variation at the individual level. The FAS is an index of material assetsor common indicators of wealth.42,43 It has been validated alongside measures of SEP that solicitadolescents’ reports of parental occupation, educational attainment, or household income, andhas been found to have better criterion validity and to be less affected by non-response bias thanthese other measures.42,44 The FAS had two items in the 1994 survey, “Does your family own a car,van or truck?” (No = 0, Yes = 1, Yes, two or more = 2); “Do you have your own bedroom foryourself?” (No = 0, Yes = 1). A third item was added to the scale in 1998: “During the past12 months, how many times did you travel away on holiday with your family?” (Not at all = 0,Once = 1, Twice or more = 2); A fourth item was added for the 2002, 2006, and 2010 surveys:“How many computers does your family own?” (None = 0, One = 1, Two or more = 2).Finally, two more items were added for the 2014 survey, thus creating a 6-item scale: “At home,do you have a dishwasher (No = 0, Yes = 1); How many bathrooms (room with a bath) are inyour home (None = 0, One = 1, Two = 2, More than two = 3).” Total summary scores on these itemswere transformed to country- and year-specific ridit scores, thus representing a relative familyaffluence score for each country/year group that ranged from 0 (least affluent) to 1 (most affluent).The ridit is a proportional rank score that represents the proportion of observations withlower scores, effectively transforming ordinal data to de facto interval scale.45,46
Country data. Data on country wealth, gross national income per person (Atlas method, US dollars)were retrieved for every HBSC survey cycle year from the World Bank Databank.47 Data on nationalincome inequality were retrieved from Frederick Solt’s Standardized World Income InequalityDatabase.48 This database contains estimated Gini indices of post-taxation income inequality basedon the UN University’s World Income Inequality Database and Luxembourg Income Study.
9
Early-life Exposure to Income Inequality and Adolescent Health and Well-being: Evidence from the Health Behaviour in School-aged Children StudyInnocenti Working Paper 2016-07
IWP7 - INCOME INEQUALITY.qxp_Layout 1 04/03/16 15:11 Pagina 9

The Gini index has a theoretical range of 0 (perfect equality with everyone having equal income)to 1 (perfect inequality with one person having all the income). We retrieved Gini indices from 1979to 2014 to cover all early life exposures for adolescents aged 11, 13 and 15 years in the HBSC study,including Eastern European countries that were once part of the USSR, Yugoslavia, andCzechoslovakia. 1979 is the earliest year that we chose as it is the birth year for the oldest age group(15-year-olds) in the first HBSC survey cycle in 1994.
Statistical analysis. According to Fairbrother, our analytic design is a variation of growth curvemodelling because it examines change in countries through repeated cross-sectional surveys.38
Our country/year groups were nested within each country in a 3-level framework. Time (in years)was modelled as a random effect. Age (in years) was modelled as a fixed effect.38 We did notinclude schools as a fourth level of variation due to computational limitations. Intraclasscorrelations at the school level were 0.07 for health symptoms and 0.08 for life satisfaction.Therefore, most of the observed variation in symptoms and life satisfaction were attributedto individual, country, and temporal differences. The time variable was anchored at the first HBSCsurvey cycle in 1994 and ranges from 0 to 20 years. Then, individual records from the HBSCwere linked to a table of annual income inequality “exposures” from birth to the age at the timeof HBSC data collection. The advantage of staggering age groups and survey years in this way isthat it guards against confounding age, cohort, and period effects. In the main analysis,we use the averages in national income inequality from ages 0 to 4 and from age 5 to 9 asthe two early exposure variables. The goodness-of-fit of these models is reported using Akaike’sinformation criterion (AIC), which is a measure of model deviance (d) adjusted for the numberof parameters (q) in the model (AIC = d + 2q), and the more conservative Bayesian informationcriterion (BIC), which also corrects for differences in the number of observations (n) in the model(BIC = d + log(n)*q).49 We then examine the contributions of each year of income inequalityexposure from age 0 to 10 to attempt to hone in on a developmental period that is most sensitiveto income inequality in terms of adolescent health and well-being.
3. RESULTS
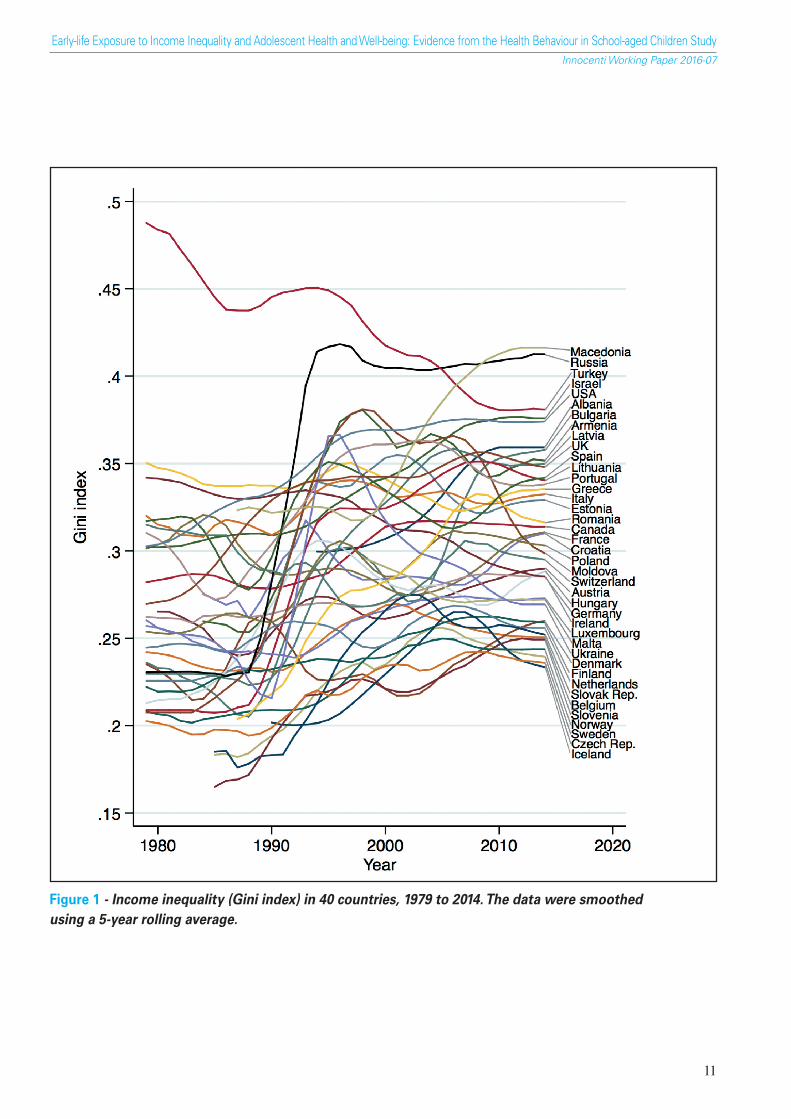
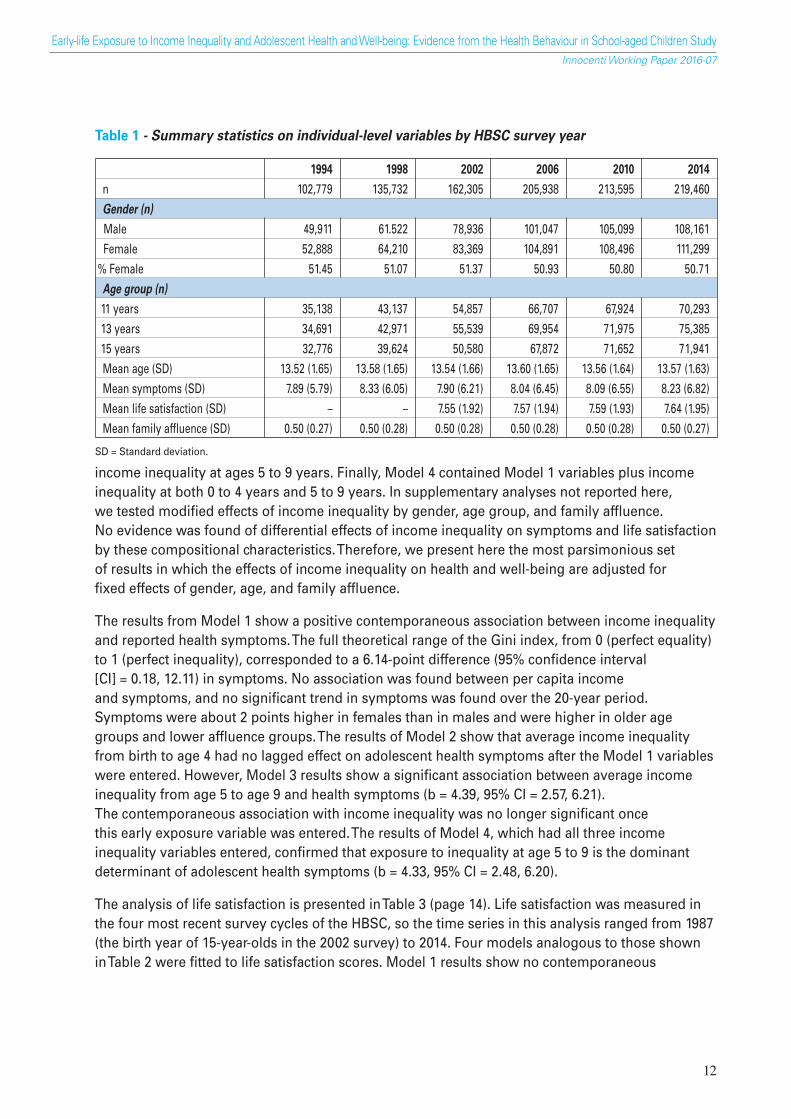
Descriptive statistics on the individual-level variables used in the study are summarised inTable 1 (page 12). The gender and age distributions of the samples were about equal in all sixsurvey cycles. During HBSC survey years, per capita income ranged from $4,570 (Ukraine, 2002)to $65,970 (Norway, 2014) and income inequality ranged from 0.175 (Finland, 1994)to 0.416 (Macedonia). Figure 1 (page 11) shows the high variability in income inequality betweencountries and during the 35-year period from 1979 to 2014. Thirty-five of the 40 countries in thestudy experienced a rise in income inequality. Gini indices rose by approximately 21%, from anaverage of 0.263 (SD = 0.060) in 1979 (or first observation thereafter) to 0.308 (SD = 0.049) in 2014.
Our analysis of health symptoms is summarized in Table 2 (page 14). Four regression models werefitted to the data. Model 1 included gender, age group, family affluence, time, and country-levelincome inequality and per capita income at the time of the survey. Model 2 contained Model 1variables plus income inequality at ages 0 to 4 years. Model 3 contained Model 1 variables plus
10
Early-life Exposure to Income Inequality and Adolescent Health and Well-being: Evidence from the Health Behaviour in School-aged Children StudyInnocenti Working Paper 2016-07
IWP7 - INCOME INEQUALITY.qxp_Layout 1 04/03/16 15:11 Pagina 10
11
Early-life Exposure to Income Inequality and Adolescent Health and Well-being: Evidence from the Health Behaviour in School-aged Children StudyInnocenti Working Paper 2016-07
Figure 1 - Income inequality (Gini index) in 40 countries, 1979 to 2014. The data were smoothedusing a 5-year rolling average.
IWP7 - INCOME INEQUALITY.qxp_Layout 1 04/03/16 15:11 Pagina 11
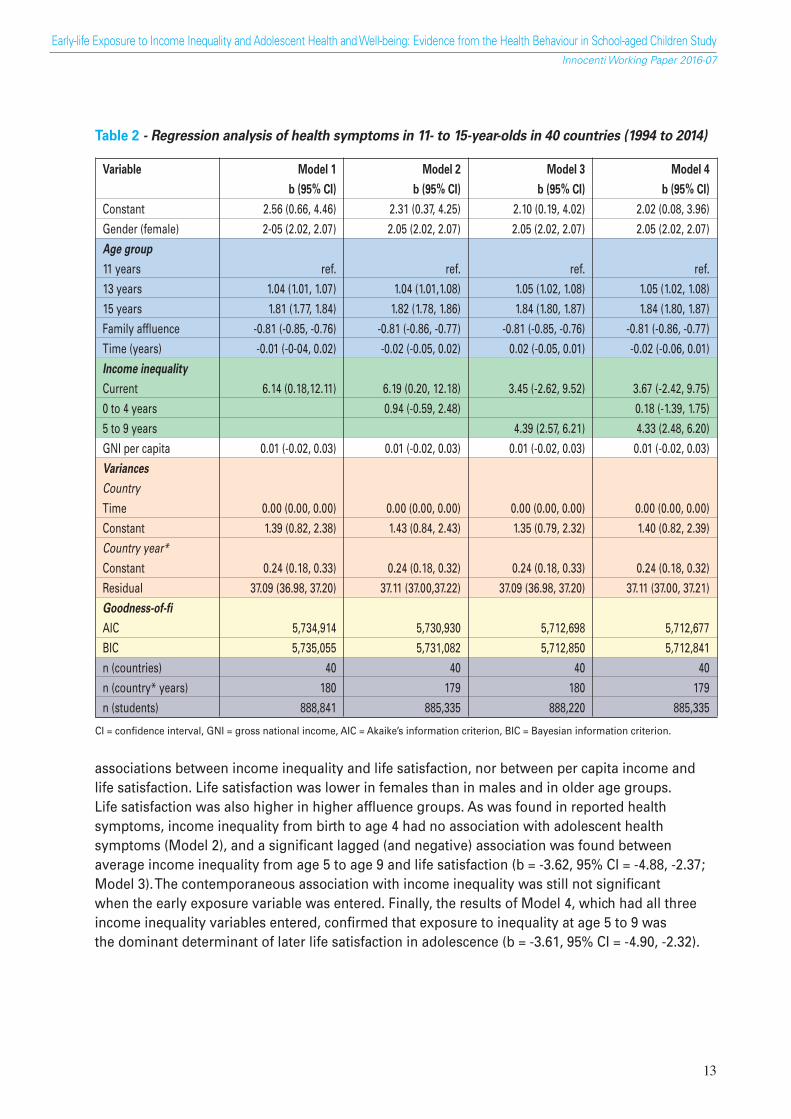
income inequality at ages 5 to 9 years. Finally, Model 4 contained Model 1 variables plus incomeinequality at both 0 to 4 years and 5 to 9 years. In supplementary analyses not reported here,we tested modified effects of income inequality by gender, age group, and family affluence.No evidence was found of differential effects of income inequality on symptoms and life satisfactionby these compositional characteristics. Therefore, we present here the most parsimonious setof results in which the effects of income inequality on health and well-being are adjusted forfixed effects of gender, age, and family affluence.
The results from Model 1 show a positive contemporaneous association between income inequalityand reported health symptoms. The full theoretical range of the Gini index, from 0 (perfect equality)to 1 (perfect inequality), corresponded to a 6.14-point difference (95% confidence interval[CI] = 0.18, 12.11) in symptoms. No association was found between per capita incomeand symptoms, and no significant trend in symptoms was found over the 20-year period.Symptoms were about 2 points higher in females than in males and were higher in older agegroups and lower affluence groups. The results of Model 2 show that average income inequalityfrom birth to age 4 had no lagged effect on adolescent health symptoms after the Model 1 variableswere entered. However, Model 3 results show a significant association between average incomeinequality from age 5 to age 9 and health symptoms (b = 4.39, 95% CI = 2.57, 6.21).The contemporaneous association with income inequality was no longer significant oncethis early exposure variable was entered. The results of Model 4, which had all three incomeinequality variables entered, confirmed that exposure to inequality at age 5 to 9 is the dominantdeterminant of adolescent health symptoms (b = 4.33, 95% CI = 2.48, 6.20).
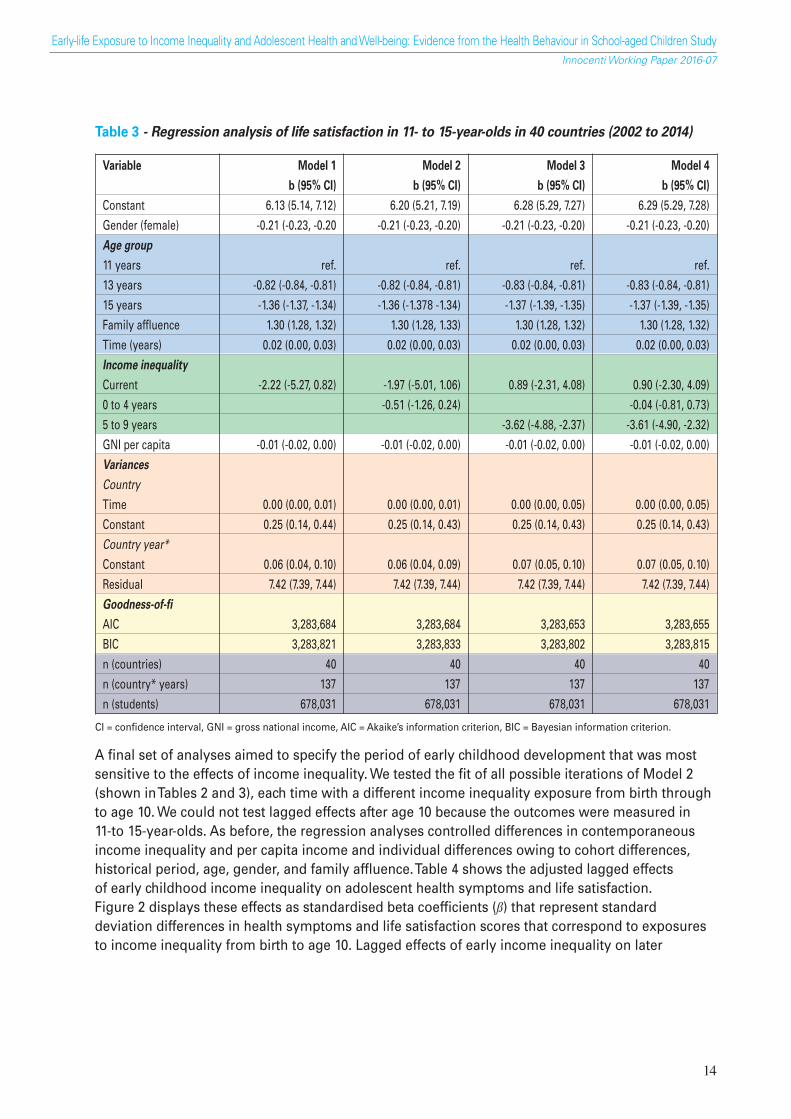
The analysis of life satisfaction is presented in Table 3 (page 14). Life satisfaction was measured inthe four most recent survey cycles of the HBSC, so the time series in this analysis ranged from 1987(the birth year of 15-year-olds in the 2002 survey) to 2014. Four models analogous to those shownin Table 2 were fitted to life satisfaction scores. Model 1 results show no contemporaneous
12
Early-life Exposure to Income Inequality and Adolescent Health and Well-being: Evidence from the Health Behaviour in School-aged Children StudyInnocenti Working Paper 2016-07
Table 1 - Summary statistics on individual-level variables by HBSC survey year
1994 1998 2002 2006 2010 2014
n 102,779 135,732 162,305 205,938 213,595 219,460Gender (n)
Male 49,911 61.522 78,936 101,047 105,099 108,161Female 52,888 64,210 83,369 104,891 108,496 111,299
% Female 51.45 51.07 51.37 50.93 50.80 50.71Age group (n)
11 years 35,138 43,137 54,857 66,707 67,924 70,29313 years 34,691 42,971 55,539 69,954 71,975 75,38515 years 32,776 39,624 50,580 67,872 71,652 71,941Mean age (SD) 13.52 (1.65) 13.58 (1.65) 13.54 (1.66) 13.60 (1.65) 13.56 (1.64) 13.57 (1.63)Mean symptoms (SD) 7.89 (5.79) 8.33 (6.05) 7.90 (6.21) 8.04 (6.45) 8.09 (6.55) 8.23 (6.82)Mean life satisfaction (SD) – – 7.55 (1.92) 7.57 (1.94) 7.59 (1.93) 7.64 (1.95)Mean family affluence (SD) 0.50 (0.27) 0.50 (0.28) 0.50 (0.28) 0.50 (0.28) 0.50 (0.28) 0.50 (0.27)
SD = Standard deviation.
IWP7 - INCOME INEQUALITY.qxp_Layout 1 04/03/16 15:11 Pagina 12
associations between income inequality and life satisfaction, nor between per capita income andlife satisfaction. Life satisfaction was lower in females than in males and in older age groups.Life satisfaction was also higher in higher affluence groups. As was found in reported healthsymptoms, income inequality from birth to age 4 had no association with adolescent healthsymptoms (Model 2), and a significant lagged (and negative) association was found betweenaverage income inequality from age 5 to age 9 and life satisfaction (b = -3.62, 95% CI = -4.88, -2.37;Model 3). The contemporaneous association with income inequality was still not significantwhen the early exposure variable was entered. Finally, the results of Model 4, which had all threeincome inequality variables entered, confirmed that exposure to inequality at age 5 to 9 wasthe dominant determinant of later life satisfaction in adolescence (b = -3.61, 95% CI = -4.90, -2.32).
13
Early-life Exposure to Income Inequality and Adolescent Health and Well-being: Evidence from the Health Behaviour in School-aged Children StudyInnocenti Working Paper 2016-07
Table 2 - Regression analysis of health symptoms in 11- to 15-year-olds in 40 countries (1994 to 2014)
Variable Model 1 Model 2 Model 3 Model 4
b (95% CI) b (95% CI) b (95% CI) b (95% CI)
Constant 2.56 (0.66, 4.46) 2.31 (0.37, 4.25) 2.10 (0.19, 4.02) 2.02 (0.08, 3.96)Gender (female) 2-05 (2.02, 2.07) 2.05 (2.02, 2.07) 2.05 (2.02, 2.07) 2.05 (2.02, 2.07)Age group
11 years ref. ref. ref. ref.13 years 1.04 (1.01, 1.07) 1.04 (1.01,1.08) 1.05 (1.02, 1.08) 1.05 (1.02, 1.08)15 years 1.81 (1.77, 1.84) 1.82 (1.78, 1.86) 1.84 (1.80, 1.87) 1.84 (1.80, 1.87)Family affluence -0.81 (-0.85, -0.76) -0.81 (-0.86, -0.77) -0.81 (-0.85, -0.76) -0.81 (-0.86, -0.77)Time (years) -0.01 (-0-04, 0.02) -0.02 (-0.05, 0.02) 0.02 (-0.05, 0.01) -0.02 (-0.06, 0.01)Income inequality
Current 6.14 (0.18,12.11) 6.19 (0.20, 12.18) 3.45 (-2.62, 9.52) 3.67 (-2.42, 9.75)0 to 4 years 0.94 (-0.59, 2.48) 0.18 (-1.39, 1.75)5 to 9 years 4.39 (2.57, 6.21) 4.33 (2.48, 6.20)GNI per capita 0.01 (-0.02, 0.03) 0.01 (-0.02, 0.03) 0.01 (-0.02, 0.03) 0.01 (-0.02, 0.03)Variances
Country
Time 0.00 (0.00, 0.00) 0.00 (0.00, 0.00) 0.00 (0.00, 0.00) 0.00 (0.00, 0.00)Constant 1.39 (0.82, 2.38) 1.43 (0.84, 2.43) 1.35 (0.79, 2.32) 1.40 (0.82, 2.39)Country year*
Constant 0.24 (0.18, 0.33) 0.24 (0.18, 0.32) 0.24 (0.18, 0.33) 0.24 (0.18, 0.32)Residual 37.09 (36.98, 37.20) 37.11 (37.00,37.22) 37.09 (36.98, 37.20) 37.11 (37.00, 37.21)Goodness-of-fi
AIC 5,734,914 5,730,930 5,712,698 5,712,677BIC 5,735,055 5,731,082 5,712,850 5,712,841n (countries) 40 40 40 40n (country* years) 180 179 180 179n (students) 888,841 885,335 888,220 885,335
CI = confidence interval, GNI = gross national income, AIC = Akaike’s information criterion, BIC = Bayesian information criterion.
IWP7 - INCOME INEQUALITY.qxp_Layout 1 04/03/16 15:11 Pagina 13
A final set of analyses aimed to specify the period of early childhood development that was mostsensitive to the effects of income inequality. We tested the fit of all possible iterations of Model 2(shown in Tables 2 and 3), each time with a different income inequality exposure from birth throughto age 10. We could not test lagged effects after age 10 because the outcomes were measured in11-to 15-year-olds. As before, the regression analyses controlled differences in contemporaneousincome inequality and per capita income and individual differences owing to cohort differences,historical period, age, gender, and family affluence. Table 4 shows the adjusted lagged effectsof early childhood income inequality on adolescent health symptoms and life satisfaction.Figure 2 displays these effects as standardised beta coefficients (ß) that represent standarddeviation differences in health symptoms and life satisfaction scores that correspond to exposuresto income inequality from birth to age 10. Lagged effects of early income inequality on later
Table 3 - Regression analysis of life satisfaction in 11- to 15-year-olds in 40 countries (2002 to 2014)
Variable Model 1 Model 2 Model 3 Model 4
b (95% CI) b (95% CI) b (95% CI) b (95% CI)
Constant 6.13 (5.14, 7.12) 6.20 (5.21, 7.19) 6.28 (5.29, 7.27) 6.29 (5.29, 7.28)Gender (female) -0.21 (-0.23, -0.20 -0.21 (-0.23, -0.20) -0.21 (-0.23, -0.20) -0.21 (-0.23, -0.20)Age group
11 years ref. ref. ref. ref.13 years -0.82 (-0.84, -0.81) -0.82 (-0.84, -0.81) -0.83 (-0.84, -0.81) -0.83 (-0.84, -0.81)15 years -1.36 (-1.37, -1.34) -1.36 (-1.378 -1.34) -1.37 (-1.39, -1.35) -1.37 (-1.39, -1.35)Family affluence 1.30 (1.28, 1.32) 1.30 (1.28, 1.33) 1.30 (1.28, 1.32) 1.30 (1.28, 1.32)Time (years) 0.02 (0.00, 0.03) 0.02 (0.00, 0.03) 0.02 (0.00, 0.03) 0.02 (0.00, 0.03)Income inequality
Current -2.22 (-5.27, 0.82) -1.97 (-5.01, 1.06) 0.89 (-2.31, 4.08) 0.90 (-2.30, 4.09)0 to 4 years -0.51 (-1.26, 0.24) -0.04 (-0.81, 0.73)5 to 9 years -3.62 (-4.88, -2.37) -3.61 (-4.90, -2.32)GNI per capita -0.01 (-0.02, 0.00) -0.01 (-0.02, 0.00) -0.01 (-0.02, 0.00) -0.01 (-0.02, 0.00)Variances
Country
Time 0.00 (0.00, 0.01) 0.00 (0.00, 0.01) 0.00 (0.00, 0.05) 0.00 (0.00, 0.05)Constant 0.25 (0.14, 0.44) 0.25 (0.14, 0.43) 0.25 (0.14, 0.43) 0.25 (0.14, 0.43)Country year*
Constant 0.06 (0.04, 0.10) 0.06 (0.04, 0.09) 0.07 (0.05, 0.10) 0.07 (0.05, 0.10)Residual 7.42 (7.39, 7.44) 7.42 (7.39, 7.44) 7.42 (7.39, 7.44) 7.42 (7.39, 7.44)Goodness-of-fi
AIC 3,283,684 3,283,684 3,283,653 3,283,655BIC 3,283,821 3,283,833 3,283,802 3,283,815n (countries) 40 40 40 40n (country* years) 137 137 137 137n (students) 678,031 678,031 678,031 678,031
CI = confidence interval, GNI = gross national income, AIC = Akaike’s information criterion, BIC = Bayesian information criterion.
14
Early-life Exposure to Income Inequality and Adolescent Health and Well-being: Evidence from the Health Behaviour in School-aged Children StudyInnocenti Working Paper 2016-07
IWP7 - INCOME INEQUALITY.qxp_Layout 1 04/03/16 15:11 Pagina 14

health symptoms first emerged at age 3 (b =1.56, 95% CI = 0.22, 2.90), peaked at age 6(b = 3.64, 95% CI = 2.14, 5.21), and remained statistically greater than zero through to age 10.Income inequality exposures at birth, age 1, and age 2 had no association to health symptoms.The lagged effects of early income inequality on life satisfaction first emerged at age 6(b = 1.93, 95% CI = -2.94, -0.92), peeked at age 9 (b = -4.74, 95% CI = -5.95, -3.52), and remainedstatistically greater than zero from ages 6 to 10.
15
Early-life Exposure to Income Inequality and Adolescent Health and Well-being: Evidence from the Health Behaviour in School-aged Children StudyInnocenti Working Paper 2016-07
Table 4 - Associations between early life income inequality, from birth to age 10,and health symptoms and life satisfaction in adolescence
Age of exposure Health symptoms Life satisfaction(years) b (95% CI) t b (95% CI) t
0 -0.25 (-1.56, 1.06) -0.38 -0.55 (-1.17, 0.08) -1.721 -0.18 (-1.50, 1.14) -0.27 -0.53 (-1.17, 0.10) -1.642 0.62 (-0.68, 1.93) 0.93 -0.30 (-0.92, 0.33) -0.933 1.56 (0.22, 2.90) 2.28* -0.25 (-0.92, 0.41) -0.754 2.36 (0.95, 3.77) 3.28** -0.27 (-1.00, 0.45) -0.745 2.95 (1.47, 4.44) 3.90*** -0.48 (-1.32, 0.36) -1.116 3.68 (2.14, 5.22) 4.68*** -1.93 (-2.96, -0.92) -3.75***7 3.65 (2.04, 5.26) 4.45*** -3.19 (-4.31, -2.07) -5.58***8 3.22 (1.57, 4.86) 3.83*** -4.23 (-5.39, -3.07) -7.16***9 3.24 (1.59, 4.89) 3.84*** -4.74 (-5.95, -3.52) -7.63***
10 3.58 (1.92, 5.23) 4.23*** -4.05 (-5.31, -2.78) -6.28***
Note: Shown are regression coefficients (b) and 95% confidence intervals (CI) of the lagged effects, analogousto Model 2 shown in Tables 2 and 3. The t-score represents deviation from the null. The coefficients are adjustedfor concurrent income inequality and country wealth, historical period (survey year), and individual differencesin gender, age, and family affluence, and birth year (cohort). *p<0.05. **p<0.01. ***p<0.001.
Figure 2 - Associationbetween early life exposureto income inequality eachyear from birth to age 10,and later health symptomsand life satisfaction inadolescence (11 to 15 years).
Shown are standardised beta coefficients(ß) and 95% confidence intervals of thelagged effects, adjusted for concurrentincome inequality and country wealth,historical period (survey year), andindividual differences in gender, age, andfamily affluence, and birth year (cohort).The data correspond to the results shownin Table 4.
*p<0.05. **p<0.01. ***p<0.001.
IWP7 - INCOME INEQUALITY.qxp_Layout 1 04/03/16 15:11 Pagina 15

4. DISCUSSION
This is the most comprehensive study to date on the consequences of early life income inequalityfor adolescent health and well-being. It exceeds previous analyses of early life income inequalityand subsequent health outcomes. By pooling data from multiple survey cycles of the HBSC studyin multiple countries and linking them to country level data on current and earlier incomeinequality, we found robust evidence of lagged effects of income inequality in early childhoodon self-reported psychosomatic symptoms and life satisfaction in adolescence.
These results make three key contributions to the literature. First, they help to establish antecedent-consequence conditions in the association between income inequality and health. Questions abouttheir temporal order have remained unanswered in causal interpretations of the association.20
Although we could not track individual changes in health and well-being in relation to incomeinequality, the quasi-longitudinal design allowed us to separate early-life exposures and later healthoutcomes by up to 10 years. Therefore, the results address a fundamental criterion of causalinference and questions about the direction of influence between income inequality and individualhealth and well-being.20,24
Second, the study addresses the scarcity of developmental studies on the structural determinantsof child health and well-being.18 We found that growing up in European and North Americancountries that have historically been more equal, with relatively lower income inequality,was related to fewer physical and mental health symptoms and greater life satisfactionin adolescents. The developmental consequences of income inequality were evidently independentof country wealth (per capita income) as well as differences in gender, age, and family affluence.We also identified periods of child development when exposure to income inequality had thegreatest effects on adolescent health: between ages 3 and 10 for health symptoms (peaking at age6) and between ages 6 and 10 for life satisfaction (peaking at age 9). We had expected to find thatthe effects of income inequality would be greatest during the first few years of life, when children’sbrain development and physiological stress pathways are known to be highly sensitive todeprivation and stress.26,27,29,31 One explanation for these results could be that the health impact ofearly stress caused by inequality wanes as more time elapses between the exposure and outcome.Further analysis using similarly structured international panel surveys of adult data would beneeded to confirm this, however to our knowledge no such data source exists.
Other interpretations of these lagged effects come from the proposed pathways through whichincome inequality relates to health. Wilkinson’s psychosocial hypothesis focuses on the divisiveeffects of inequality at a broad social level and not in the home environment where infants andtoddlers spend nearly all their time.10,17 Children are not fully exposed to the psychosocialconsequences of income inequality until they are old enough to form social relationships outside thehome, such as play groups, day care centres, and primary schools. According to Arsenio and Gold’sdevelopmental hypothesis, inequality affects children’s moral development while they are developingthe cognitive schemas of distributive justice and fairness,21 an ability that emerges between the agesof 3 and 8.50 This developmental milestone coincides with the age range we found most sensitive to
16
Early-life Exposure to Income Inequality and Adolescent Health and Well-being: Evidence from the Health Behaviour in School-aged Children StudyInnocenti Working Paper 2016-07
IWP7 - INCOME INEQUALITY.qxp_Layout 1 04/03/16 15:11 Pagina 16

income inequality exposure. Finally, there are material explanations focussing on cash transfers tofamilies and quality of public services and infrastructure,22 which are more likely to affect children’shealth and well-being once they begin primary schooling. Families with infant children may bebuffered from the stressors of inequality by social security services, income supports, parental leavebenefits, health visiting, home nurses, and preschool play groups. The beginning of formal schoolingat age 4 or 5 marks a transition to fewer supports, new financial stressors, and greater reliance ongood quality public schools and health services. These financial pressures can compromise parentalhealth and the quality of parenting.51There is also recent evidence that indicates that incomeinequality relates to the maltreatment of children by parents.16 However, our data do not allowthis proposed mechanism to be investigated or substantiated.
The third main contribution of the study is the demonstration of societal growth curve modellingto extract a high level of statistical power in the multilevel analysis of complex survey data.38
Cross-national studies of macro determinants of health and well-being are often constrained bythe number of countries that can be included in any one study. The study showed how to managethis power limitation by pooling data from repeated survey cycles and then statisticallycontrolling group differences and autocorrelation in the time series. A similar approach,pooled time-series analysis (or fixed effects modelling), requires the data to be ‘flattened’ toan aggregated country-level variable like an average health score, prevalence, or mortality rate(e.g., see Elgar et al.6,13). Fairbrother’s societal growth curve model preserves the multilevelstructure of the data, which is crucial for separating the compositional effects of the sample andclustering from the contextual effects of the country-level construct.38
Limitations of these analyses should also be noted. First, the study assumed zero migration inthe sample from birth to age 15 because adolescents’ nationality in the HBSC study determinedthe country of income inequality exposure and we did not have information about their countryof birth nor age of migration. This uncontrolled variable may have introduced some noise toour results but we do not expect that different results would have emerged had we controlledfor differences in migration. Another recent analysis of data from the Health and Retirement Studyin the United States found long-term lagged relationships between inequality and mortalityafter age 50 after taking migration into account.52
Second, we analysed only two indicators of health and well-being, psychosomatic symptoms andlife satisfaction. Whilst these provided a general assessment of adolescent health and well-beingusing well-validated self-report tools, we cannot extrapolate our results to other domains of healthnor to older age groups. Replications of these findings on data that were collected in successiveinternational surveys of adult health would be useful. Third, we could not include schools asa fourth level of variation in the multilevel models due to computational limitations. Seven to 8%of the variation in health and well-being was attributed to school-level clustering, which is nearrecommended thresholds for using multilevel analysis.53 Fourth, although exact response ratesin the HSBC study could not be established, fieldworker reports from several countries showedthat 5 to 10% of pupils were absent from the surveys, which inevitably poses the possibility ofnon-response bias due to illness and school truancy. Finally, although we can speculate on
17
Early-life Exposure to Income Inequality and Adolescent Health and Well-being: Evidence from the Health Behaviour in School-aged Children StudyInnocenti Working Paper 2016-07
IWP7 - INCOME INEQUALITY.qxp_Layout 1 04/03/16 15:11 Pagina 17

the causal mechanisms involved in these associations, we have not fully explored the healthimpacts of family contexts (such as family structure and quality of family relationships) duringthe early years. These family processes in early life and their links to income inequality andlater health outcomes in adolescence require further investigation.
5. CONCLUSIONS
Over the past two decades, theorists have begun to argue more forcefully that understandingand enhancing health requires greater attention on upstream determinants on health early in life.The literature has expanded its focus from individual risk or protective factors to the social patternsand structures that shape children’s chances to be healthy.7 In 2008, the WHO Commissionon Social Determinants of Health (SDH) emphasised the importance of a life-course approachto action on SDH.54 However, life-course approaches thus far have focused on early childhoodpredictors of adult health and have paid limited attention to adolescence.5,55 This is surprisingbecause social inequalities have been reported at every stage of the life course, and becausehealth and health behaviours track strongly from early adolescence through to old age.54
The present study addresses a significant knowledge gap in the literature by showing a relationbetween early childhood exposure to income inequality and adolescent health and well-being.The results not only show negative health consequences of income inequality early in life, butthey also suggest that inequality alters formative developmental pathways to adult health andwell-being during this understudied stage of the life course. Current global trends in risingincome inequality pose major social and ethical challenges to governments. Some of the healthand social problems associated with income inequality can be seen as products of cumulative riskthrough the life course, beginning at a very early age. The good news is that these results alsopoint to policy options for governments that could mitigate these effects by reducing inequalityand supporting child health and well-being.
18
Early-life Exposure to Income Inequality and Adolescent Health and Well-being: Evidence from the Health Behaviour in School-aged Children StudyInnocenti Working Paper 2016-07
IWP7 - INCOME INEQUALITY.qxp_Layout 1 04/03/16 15:11 Pagina 18
REFERENCES
1 Chen, E, and L.Q. Paterson (2006). Neighborhood, Family, and Subjective Socioeconomic Status:How do they relate to adolescent health? Health Psychol. 25(6):704-14.
2 Repetti, R.L, S.E. Taylor, T. Seeman (2002). Risky Families: Family social environments andthe mental and physical health of offspring. Psychol Bull. 128(2):330-66.
3 Galobardes, B, G.D. Smith, J.W. Lynch (2006). Systematic Review of the Influence of ChildhoodSocioeconomic Circumstances on Risk for Cardiovascular Disease in Adulthood. Ann Epidemiol.16(2):91-104.
4 Brooks-Gunn, J., G.J. Duncan, N. Maritato (1997). Poor Families, Poor Outcomes: The well-being ofchildren and youth. In G.J. Duncan and J. Brooks-Gunn (eds.), Consequences of Growing UpPoor (pp. 1-17). New York: Russel Sage Foundation.
5 Viner, R.M., E.M. Ozer, S. Denny, M. Marmot, M. Resnick, A. Fatusi, C. Currie (2012). Adolescenceand the Social Determinants of Health, Lancet 28;379(9826):1641-52.
6 Elgar, F.J., T.K. Pförtner, I. Moor, B. De Clercq, G.W. Stevens, C. Currie (2015). SocioeconomicInequalities in Adolescent Health 2002-2010: A time-series analysis of 34 countries participatingin the Health Behaviour in School-aged Children study, Lancet. 23;385(9982):2088-95.
7 UN Millennium Development Goals. Available at: http://www.un.org/millenniumgoals AccessedNovember 20, 2015.
8 UNICEF Office of Research – Innocenti (2016). Fairness for Children: A league table of inequality inchild well-being in rich countries. Innocenti Report Card 13, UNICEF Office of Research, Florence.
9 Kondo, N., G. Sembajwe, I. Kawachi, R.M. van Dam, S.V. Subramanian, Z. Yamagata (2009).Income Inequality, Mortality, and Self-rated Health: Meta-analysis of multilevel studies.BMJ 10;339:b4471.
10 Wilkinson, R. K. Pickett (2010). The Spirit Level: Why more equal societies almost always do better.London, UK, Penguin.
11 Elgar, F.J., C. Roberts, N. Parry-Langdon, W. Boyce (2005). Income Inequality and Alcohol Use:A multilevel analysis of drinking and drunkenness in adolescents in 34 countries. Eur J PublicHealth. 15(3):245-50.
12 Elgar, F.J., W. Craig, W. Boyce, A. Morgan, R. Vella-Zarb (2009). Income Inequality and SchoolBullying: Multilevel study of adolescents in 37 countries. J Adolesc Health 45(4):351-9.
13 Elgar, F.J., K.E. Pickett, W. Pickett, W. Craig, M. Molcho, K. Hurrelmann, M. Lenzi (2013). SchoolBullying, Homicide and Income Inequality: A cross-national pooled time series analysis,Int J Public Health 58(2):237-45.
14 Pabayo, R., B.E. Molnar, I. Kawachi (2014). The Role of Neighborhood Income Inequality inAdolescent Aggression and Violence, J Adolesc Health 55(4):571-9.
19
Early-life Exposure to Income Inequality and Adolescent Health and Well-being: Evidence from the Health Behaviour in School-aged Children StudyInnocenti Working Paper 2016-07
IWP7 - INCOME INEQUALITY.qxp_Layout 1 04/03/16 15:11 Pagina 19
15 Pickett, K.E., J. Mookherjee, R.G. Wilkinson (2005). Adolescent Birth Rates, Total Homicides, andIncome Inequality in Rich Countries, Am J Public Health, 95(7):1181-3.
16 Eckenrode, J., E.G. Smith, M.E. McCarthy, M. Dineen (2014). Income Inequality and ChildMaltreatment in the United States, Pediatrics 133(3):454-61.
17 Pickett, K.E., R.G. Wilkinson (2007). Child Wellbeing and Income Inequality in Rich Societies:Ecological cross sectional study, BMJ. 335(7629):1080.
18 Pickett, K.E., R.G. Wilkinson (2015). The Ethical and Policy Implications of Research on IncomeInequality and Child Well-being, Pediatrics 135 Suppl 2:S39-47.
19 Chiavegatto Filho, A.D., I. Kawachi, Y.P. Wang, M.C. M.C. Viana, L.H. Andrade (2013). Does IncomeInequality Get under the Skin? A multilevel analysis of depression, anxiety and mental disordersin Sao Paulo, Brazil, J Epidemiol Community Health 1;67(11):966-72.
20 Pickett, K.E., R.G. Wilkinson (2015). Income Inequality and Health: A causal review, Soc Sci Med128:316-26.
21 Arsenio, W.F., J. Gold (2006). The Effects of Social Injustice and Inequality on Children’s MoralJudgments and Behavior: Towards a theoretical model, Cogn Dev 21:388–400.
22 Lynch, J.W., G.D. Smith, G.A. Kaplan, J.S. House (2000). Income Inequality and Mortality:Importance to health of individual income, psychosocial environment, or material conditions,BMJ 29;320(7243):1200-4.
23 Evans, R. (2002). Interpreting and Addressing Inequalities in Health: From Black to Acheson toBlair to…? London: Office of Health Economics.
24 Gordis, L. (2013). Epidemiology. Elsevier Saunders, Philadelphia.25 Kraemer, H.C., A.E. Kazdin, D.R. Offord, R.C. Kessler, P.S. Jensen, D.J. Kupfer (1997). Coming to
Terms with the Terms of Risk, Arch Gen Psychiatry 54(4):337-43.26 Gillman, M.W. (2005). Developmental Origins of Health and Disease, N Engl J Med. (17):1848-50.27 Kim, P., G.W. Evans, M. Angstadt, S.S. Ho, C.S. Sripada, J.E. Swain, I. Liberzon, K.L. Phan (2013).
Effects of Childhood Poverty and Chronic Stress on Emotion: Regulatory brain function inadulthood, Proc Natl Acad Sci 12;110(46):18442-7.
28 Shonkoff, J.P., W.T. Boyce, B.S. McEwen (2009). Neuroscience, Molecular Biology, and theChildhood Roots of Health Disparities: Building a new framework for health promotion anddisease prevention, JAMA 301(21):2252-9.
29 Evans, G.W., P. Kim (2012). Early Childhood Poverty and Adult Chronic Physiological Stress:The mediating role of childhood cumulative risk exposure, Psychol Sci 23(9):979-83.
30 Doan, S.N., T.E. Fuller-Rowell, G.W. Evans (2012). Cumulative Risk and Adolescent's Internalizingand Externalizing Problems: The mediating roles of maternal responsiveness and self-regulation, Dev Psychol. 48(6):1529-39.
31 Bradley, R.H., R.F. Corwyn (2002). Socioeconomic Status and Child Development, Ann Rev Psychol53:371-99.
20
Early-life Exposure to Income Inequality and Adolescent Health and Well-being: Evidence from the Health Behaviour in School-aged Children StudyInnocenti Working Paper 2016-07
IWP7 - INCOME INEQUALITY.qxp_Layout 1 04/03/16 15:11 Pagina 20
32 Karlsson, M., T. Nilsson, C.H. Lyttkens, G. Leeson (2010). Income Inequality and Health: Importanceof a cross-country perspective, Soc Sci Med. 70(6):875-85.
33 De Vries, R., D. Blane, G. Netuveli (2004). Long-term Exposure to Income Inequality: Implicationsfor Physical Functioning at Older Ages, European Journal of Ageing 11(1):19-29.
34 Blakely, T.A., B.P. Kennedy, R. Glass, I. Kawachi (2000). What is the Lag Time between IncomeInequality and Health Status? J Epidemiol Community Health, 54(4):318-9.
35 Lillard, D.R., R.V. Burkhauser, M.H. Hahn, R. Wilkins (2015). Does Early-life Income Inequality PredictSelf-reported Health in Later Life? Evidence from the United States, Soc Sci Med. 128:347-55.
36 Leigh, A, C. Jencks (2007). Inequality and Mortality: Long-run evidence from a panel of countries,J Health Econ. 26(1):1-24.
37 Mellor, J.M., J. Milyo (2003). Is Exposure to Income Inequality a Public Health Concern? Laggedeffects of income inequality on individual and population health, Health Serv Res. 38(1 Pt 1):137-51.
38 Fairbrother, M. (2013). Two Multilevel Modeling Techniques for Analyzing ComparativeLongitudinal Survey Datasets, Political Science Research and Methods 2(1):119-140.
39Torsheim, T., B. Wold (2001). School-related Stress, Support, and Subjective Health Complaintsamong Early Adolescents: A multilevel approach, J Adolesc. 24(6):701-13.
40 Haugland, S., B. Wold (2001). Subjective Health Complaints in Adolescence: Reliability and Validityof Survey Methods, J Adolesc. 24(5):611-24.
41 Cantril, H. (1965). The Pattern of Human Concern. Rutgers University Press, New Brunswick,NJ, 1965.
42 Torsheim, T., C. Currie, W. Boyce, I. Kalnins, M. Overpeck, S. Haugland (2004). Material Deprivationand Self-rated Health: A multilevel study of adolescents from 22 European and North Americancountries, Soc Sci Med 59: 1-12.
43 Currie, C., M. Molcho, W. Boyce, B. Holstein, T. Torsheim, M. Richter (2008). Researching HealthInequalities in Adolescents: The development of the HBSC Family Affluence Scale, Soc Sci Med66: 1429-36.
44 Elgar, F.J., B. McKinnon, T. Torbjorn, C.W. Schnohr, J. Mazur, F. Cavallo, C. Currie (in press) Patternsof Socioeconomic Inequality in Adolescent Health Differ According to the Measure ofSocioeconomic Position, Social Indicators Research.
45 Jansen, M.E. (1984). Ridit analysis, a review. Stat Neerl 38: 141-58.46 Donaldson, G.W. (1988). Ridit Scores for Analysis and Interpretation of Ordinal Pain Data,Eur J Pain 2: 221-27.
47The World Bank. GNI per capita, Atlas method (current US$).http://data.worldbank.org/indicator/NY.GNP.PCAP.CD (accessed March 6, 2014).
48 Solt, F. (2009). Standardizing the World Income Inequality Database Soc Sci Q 90: 231-42.49 Burnham, K.P., D.R. Anderson (2002). Model Selection and Multimodel Inference: A practical
information-theoretic approach (2nd ed.). Springer, New York.
21
Early-life Exposure to Income Inequality and Adolescent Health and Well-being: Evidence from the Health Behaviour in School-aged Children StudyInnocenti Working Paper 2016-07
IWP7 - INCOME INEQUALITY.qxp_Layout 1 04/03/16 15:11 Pagina 21

50 Fehr, E., H. Bernhard, B. Rockenbach (2008). Egalitarianism in Young Children, Nature28;454(7208):1079-83.
51 Jackson, A.P., J. Brooks-Gunn, C.C. Huang, M. Glassman (2000). Single Mothers in Low-wageJobs: Financial strain, parenting, and preschoolers’ outcomes, Child Dev. 71(5):1409-23.
52 Choi, H., S. Burgard, I.T. Elo, M. Meisler (2015). Are Older Adults Living in More Equal CountiesHealthier than Older Adults Living in More Unequal Counties? A propensity score matchingapproach, Soc Sci Med. 141:82-90.
53 Hox, J.J. (2010). Multilevel Analysis: Techniques and applications (2nd ed), New York, Routledge,2010.
54 Commission on Social Determinants of Health (2008). Closing the Gap in a Generation: Healthequity through action on the social determinants of health. Geneva: World Health Organization.
55 Li, J., E. Mattes, F. Stanley, A. McMurray, C. Hertzman (2009). Social Determinants of Child Healthand Well-being, Health Sociol Rev 18: 3-11.
22
Early-life Exposure to Income Inequality and Adolescent Health and Well-being: Evidence from the Health Behaviour in School-aged Children StudyInnocenti Working Paper 2016-07
IWP7 - INCOME INEQUALITY.qxp_Layout 1 04/03/16 15:11 Pagina 22


![Adolescent Alcohol Exposure Persistently Impacts …pharmrev.aspetjournals.org/.../pharmrev/68/4/1074.full.pdfAA019767, AA11605, AA007573, and AA021040], Neurobiology of Adolescent](https://img.dokumen.tips/doc/110x75/5f0f015d7e708231d4420425/adolescent-alcohol-exposure-persistently-impacts-aa019767-aa11605-aa007573-and.jpg)