Embed Size (px)
Citation preview

EARLY INTERVENTION FOR INFANTS AND TODDLERS WITH DISABILITIES AND THEIR FAMILIES: PARTICIPANTS, SERVICES, AND OUTCOMES
January 2007
Final Report of the National Early Intervention Longitudinal Study (NEILS)
Kathleen Hebbeler Donna Spiker Don Bailey Anita Scarborough Sangeeta Mallik Rune Simeonsson Marnie Singer Lauren Nelson
With the assistance of:
Cecilia Casanueva, Jay Chambers, Irene Lam, Jesse Levin, Robin McWilliam, Kathryn Morrison, Maria Perez, Melissa Raspa, Julia Robinson, Joneen Schuster, Elizabeth Snyder, Craig Zercher
SRI Project 11247
SRI International, 333 Ravenswood Avenue, Menlo Park, CA 94025

*****
The National Early Intervention Longitudinal Study (NEILS) was conducted by SRI International under cooperative agreement (number H329E010001) to SRI International from the Office of Special Education Programs, U.S. Department of Education. NEILS is a collaborative effort of SRI International, the Frank Porter Graham Child Development Institute at the University of North Carolina Chapel Hill, RTI International, and the American Institutes for Research.
NEILS was part of a program of longitudinal studies funded by the U.S. Department of Education and being conducted by SRI International. Other studies in the program included the Special Education Elementary Longitudinal Study (SEELS) and the National Longitudinal Transition Study-2 (NLTS2). For more information about these studies, see http://www.seels.net/ or http://www.nlts2.org/. The NEILS Web site is http://www.sri.com/neils/.
*****

i
CONTENTS ACKNOWLEDGMENTS.............................................................................................................................................. vii
1. INTRODUCTION........................................................................................................................................................... 1-1
Research and Policy Context for Early Intervention Services ........................................................................... 1-1
NEILS Background ......................................................................................................................................................... 1-2
Organization of the Report ......................................................................................................................................... 1-6
2. BEGINNING EARLY INTERVENTION SERVICES............................................................................................... 2-1
Families’ Experiences in Beginning EI ...................................................................................................................... 2-1
Who is Being Served in Early Intervention?........................................................................................................... 2-6
3. THE EARLY INTERVENTION EXPERIENCE.......................................................................................................... 3-1
What are the Services Provided in EI ....................................................................................................................... 3-1
Who Provides EI Services............................................................................................................................................. 3-8
Leaving Early Intervention ........................................................................................................................................... 3-11
Outcomes Experienced by Children at 36 months ............................................................................................ 3-14
Family Outcomes When the Child Was 36 Months Old.................................................................................. 3-28
4. EARLY INTERVENTION PARTICIPANTS GO TO KINDERGARTEN........................................................... 4-1
The Time between Early Intervention and Kindergarten................................................................................... 4-1
The Transition to Kindergarten .................................................................................................................................. 4-2
Child Outcomes at Kindergarten .............................................................................................................................. 4-3
Family Outcomes at Kindergarten Entry................................................................................................................. 4-24
Conclusions about Kindergarten Outcomes.......................................................................................................... 4-28
5. IMPLICATIONS OF NEILS FINDINGS FOR EARLY INTERVENTION......................................................... 5-1
Diversity of Children and Families Receiving EI.................................................................................................... 5-1
The Transitory Nature of Disability and Delay in Young Children ................................................................ 5-2
Communication Skills: A Widespread and Persistent Developmental Problem....................................... 5-5
Social and Emotional Problems: Present yet Invisible........................................................................................ 5-7
Understanding the Impact of Health........................................................................................................................ 5-9
Poverty and Disability .................................................................................................................................................... 5-10
The Nature of EI Services............................................................................................................................................. 5-12
EI as a Program for Families........................................................................................................................................ 5-14
Conclusion ........................................................................................................................................................................ 5-16
APPENDIX A: NEILS Recruitment and Return Rates for Children Receiving Early Intervention
Services .............................................................................................................................................................................. A-1
APPENDIX B: NEILS Reports and Papers ............................................................................................................. B-1

ii
FIGURES
Figure 2-1 Age at IFSP by Reasons for Eligibility........................................................................................................ 2-3 Figure 2-2 Cumulative Percentage of Children for Given Number of Weeks from Referral to IFSP....... 2-4 Figure 2-3 General Health Status of Children in EI Compared with National Estimates .............................. 2-10 Figure 3-1 Percent of Children and Families Receiving EI Services in Each Setting....................................... 3-2 Figure 3-2 Percent of Children and Families Who Received Each EI Service ................................................... 3-2 Figure 3-3 Total Amount of EI Services Scheduled Across All Settings.............................................................. 3-4 Figure 3-4 Family Reports of Services Provided by EI .............................................................................................. 3-5 Figure 3-5 Average Monthly EI Expenditure by Disability-Related Characteristics ......................................... 3-7 Figure 3-6 Variations in Monthly EI Expenditures by Disability-Related Characteristics ............................... 3-7 Figure 3-7 Percent of Children in EI Served by Providers with Different Levels of Degrees (Highest Degree
Obtained)........................................................................................................................................................... 3-11 Figure 3-8 Parent-Reported Health Status of EI Recipients at Entry and 36 Months of Age ...................... 3-16 Figure 3-9 Change in Parent-Reported Health Status of EI Recipients between EI Entry and 36 Months 3-17 Figure 3-10 Changes in Parent-Reported Vision Status for EI Recipients between EI Entry and 36 Months 3-18 Figure 3-11 Changes in Parent-Reported Hearing Status for EI Recipients between EI Entry and 36 Months 3-19 Figure 3-12 Changes in Parent-Reported Use of Arms and Hands for EI Recipients between EI Entry and 36
Months ............................................................................................................................................................... 3-20 Figure 3-13 Changes in Parent-Reported Use of Legs and Feet for EI Recipients between EI Entry and 36 Months................................................................................................................................................ 3-20 Figure 3-14 Average Monthly Expenditure for EI Services by Parent Report of Use of Limbs at 36 Months......................................................................................................................................................... 3-21 Figure 3-15 Changes in Parent Reports of How Well Their Child Made Needs Known for EI Recipients between EI Entry and 36 Months (Children>12 months at EI Entry) ............................................ 3-22 Figure 3-16 Parent Report of How Well Their Child Made Needs Known at 36 Months (Children<12 Months at EI Entry) ......................................................................................................................................................... 3-23 Figure 3-17 Changes in Parent Reports between EI Entry and 36 Months of How Well Others Understand Their Child’s Speech (Children>12 Months at EI Entry) ............................................ 3-24 Figure3-18 Parent Reports of How Well Others Understand Their Child’s Speech Children<12 months Old at EI Entry........................................................................................................................................................... 3-24 Figure 3-19 Parent Reports of Developmental Skills When Their Child was 36 Months of Age ................ 3-27 Figure 3-20 Parents’ Report of Caregiving Knowledge at 36 Months.................................................................. 3-29

iii
Figure 4-1 Need for Special Education and Disability Status at Kindergarten of Former EI Participants. 4-4 Figure 4-2 Receipt of Special Education and Disability Status at Kindergarten of Former EI Participants, By Age at the time of the Individualized Family Service Plan (IFSP) .............................................. 4-5 Figure 4-3 Receipt of Special Education and Disability Status of Former EI Participants at Kindergarten, By Reason for Eligibility ................................................................................................................................. 4-5 Figure 4-4 Primary Disability Classification of Former EI Participants in Kindergarten and of 5 and 6 Year Olds with IEPS in the United States, 2005............................................................................... 4-7 Figure 4-5 Kindergarten Classroom Placements for Former EI Participants (Only for Children Receiving Public Special Education at Kindergarten ............................................................................ 4-8 Figure 4-6 Special Education Services Received in Kindergarten by Former EI Participants (Only for Children Receiving Public Special Education at Kindergarten....................................... 4-8 Figure 4-7 Parents’ Perceptions about the Amount of Special Education Their Children Received in Kindergarten Compared with the Amount of Therapy and Other EI Services Obtained
Throughout EI (Collected at the End of EI .............................................................................................. 4-9 Figure 4-8 Parents’ Perceptions About the Quality of Special Education Their Children Received at Kindergarten Compared with the Quality of EI Therapy and Other EI Services (Collected at the End of EI)........................................................................................................................... 4-19 Figure 4-9 Health Status at Entry to EI, 36 Months, and at Kindergarten of Former EI Participants ........ 4-10 Figure 4-10 Kindergarten Teachers’ Ratings of Sensory and Motor Functioning of Former EI Participants .................................................................................................................................... 4-11 Figure 4-11 Percentage of Former EI Participants Reported by their Kindergarten Teachers to be Normal for their Age, By IEP Status.......................................................................................................... 4-11 Figure 4-12 Kindergarten Teachers’ Ratings of the Communication Skills of Former EI Participants ......... 4-13 Figure 4-13 Percentage of Former EI Participants Reported by their Kindergarten Teachers to have
Communication Skills Normal for their Age, by IEP Status............................................................... 4-13 Figure 4-14 Percentage of Former EI Participants Rated by their Kindergarten Teachers to have Thinking and Reasoning Skills Normal for their Age, by IEP Status .............................................. 4-14 Figure 4-15 Percentage of Former EI Participants Reported by their Kindergarten Teachers to have Average or Above-Average Academic Skills, by IEP Status............................................................... 4-15 Figure 4-16 Percentage of Former EI Participants Rated by their Kindergarten Teachers as Intermediate or Proficient in Language and Literacy Skills, by IEP Status and Compared with the General
Kindergarten Population ............................................................................................................................... 4-16 Figure 4-17 Percentage of Former EI Participants Rated by their Kindergarten Teachers as Intermediate or Proficient in Language and Literacy Skills by IEP Status and Compared with the General
Kindergarten Population ............................................................................................................................... 4-16 Figure 4-18 Percentage of Former EI Participants Reported by their Kindergarten Teachers to have Behavior and Social Skills that were Normal for their Age, by IEP Status .................................... 4-17

iv
Figure 4-19 Percentage of Former EI Participants Reported by their Kindergarten Teachers to Display Specific Positive Behaviors............................................................................................................................ 4-18 Figure 4-20 Percentage of Former EI Participants Reported by their Kindergarten Teachers to Display Specific Negative Behaviors ......................................................................................................................... 4-18 Figure 4-21 Percentage of Former EI Participants Reported by their Kindergarten Teachers to “Sometimes” or Very Often” Display Specific Behaviors, by IEP Status ........................................ 4-19 Figure 4-22 Percentage of Former EI Participants Reported by their Kindergarten Teachers to have “Far Fewer” or “Fewer” Friends than most Children in the Classroom.......................................... 4-20 Figure 4-23 Percentage of Former EI Participants Reported by their Parents to have Difficulties with Social Skills at Kindergarten, by Level of Difficulty and IEP Status.................................................. 4-21 Figure 4-24 Percentage of Former EI Participants Reported by their Parents at Kindergarten to have been Invited to Another Child’s House in the Past Week, by Number of Times and IEP Status............................................................................................................................................................ 4-22 Figure 4-25 Parental Expectations at Kindergarted for How Far their Child Would Go in School .............. 4-23 Figure 4-26 Percentage of Former EI Participants Reported by Their Parents at Kindergarten to have an “Excellent/Very Good” Current and Expected Future Life Situation, by IEP Status ............ 4-24 Figure 4-27 Percentage of Former EI Participants Expected by their Parents at Kindergarten to Graduate from College, by IEP Status...................................................................................................... 4-24 Figure 4-28 Family Responses at 36 Months and at Kindergarten Entry to “I Know How to Work with
Professionals and Advocate for What my Child Needs” .................................................................... 4-26 Figure 4-29 Percentage of Families Strongly Agreeing with Outcome Statements Related to Social Support and Community Participation..................................................................................................... 4-27 Figure 4-30 Percentage of Families who Reported an “Excellent” or “Very Good” Current and Future Life Situation when their Child was in Kindergarten ........................................................................... 4-28
v
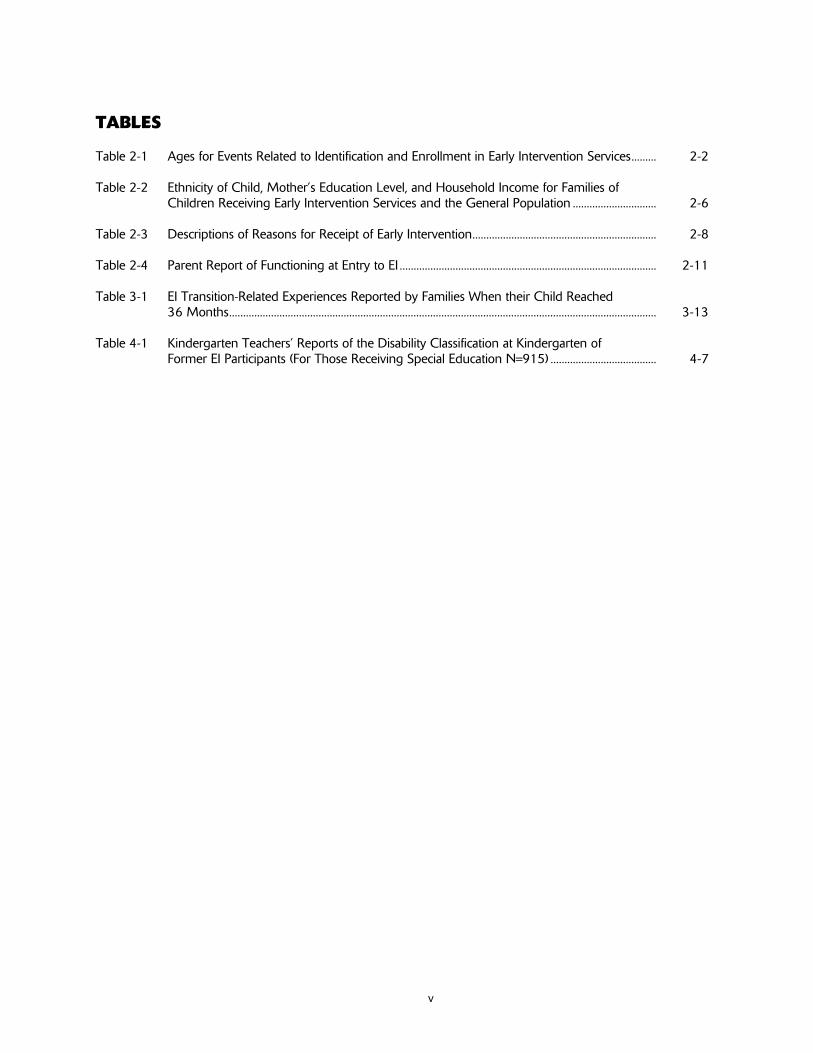
TABLES
Table 2-1 Ages for Events Related to Identification and Enrollment in Early Intervention Services......... 2-2 Table 2-2 Ethnicity of Child, Mother’s Education Level, and Household Income for Families of Children Receiving Early Intervention Services and the General Population .............................. 2-6 Table 2-3 Descriptions of Reasons for Receipt of Early Intervention.................................................................. 2-8 Table 2-4 Parent Report of Functioning at Entry to EI ............................................................................................ 2-11 Table 3-1 EI Transition-Related Experiences Reported by Families When their Child Reached 36 Months......................................................................................................................................................... 3-13 Table 4-1 Kindergarten Teachers’ Reports of the Disability Classification at Kindergarten of Former EI Participants (For Those Receiving Special Education N=915) ...................................... 4-7

vi
EXHIBITS
Exhibit 1 Conceptual Framework for a Longitudinal Study of the Impacts of Early Intervention ........... 1-3

vii
ACKNOWLEDGMENTS
A study as large as NEILS is the work of many people in addition to those whose names appear on the cover. We gratefully acknowledge the many dedicated project staff of the collaborating institutions who have contributed to this study over the past ten years. Doris Perkins of SRI was responsible for production of this final report, and we appreciate her skill in manipulating the text, tables, and graphs. RTI International trained and supervised a talented cadre of interviewers who contacted the families for the interviews. Scott Brown of the Office of Special Education Programs in the U.S. Department of Education has served as the Project Officer for NEILS since its inception and the study has benefited from his wisdom and guidance.
We acknowledge and thank the families of children with special needs who have so graciously agreed to be part of this study and have given their time to be interviewed repeatedly. In addition, we thank the service providers and directors of early intervention programs around the country who recruited the families for the study and found time in their busy schedules to complete NEILS data forms. The study families and the service providers who worked with them were the backbone of NEILS. This study would not be possible without their cooperation and support. Appreciation also is extended to the kindergarten teachers who completed surveys and thus informed us of how the early intervention graduates were doing in school. We thank all those who contributed to make this study possible on behalf of the next generation of infants and toddlers with special needs who will benefit from their contributions.

viii
Project Staff SRI International
Kathleen Hebbeler, Co-Principal Investigator
Donna Spiker, Co-Principal Investigator
Sangeeta Mallik Kathryn Morrison Doris Perkins Marnie Singer Craig Zercher
American Institutes for Research Jay Chambers Irene Lam Jesse Levin Maria Perez
RTI International Susan Kinsey
FPG Child Development Institute
Don Bailey (now at RTI International)Anita Scarborough Lauren Nelson Rune Simeonsson Robin McWilliam (now at Vanderbilt
University) Pre- and Postdoctoral Fellows: Cecilia Casanueva (now at RTI International)Melissa Raspa (now at RTI International)Joneen Schuster Julia Robinson (now at Eastern Kentucky
University) Elizabeth Synder (now at Center for
Child and Family Policy, Duke University)

1-1
1. INTRODUCTION
For more than 20 years, federal law has recognized the importance of providing early intervention (EI) services to infants and toddlers with disabilities and their families. State systems to serve this population have been established and refined since the federal grant program and its accompanying requirements governing EI were created in 1986. Every state provides EI services, although the states differ in regard to a number of dimensions, including the lead agency that administers the program, the constellation and organization of local programs that provide services, and how services are funded. This National Early Intervention Longitudinal Study (NEILS) report presents the key findings from a national longitudinal study that followed children who were identified when younger than 3 years of age as meeting their state’s eligibility criteria for EI and whose families were subsequently provided with those services. NEILS is the first and only national look at important policy issues such as which children and families are being served in EI programs, what services they receive, and what outcomes they experience. This report summarizes some of the key findings from this 10-year study and notes their implications for policy, practice, and additional research.
Research and Policy Context for EI Services
The Program for Infants and Toddlers with Disabilities (Part C of the Individuals with Disabilities Education Act [IDEA]) provides funding to states to operate comprehensive statewide programs of EI services for infants and toddlers (birth through age 2) with developmental delays and disabilities and for their families. Congress established the program in 1986 in recognition of "an urgent and substantial need" to:
Enhance the development of infants and toddlers with disabilities.
Reduce educational costs by minimizing the need for subsequent special education as a result of EI.
Minimize the likelihood of institutionalization, and maximize independent living.
Enhance the capacity of families to meet their children's needs.
The federal law was grounded in a substantial body of research that demonstrated the power and necessity of providing intervention services to children with disabilities and developmental delays at young ages and to their families. Although there was (and still is) much to be learned about what kinds of services work best for differing kinds of children and families, the combined body of existing research

1-2
clearly underscored the need to intervene early to enable children with delays and disabilities to reach their full potential.
To receive federal funding through the Part C program, a state must provide a number of assurances, including the stipulation that EI will be available to every eligible child and his or her family. The state’s governor must designate a lead agency to receive the grant and administer the program, and must appoint an Interagency Coordinating Council, whose members must include parents of young children with disabilities, to advise and assist the lead agency. Annual funding to each state is based on census figures of the number of children, birth through age 2, in the state’s general population. Currently, all states and eligible territories are participating in the program. In fall 2005, 293,816 children, or 2.4% of the population younger than 3, and their families were receiving services through Part C.
NEILS Background
Study Questions
The Office of Special Education Programs of the U.S. Department of Education commissioned SRI International to conduct NEILS to provide much needed information about the Part C program. The study was to address five key questions:
Who are the children and families receiving EI services?
What EI services do participating children and families receive?
What are the costs of the EI services?
What outcomes do participating children and family’s experience?
How do outcomes relate to variations in child and family characteristics and services received?
NEILS began in 1996 with a design phase; data collection began the following year. The conceptual framework developed to guide the NEILS design (Exhibit 1) identified four areas and their interrelationships as central to the study: the characteristics of children and families served; EI; other services that children might receive, such as childcare or preschool; and the short-term (i.e., end of EI) and long-term (i.e., kindergarten) outcomes that children and families experienced. The conceptual framework has guided the design of the instrumentation and the analyses throughout the study. The framework reflects a transactional/ecological perspective, which holds that development in young children with disabilities is influenced by many interrelated factors, including those that are biological (e.g., genetic disorders), social (e.g., family members’ interactions with the child), environmental (e.g., the toys available in the home), and cultural (e.g., the family’s traditions and beliefs about child-rearing). Even though the study was unable to

1-3
measure all of these factors, the study design acknowledged that the receipt of EI services was only one of the many factors that influence how young children grow and develop and how families are able to support that growth. In addition, the study drew on family systems theory, which views the family as a system that is influenced by many factors, including its composition, the resources and supports available, the community in which it lives, and its beliefs and expectations. A critical feature of a transactional model is the assumption that there are reciprocal influences between the child and family. The family exerts significant influence over the child’s development, but the child also influences the family through a need for care, the child’s temperament, etc.

1-4
Community Demographics Geography Resources
Other ServicesChild care Health services Preschool special education
Part C Legislation
Part C State System Lead agency Definition
Part C Local System Coordination Family-centeredness
Part C ServicesType Intensity Duration Setting/Environment Quality Provider
FamilyOutcomes Family capacity to meet needs
Services address needs
Social support Quality of life Satisfaction with services
ChildOutcomes Disabilities Engagement Functional abilities (cognitive, communication, motor) Self-help skills
Change Over Time
Demographics E.g., Age when identified Family resources Household composition
Exhibit 1 CONCEPTUAL FRAMEWORK FOR A LONGITUDINAL STUDY OF THE IMPACTS OF EARLY INTERVENTION

1-5
Sample
The NEILS findings are based on a nationally representative sample of 3,338 children who entered EI for the first time between September 1997 and November 1998. Families were recruited through EI programs located in 93 counties in 20 states. Local program providers explained the study to families at or near the time of the development of each family’s Individualized Family Service Plan (IFSP). All families who met the study criteria (a child who was younger than 31 months of age and an adult in the household who spoke English or Spanish) were invited to participate. If a family had more than one child entering EI, only one child from that family was selected for the study. During the enrollment period, IFSPs were developed for 5,668 families new to EI. Programs invited the 4,653 families who met the study’s eligibility criteria to participate in NEILS, and 3,338 (71%) agreed to do so.
Data Collection
The findings presented in this report are drawn from a number of data sources:
Family interviews: Telephone interviews with the family of children enrolled in the study were conducted within 16 weeks of enrollment, around the time the child turned 36 months, and when the child entered kindergarten. The interviews were approximately 40-minutes in length with “the person best able to answer questions about the child and the child’s program.” Most respondents were the children’s mothers. Families who could not be reached by phone were sent a questionnaire in the mail.
Service Records: Early intervention service providers completed questionnaires concerning the services the child and family had received in the previous 6 months. At the time the family enrolled in the study, the program identified the “most knowledgeable provider” who could supply the service information requested. This person was mailed a questionnaire, called a Service Record, every 6 months for as long as the child was in EI, beginning 6 months after the first IFSP.
Service Provider Surveys: The service provider who was most familiar with the services received by the child and family identified all of the other individuals who had provided services to the child or family during the first 6 months of enrollment in EI. Each of the identified providers was sent an Early Intervention Service Provider Survey, which asked about the number and type of children and families served, along with questions about the provider’s experience, background, and demographics.
Kindergarten Teacher Surveys: Parents provided the name of the child’s school and kindergarten teacher. In the spring of the child's kindergarten year, the kindergarten teacher was sent a two-part questionnaire that asked about the child's performance in kindergarten. The first part asked about the child's educational progress, social skills, literacy and mathematics knowledge, parent involvement, the child's transition into kindergarten, and whether the child received special education services as a preschooler. The second section was completed for children with an Individualized Education Program (IEP) or 504 plan and asked about the child's disability classification and the nature of the services being provided.

1-6
Copies of these data collection tools can be found at www.sri.com/neils. Appendix A indicates return rates for each of these data collections.
Expenditure Study Data Sources: NEILS included an Expenditure Study, which was conducted by the American Institutes for Research. The Expenditure Study used several data collection tools in addition to data from the Family Interview, the Service Record, and the Service Provider Survey. More information about that study can be found at http://www.sri.com/neils/expend.html.
Analysis
All data presented in this report are weighted; that is, numerical weights have been applied to the raw data. The procedures for calculating the weights are described in detail in Javitz et al. (2002). Because of the nature of the sample selection procedures employed and the weights applied to the data, all data in this report represent national estimates. The percentages and means are estimates of the actual percentages and means that would have been obtained if all children entering EI in the country had been included in the study1.
Organization of the Report
The report is organized to communicate key facets of the EI experience and outcomes chronologically as the child and family experienced them. Chapter 2, which focuses on beginning EI, presents families’ experiences in finding out about and entering services, and their perceptions of their experiences with the system and providers. It also describes the demographics, disabilities and developmental delays, and other characteristics of children who enter EI. Chapter 3 describes the early intervention experience, including the services provided and who provided them. This chapter also describes the transition out of EI, including preparation for the child’s next program. Finally, this chapter presents outcomes for children and families when the children turn 36 months of age. Chapter 4 focuses on the kindergarten experience, including the transition to kindergarten, services provided, functioning, and academic achievement. Family outcomes at kindergarten are described as well. Chapter 5 addresses several cross-cutting themes that emerged over the course of the study and contributed to the overall understanding of what early intervention is and what it means to children and families. The report closes with a summary and conclusions.
1 To examine the precision of the estimate, researchers use a statistic called “standard error.” The various NEILS reports
from which these finding are drawn contain the standard errors associated with the percentages or the means in this report. In this report, standard errors generally are not presented because they reduce the readability of the information.

2-1
2. BEGINNING EARLY INTERVENTION SERVICES
The journey to early intervention (EI) can begin in different ways for different families. Some learn that their child has a disability at or even before birth, and for these families the connection to EI may come through a hospital, with entry into services occurring in early infancy. For other children, as developmental delays or disabilities emerge as the child grows. Concerns about the child’s development may be raised initially by a parent, a pediatrician, a childcare provider, or a family friend. Children with delays enter EI services following some kind of diagnostic testing or developmental evaluation. Creating multiple ways for families to find about EI is critical to ensuring all the children who need services obtain those services and that they obtain them at the earliest age possible. This chapter examines the process of beginning EI: what the process is like for families and who receive services. Overall, the evidence from the National Early Intervention Longitudinal Study (NEILS) suggests that the process of finding out about and beginning EI services is a positive one for the majority of families, although room for improvement exists for minority, low-income, and less educated families. The chapter also addresses who is served in EI programs: as discussed below, no matter which feature is used as a descriptor (e.g., health, family income, functioning), the conclusion is the same: EI programs are serving a very wide variety of children. In fact, the diversity is so great that describing a “typical” child in EI is impossible.
Families’ Experiences in Beginning EI
The age at which children begin EI is a concern because research has demonstrated the importance of providing these services early. Across children who entered EI at younger than 31 months,1 the average age at which someone first expressed concerns about the child’s development was 7.4 months. As shown in Table 2-1, those concerns were followed by diagnosis at an average age of 8.8 months. Parents reported first looking for EI when the child was 11.9 months of age, followed by a referral at 14.0 months and completion of an Individualized Family Service Plan (IFSP), which serves as the formal entry vehicle to EI, at 15.7 months.2
The averages mask the variability in the population, however; some children entered EI much earlier and some did so much later than the averages. One of the most powerful correlates of when a child begins EI is the nature of the child’s presenting problem. Federal law stipulates the categories of eligibility for receipt of EI services. A child is to be provided EI services because s/he “(i) is experiencing
1 The NEILS sample was restricted to children who were younger than 31 months on EI entry.
2 The average age at referral for children, birth to 36 months, was 15.5 months, and the average age at IFSP
completion was 17.1 months.

2-2
developmental delays in one or more of the areas of cognitive development, physical development, communication development, social or emotional development, and adaptive development; or (ii) has a diagnosed physical or mental condition which has a high probability of resulting in developmental delay.” The federal law also allows states to serve children considered to be “at risk of experiencing a substantial developmental delay if early intervention services were not provided to the individual” (20 U.S.C. §1432, as amended by IDEA, 2004).
Table 2-1
AGES FOR EVENTS RELATED TO IDENTIFICATION AND ENROLLMENT IN EI SERVICES
Total (Age in Months) Eligibility Category (Mean Age in Months)
Event Mean Median
Develop-mental Delay
Diagnosed Condition
Risk Condition
First concern about health or development
7.4 4 11.1 2.3 2.1
First diagnosis or identification
8.8 6 12.9 35. 2.5
First looked for EI 11.9 11 16.0 5.7 5.2
Referral received by EI program
14.0 14 18.2 7.8 6.1
Age at which IFSP was developed
15.7 16 20.0 9.4 8.0
Difference between first concerns and IFSP
8.3 12 8.9 7.1 5.9
N 3,056 to 3,235
1,826 to 1,923
638 to 675
436 to 463
Note: Based on children who entered EI before 31 months of age.
Because local program staff were found to use the three eligibility categories inconsistently, the research team developed and applied a coding scheme to the descriptors (e.g., motor delay, cerebral palsy) that providers supplied to describe the reason the child was receiving EI services. Applying this coding scheme showed that most children were eligible for EI because of a developmental delay (64%); fewer had a diagnosed condition (20%) or were being served because they were at risk (16%).3
As also shown in Table 2-1, both the age at which these events occurred and the timing between them differed for children eligible for EI for different reasons. Children with developmental delays entered EI at later ages, with an average time between first concern and IFSP development of 8.9 months, compared with only 5.9 months for children with risk conditions. Figure 2-1 shows the percentage of
3 Additional information about the reasons for EI receipt can be found in Hebbeler et al. (2001).

2-3
0
5
10
15
20
25
30
3 6 9 12 15 18 21 24 27 30 33 36Age in Months (3-Month Increments)
Developm ental delay Diagnosed condition At risk
children ages with differing eligibility for EI who began services at each age interval. Although some overlap occurs, the figure indicates that children with diagnosed and risk conditions tended to begin EI services in the first year of life, whereas children with developmental delays began closer to age 2. Indeed, three out of four children entering EI after 24 months had some kind of speech or communication problem.
Figure 2-1 PERCENTAGE OF CHILDREN IN EACH AGE GROUP AT IFSP
BY REASON FOR ELIGIBILITY
The age at entry by reason for eligibility distribution has implications for examining the impact of EI services, as well as important policy implications. The nature of the child’s problem, the child’s age at entry, and thus the number of months of EI service are intertwined, making it challenging to reach conclusions about the relationship between the months of service a child receives and long-term outcomes. An important policy question is, “Can children be identified earlier and begin services at younger ages?” The process of identifying children with diagnosed conditions is different from that for identifying children with developmental delays. The data on age at entry suggest that questions about how to identify children at earlier ages may need to be addressed separately for each of these groups, possibly with different kinds of programmatic changes to encourage earlier identification. For example, children with developmental delays related to language and communication are unlikely to be identified before 12 or even 18 months of age. Someone first has to notice that the child’s development is atypical; the parents then have to share this concern and then take steps to connect the child with an EI process for an evaluation. The entry process thus depends on someone’s noticing a problem, possibly a subtle one, with the child’s development. This process contrasts
Perc
ent

2-4
sharply with the entry process and with the professionals involved in dealing with a child with, for example, spina bifada, which is diagnosed at birth. The entry differences for children with diagnosed conditions and children with delays, as clearly indicated in Figure 2-1, suggest the need to monitor and refine child find procedures differently for children who are eligible for EI for different reasons.
In the sequence of events leading to receipt of the EI services, EI programs exert the most control over the time segment between a child’s referral and IFSP development. This time span is not completely controlled by the program, however, because a variety of non program factors can delay IFPS development. For example, parents may hesitate about whether or not to proceed with EI, or dealing with their child’s health problem may be the more pressing issue. IDEA mandates that the meeting to develop the IFSP be held within 45 days of referral to EI. About 60% of the IFSPs were written, in fact, within 45 days of referral (Figure 2-2). Seventy percent were written within 8 weeks of referral, 79% within 10 weeks, and 90% within 14 weeks. The study has no additional information about why the time between the referral and IFSP lasted more than 45 days for so many families.
Figure 2-2 CUMULATIVE PERCENT OF CHILDREN
FOR GIVEN NUMBER OF WEEKS FROM EI REFERRAL TO IFSP
Although the entry process was slow for some families, the EI system that has been built around the country was generally viewed as accessible by families. Most families reported little difficulty in learning about or beginning EI services, with 75% reporting it took little or no effort to find out about the services and 77% saying the same about getting services started. The system was not equally accessible to all families, however. Minority or low-income families were more likely to report that a lot of effort was required to access the services. Medical professions were viewed as fairly helpful; nearly two-thirds (64%) of the families found their doctor or other
0102030405060708090
100
1 3 5 7 9 11 13 15 17 19 21 23 25
Number of Weeks
Cumulative Percent of Children
Cum
ulat
ive
Perc
ent o
f Chi
ldre
n

2-5
medical professionals helpful at the time the family expressed concerns about the child.
The IFSP is one of the key features (as well as a required component) of Part C services. The intent of the law is that parents and professionals work as partners in developing the plan. The findings from this study suggest both positive and negative aspects of IFSP implementation. Families were asked whether they were “aware of a written plan that describes goals for (name of child) and the services (he/she) should receive? It might have been called an IFSP, a Child and Family Service Plan, or something like that.” Although all interviews were conducted within 4 months after an IFSP had been completed, a substantial proportion of families (18%) reported that they were not aware of such a plan. Minority families and families in which mothers had lower education levels were less likely to report being aware of the development of the IFSP. For example, 37% of Hispanic families and 31% of families in which mothers did not finish high school were unaware of the IFSP. Programs need to do a better job of informing these families about the process of developing a plan.
For families who were aware of the IFSP, the process of decision-making embodied the parent-professional partnership the law intended to a certain extent. Most families reported that they and professionals jointly made decisions about the outcomes for the child and family and the kind of EI services the child needed (81% for outcomes, 64% for kind of EI services). Joint decision-making about the amount of services differed, with 49% of the families reporting those decisions were made mostly by professionals. Because the amount of services drives cost, it is not surprising that programs gave families less input into this decision. Most families (77%) were satisfied with their level of involvement in the decision-making process, although more than one in five (22%) wanted more involvement, with only 1% wanting less. Again, perceptions of the process were related to socioeconomic status. Only 10% of those with a bachelor’s degree wanted more involvement, but 34% of those who did not finish high school would have liked to have been more involved. The comparable figures for white families were 13% compared with 37% for African American and 29% for Hispanic and Asian or Pacific Islander families.
Families, regardless of backgrounds, were overwhelmingly positive (99%) about their first encounters with the professionals who provided EI services to their children and worked with their families. They believed that EI professionals respected the values and cultural background of their family (99%) and make them feel hopeful about their child’s future (96%). Most rated communications with the professionals they worked with as good (37%) or excellent (53%). Only 7% thought that the professionals ignored their opinions.

2-6
Who is Being Served in Early Intervention?
As we noted above, the children being served in EI differ with regard to the reason for eligibility for services and the age at which they enter those services. They also differ in many other ways such as demographics, their functioning (even for children who are the same age), and their overall health status. The diversity of the population in EI has implications for who is (and possibly is not) being served in the program. Families with different life circumstances may well need different kinds of service models, as may children with extensive medical involvement. Some children arrive at EI with several factors—in addition to a developmental delay or disability—that put them at extremely high risk for poor developmental outcomes. The findings about who is served in EI demonstrate that, given the cross section of the population being reached, a variety of program options may be needed to adequately address the diversity of needs.
The demographics of the EI population match the U.S. population with regard to some characteristics but differ with respect to others. Boys outnumber girls in the school-age population receiving special education services, and this difference exists in the EI population as well: 61% of children entering EI are male. The most important difference between the EI and general populations may be the overrepresentation of low-income children among EI recipients. Of the children entering EI, 27% were from families with household incomes of less than $15,000 per year, which compares with 21% for the general population of 3-year olds (Table 2-2). Poverty is well-established as one of the strongest predictors of poor developmental outcomes in children, and its co-occurrence with a delay or disability before age 3 suggests these children are especially in need of effective interventions.
Children entering EI also are less likely to be white and more likely to be African-American compared with the general population of 3-year olds, and they are more likely to have mothers who have not gone to college. It is difficult to determine who is over- or under-represented in the EI population because we would not expect families served in EI to be a cross-section. Demographic factors such as low income or minority status are associated with more limited access to medical care and adequate nutrition, which in turn are associated with more compromised birth outcomes and poorer health and development. It is reasonable that children from families with demographic risk factors would be overrepresented among children in EI compared with the general population, but we have no way of knowing to what extent. Because the NEILS study was limited to EI entrants, no data were obtained on the children who should have been in EI but were not.

2-7
Table 2-2 CHILD’S ETHNICITY, MOTHER’S EDUCATION LEVEL, AND HOUSEHOLD
INCOME FOR FAMILIES OF CHILDREN RECEIVING EI SERVICES AND FOR THE GENERAL POPULATION
Characteristic EI
Population, Percent General Population,
Percenta
Child’s race/ethnicity
White 53 61**
African-American 21 14**
Hispanic 16 18
Asian or Pacific Islander 4 2
American Indianb or Alaska Native 1 1
Mixed race or other 5 4
Mother’s education level
Less than high school degree 16 17
GED or high school degree 32 27**
Some college 28 28
Bachelor’s degree or higher 24 27
Household income
$15,000 or less 27 21**
$15,001-$25,000 16 16
$25,001-$50,000 29 31
$50,001-$75,000 16 16
Over $75,000 13 16*
a General population data from National Household Education Survey (1999) for children up to 3 years of age. b In all subsequent analyses, American Indians are included in the mixed race or other category. * = p < .05, ** = p < .01
The family structure of children entering EI resembles that of the general population in some ways but also differs in ways that are potentially important for delivering quality EI services appropriate to each family’s needs. Compared with the general population of children younger than 3, children entering EI were equally likely to live in a household with one adult (15%), less likely to live in a household with two adults (68% vs. 72%), and therefore more likely to live in a household with 3 or more adults. Mothers of children in EI and the general population were equally likely to be living with a partner or spouse (74%). Compared with the general population, children entering EI were less likely to be living with both biological parents (62% vs. 73%). Most lived with their biological mother (88%), as opposed to 96% for the general population. Fewer lived with their biological fathers (63%), a percentage that was also less than that for the general population (73%). Children entering EI were far more likely than the general population to be in foster care; 7% were in foster care, a rate about 10 times that for the general population of children under 18 in foster care in 1998. Foster care status for some

2-8
children may be directly related to their delay or disability due to factors such as prenatal maternal drug use or to the care demands for a child with a disability being too overwhelming for some parents. The high number of children in foster care in EI highlights the importance of coordination between the child welfare system and the EI system. Families entering EI resembled the general population with regard to the number of children in the household. One in five of the families beginning EI had another child with special needs, suggesting that parents face substantial care demands in such households. No comparable data exist for the general population.
Research has repeatedly demonstrated that some demographic factors pose a risk for healthy development in young children. Co-occurrence of such factors can be especially deleterious; for example, mothers with limited education often live in poverty. The research on risk factors suggests that the potential for negative developmental outcomes increases substantially when a child has multiple risk factors. To examine the occurrence of multiple demographic risk factors, among children entering early intervention, the team constructed a demographic risk index. The index allotted one point to a child for each of 10 risk factors such as being in foster care, living in a household with one adult, or having a primary caregiver with less than a high school education.4 One-fourth of the children in EI had no risk factors, but more than half had two or more. One in five had four or more.
Describing the nature of the delay or disability of the child is extremely important to understanding who is served in EI. EI program staff provided the research team with 305 terms used to describe why a child was receiving EI. The team coded each term using a multilevel, multidimensional classification scheme it had developed.5 From review of these frequencies, the team developed a summary set of categories to describe the disability-related characteristics of children at entry to EI (Table 2-3). The most frequently reported reason for receipt of EI was a speech/communication impairment or delay, with providers indicating that 41% of the children were eligible for EI for problems in this area. Because it is unlikely that providers wrote down all possible descriptors for every child, the finding is best interpreted as at least 41% of the children entering EI had speech or communication problems. Other frequently reported reasons for the receipt of EI included prenatal/perinatal problems (19%), motor delays (17%), and an overall delay in development (12%). The many categories needed to describe the presenting problems of children in EI and the relatively small percentages of children in most of the categories indicate the diversity of the population being served in EI.
4 See Hebbeler, Spiker, Mallik, Scarborough, & Simeonsson (2004) for more information on the
construction of the risk index. 5 See Form A for more information about the coding scheme; available in Javitz, Spiker, Hebbeler & Wagner
(2002).

2-9
Table 2-3 DESCRIPTIONS OF REASONS FOR RECEIPT OF EI
Percentage Standard Error
Delayed development (global) 12.2 1.2 Physical growth abnormality
a 1.6 .4
Sensory systems impairment 3.3 .4 Vision impairment
a 1.1 .1
Hearing impairment a 1.9 .4
Motor impairment or delay 17.5 1.8 Physiological or neurological system impairment 2.2 .4 Intellectual/cognitive impairment or delay 7.2 1.4 Social/behavioral impairment or delay 3.7 .6 Speech/communication impairment or delay 41.1 3.8 Delay in self-help skills 2.6 .7 Congenital disorders 8.9 .9
Down syndrome a 4.3 .5
Prenatal/perinatal abnormalities 18.9 2.6 Low birth weight
a 11.0 1.6
Prenatal exposures a 2.1 .6
Illness or chronic disease 1.8 .3 Musculoskeletal disorders 2.0 .2 Central nervous system disorders 6.5 .6
Cerebral palsy a 2.2 .3
Receiving medical treatment 1.4 .4 Social environment risk factors 3.9 1.1
Note: N = 5,293 a Indented categories are included in the superordinate category above them.
The frequency of prenatal and perinatal problems in a program serving infants with special needs is not surprising. The proportion of children in EI with compromised birth histories was substantially higher than that of the general population. Approximately one-third of children (32%) in EI were born at a low birth weight (LBW, less than 2500 grams), four times the percentage of LBW births in the general population (7%) (Ventura, Martin, Curtin, & Mathews, 1999). Furthermore, 17% had birth weights considered to be very LBW (less than 1000 grams), an estimate that is 12 times the rate in the general population (1.4%) (Ventura et al., 1999). Nearly one-third of children (31%) in EI were born prematurely (less than 37 weeks gestational age), more than twice the prematurity rate in the general population (13%) (Ventura et al., 1999). Nearly 4 out of 10 (38%) of children in EI spent time in a neonatal intensive care unit after birth.
It is somewhat surprising that even though the majority of children with birth weights under 1,500 grams entered EI before age 12 months, only 8% of these very LBW (VLBW) children entered at 24 months or older, and another 22% entered between 12 and 24 months. Because LBW children are easy to identify

2-10
and at high risk for poor development, the late entry into EI for some of these children is a cause for concern. Although many children entering EI were LBW, the national LBW data suggest that EI is serving only a fraction of the total population of the LBW babies around the country. According to the Centers for Disease Control, in 2002 314,077 LBW births occurred (7.8% of all births), of which 58,544 were VLBW (1.46% of all births). Because only 39,000 children younger than age 1 and representing all disabilities were being served in EI in December 2002, it is clear that even many VLBW babies are not entering EI programs. One possible explanation is that only some states consider LBW as an established condition warranting EI. States also vary in the birth weight cutoff used for eligibility, with some states’ eligibility criteria admitting only the tiniest babies.
More children entering EI were in fair or poor overall health compared with the general population of children younger than 5. Sixteen percent of parents of children entering EI rated their child’s health as fair or poor compared with only 2.3% of the general population (Figure 2-3). For children in EI, poor health was tied both to income and to minority status, with 23% of the families making less than $15,000 per year reporting their child was in fair or poor health compared with 10% for those making more than $75,000. One in four African-American EI entrants were reported to be in fair or poor health, as were 19% of the Hispanic children compared with only 12% of white children. The relatively high proportion of children experiencing health problems has implications for delivering EI services. These families are likely to experience an especially acute need for coordinated services, given their involvement with both the EI and medical systems. As information presented in Chapter 5 indicates, research on program models addressing how to effectively provide EI services to children in less than optimal health is needed as well.
Figure 2-3 GENERAL HEALTH STATUS OF CHILDREN IN EI
COMPARED WITH NATIONAL ESTIMATES
40.3
12
2
23
14
25 27
36
57
0
10
20
30
40
50
60
Children in EI General Population
Poor Fair Good Very good Excellent

2-11
Parent reports of child functioning indicated large differences in the population of children entering EI with regard to their developmental and functional needs. The population of EI entrants included some children with hearing problems, with 9% diagnosed by a professional (Table 2-4). Some children had vision problems, with 8% professionally diagnosed. Some children were reported to have a little or a lot of trouble using arms and hands (24%) or some trouble using legs and feet (27%). By far the most common problem area was difficulty in making needs known, with 66% of children reported to have a little or a lot of trouble in doing so and another 4% reported not to communicate at all. (This question was not asked about children who were younger than 12 months at the time of the interview.)
Table 2-4
PARENT REPORTS OF FUNCTIONING AT ENTRY TO EI Percent Hearing
May or does have a hearing problem 15 Hearing problem diagnosed by a professional 9
Vision
May or does have a hearing problem 13
Hearing problem diagnosed by a professional 8
Use of arms and hands
A little trouble 18
A lot of trouble 6
Use of legs and feet
A little trouble 19
A lot of trouble 8
How well child makes needs known
A little trouble 41
A lot of trouble 25
Does not communicate
4
Information about the developmental skills of the children entering EI was obtained by asking parents a series of items commonly found on developmental assessment such as “Holds cup to drink.” Parents were presented with the skill and asked if the child, “Does it well,” “Does it, but not well,” or “Doesn’t do it at all.” Using normative data, each skill was assigned an age at which approximately 90% of all children would be expected to have achieved the skill. The percentages of children who could perform “well” all of the skills at their age level were 22% for motor, 17% for communication, 19% for independence, and 26% for cognition. Across the four developmental areas, 18% of the EI entrants were reported to perform all of the skills well in all four areas at their age level. Half could not perform all of the skills well in any of the four areas.
Together these data underscore the substantial diversity of the children and families who receive EI services. What they have in common is that all children have been found eligible for EI service according to their state’s eligibility criteria. Their

2-12
differences span gender, race, family socioeconomic status, family structure, birth history, health status and vision, hearing, motor, and communication skills. Some children have very serious health and developmental needs; others are functioning developmentally as expected for their age peers. Some have families with adequate resources and others do not. Some of these children face multiple environmental risk factors in addition to limited family income. These differences could be important for the type of service needed and how it should be provided. They also could have implications for the kinds of developmental outcomes the children are likely to experience at the end of EI and into the future. The next two chapters present what EI provided for these children and how they fared in the short and longer terms.

3-1
3. THE EARLY INTERVENTION EXPERIENCE
Early intervention (EI) encompasses a variety of supports and services provided to infants and toddlers with special needs and to their families. The Individuals with Disabilities Education Act (IDEA) specifies the types of service that constitute early intervention, but it also gives states considerable latitude in how they design their service delivery system. The act does indicate that the set of services that each family receives is to be individually designed to meet the unique needs of the child and family. This chapter describes what the National Early Intervention Longitudinal Study (NEILS) has learned about the provision of EI. It describes the services being provided: what they consist of, where they are provided, who provides them and for how long, and how much they cost, among other things. We also look at children’s transition out of EI service either before or at 36 months of age. Finally, we present what we learned about outcomes at the end of EI and describe how children and families fare when children in EI turn 3.
What Are the Services Provided in EI?
EI services can be described with regard to a number of different characteristics such as setting, type, frequency, duration, or group size. The many characteristics produce a large number of possible combinations, making any simple description of EI challenging. Figure 3-1 shows the setting in which children and families received services during their first 6 months in EI.1 Home was the most frequent service setting, with 76% of the families receiving services in their home or the home of a child care provider; clinics and center-based EI programs were the next most frequent service settings.2 Four out of ten families (41%) received EI services in more than one setting; home plus clinic was the most common combination (13% of families), followed by home and center (10%). Four percent of families received service in their home, a clinic, and a center.
Twenty-three services were identified, with each provided to 2% or more of the families in EI. Different services were provided to different proportions of families; 6 services were provided to 37% or more families, with the others provided to far fewer families. Figure 3-2 shows the most frequently received services. Service coordination is required for all families, even though providers indicated that only 78% received it. The study has no additional information about this discrepancy. One explanation is that families may have declined the service. Another is that
1 Data for the first 6 months of EI are used because this is the only period over which all children in the
study were receiving services. By the next 6-month segment, some children had already exited EI. 2 These data reflect services provided in 1997 through 1999. Over the last several years, pressure has been
exerted on the states to serve more children in their homes. Data that the states submitted to the Office of Special Education for 2004 indicate that the home was the primary service setting for 83% of families receiving EI.

3-2
76
28
28
8
5
0 10 20 30 40 50 60 70 80 90
Home
Center-based EIprogram
Clinic or office
Family/child care,regular preschool
Another setting
Percent
78
52
43
38
37
37
0 10 20 30 40 50 60 70 80 90
Service coordination
Speech/language therapy
Special instruction for the child
Occupational therapy
Developmental monitoring
Physical therapy
Percent
providers, when reviewing the list of possible services, may have neglected to indicate the service was offered because they were looking only for services unique to a particular family.
Figure 3-1 PERCENT OF CHILDREN AND FAMILIES RECEIVING EI SERVICES
IN EACH SETTING
Note: Data do not add to 100% because children could receive EI services in more than one setting
Figure 3-2 PERCENT OF CHILDREN AND FAMILIES WHO RECEIVED EACH
EI SERVICE
Note: Only services received by 37% or more families are shown

3-3
The most frequently provided services, in addition to service coordination, were speech/language therapy, special instruction, occupational therapy, developmental monitoring, and physical therapy. Given that no other service was provided to more than 19% of families, it would be reasonable to describe EI as consisting primarily of these six frequently provided services offered in various combinations. Most families received 2 (18%), 3 (19%), or 4 services (17%), although 1 in 4 (26%) of families received 6 or more services during their first 6 months in EI.
The median amount of total service scheduled for the first 6 months of EI was 1.5 hours per week with a mean of 2.8 hours.3 Most (63%) of the families in EI were scheduled to receive 2 hours a week of service or less, with 13% scheduled for less than 30 minutes a week. Only 16% were scheduled to receive more than 4 hours a week (Figure 3-3). This median amount of service varied over settings, with 1.8 hours scheduled in centers, 1 hour scheduled in home or child care, and 0.6 hour scheduled in clinics. For various reasons, families did not receive all the services they were scheduled to receive. Estimates by providers indicated that families had missed an average of 23% of services in the previous 6 months. For services provided in the home, 23% of families were estimated to have missed 26% or more of those services. The comparable figures for centers and clinics were 23% and 13%, respectively. Services were missed for reasons related to the child (58%) (e.g., the child was ill), the family (46%) (e.g., the family missed an appointment), and the provider (27%) (e.g., the provider was ill).
Combining the data on services scheduled with estimates of services missed suggests that most families received a relatively small amount of direct service per week over the first 6 months of EI. This estimate refers only to face-to-face service time and excludes time providers spent in preparation, in transit, on the phone with the family, or on the families’ behalf. Providers may have expended far more hours for the family than the 1 or 2 hours of service per week they spent with the family. Nevertheless, the relatively small amount of direct service time suggests that interactions would need to be highly effective and “potent” to bring about changes in outcomes for the child.
In combination with the data on the amount of service, information on the focus of the service is disturbing. Although providers reported that home-based services focused on both the child and adults for 55% of families, for 44% of families the services focused only on the child. This finding suggests the use of a more traditional medical or therapy model for this 44% that is inconsistent with recommended EI practice. Because the parent or caregiver is with the child far more than the interventionist and therefore has far more impact on the child’s development, the recommended practice is to assist the parent learn how to support the child’s development all day every day. There is little reason to believe
3 Times for all services were converted to minutes per week even if the service was provided monthly or
bimonthly.

3-4
Perc
ent
13
20
30
14
7
43
9
0
10
20
30
up to 1/2 1/2 to 1 1 to 2 2 to 3 3 to 4 4 to 5 5 to 6 6 or more
Hours per Week
that an hour of child-based EI once a week makes a difference, but that appears to be the extent of service that many children were receiving.
Figure 3-3 TOTAL AMOUNT OF EI SERVICES SCHEDULED ACROSS ALL SETTINGS
As a program for children and families, some EI services are intended to support the family in caring for their child. These services can be quite varied in scope, including referrals to other programs, provision of information about a topic of relevance to the family, or assistance with family problems. Families were asked two question about a variety of possible services that EI might have provided them: “Were they provided with the service?” and if not, “Did they need this service?” Families were indeed provided many kinds of assistance through EI. The most common was help in learning how to play with and teach their child, understanding their legal rights and protections, understanding their child’s special needs, and including the child in family routines (Figure 3-4). Because all families are supposed to be provided with information about their legal rights and protections, it is somewhat disturbing that only 72% reported that they received that information from EI providers. In general, families reported they did not need the assistance that was not provided, suggesting that EI programs are indeed targeting the help they provide to the needs and desires of the families they work with. The three kinds of help that families did not receive but were most likely to indicate they needed were information about other agencies and services that might help the child, information about recreational activities for the child, and help in finding child care. In addition, several services were not needed by the majority

3-5
74
72
71
62
42
41
39
36
28
20
19
18
16
14
10
5
7
6
3
16
9
9
15
7
7
11
7
14
9
8
21
21
23
35
42
50
52
49
65
73
70
75
70
77
82
Learn how to play w ith, talk w ith, or teach your child
Understand your legal rights and protections
Understand your child's development or special needs
Include your child in your regular family routines
Find out about other agencies and services that might help your child
Find or talk to other families w ho have children w ith special needs
Find and/or pay for special equipment, toys, or therapy
Find information about recreational activities for your child
Get transportation for your child
Find solutions to other problems your family might have
Find and/or pay for respite care
Find a counselor, minister, or other helpers
Find child care for your child
Find and/or pay for medical or dental services
Meet basic household needs, such as food, clothing, or shelter
Percent
Yes No, Needed No, Didn't need
0 20 40 60 80 100
Figure 3-4 FAMILY REPORTS OF SERVICES PROVIDED BY EI
Percent

3-6
of families; among the minority who did need them, however, only a relatively small proportion received that help. For example, only 30% of families reported they needed or received help related to childcare, but only 53% (16% out of 30%) of that group received help in this area. Similarly, for help in meeting basic needs, only 18% received or needed help, but only 55% of that group received it.
NEILS also collected data about expenditures for EI services. The average total expenditure per child for the entire length of time the child and family received EI services was $15,740. This figure is expressed in present value terms.4 Given that the average child received EI services for 17.2 months,5 the average monthly expenditure was approximately $916.
Not surprisingly, expenditures varied for different types of children receiving EI. Using information provided on the Enrollment Form and in the Family Interview, we categorized children into one of four disability-related categories. These categories and the percentage of children in each were as follows: risk condition only (14%), communication only (17%), developmental delay with no diagnosed condition (31%), and diagnosed condition (38%). Figure 3-5 shows the average monthly expenditure for each of the four categories. The average monthly expenditure ranged from $549 for children with a risk condition to $1,103 for those with a diagnosed condition, suggesting that children with a risk condition received services that were about half as costly as the services received by those with diagnosed conditions. This would be expected in a program where services are individualized, because children with diagnosed conditions presumably require more intensive EI services than those with risk conditions.
Striking variations in expenditures were found within each of the four disability-related categories as well as among them. Figure 3-6 illustrates the considerable variation in average monthly expenditure in each of the four categories; the variation was less for children with risk conditions and communication problems only than for children with developmental delays or diagnosed conditions. For instance, the average monthly expenditure for one-fourth of children with risk conditions was less than $213. For the one-fourth of the at-risk children with the highest expenditure, it was more than $689 per month. For the bottom fourth of the children with developmental delays (i.e., those on whom the least was spent), the average monthly spending was less than $282, not markedly different from the figure for children with risk conditions. At the other end of the cost spectrum, however, the top one-fourth of the children with developmental delays had an average monthly expenditure of $1,128 or more. The relatively high expenditure for some children in each of the four groupings is reflected in the difference between the average and the median expenditure. For each group, the average is
4 All dollar figures are discounted to the period over which the sample of children was selected; that is,
September 1997 through November 1998. 5 This average duration is for children who began EI at younger than 31 months. The NEILS sample
excluded children who enrolled in EI for the first time at 31 months or older.

3-7
$213$278 $282
$402$508
$588 $742
$689$764
$549$642
$948 $1,103
$459
$1,128
$1,286
$0
$200
$400
$600
$800
$1,000
$1,200
$1,400
$1,600
At Risk Speech-Only Developmental Delay
DiagnosedCondition
Disability-Related Characteristic
25th %ile 50th %ile 75th %ile Average
Ave
rage
Mon
thly
Exp
endi
ture
A
vera
ge M
onth
ly E
xpen
ditu
re
higher than the median; this is especially true for children with developmental delays and children with diagnosed conditions. For example, although the average monthly expenditure for children with diagnosed conditions was $1,103, the median monthly expenditure was only $742. The difference between the average and the median in each of the four groups reflects the presence of children in each of the categories who were receiving high-cost services. The expenditures for those children drove up the averages. The costs for most children in each of the categories were less than the average.
Figure 3-5 AVERAGE MONTHLY EI EXPENDITURE BY DISABILITY-RELATED
CHARACTERISTICS
Figure 3-6 VARIATIONS IN MONTHLY EI EXPENDITURE BY DISABILITY-RELATED
CHARACTERISTICS
$549$642
$948
$1,103
$916
$0
$200
$400
$600
$800
$1,000
$1,200
Risk Condition CommunicationOnly
DevelopmentalDelay
DiagnosedCondition
Overall
Disability-Related Characteristic

3-8
NEILS has found that children and families vary in the services they receive through EI but that most receive one or more of the “big five” services: service coordination; speech/language, physical, or occupational therapy; and special education/child development. The services tend to be provided in the home and focus on both the child and the adult, although nearly half are reported to focus on the child alone, which is not recommended practice. Families vary in how much service they are scheduled to receive, but in general not much time per week is spent on service. The limited amount of scheduled service per week, combined with the finding that families miss about one-quarter of the services they are scheduled to receive, underscores the message that many families in EI are spending a very limited amount of face-to-face time with professionals. For these services to have the intended effects on the child’s development, it is imperative that the limited amount of contact time be spent with providers who engage in highly effective evidenced-based practices. The NEILS data provide almost no information about what providers are doing with families, and this is an area in need of much additional research.
Who Provides EI Services?
NEILS collected several kinds of information about providers who worked with children and their families in EI during the first 6 months of service. Describing EI with regard to who provides services presents a very similar picture with regard to the nature of EI (i.e., types of services received). Families reported they worked with a service coordinator (63%), a speech therapist (53%), a physical therapist, an occupational therapist (both 38%), a child development specialist (32%), or a special educator (29%). The difference between the percentage of families who reported they received service coordination (78%) and those who reported they worked with a service coordinator (63%) could be related to the service coordination model. In some programs, a professional such as a speech therapist or a special educator who provides another service to the family also serves as the service coordinator; consequently, no other professional would be identified as the service coordinator. The professional titles (e.g., special educator, child development specialist, infant development specialist, early interventionist) of the individuals who work directly with children or families but who are not therapists also vary from state to state. Thus, if the percentages for special educator (29%) and child development specialist (32%) are added together, 61% of the families would have had a professional functioning in that role. Because families did not, in fact, report receiving services from both of these professionals, different titles for a similar role are suggested.
Most families worked with 2 (22%) or 3 (23%) different EI professionals in their first 6 months of service, with 13% working with 6 or more. Not including the service coordinator, the most frequent team of providers consisted of a special

3-9
educator/child development specialist, a speech language pathologist, and either a physical therapist or an occupational therapist (19%). The next most frequent combinations consisted of a special educator/child development specialist and either an occupational therapist or a physical therapist (15%); 15% of families had a speech language pathologist only; in other words they were served by an individual professional and not by a team. Only 6% of the families in EI received no service from one of the following, either singly or in combination: a special educator/child development specialist, a speech language pathologist, an occupational therapist, or a physical therapist.
The NEILS survey of service providers who worked with families in their first 6 months provided additional information about the nature of EI and its workforce. Because only certain professionals work with large numbers of children in EI, sufficient survey data were available only for eight categories of EI providers: service coordinators, speech/language pathologists, occupational therapists, physical therapists, child development specialists, special educators, social workers, and nurses. All percentages in the bullets below refer to the percentage of those families to whom the characteristic applied from among all families who worked with that particular category of professional; for example, across all the families who worked with a service coordinator, 61% of families had service coordinators younger than 40.
Families receiving EI services were likely to work with a professional who:
Was female. The percentage of families who received services from a female ranged from 92% for child development specialists to 98% for occupational therapists.
Was white. Families working with a speech/language pathologist (90%), a physical therapist (89%), or a special educators (89%) were most likely to have a white service provider, whereas those working with a nurse were the least likely (79%).
Was of any age. However, those working with nurses or special educators were more likely to work with an older professional, as opposed to speech language pathologists and service coordinators, who tended to be younger.
Was unlikely to be able to speak another language. Of the families working with a nurse, 19% had a nurse who spoke another language, which was the highest percentage across the nine professions.
Was highly educated. However, the professional’s type of degree varied, depending on the profession. Among families working with a speech language pathologist, 92% had one with a master’s degree (and another 2% had one with a doctorate). Among families working with a nurse, only 30% had a nurse with a master’s degree or higher, as was true for 37% of occupational therapists (Figure 3-7). Nearly all of the professionals had at least a college degree; however, 11% of the families working with a nurse and 6% of those

3-10
working with a speech language provider had professionals with an associate degree. No more than 2% of any of the families worked with a professional who had a doctorate.
Was trained to work with children and families with disabilities. For working with children, the range was from 32% (social workers) to 87% (physical therapists). For working with families, the range was 46% (child development specialists) to 72% (physical therapists).
Had a varying number of years of EI experience. Each of the professions had both new and experienced staff members, but families were most likely to have a professional with less than 3 years of EI experience if they had a social worker (44% of families had a social worker with 0 to 3 years experience) or a service coordinator (43%). They were least likely to have someone new to the field if they had a child development specialist (22%), a special educator, or a nurse (both 24%).
The data on academic training and licensing indicate that four of the professions working in EI—speech/language pathology, physical therapy, occupational therapy, nursing, and social work, were well-defined. Members of these professionals tended to have an undergraduate and/or graduate degree and a license in their field. That was not the case for professionals who identified themselves as service coordinators, child development specialists, or special educators. Families served by service coordinators had providers who held degrees in psychology (21%), social work (11%), elementary/secondary education (11% and 6%), and “other” (12% and 16%). Families served by child development specialists and special educators had providers with bachelor’s degrees in elementary/secondary education (18% and 29%, respectively) and special education (11% and 29%, respectively). About 40% of those served by child development specialists had providers with academic backgrounds related to their EI work: psychology (16%), child development (13%), and early childhood education (11%). Children served by special educators had providers with degrees in early childhood special education (ECSE, 11%), speech and language pathology (9%), and in “other” fields (11%). The data on graduate degrees indicate a similar mix for these professionals. The data suggest that these fields are still emerging as professions and that programs are hiring from a variety of backgrounds to fill these positions. The extent of variation in the professional preparation of these individuals raises concerns about how consistently quality services are being delivered from program to program and state to state. Whatever the knowledge and skills expected for service coordinators, special educators, or child developments specialists, it is unlikely that each of the various types of academic degrees could confer all the knowledge and skills required. When asked to evaluate their overall preparation, however, most providers, including those from the professions with varied backgrounds, indicated they were well-prepared to work with infants and toddlers (from 52% for social workers to 76% for physical therapists). Even more felt they were prepared to work with families (82% to 91%).

3-11
70
63
56
49
47
30
21
7
30
37
44
51
53
70
79
93
0 20 40 60 80 100
Nurse
Occupational Therapist
Physical Therapist
Service Coordinator
Child Development
Special Educator
Social Worker
Speech/Language Pathologist
Percent
Bachelor's or less Masters/Doctorate
These data have limited utility, however, in that they are self-reports and may not reflect the individuals’ actual level of preparedness.
Professionals providing EI services generally work for a public or private agency, although some are self-employed. Across the 9 professions, the percentage of families with a professional from a public agency ranged from 33% (physical therapists) to 58% (special educators), whereas the percentage with a professional from a private agency ranged from 32% (occupational therapists) to 48% (nurses). Families with a speech language pathologist (18%), an occupational therapist (11%), or a physical therapist (19%) were most likely to be working with someone who was self-employed. Most EI providers’ caseloads were predominantly EI clients—an average of 55% to 84% of their clients. As might be expected, 84% of families who received services from a child development specialist had a provider who served only children age 0-3. Between 72% and 79% of children who received services from nurses, special educators, and service coordinators had providers who served children age 0-3 exclusively. About half of children served by therapists had providers who served only infants and toddlers.
Figure 3-7 PERCENT OF CHILDREN IN EI SERVED BY PROVIDERS WITH DIFFERENT
LEVELS OF DEGREES (HIGHEST DEGREE OBTAINED)
Leaving Early Intervention
Although EI is a program for children from birth to 36 months of age, very few children receive services for the entire 36 months. The maximum number of months of EI service a child and family can receive is determined by the child’s age

3-12
at entry. As discussed in the Chapter 2, children enter EI at every age month between birth and 36 months. The average age of entry was 17.1 months, and more than one-third of children entered after their second birthday.
The length of time in EI was computed as part of the expenditure study described above. Overall, the average number of months for children who began EI at younger than 31 months (the criterion used for inclusion in the study sample) was 17.2 months. Children with risk conditions who tended to begin intervention as infants had the longest average duration of services at 23.2 months, followed by children with diagnosed conditions at 20.4 months; these children also tended to begin services at a young age. Children with developmental delays, who are identified later, received services for an average of 14.6 months. Finally, children who had only speech or communication problems received EI for the shortest time, an average of 9.7 months.
Overall, 16% of EI recipients left services before 36 months. Most EI participants (63%) continued to receive services until 36 months and then went on to receive preschool special education services. Another 20% continued to receive service until 36 months, but did not go on to receive additional special services. Families reported many different reasons for not receiving services after leaving EI. The most frequent reason given was that services were no longer needed (50%), with another 5% of families reporting that the child was no longer eligible for services. A surprisingly high number of families (13%) reported they were on a waiting list for services, and 10% reported that services were not available. A difficulty with the agency or program was reported by 7%; 5% reported they were waiting for an assessment; and 3% of families reported they did not want services.
A series of questions asked of the families when the child was 36 months old indicated that, overall, most families were pleased with their EI experience. They felt the goals on the IFSP had been jointly set by the family and the professionals, although 7% of families reported they were not aware of the IFSP. Most families (73%) felt that they and the service providers jointly decided on the kinds of service, although, similar to the findings at entry, fewer felt the amount of service was jointly decided (53%). Most families (84%) felt they had been involved the right amount in the decisions about services, although 15% reported they wanted more involvement. Among the 87% who reported having received a therapy (speech, occupational, or physical) service sometime during their EI experience, 9 out of 10 thought the service was good or excellent. Most (72%) thought they had received the right amount of service, although a sizable minority (22%) thought they had received less than needed. The quality of the other EI services was highly rated as well, and most families were satisfied with the amount. Most families (89%) believed that the right number of professionals had worked with them and that they communicated well with each other. Families were less pleased with the individualization of services. A majority (65%) saw their services as highly individualized, but 31% said they were somewhat individualized. Most rated the

3-13
help received through EI as excellent (5%) or good (34%). At the end of their EI experience, families reported having good feelings about professionals and gave professionals very high marks for respecting their family’s values and background, considering their opinions, and helping them feel hopeful about their child’s future. For example, 98% agreed that they had good feelings about professionals who worked with children with special needs and their families.
Although most families in every group saw EI as a positive experience in regard to the set of indicators just reported, slight differences were noted for many of the indicators, with minority or low-income families being slightly less positive. For example, 59% of African-American families rated their therapy services as excellent as did 55% of Hispanic families, whereas 64% of white families saw the services as excellent. With regard to individualization of services, 61% of the families with mothers did not graduate from high school reported that services were highly individualized compared with 69% of those with mothers who graduated from college.
Although the transition out of EI was positive, it was less positive for families than their EI experience, and the transition experience differed depending on when the family left EI and whether their child received ECSE services. Families who leave EI before their child is 36 months of age do so for a variety of reasons, including dissatisfaction with services. They also may not inform the program of their reasons for leaving before leaving, whereas all families who leave at 36 months are “planned exits.” The majority of both groups of families who stayed with EI until the child was 3—both those whose child would receive ECSE and those whose child would not—reported that someone talked with them about program options for their child at 3, although we would have expected that all families would have reported discussions about options (Table 3-1). Not surprisingly, families with children who would be receiving ECSE were the most likely to report that someone from EI helped develop a written plan for the services the child would receive at 3, although only 72% of these families reported that to be the case. Families whose child would be receiving ECSE were most likely to have had someone talk to them about program options or other services for the child at 3. Only 61% of the ECSE families reported that someone suggested an inclusive program for their child’s next program; the percentage was nearly identical for families who would not be receiving ECSE (58%). Overall, most families gave ratings of good or excellent when asked how well prepared they felt for the changes in services after EI; overall, however, 18% gave ratings of fair or poor, indicating EI needed to do a better job with a fairly large number of families. Families whose child left EI at 36 months and would be receiving ECSE were the least satisfied with the process of leaving EI. Only 35% reported they were very satisfied, compared with 52% of those who had left EI early and 43% of those who would be receiving no additional services.

3-14
Table 3-1 EI TRANSITION-RELATED EXPERIENCES REPORTED BY FAMILIES
WHEN THEIR CHILD REACHED 36 MONTHS Left at 36 months
Received ECSE at 36 months?
Percent of families who reported that the EI program: Total
Left before 36 months Yes No
N= 1779 to 2111 279 to 322 1135 to 1371 365 to 419 Talked about options for preschool or other services when the child turned 3
79 39 90 78
Suggested options for a preschool in which the child would be included with children who did not have special needs
55 30 61 58
Helped with developing a written plan for the services the child would receive after age 3
58 19 72 47
Outcomes Experienced by Children at 36 Months
The final section of this chapter presents the outcomes experienced by EI recipients when the children were 36 months of age. Outcomes for children are presented first, followed by outcomes for families. As noted earlier, 16% of children and families left EI before the child turned 36 months. The section presents outcomes for all EI recipients regardless of when they stopped receiving services.
Several categories of child outcomes are presented:
The need for special service at 36 months.
The Family’s perception of the impact of EI on the child.
Health status.
Functioning (vision, hearing, limb use, communication).
Behavior.
Developmental skills.
The status of these outcomes at 36 months is presented along with, for some of the outcomes, change over time from EI entry to 36 months. Factors related to outcomes are discussed as well. Because the outcomes touch on many aspects of child functioning, no single outcome measure presents a complete picture of how children were doing, but each contributes unique information to our understanding of outcomes at 36 months.
Need for Additional Services
As noted above, 63% of EI recipients received ECSE after leaving EI. This outcome measure is a marker of how children were doing, but it also reflects the children

3-15
who were determined to be eligible on the basis of state criteria, as well as which families were interested in pursuing services. For these reasons, this outcome measure should be viewed as the minimum number of children who continued to need help. The number might have been higher if all parents had pursued this option or if the state had different eligibility criteria. Even though the precise figure would differ under different circumstances, it is clear that the special education system considered that a substantial number of children no longer needed special services by the end of EI.
Perceived Impact on the Child
Families were asked their perceptions about the impact of EI services on their children. Overall, 76% of families indicated that EI had a lot of impact, with another 20% indicating some impact, and only 4% indicating no impact. The families who left EI before 36 months were less likely to see an impact than those who stayed until the end of service. Only 61% of families who left EI early reported a lot of impact, 29% reported some impact, and 10% reported no impact. One possible reason for this is that families who left before 36 months may have been dissatisfied with services (the reason they stopped services), and these parents would be expected to report less impact. Another possible explanation is that some of the children who left EI before 36 months were receiving services for a risk condition. The intent of services would have been to keep the child developing well; accordingly, if services were successful, a parent would not see the impact of EI on the child. There were, however, no differences among parent-reported impacts for children with different eligibility conditions; 77% of the parents of children who received services for a risk condition reported that services had a lot of impact on their child.
Health
The initial family interviews indicated that the overall health status of children in EI was substantially poorer than that of infants and toddlers in the general population. This finding is not surprising because EI serves children who are born with significant health care needs, including children who are born prematurely, at very low birth weight, and with other health conditions that require intensive medical interventions. Health status might be expected to improve for many children as they get older, but by 36 months of age, at least, this was not the case. The distribution of health ratings between EI entry and 36 months of age differed only minimally, with slightly more children reported in excellent health and slightly fewer children reported in fair or poor health (Figure 3-8). The strongest predictors of health status at 36 months were health status at EI entry, followed by race/ethnicity with white children being healthier. Because poverty, race, and maternal education along with several other factors have been found to be predictors of health status at

3-16
entry, the emergence of race/ethnicity as a predictor at 36 months, controlling for health status at entry, indicates that health differences between white children and minority children in EI became even larger between entry and 36 months.
Figure 3-8 PARENT-REPORTED HEALTH STATUS OF EI RECIPIENTS
AT EI ENTRY AND 36 MONTHS OF AGE
Another way to describe health status at 36 months is with regard to change over time. Do some children improve, and do others get worse? Given that health status at EI entry is the best predictor of health at exit, we already know that health status for many children does not change. Comparisons across time show that the rating for 64% of the children was the same (50% were in excellent health at both time points), whereas the health of 21% improved and the health of 15% worsened. These findings suggest considerable change in health status in both directions among EI recipients (Figure 3-9). Children who experienced a decline in health status were most likely to be minority children, those who entered EI at younger ages, those with mothers with lower levels of education, and those from lower income households. The only predictor for an improvement in children’s health was maternal education; children of mothers with higher levels of education were the most likely to show improved health by 36 months.
6562
2323
1316
0
20
40
60
80
100
Entry 36 Months
Per
cent
Excellent/Very Good Good Fair/Poor

3-17
50
12 12
8 9
36
0
20
40
60
Figure 3-9 CHANGE IN PARENT-REPORTED HEALTH STATUS OF EI RECIPIENTS
BETWEEN EI ENTRY AND 36 MONTHS
Functioning
Information was collected from parents about children’s vision, hearing, use of limbs, and communication.
Vision. At EI entry, parents reported that 13% of children might or did have a vision problem. By 36 months, this figure was 17%. At entry, 8% had a diagnosed vision problem, and the percentage had increased to 14% by 36 months. The difference over time should not be assumed to simply result from more children being identified. Similar to the findings for health status, some children acquired a diagnosed vision problem, but others lost their diagnosis. Most children in EI (84%) were reported to have no vision problems at both time points (Figure 3-10). Eight percent were diagnosed with vision problem between entry and 36 months, which is a positive finding because connection to the EI service system should facilitate screening for vision problems and follow-ups for possible problems. Five percent of the children were diagnosed with problems with vision at both time points, and 3% were reported to no longer have vision problems at 36% months.
E/VG G F/P G to F/P to E/VG to G to E/VG G/VG/E G/F/P F/P No Change Better Worse
(64%) (21%) (15%)
E = Excellent VG = Very Good G = Good F/P = Fair/Poor
Perc
ent

3-18
Figure 3-10 CHANGES IN PARENT-REPORTED VISION STATUS FOR EI RECIPIENTS
BETWEEN EI ENTRY AND 36 MONTHS
Hearing. As was true for vision problems, only a small percentage of EI recipients had hearing problems. At entry, 15% were reported as children who might or did have hearing problems. By 36 months, that figure had dropped to 12%. Nine percent of EI recipients had diagnosed hearing problems at entry; the figure was 10% at 36 months. Overall, 87% did not have a hearing problem at entry or exit, and 5% had hearing problems at both time points (Figure 3-11). Five percent had a hearing problem diagnosed after entering EI, and 4% were reported to no longer have a hearing problem.
Change, no longer has vision problem
3%
No change, vision problems
5%
Problem diagnosed 8%
No change, normal vision84%

3-19
Figure 3-11 CHANGES IN PARENT-REPORTED HEARING STATUS FOR EI RECIPIENTS
BETWEEN EI ENTRY AND 36 MONTHS
Use of limbs. Parents reported a small but similar percentage of children as having difficulty with limb use (arms and hands or legs and feet) at EI entry and at 36 months. This finding is not surprising because many children with motor problems as infants and toddlers will continue to have these problems throughout their lives. EI services are intended to enhance the development of children with disabilities, but the services cannot eliminate the underlying physical problem causing the child’s motor difficulties. At EI entry, families reported 18% of the EI entrants had a little trouble using arms and hand, and another 6% had a lot of difficulty doing so or no use. The figures at 36 months were 15% and 6%, respectively. At entry, 19% of families reported their child had a little trouble with use of legs and feet, and another 8% reported a lot of trouble doing so or no use. The figures for 36 months were 16% and 9%, respectively.
The children experiencing difficulties were not exactly the same children at both time points, however. For arm and hand use, 68% of children were reported to be experiencing no difficulties, and 9% were reported as having trouble at both time points (Figure 3-12). The parent reports differed for 23% of the children, with 10% reported as having more difficulty with arm and hand use at 36 months than at entry and 13% reported to have less difficulty. For leg and foot use, 73% of children received the same rating at both time points (Figure 3-13). Among those with different ratings, 14% were reported to have better use at 36 months, and 13% were reported to have more difficulty.
Change, no longer has hearing problem
4%
No change, hearing problem
5%
Change, hearing problem diagnosed
5%
No change, normal hearing
87%

3-20
Figure 3-12 CHANGES IN PARENT-REPORTED USE OF ARMS AND HANDS FOR EI
RECIPIENTS BETWEEN EI ENTRY AND 36 MONTHS
Figure 3-13 CHANGES IN PARENT-REPORTED USE OF LEGS AND FEET FOR EI
RECIPIENTS BETWEEN EI ENTRY AND 36 MONTHS
All of these data are based on parent reports, which raises questions about whether parents answered the questions comparably enough to provide meaningful information about their child’s functioning. One indicator in NEILS that suggests that parent-provided information about child functioning is, in fact, meaningful comes from the expenditure data set. Outcomes at 36 months were examined with regard to the average monthly expenditure for the child. For many of these children, limb use was not the only problem and thus was not the only area for which service was provided. Consequently, if a parent reported a lot of trouble with
Change, improved13%
No change, trouble using arms and hands
9%
Change, declined10%
No change, uses arms and hands as well as
other children68%
Change, improved14%
No change, trouble using legs and feet
10%
Change, declined13%
No change, uses legs and feet as well as
other children63%

3-21
limb use, the probability was high that the child had other problems as well. If parent reports of functioning are valid and if more services are provided to children with more intensive problems, we would expect to see a relationship between expenditures and problems with limbs use. As the data in Figure 3-14 demonstrate, this is exactly the case. The relationship between what parents reported about their children’s use of limbs and the amount of resources that were expended on them in EI is consistent and predictable. With reference to limb use, children who were reported to have a lot of trouble or no use of limbs had substantially higher monthly expenditures for EI services than children reported to have a little trouble, and expenditures for those children, in turn, were higher than for children with no trouble in use of limbs.
Figure 3-14 AVERAGE MONTHLY EXPENDITURE FOR EI SERVICES
BY PARENT REPORT OF USE OF LIMBS AT 36 MONTHS
Communication. For children without diagnosed medical conditions or obvious physical problems, communication problems can be one of the first markers of a developmental problem. This area of development can be a challenging for children with diagnosed disabilities as well. The communication skills of children who enter EI as infants emerge during their time in EI. For those who begin EI services later, as we saw in the previous chapter, difficulty in communication often results in a child’s receiving EI. Parents were asked to report on two aspects of communication: how well their child makes his or her needs known and how easily the child’s speech can be understood by a stranger.
$743 $791
$1,246 $1,296
$1,811 $1,817
$-
$200
$400
$600
$800
$1,000
$1,200
$1,400
$1,600
$1,800
$2,000
Legs and feet Arms and hands
$
A Little Trouble A Lot of TroubleNormal Use
$743 $791
$1,246 $1,296
$1,811 $1,817
$-
$200
$400
$600
$800
$1,000
$1,200
$1,400
$1,600
$1,800
$2,000
Legs and feet Arms and hands
$
A Little TroubleNormal Use

3-22
At EI entry, 19% of the children were reported as able to communicate their needs as well as other children their age. By 36 months, the percentage was 42%, but the comparison is misleading because at entry 38% of the children were under 1 year of age and the question was not asked. Looking first only at the children who were older than 1 at both time points shows that more children showed an increase than a decrease in how well they made their needs known. About one in five (21%) were able to make their needs known as well as other children their age, and another third (33%) were reported to have trouble at both time points (Figure 3-15). However, 30% were reported to have a higher level of functioning in this area at 36 months than at EI entry, compared with 16% who were reported to have a lower level. For children who were younger than 12 months at EI entry, those in the largest group (46%) were reported to be able to communicate their needs as well as other children their age, with 32% reported to have a little trouble communicating and 22% to have either a lot of trouble communicating or not communicating at all (Figure 3-16)
Figure 3-15 CHANGES IN PARENT REPORTS OF HOW WELL THEIR CHILD MADE
NEEDS KNOWN FOR EI RECIPIENTS BETWEEN EI ENTRY AND 36 MONTHS (CHILDREN > 12 MONTHS AT EI ENTRY)
Change, improved30%
No change, trouble communicating
33%
Change, declined16%
No change, communicates as well
as other children21%

3-23
A little trouble communicating
32%
A lot of trouble communicating/
Does not communicate
22%Communicates
well46%
Figure 3-16 PARENT REPORTS OF HOW WELL THEIR CHILD MADE NEEDS KNOWN
AT 36 MONTHS (CHILDREN < 12 MONTHS AT EI ENTRY)
Only 9% of parents reported that their child’s speech was easy to understand at entry to EI, which would be expected given how young many of these children were. When the children were 36 months of age, 42% reported the child’s speech was easy to understand; however, a rather high 23% reported the child had no words at all. Looking first at the children who were older than 12 months at EI entry and for whom we have two points of data, we see that 59% of the families reported an improvement in the understandability of their child’s speech, and 30% reported the child’s speech was difficult to understand at both time points (Figure 3-17). A few (9%) reported their child’s speech was more difficult to understand at 36 months. Among the children who were younger than 12 months when they began EI, by 36 months, 47% were very or fairly easy to understand, and 24% were somewhat or very hard to understand (Figure 3-18). Parents reported that 29% of these children had no words at all. Children who are developing without delays or disabilities in communication would have a vocabulary of several hundred words by 36 months of age. The outcomes with regard to communication were both encouraging and discouraging in that many children showed improvements in this area by 36 months of age, but many also still experienced developmental challenges.

3-24
Change, improved59%
No Change, speech understood as well as
other children's2%Change, declined
9%
No Change, trouble understanding child's
speech30%
Figure 3-17 CHANGES IN PARENT REPORTS BETWEEN EI ENTRY AND 36 MONTHS OF
HOW WELL OTHERS UNDERSTAND THEIR CHILD’S SPEECH (CHILDREN > 12 MONTHS AT EI ENTRY)
Figure 3-18 PARENT REPORTS OF HOW WELL OTHERS UNDERSTOOD THEIR CHILD’S
SPEECH (CHILDREN < 12 MONTHS OLD AT EI ENTRY)
No words29%
Fairly easy22%
Very easy25%
Very hard5%
Somewhat hard19%
3-25
Behavior
Helping a child learn to behave appropriately can be challenging for parents. Some aspects of behavior, such as shyness, activity level, or affection, are traits that reflect the child’s uniqueness. Other aspects, such as aggression or being overly withdrawn have negative implications for the child in the present and may be precursors of problems to come.
At the end of EI, most children were reported to be behaving in ways that would be considered like other children their age. A small percentage of children, however, in regard to each of the behavior items were reported to be showing problematic or challenging behaviors. For example, 22% percent of families reported that it was not like their child to pay attention to things and stay focused. Thirty-nine percent reported their child was very active and excitable and had trouble sitting still. When asked if their child was jumpy and easily startled by loud noises or quick movements, 19% reported that this was very much like their child. One in five (21%) reported that their child was easily distracted by everyday things. Nineteen percent reported the child did not show interest in nearby adults. Eleven percent reported their child had difficulty playing around other children, and 9% said their child was often aggressive with other children.
A factor analysis indicated the 15 behavior items formed four factors: distractible, withdrawn, difficult to manage, and lack of persistence. For the distractible factor, 32% of the children were reported by their parents to be on the extreme negative end of the item for all of the items in the factor. The comparable figures for the withdrawn, difficult to manage, and lack of persistence factors were 5%, 10%, and 13%, respectively.
A different set of characteristics was predictive of how a child scored on each of the factors. However, for three of the four, the single best predictor of a factor score at 36 months was the score on that same factor at EI entry; for example, the best predictor of a child’s being distractible at 36 months was having been distractible at entry. For children who were distractible at 36 months, the other best predictors were not being in the speech and language group (i.e., having a different or additional delay besides speech and language, a diagnosed condition, or a risk condition), being male, having trouble communicating, being in foster care, and being in poor or fair health. For the difficult-to-manage factor, the additional best predictors were having trouble communicating, not being in the speech and language only group, being male, being in fair or poor health, entering EI after 24 months of age, having a mother between 20 and 35 years old, and having a mother with less than a high school education. The children who were less persistent were those with communication problems, who were not in the speech and language only group, and who were in poor or fair health. For the withdrawn factor, the best predictor was having trouble communicating, followed by being withdrawn at entry, and being in fair or poor health.

3-26
One additional way to look at behavior is friendship and how others perceive the child. To address the issue of friendship, parents were asked how often their child had been invited to play at another child’s house. About a quarter of the children were reported in each of four categories: 25% had often been invited to another’s house, 26% several times, 24% once or twice, and 25% had never been invited to another child’s house in the past week.
Developmental skills
According to parent reports, many children had mastered a number of developmental skills that would be expected of them by the time they were 36 months of age. For each of the items, however, a sizable minority was unable to do the task at all, and some could do it but not well (Figure 3-19). The percentage of children who had and had not mastered a given task varied with the task, even though all the tasks listed should be in the developmental repertoire of a 3 year old. The three skills related to bowel and bladder control were difficult for approximately 40% of former EI participants at 36 months. Two other tasks that were difficult for many were saying at least 50 words, a developmental accomplishment that most children have mastered by 21 months of age; and taking off one’s shirt without help, a task usually mastered at 24 months. On the other hand, these children as a group were doing very well with showing that they knew two body parts and following a two-step direction. With the exception of the toileting items, what children who had been in EI could and could not do at 36 months of age does not appear to follow a pattern.
Family’s Perception of the Child’s Current and Future Quality of Life
Parents were asked to report on two aspects of their child’s quality of life when their child was 36 months old: the child’s current overall life situation and his or her future life situation. Families were very positive about their child’s current life situation. More than half reported the child’s current situation was excellent (39%) or very good (31%). Another 23% reported the child’s current situation to be good, with 6% reporting fair and 1% indicating the child’s situation was poor. Families were even more optimistic about the child’s future, with 53% seeing the child’s overall life situation in the future as excellent, another 29% thinking it would be very good 15% good, and only 3% reporting fair and <1% reporting poor. This finding is important because an important benefit of EI for families could be helping them be hopeful about their child’s future.

3-27
87
73
63
58
55
49
48
38
33
5
15
25
18
30
28
12
25
25
8
11
12
24
16
23
40
37
42
Shows that knows 2 body parts (28)
Follows a 2-step verbal direction (24)
Turns pages of a book one at a time (24)
Says 2 or 3 words in a sentence (25)
Understands and stays away fromcommon dangers (30)
Takes off shirt without help (24)
Says at least 50 different words (21)
Does what is expected on the toilet (24)
Plays group games that have rules (30)
Percent
Does it well Does it but not well Doesn't do it at all
Note: Number in ( ) is the age in months at which this task is mastered by 90% of the general population
Figure 3-19 PARENT REPORTS OF DEVELOPMENTAL SKILLS WHEN THEIR CHILD WAS 36 MONTHS OF AGE
0 20 40 60 80 100

3-28
Family Outcomes When the Child Was 36 Months Old
The child outcomes just described present a varied picture showing some children functioning at relatively high levels and others having difficulty. The picture is more uniform for families, most of whom reported positive outcomes. As noted above, families reported being very pleased with EI services and the professionals who worked with them. Satisfaction with services, however, is not the same thing as achieving good outcomes. An outcome refers to the benefit received from the service. Families were asked about a number of different family outcomes when their child was 36 months old. The NEILS findings suggest that families are doing very well in regard to most of the outcomes examined. Two exceptions where families reported doing slightly less well were knowing what to do about their child’s behavior and participating in community activities. The findings for all of the outcomes are the family’s perceptions, given that they are based on report of the family member who responded to the interview questions.
Perceived Impact on Families
Most parents considered EI to have had a significant impact on their families, reporting their families were much better off (59%) or somewhat better off (23%) as a result of the help and information provided. Some parents (16%) reported that their family was about the same, and 1% reported that their family was worse off than it had been before receiving EI.
Helping their Child Develop and Learn
Early intervention should be helping parents be and feel competent as caregivers. Almost all parents felt that they knew how to care for their child’s basic needs, with 85% strongly agreeing with this statement and an additional 14% agreeing with it (Figure 3-20).
Most (96%) parents also felt that they were able to help their child learn and develop, although in comparison with perceived competence in caring for their child’s basic needs, fewer provided strong agreement (64%) and more (32%) provided simple agreement. Families were less comfortable with behavior issues—35 % strongly agreed or agreed that they often had a difficult time figuring out what to do about their children’s behavior.

3-29
85
64
1114
3224
3
34 32
<1 1<10
20
40
60
80
100
I know how to carefor my child's basic
needs
I know how to helpmy child learn and
develop
It is difficult to figureout what to do aboutmy child's behavior
Per
cent
Strongly agree Agree Disagree Strongly disagree
Figure 3-20 PARENTS’ REPORT OF CAREGIVING KNOWLEDGE AT 36 MONTHS
Working with Professionals and Advocating for the Services
This outcome addresses the extent to which family members believe they can negotiate the service system and feel a sense of efficacy when trying to access services for their children, an area often referred to as “parent empowerment.” Most parents either strongly agreed (65%) or agreed (31%) that they knew how to work with professionals and advocate for services, with only 4% disagreeing. Most parents also strongly agreed (50%) or agreed (40%) that they knew what to do if they did not feel that their child was receiving needed services. Only 10% disagreed or strongly disagreed with this statement.
Support System and Participation in the Community
This outcome is drawn from an extensive body of research suggesting that although professionals provide important specialized services for children and families, the nature and amount of community and social support a family experiences are highly correlated with successful coping with, and adapting to, raising a child with a disability or special needs. The findings suggest that at the end of EI most families believed they had social support, although the findings with regard to community participation were not quite as positive. Most parents agreed (27%) or strongly agreed (62%) that they had friends or relatives to whom they

3-30
could turn for support or help when they needed it. About one third (36%) of the parents agreed or strongly agreed that they had little chance to take part in community activities, such as religious, school, or social events. The remainder disagreed (36%) or strongly disagreed (28%) with this statement: that is, they made the desired response. Most parents (82%) agreed or strongly agreed that they had relatives or friends to whom they could turn for help in dealing with challenges associated with their child’s special needs. Most parents (94%) agreed or strongly agreed that their ability to work and play together as a family was pretty normal, even though they had a child with special needs.
The Family’s View of its Current and Future Quality of Life
Quality of life is a broad and nebulous construct that encompasses almost the full range of family outcomes. This purely subjective phenomenon may transcend responses to individual questions. To address this issue, we asked a single global item: “Thinking about your family’s overall life situation now, would you describe it as excellent, very good, good, fair, or poor?” About two-thirds of the parents rated their current quality of life as excellent (39%) or very good (28%); 24% rated their family’s current life situation as good; and only 9% rated it as fair or poor. Families were even more optimistic about their future life situation, with 52% believing it would be excellent, 29% believing it would be good, 16% good, and only 2% fair or poor.
A logistic regression was conducted to determine which families were experiencing the most satisfaction and positive outcomes at the end of EI. Families were categorized into positive (75%) and less positive (25%) on the basis of their responses to 27 items on the interview. Three variables were significantly related to being less satisfied and having less positive outcomes: race, the child’s health status at enrollment, and the child’s health status at transition. Controlling for all other variables, odds ratios indicated that families of African-American children were 2.13 times more likely to have less positive outcomes than families of white children. Families of children from all other ethnic groups combined were 2.11 times more likely to be in the less positive group than families of white children. In addition, the child’s health status at 36 months was related to family outcomes, controlling for health status at entry. For families of children with excellent or very good health at 36 months, the odds of being in the less positive group were 60% less than for families of children with fair or poor health at 36 months.
Although EI provides many services and supports, the services most families receive consist of therapy (speech, occupational, physical) and child development services, alone or in combination, along with service coordination. Even though services were received for only about an hour a week, families reported being very pleased with their services and reported a number of positive family outcomes at the end of EI. Children’s outcomes at 36 months were more varied, reflecting the diverse

3-31
population served in EI. An important question is: “Do children who are proceeding on good trajectories at the end of EI continue to make good progress?” For the answer to that question, the next chapter looks at how the former EI participants are doing in kindergarten.


4-1
4. EARLY INTERVENTION PARTICIPANTS GO TO KINDERGARTEN
The National Early Intervention Longitudinal Study (NEILS) allows us to take a look at what has happened to children who participated in early intervention (EI) when they reach kindergarten. As discussed earlier in this report, EI serves children with a wide variety of delays, disabilities, and risk conditions. EI is both an intervention program that can remediate the extent of impairment or lessen future difficulties, or do both for children with moderate and relatively severe disabilities identified early in life. EI also helps these children acquire compensatory skills for typical functions they will never acquire because of a disability (e.g., deaf children can learn to sign). For children with mild developmental problems or risk conditions, high-quality EI programs can prevent the development of poor functioning later in life that may be associated with early developmental problems or risk conditions. Given the variability of children served in EI, we would expect different kinds of long-term outcomes for different types of children. By looking at child and family outcomes at kindergarten and at which groups within EI are doing more and less well, we can begin to see how those who receive EI are faring a few years after their EI participation. A look at how children are doing at kindergarten also gives us a glimpse of how they may do in the future.
This chapter addresses the time between EI and kindergarten, the transition to kindergarten, the kindergarten experience, and outcomes for children and families at kindergarten.
The Time between Early Intervention and Kindergarten
Parents of the former EI participants were interviewed when the child was 36 months old and then again in the fall of the year the child was old enough to begin kindergarten. Information on the time between these two events, other than that obtained from several retrospective questions posed to the parents as part of the kindergarten interview, is limited. Parents reported that nearly two-thirds of former EI participants (63%) received preschool special education services from the public schools at some point in the years between EI and kindergarten. A small percentage of families (8%) reported their child received services from a school system before age three. Most families (49%) reported that their child received services when the child turned 36 months of age. Another 21% reported they were received when the child was between 37 and 48 months of age with the remaining 22% beginning school system services after 48 months. When asked if their child had received services more or less continuously once special education services began, 45% of the families responded “yes.”
For those children who received special education services sometime between EI and kindergarten, therapies and special instruction were the most commonly

4-2
received services: 52% received speech therapy; 32% received occupational therapy; 15% received physical therapy; 13% received special education, and 15% received behavior therapy. Among the children who had received services between EI and kindergarten, 41% of their families reported their child had been in a special class or group consisting only of children with disabilities. Parents were generally pleased with the quality of preschool special education, with 44% describing it as excellent and another 38% reporting that it was good. Some families, however, wanted more services. More than one in four families (28%) thought their child needed more service than he or she received; 70% of this group identified speech therapy as that service. A minority of families (17%) reported their child needed a service he or she did not receive; speech therapy was the missing service for 52% of these families. In addition to being pleased with the quality of services, families saw preschool special education as making a difference in their child’s life. About two-thirds reported the services had “a lot of impact” on their child’s development and another 28% reported some impact.
Families were asked about the child care or preschool arrangement for their child the year before kindergarten. In the fall of the child’s kindergarten year, half of all families (50%) reported their child had been in a preschool or child care arrangement a year ago. Three-fourths (74%) said the child was still attending the same place he or she had a year ago. Of children in preschool or child care, most (53%) were attending between 20 and 40 hours a week. Eleven percent of those whose child attended preschool reported that all of the children with whom their child attended preschool were children with disabilities.
The Transition to Kindergarten
Many children across the country do not start kindergarten when they are eligible by age to do so. Families on their own or on the recommendation of the school sometimes hold children back a year. This is especially true for those whose birthdays are near the age cutoff, because if the child waits a year, the child will be one of the oldest instead of one of the youngest children in the class. Among the former EI participants, 10% did not start kindergarten when they were old enough. Another 2% were home schooled or were in ungraded placements. Nearly all of the children who did not start on time started kindergarten the following year. Reasons given by parents for not starting kindergarten on time included: the child not being mature enough (43%), the child having a special need (38%), and the parents believed or were advised the child would do better in school if she or he started later (20%).
Most former EI participants (72%) attended kindergarten at their neighborhood school, and most (72%) attended a full-day kindergarten. Nearly all (90%) were reported to be attending a school that serves a wide variety of students, with 6% attending a school only for children with disabilities. For 9%, kindergarten was

4-3
associated with a church or religious organization. Most families (74%) reported the school did something to help the child enter kindergarten, and most (86%) felt that the school provided about the right amount of help for their child. The transition to kindergarten went well for the great majority of former EI participants; 58% of families said it was very easy, and another 30% said it was easy. In the fall of the year, nearly all reported that the child was getting along with the other children at school (61% very well, 34% pretty well) and with the teachers (70% very well, 25% pretty well). In sum, the majority of former EI participants appear to go to a kindergarten in their neighborhoods and make the move to kindergarten with relative ease.
Child Outcomes at Kindergarten
The outcomes at kindergarten for former EI participants were quite variable. As would be expected, some children continued to have disabilities and need special services. Many others were not receiving any special education or special services. Among those who were and were not receiving special education, children were doing quite well in any given outcome area,; in all areas, however, and not surprisingly, the children not receiving special education experienced better outcomes than those who were. This section describes the following child outcomes:
Disability status and education placement Children’s health status Children’s functional sensory and motor skills Children’s communication skills Children’s academic skills Children’s social skills and behavior Children’s current and anticipated future quality of life and educational
expectations for them.
Two sources provide the information for the child outcomes. Data were collected from parents at the beginning of kindergarten via a phone interview and from kindergarten teachers at the end of the kindergarten year via mail surveys.
Disability Status and Special Education Placement at Kindergarten1
At kindergarten, 32% of the former EI participants were no longer considered to have a disability. Nearly 6 in 10 (58%) were receiving special education services [i.e., they an Individual Education Programs (IEPs)] and another 10% had a disability but were not receiving special education (Figure 4-1).
1 This information was computed on the basis of parent and teacher information. If one or both reported the
child had an IEP during kindergarten, the child was considered to have an IEP; if neither said the child had an IEP but one or both reported the child had a disability, the child’s was considered to have a disability.

4-4
No IEP, No disability,
32%
No IEP, Has disability,
10%
IEP, Has disability,58%
Figure 4-1 NEED FOR SPECIAL EDUCATION AND DISABILITY STATUS AT KINDERGARTEN
OF FORMER EI PARTICIPANTS
The percentage of children who needed special education at kindergarten was similar for children who had entered EI during the first, second, or third year of life, with children who entered between 12 and 24 months being slightly less likely than the other two age groups (Figure 4-2) to require special education. The differences with regard to the reason for eligibility for EI were far more dramatic. At kindergarten, the children who were most likely to require special education were those who were eligible for EI services because of a diagnosed condition (Figure 4-3); 76% of the children who received EI because of a diagnosed condition required special education at kindergarten, and another 10% were considered to have a disability. This is not surprising, given that many disabilities diagnosed before age 3 are life-long conditions. It is somewhat surprising that 14% of those who received EI because of a diagnosed condition no longer had a disability by kindergarten.
The picture at kindergarten for children who received EI because of a developmental delay was more mixed, with many (54%) needing special education and another 10% still considered to have a disability. More than one third (36%) of these children, however, did not have a disability at kindergarten. For children with risk conditions, providing services is intended to prevent the need for future service and, indeed, most of the children (56%) who were eligible for EI because of a risk condition did not have a disability at kindergarten. Nearly one-third of these children (31%) ultimately did require special education, and another 13% had a disability but did not need services.

4-5
5750
57
11 11 10
3239
33
0
20
40
60
80
Birth < 12months
12 < 24 months 24 < 31 months
Age at IFSP
Per
cent
IEP Disability, No IEP No IEP
54
76
31
10 10 13
36
14
56
0
20
40
60
80
100
DevelopmentalDelay
DiagnosedCondition
At Risk
Reason for Eligibility
Perc
ent
IEP Disability, No IEP No IEP
Figure 4-2 RECEIPT OF SPECIAL EDUCATION AND DISABILITY STATUS AT KINDERGARTEN OF
FORMER EI PARTICIPANTS, BY AGE AT THE TIME OF THE INDIVIDUALIZED FAMILY SERVICE PLAN (IFSP)
Figure 4-3 RECEIPT OF SPECIAL EDUCATION AND DISABILITY STATUS OF FORMER EI
PARTICIPANTS AT KINDERGARTEN, BY REASON FOR ELIGIBILITY
Boys were more likely than girls to receive EI (61% to 39%), and among former EI participants, boys were proportionately more likely to require special education at kindergarten—58% versus 50% of girls. Thus, by kindergarten the disproportion between the two groups had increased. Ten percent of the boys had a disability but were not receiving special education compared with 12% of the girls. Among children who were white, 57% had an IEP, with the same percentage for Hispanic children. This percentage compared with 50% for African-Americans and 41% for Asian/Pacific Islanders.

4-6
Of those children with an IEP at kindergarten, the most frequent Individuals with Disabilities Education Act (IDEA) categories that teachers reported were speech and language impairment, mental retardation, and developmental delay. Smaller percentages of children (<10%) had the other categories of disabilities as a primary classification (Table 4-1). The distribution of primary disabilities differed from those of 5 year olds and 6 year olds receiving services under IDEA nationally in 2005 (Figure 4-4). The group of former EI participants had proportionately fewer children with speech and language impairments and learning disabilities and more children in all of the other disability categories. More than 50% of the 5 or 6 year olds in the United States were receiving special education services because of a speech or language impairment; that was true for only 22% of the children who had received EI services. On the other hand, a much higher percentage of children with a primary disability category of mental retardation, orthopedic impairments, or multiple disabilities was found among those who had received EI services.
Table 4-1 KINDERGARTEN TEACHERS’ REPORTS OF THE DISABILITY
CLASSIFICATION AT KINDERGARTEN OF FORMER EI PARTICIPANTS
(FOR THOSE RECEIVING SPECIAL EDUCATION, N=915) Disability Category Primary, % Any, %
Speech or language impairment 22 75
Developmental delay 14 43
Mental retardation 13 29
Autism 8 10
Multiple disabilities 8 17
Orthopedic impairment 7 21
Other health impairment 7 18
Learning disability 6 19
Hearing impairment 3 7
Deafness 2 4
Serious emotional disturbance 2 3
Visual impairment/blindness 2 12
Traumatic brain injury <1 1
Deaf-blindness <1 1
Other <1 6

4-7
0 10 20 30 40 50 60 70
Speech or language impairments
Mental retardation
Developmental delay
Multiple disabilities
Autism
Orthopedic impairments
Other health impairments
Specific learning disabilities
Hearing impairments
Emotional disturbance
Visual impairments
Deaf-blindness
Traumatic brain injury
Percent of Those with IEPS
All 5 yr.olds All 6 yr.olds Former EI
Figure 4-4 PRIMARY DISABILITY CLASSIFICATION OF FORMER EI PARTICIPANTS IN
KINDERGARTEN AND OF 5 AND 6 YEAR OLDS WITH IEPS IN THE UNITED STATES, 2005
Source of data for 5 and 6 year olds with Individualized Education Plans (IEPs) in the United States: Retrieved December 2006 from https://www.ideadata.org/arc_toc7.asp#partbCC, Table 1-7.
This pattern in these data is reasonable, suggesting that nationally many children with speech and language problems and learning disabilities are being identified after 36 months of age, whereas those with disabilities that are identified earlier such as hearing problems or developmental delays received their first special services through an EI program.
Receipt of special education services at kindergarten. As mentioned earlier, nearly 6 in 10 children (58%) received special education services in kindergarten. Nearly three-fourths of these children spent all or most of their day in regular classrooms (Figure 4-5). Therapy services were common for the majority of the children, with about 8 in 10 receiving speech therapy, nearly 6 in 10 receiving occupational therapy, and about 4 in 10 receiving physical therapy (Figure 4-6).

4-8
Figure 4-5 KINDERGARTEN CLASSROOM PLACEMENTS FOR FORMER EI PARTICIPANTS
(ONLY FOR CHILDREN RECEIVING PUBLIC SPECIAL EDUCATION AT KINDERGARTEN)
Figure 4-6 SPECIAL EDUCATION SERVICES RECEIVED IN KINDERGARTEN
BY FORMER EI PARTICIPANTS (ONLY FOR CHILDREN RECEIVING PUBLIC SPECIAL EDUCATION AT
KINDERGARTEN)
Parents’ perceptions of special education services and time with typically developing peers. Most parents were satisfied with the amount and quality of the special education or therapy services that their children were receiving in kindergarten early in the school year. About three-fourths of parents reported that the amount of special education or therapy services received through the public schools was the right amount (Figure 4-7). Most parents (83%) reported
84
61
59
41
0 20 40 60 80 100
Speech therapy
Special education
Occupationaltherapy
Physical therapy
Some time in regular class; some time in
special,13%
Entire day in special class,
27%
All in regular class working
both with regular teacher and
specialist, 12%
Most of time in regular class;
taken out some,39%
All in regular class working
only with regular teacher,
6%

4-9
3 5 5
74 71
81
22 2213
1 2 10
20
40
60
80
100
Kindergarten Therapy through EI Other EI Services
More than needed About the right amountLess than needed Enough of some, not others
Perc
ent
that the quality of special education or therapy services received through the public schools was good or excellent (Figure 4-8). Parents’ overall satisfaction with the amount of service at kindergarten was comparable to their satisfaction with the amount of therapy service received through EI but less than their satisfaction with the amount of other EI services. Parents were less satisfied with the quality of those kindergarten services compared with their satisfaction with the quality of EI services. Among parents whose child was receiving special education, most (83%) were satisfied with the amount of time that their child was spending with typically developing children, with only 15% reporting not enough time was spent.
Figure 4-7 PARENTS’ PERCEPTIONS ABOUT THE AMOUNT OF SPECIAL EDUCATION THEIR CHILDREN RECEIVED IN KINDERGARTEN COMPARED WITH THE AMOUNT OF
THERAPY AND OTHER EI SERVICES OBTAINED THROUGHOUT EI (COLLECTED AT THE END OF EI)
Figure 4-8 PARENTS’ PERCEPTIONS ABOUT THE QUALITY OF SPECIAL EDUCATION
THEIR CHILDREN RECEIVED AT KINDERGARTEN COMPARED WITH THE QUALITY OF EI THERAPY AND OTHER EI SERVICES (COLLECTED AT THE END OF EI)
41
6052
42
3038
136 7
3 21 1 1<10
20
40
60
80
Kindergarten Therapy through EI Other EI Services
Perc
ent
Excellent Good Fair Poor Mixed

4-10
62 65 71
23 23 1816 13 11
0
20
40
60
80
100
Entry 36 Months Kindergarten
Perc
ent
Excellent/Very Good Good Fair/Poor
Children’s Health Status at Kindergarten Entry
Most former EI participants were in excellent, very good, or good health at kindergarten entry, as reported by their parents (Figure 4-9). The proportion reported in excellent or very good health increased at each of the three time points measured from entry to EI, to 36 months, to kindergarten. Nevertheless, the percentage in fair or poor health at kindergarten (11%) was much higher than in the general population of kindergarten age children (about 2–3%, based on national surveys of the general population). The proportion in fair or poor health was higher for children with IEPs in kindergarten (13%) than for those with a disability but no IEP (7%) and much higher than those with no IEP (1%).
Figure 4-9 HEALTH STATUS AT ENTRY TO EI, 36 MONTHS, AND AT KINDERGARTEN OF
FORMER EI PARTICIPANTS
Children’s Sensory and Motor Functioning
Teachers rated children’s sensory and motor functioning at the end of kindergarten. Most children were reported to be normal for age with regard to hearing, vision, and motor functioning (Figure 4-10). The area of difficulty for the largest proportion of children was use of hands, with 37% reported to have difficulty, ranging from mild to severe. Difficulties with use of hands can be significant because of implications for learning to write. An examination of these five areas of functioning by IEP status in kindergarten showed that fewer children with IEPs were reported to have normal functioning compared with their peers without IEPs in each of the areas (Figure 4-11). The smallest difference across the three groups was found for hearing, and the largest difference was for use of hands, with fewer than half of those with IEPs reported to have normal use of their hands by their kindergarten teachers.

4-11
9587
9689
9596
8287
82 8385
69
46
6359
0
20
40
60
80
100
Hearing Vision Use of hands Use of arms Use of legs
Per
cent
No IEP Disability, No IEP IEP
90
76
64
76 73
513
2015 14
3 611
5 62 5 5 4 7
0
20
40
60
80
100
Hearing Vision Use of hands Use of arms Use of legs
Perc
ent
Normal for age Suspected/mild difficulty Moderate difficulty Severe/extreme difficulty
Figure 4-10 KINDERGARTEN TEACHERS’ RATINGS OF SENSORY AND MOTOR FUNCTIONING
OF FORMER EI PARTICIPANTS
Figure 4-11 PERCENTAGE OF FORMER EI PARTICIPANTS REPORTED BY THEIR KINDERGARTEN
TEACHERS TO BE NORMAL FOR THEIR AGE, BY IEP STATUS
Children’s Communication Skills
Both teachers and parents indicated that a fairly high percentage of former EI participants were having trouble with communication. Teachers reported that 60% of the former EI participants’ had skills that were normal for their age with regard to

4-12
understanding others and that 50% had skills normal for their age with regard to communicating with others (Figure 4-12). One in ten children were reported to have severe or extreme difficulty understanding others, and nearly one in five (17%) to have severe or extreme difficulty communicating with others. Parents reported that 89% of the children communicated primarily with spoken words, 4% communicated with sounds not words, 4% communicated with gestures, and 1% communicated with sign language. When asked how well the child made his or her needs known compared with other children the same age, 60% of parents responded that their child communicated as well as other children, 26% reported the child had a little trouble communicating, and 13% reported the child had a lot of trouble or did not communicate at all. For children who used words, parents reported by that most were very or fairly easy to understand (67%), with 20% said to be somewhat hard to understand and 5% being very hard to understand.
The differences between the former EI participants with and without IEPs were especially striking with regard to communication skills at kindergarten. Teachers reported most of the children without a disability (89%) were normal for their age with regard to understanding others, compared with 78% of those with a disability but without an IEP (Figure 4-13). Only 40% of the children with IEPs were reported to be normal for their age with regard to understanding others. Among those with IEPs, 29% were reported to have suspected or mild difficulty in this area, 13% were reported to have moderate difficulty, and 18% to have severe or extreme difficulty.
Communicating with others was more difficult for all three groups of children. Teachers reported that 83% of the children without a disability were normal for their age with regard to communicating with others and that another 14% had mild difficulties. For the children with a disability but without an IEP, kindergarten teachers reported that 69% were normal for their age, with 13% having mild difficulties and another 13% having moderate difficulties. Among children with an IEP, only 28% were reported to have skills normal for their age, with 28% with mild difficulty, 16% with moderate difficulty, and 28% with severe or extreme difficulty. These data clearly demonstrate that expressing themselves was a challenging area for the former EI participants at kindergarten, but especially so for those who required special education.

4-13
40
28
7869
8983
0
20
40
60
80
100
Understanding others Communicating with others
Per
cent
IEP Disability, No IEP No IEP
Figure 4-12 KINDERGARTEN TEACHERS’ RATINGS OF THE COMMUNICATION SKILLS
OF FORMER EI PARTICIPANTS
Figure 4-13 PERCENTAGE OF FORMER EI PARTICIPANTS REPORTED BY THEIR KINDERGARTEN TEACHERS TO HAVE COMMUNICATION SKILLS NORMAL FOR THEIR AGE, BY IEP
STATUS
Children’s Academic Skills
Teachers provided ratings of the children’s overall thinking and reasoning skills, and academic skills, including specific academic skills. Teachers reported that about half (52%) of the former EI participants were considered to have thinking and reasoning skills that were normal for their age. A fourth (24%) had mild difficulty in this area, 10% had moderate difficulty, and 14% had severe or extreme difficulty. The children with and without IEP status were substantially different in this area
6050
22 22
8 111017
0
20
40
60
80
100
Understanding others Communicating with others
Perc
ent
Normal for age Suspected/mild difficulty Moderate difficulty Severe/extreme difficulty
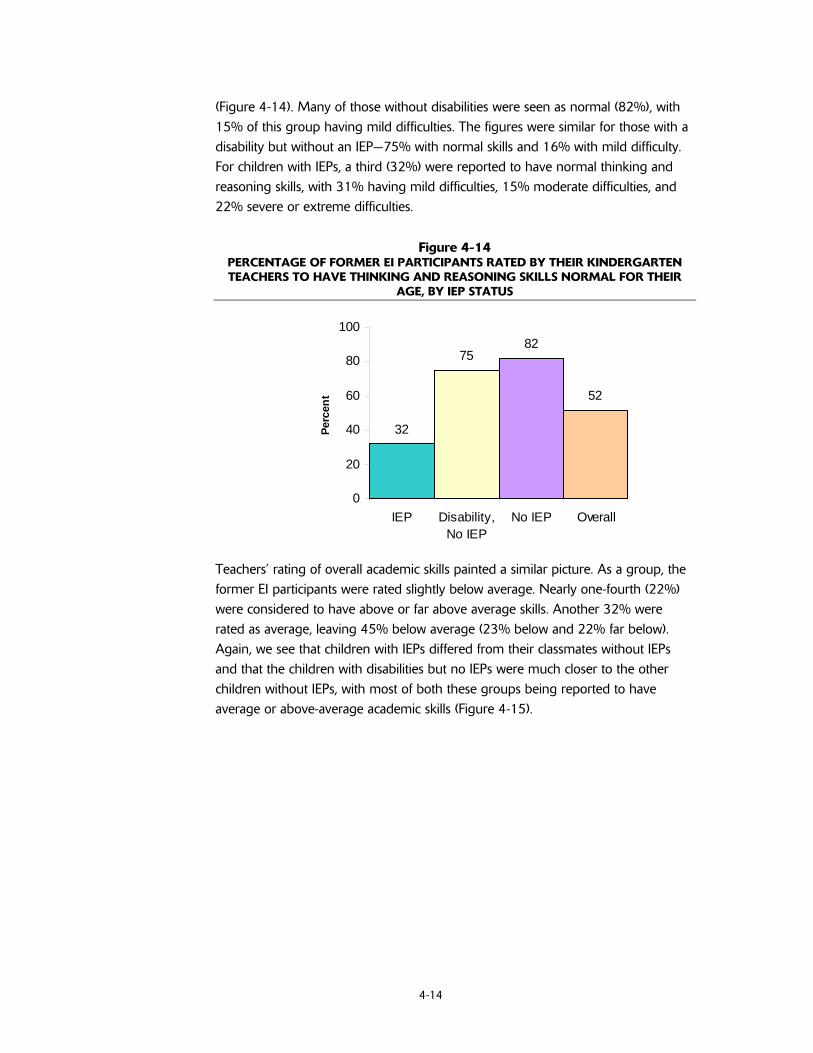
4-14
32
7582
52
0
20
40
60
80
100
IEP Disability,No IEP
No IEP Overall
Perc
ent
(Figure 4-14). Many of those without disabilities were seen as normal (82%), with 15% of this group having mild difficulties. The figures were similar for those with a disability but without an IEP—75% with normal skills and 16% with mild difficulty. For children with IEPs, a third (32%) were reported to have normal thinking and reasoning skills, with 31% having mild difficulties, 15% moderate difficulties, and 22% severe or extreme difficulties.
Figure 4-14 PERCENTAGE OF FORMER EI PARTICIPANTS RATED BY THEIR KINDERGARTEN TEACHERS TO HAVE THINKING AND REASONING SKILLS NORMAL FOR THEIR
AGE, BY IEP STATUS
Teachers’ rating of overall academic skills painted a similar picture. As a group, the former EI participants were rated slightly below average. Nearly one-fourth (22%) were considered to have above or far above average skills. Another 32% were rated as average, leaving 45% below average (23% below and 22% far below). Again, we see that children with IEPs differed from their classmates without IEPs and that the children with disabilities but no IEPs were much closer to the other children without IEPs, with most of both these groups being reported to have average or above-average academic skills (Figure 4-15).

4-15
Per
cent
37
7181
55
0
20
40
60
80
100
IEP Disability,No IEP
No IEP Overall
Figure 4-15 PERCENTAGE OF FORMER EI PARTICIPANTS REPORTED BY THEIR KINDERGARTEN
TEACHERS TO HAVE AVERAGE OR ABOVE-AVERAGE ACADEMIC SKILLS, BY IEP STATUS
Using items from the Academic Rating Scale, teachers provided ratings of a number of specific skills related to literacy and mathematics. These items also were used in the Early Childhood Longitudinal Study-Kindergarten Cohort, which collected data for a nationally representative sample of children in the spring of their kindergarten year, thus allowing the performance of the former EI participants to be compared with the general kindergarten population. Overall, their kindergarten teachers rated 45% of former EI participants as intermediate or proficient with regard to producing rhyming words. Far more children without IEPs had mastered this task than had children with IEPs (Figure 4-16). Whereas only 29% of those with IEPs were rated as proficient or intermediate, two-thirds (66%) of those with no disability and no IEP received one of these ratings. The performance in producing rhyming words of the former EI participants without IEPs in kindergarten (66%) was directly comparable to the 63% of the general kindergarten population rated as intermediate or proficient. The pattern of findings for the other two skill areas, using complex sentences structures and composing simple stories, was quite similar to that seen for producing rhyming words.
Turning to mathematics skills, we see that, like literacy, some skills are more difficult for children than other skills (Figure 4-17). Across all four of the skills shown, the pattern is the same across the three subgroups: a smaller percentage of former EI participants with IEPs showed good performance, whereas the children without IEPs performed quite comparably with the general population of kindergartners.

4-16
29
1811
58
50
31
66
56
30
45
35
20
6360
32
0
10
20
30
40
50
60
70
Produces rhyming words Uses complex sentencestructure
Composes simple stories
Per
cent
IEP Disability, No IEP No IEP Overall General Population
34 3126
20
71
60 5752
69 67 66
5450 47
43
35
6662 59
53
0
20
40
60
80
Sorts, classifies,compares
Orders a group ofobjects
Understand quantities Solves numberproblems with objects
Perc
ent
IEP Disability, No IEP No IEP Overall General Population
Figure 4-16 PERCENTAGE OF FORMER EI PARTICIPANTS RATED BY THEIR KINDERGARTEN TEACHERS AS INTERMEDIATE OR PROFICIENT IN LANGUAGE AND LITERACY
SKILLS, BY IEP STATUS AND COMPARED WITH THE GENERAL KINDERGARTEN POPULATION
Figure 4-17 PERCENTAGE OF FORMER EI PARTICIPANTS RATED BY THEIR KINDERGARTEN TEACHERS AS INTERMEDIATE OR PROFICIENT IN LANGUAGE AND LITERACY SKILLS BY IEP STATUS AND COMPARED WITH THE GENERAL KINDERGARTEN
POPULATION

4-17
Social Skills and Behavior
Teachers and parents provided information about children’s social skills and behavior. Most teachers reported children to be normal for their age with regard to behavior and social skills (Figure 4-18). About one in five were reported to have suspected or mild difficulty in this area, one in eight moderate difficulty, and 6% for behavior and 10% for social skills to have extreme difficulty. The differences among children with and without IEPs were sizable, with far more children without IEPs being reported to have skills normal for their age.
Using items adapted from the Social Skills Rating Scale, teachers provided information about a number of specific skills related to how children were behaving in the classroom. Most children were doing well; a majority of the children were reported to “very often” or “sometimes” display a variety of positive behaviors (Figure 4-19). Many of the children frequently displayed negative behaviors as well; 4 out of 5 were reported to become easily distracted, and two-thirds were reported to act impulsively (Figure 4-20), although far fewer were reported to fight with others or to appear lonely.
Figure 4-18 PERCENTAGE OF FORMER EI PARTICIPANTS REPORTED BY THEIR KINDERGARTEN
TEACHERS TO HAVE BEHAVIOR AND SOCIAL SKILLS THAT WERE NORMAL FOR THEIR AGE, BY IEP STATUS
4636
6873
82 79
6054
0
20
40
60
80
100
Behavior Social Skills
Perc
ent
IEP Disability, No IEP No IEP Overall

4-18
5
5
23
39
31
32
44
43
0 20 40 60 80 100
Appears lonely
Fights with others
Acts impulsively
Gets easily distracted
Percent
Very often Sometimes
26
41
32
38
52
52
44
61
59
51
40
49
43
38
39
47
32
36
0 20 40 60 80 100
Does hard things on own
Asks for help in class
Invites others to join activities
Keeps at a task
Joins activities
Makes friends
Receives criticism well
Controls temper
Follows classroom rules
Percent
Very often Sometimes
Figure 4-19 PERCENTAGE OF FORMER EI PARTICIPANTS REPORTED BY THEIR KINDERGARTEN
TEACHERS TO DISPLAY SPECIFIC POSITIVE BEHAVIORS
Figure 4-20 PERCENTAGE OF FORMER EI PARTICIPANTS REPORTED BY THEIR KINDERGARTEN
TEACHERS TO DISPLAY SPECIFIC NEGATIVE BEHAVIORS
Children with and without IEPs differed with respect to a number of the items; children with IEPs were generally less likely to show positive behaviors and more likely to show negative behaviors (Figure 4-21), although many children with IEPs

4-19
were reported to be doing well. For example, whereas nearly all of the children without IEPs were reported to make friends, this was true for only 85% of children with IEPs. Nine out of ten children with IEPs were reported to be easily distracted, but this was also true for 79% of children with disabilities and no IEPS and for 70% of those without a disability. One item was notable for its lack of difference across the groups: for more than 90% of each of the groups, the teacher reported the child performed up to his or her ability.
Figure 4-21 PERCENTAGE OF FORMER EI PARTICIPANTS REPORTED BY THEIR KINDERGARTEN
TEACHERS TO “SOMETIMES” OR “VERY OFTEN” DISPLAY SPECIFIC BEHAVIORS, BY IEP STATUS
One last indicator of how the child was functioning socially was how many friends the child had in the classroom. Teachers reported that 63% of the children had about the same number as other children, with 7% having more than other children, 19% having fewer, and 11% having far fewer. The differences between children with and without IEPs in regard to the number of friends they have in the classroom was especially striking and disturbing. (Figure 4-22). Two in five children with IEPs were reported to have fewer friends, with 18% reported to have far fewer. Only 3% of the children with disabilities but no IEP were reported to have far fewer friends, and this was true for only 1% of the children without a disability or an IEP. Forming friendships is an area where many of the former EI participants receiving special education in kindergarten appear to be having difficulty, which is consistent with many of these children not having the social skills and the behaviors that are considered typical for a kindergarten age child.
9485
74
89
74
9585
79
63
97 98 94
70
57
9591
82 82
67
100
0
10
20
30
40
50
60
70
80
90
100
Performs up toability
Makes friends Asks for help inclass
Gets easilydistracted
Acts impulsively
Per
cent
IEP Disability, No IEP No IEP Overall

4-20
18
3 111
23
1612
19
0
10
20
30
40
50
IEP Disability, NoIEP
No IEP Overall
Perc
ent
Far fewer Fewer
Figure 4-22 PERCENTAGE OF FORMER EI PARTICIPANTS REPORTED BY THEIR KINDERGARTEN
TEACHERS TO HAVE "FAR FEWER" OR "FEWER" FRIENDS THAN MOST CHILDREN IN THE CLASSROOM
Functioning well socially at school is important, but so is functioning well socially outside of school. Parents were asked to describe how the child was doing socially. These reports indicate that many parents thought their child was doing well. Overall, parents reported that about three-fifths of their children (58%) had age-appropriate social skills, with another fourth (24%) viewed as having mild difficulties. Other parents saw problems, with 12% reporting their child had moderate difficulties and with 6% of children described as having severe difficulties in their social skills. Not surprisingly, those with IEPs were much more likely to be reported to have problems with social skills (Figure 4-23). Unlike the teacher reports, which usually rated children with disabilities but without IEPs fairly similarly to those with no disabilities, parents of children with disabilities but without IEPs reported 40% of their children had some level of difficulty. Among children with no disabilities, only 15% were reported to have difficulties with social skills.

4-21
10 4 6
18
812
32
28
11
24
1 30
1020
3040
5060
70
IEP Disability, NoIEP
No IEP Overall
Perc
ent
Severe Moderate Mild
Figure 4-23 PERCENTAGE OF FORMER EI PARTICIPANTS REPORTED BY THEIR PARENTS TO
HAVE DIFFICULTIES WITH SOCIAL SKILLS AT KINDERGARTEN, BY LEVEL OF DIFFICULTY AND IEP STATUS
Another indicator of social functioning outside of school is how often the child is invited to play at another’s house. Overall, 61% of the children had been invited to another child’s house at least once in the last week. Consistent with the other data on social functioning, children with IEPs were less likely to have been invited to another child’s house in the past week (Figure 4-24). Whereas three-fourths of the children without a disability or IEP had been invited to a friend’s house, this was true for only about half of children with IEPs. On the other hand, fully half of the children with IEPs had been invited to a friend’s house.

4-22
Figure 4-24 PERCENTAGE OF FORMER EI PARTICIPANTS REPORTED BY THEIR PARENTS AT KINDERGARTEN TO HAVE BEEN INVITED TO ANOTHER CHILD’S HOUSE IN THE
PAST WEEK, BY NUMBER OF TIMES AND IEP STATUS
36 42 43 39
1523
3322
0
20
40
60
80
IEP Disability,No IEP
No IEP Overall
Perc
ent
Once or twice 3 or more days
Family Perception of Child’s Current and Future Quality Of Life and Educational Expectations
As they had been when their child was 36 months, parents were asked when their child began kindergarten to report on two aspects of their child’s quality of life: the child’s current overall life situation and their expectations for his or her future life situation. Similar to reports at 36 months, families were very positive about their child’s current life situation. Nearly three-fourths reported the child’s current situation was excellent or very good (71%). Another 22% reported the child’s current situation to be good, with only 6% reporting it was fair or poor. Families were even more optimistic about the child’s future, with 80% foreseeing that the child’s future life situation would be excellent or good, 16% good, and only 4% reporting it would be fair or poor. Families held high expectations for their child’s future, with most families expecting their child to complete a 4-year college degree or attain a higher level of education (Figure 4-25).

4-23
Some college/ vocational, 8%
4 year college degree, 36%
Not graduate from high school,
2% Graduate from high school, 18%
2-3 yeardegree/diploma,
7%
Graduate degree, 29%
Figure 4-25 PARENTAL EXPECTATIONS AT KINDERGARTEN FOR HOW FAR
THEIR CHILD WOULD GO IN SCHOOL
Families of children without an IEP were more likely to rate the child’s current life situation as excellent or very good than were families with a child with a disability and/or receiving special education services (Figure 4-26). Similar to parents’ ratings made when their child was 36 months old, all groups were more optimistic about the child’s future life situation than about their current situation. Most families believed their child’s future life situation would be very good or excellent regardless of IEP status, although this was more likely to be true for families of children without a disability in kindergarten. Four out of five families of children without an IEP expected that their child would at least graduate from college (Figure 4-27), as did the majority of each of the other two groups. More than half of all families of children with IEPs expected their child to graduate from college or pursue a graduate degree.

4-24
6679
64
817988
7280
0
20
40
60
80
100
Current Future
Per
cent
IEP Disability, No IEP No IEP Overall
52
7281
65
0
20
40
60
80
100
IEP Disability,No IEP
No IEP Overall
Figure 4-26 PERCENTAGE OF FORMER EI PARTICIPANTS REPORTED BY THEIR PARENTS AT
KINDERGARTEN TO HAVE AN “EXCELLENT/VERY GOOD” CURRENT AND EXPECTED FUTURE LIFE SITUATION, BY IEP STATUS
Figure 4-27 PERCENTAGE OF FORMER EI PARTICIPANTS EXPECTED BY THEIR PARENTS AT
KINDERGARTEN TO GRADUATE FROM COLLEGE, BY IEP STATUS.
Family Outcomes at Kindergarten Entry
The family outcomes examined at entry to EI and when the child was 36 months old were examined again when the child was entering kindergarten. These outcomes were:
• Helping the child learn and develop
• Working with professionals and advocating for services
• Having support systems and participating in the community
• Family’s view of current and future quality of life.

4-25
We close the section with a look at how families feel about EI when they look back at it from the child’s entry into kindergarten. Similar to parent reports when children in EI were 36 months old, parents generally reported positive family outcomes at their children’s kindergarten entry. In fact, for most of the family outcomes, with one notable exception as shown below, the percentage distribution for reporting on the items was nearly identical to that when children were 36 months old.
Helping the child learn and develop
Almost all parents indicated that they knew how to care for their child’s basic needs; fewer than 1% disagreed with that statement. Almost all (97%) also reported that they knew how to help their child learn and develop. Similar to reports at 36 months, fewer parents (67%) reported that they know how to handle their child’s behavior. There were no differences on these items in regard to the child’s disability or IEP status at kindergarten.
Working with professionals and advocating for services
Most families (89%) reported they knew what to do if they are worried their child might need special help, programs, or services. Most (90%) also reported knowing how to work with professionals and advocate for what their child needs. This is the only family outcome area where the distribution of responses did not closely resemble the responses given when the child was 36 months of age (Figure 4-28). Although the majority of families still agreed with the statement, their agreement was less strong at kindergarten than when the child was 36 months old. When the child was 36 months old, 65% of the parents strongly agreed with the statement; at kindergarten, only 50% did, suggesting that families are less confident than they used to be in their ability to advocate for what their child needs. This finding could indicate that the elementary education system is more complex for parents to navigate. It also could reflect that EI focused on helping families work with the system, thereby giving them a sense empowerment and allowing them to feel confident in their advocacy skills.
The parents of children with IEPs may need to work with professionals the most at kindergarten, and indeed this group was less likely to strongly agree that they knew how to work with professionals (62%), compared with the other two groups of parents (70% for children with disabilities and no IEPs and 69% for the others). Both groups of parents of children with disabilities at kindergarten were less likely to strongly agree that they knew what to do if their child was not receiving the services needed; 46% of the parents of those with IEPs and 48% of the parents of those without IEPs but with disabilities reported strong agreement, compared with 56% of those without disabilities.

4-26
65
50
3140
38
1 30
10203040506070
36 Months Kindergarten
Perc
ent
Strongly Agree Agree Disagree Strongly Disagree
Figure 4-28 FAMILY RESPONSES AT 36 MONTHS AND AT KINDERGARTEN ENTRY TO “I
KNOW HOW TO WORK WITH PROFESSIONALS AND ADVOCATE FOR WHAT MY CHILD NEEDS”
Having support systems and participating in the community
Most parents reported having good support systems, and being able to do things as a family and take part in community activities. Nine out of ten (89%) said they had friends or relatives they could turn to for support if they needed it. Fewer, but still a majority (79%), had relatives or friends to help them deal with their child’s special needs. Most (94%) reported their ability to work and play as a family was pretty normal. Fewer still (67%) indicated they took part in community activities such as religious, school, or social activities.
There were differences across these family outcome areas, with families of children with IEPs being slightly less likely to strongly agree with the positive statement and to strongly disagree with the negative statement (Figure 4-29)

4-27
57
40
24
5463
3628
5867
4536
6061
41
29
56
0
20
40
60
80
Have relatives/friendsfor support
Have relatives/friendsto help with child
Little chance to takepart in community
activities
Ability to work/play asfamily is normal
Per
cent
IEP Disability, No IEP No IEP Overall
Figure 4-29 PERCENTAGE OF FAMILIES STRONGLY AGREEING WITH OUTCOME STATEMENTS
RELATED TO SOCIAL SUPPORT AND COMMUNITY PARTICIPATION
Note: For the third statement, “Little chance to take part in community activities,” the percentages shown refer to families who strongly disagreed.
Family’s view of their current and future quality of life
Similar to parents’ perceptions at 36 months, parents continued to report positive and optimistic perceptions about the overall quality of life of their family when the child was entering kindergarten. The majority of families described the family’s current overall life situation as excellent (40%) or very good (30%), with 22% reporting good, 6% fair, and only 1% poor. Furthermore, the majority of families had high levels of optimism about how their family would fare in the future, with most expecting the family’s future life situation to be excellent (50%) or very good (30%). Some (17%) expected their future situation to be good, and only 3% expected it to be fair or poor.
The relationship between family quality of life and the child’s IEP status was similar to the relationship seen for the child’s quality of life. Families of children without a disability were more likely to rate the family’s overall current as excellent or very good compared with families with a child with a disability (Figure 4-30). The differences were much less for future quality of life. Possibly a family’s view of its current and future life situation is influenced by its view of its child’s needs, especially if the child has an IEP, which the family sees as currently challenging but possibly lessening in the future.

4-28
Figure 4-30 PERCENTAGE OF FAMILIES WHO REPORTED AN “EXCELLENT” OR “VERY GOOD”
CURRENT AND FUTURE LIFE SITUATION WHEN THEIR CHILD WAS IN KINDERGARTEN
One other notable family finding at kindergarten relates to parents’ retrospective views on their EI experience. At kindergarten entry, parents still expressed very positive feelings about EI services. Most (90%) felt that the help and information they received through EI had been good or excellent. A majority (84%) also felt that their family was somewhat or much better off because of participation in EI
Conclusions about Kindergarten Outcomes
The child and family outcomes measured at the beginning and end of the children’s kindergarten year present a mixed but generally positive picture for both the former EI participants and their families. Nearly one third (32%) of the former EI participants were not receiving special education services at kindergarten, nor did they have any disability. Another 10% were reported to have a disability but were not receiving special education. Across the various outcomes examined, many of the former EI participants appeared to be doing quite well. This was especially true for children who did not have a disability in kindergarten but was also true for most of the children who still had a disability but were not receiving special education, as well as for some of those who were receiving special education. Areas that appeared to be unusually challenging for former EI participants, especially those who were receiving special education services, were communicating with others and making friends. The great majority of families continued to report positive family outcomes across several dimensions of family functioning as they had throughout and at the end of EI.
65
80
57
8074
86
67
82
0
20
40
60
80
100
Current Future
Perc
ent
IEP Disability, No IEP No IEP Overall

4-29
These kindergarten data provide a glimpse of the early academic and social skills of former EI participants and suggest that some children who received EI services will achieve academic and social success in the future because they are doing quite well as kindergarteners. It is, of course, too early at kindergarten to predict the types of long-term academic and social skill outcomes to expect for the former EI participants. Some of these children who are doing well at this time may develop academic and/or behavioral difficulties later in the elementary school years when the demands of school increase (e.g., demands for reading comprehension or more sophisticated peer interactions and self-control). These findings are encouraging, however, in that the child outcomes at early elementary school look quite good for many of the children from both the parents’ and teacher’s perspectives, and, furthermore, most families continue to experience positive outcomes.


5-1
5. IMPLICATIONS OF NEILS FINDINGS FOR EARLY INTERVENTION
This final chapter discusses some of the key findings of the National Early Intervention Longitudinal Study (NEILS) and their implications for program development, policy, and research related to early intervention (EI) services for infants and toddlers with disabilities and their families. The chapter, which is organized around significant themes that emerged over the 10 years of the study, draws on findings presented in the previous four chapters and occasionally adds additional data.1
Diversity of Children and Families Receiving EI
As NEILS has shown, children can and do begin receiving EI at any time between birth and 36 months of age. Three categories—developmental delays, diagnosed conditions, and risk conditions—constitute the three reasons why a child may be eligible to receive EI. Children with diagnosed conditions and risk conditions tended to begin receiving services in the first 6 months of life, whereas children with developmental delays began receiving services much later. Children with delays and disabilities include those with different kinds and degrees of special needs; some have both a disability and a delay; and some have risk conditions as well as a disability and/or a delay. The data on children’s functioning when they begin receiving services show that a minority have motor, hearing, or vision problems, and that considerably more have problems with communication. At EI entry, 16% of the children were reported by their parents to be in fair or poor health. Nearly one-third of the children in EI were born at low birth weight (LBW—those weighing less than 2500 grams). For some of these children, LBW is the only factor that puts them at risk for poor development; for other children, however, LBW coexists with several other medical or developmental problems.
Children receiving EI services also differ with regard to demographics. More than half (61%) are boys. The percentage of whites is less than that in the general population, and the percentage of African Americans is higher. One in seven children in EI are in foster care, a rate far higher than that in the general population. The mothers of children in EI have varying levels of education; some have not completed high school and others hold graduate degrees. Some children (15%) live with one adult, most live with two, and some live with more than two. One in five households have another child with special needs. Many families receiving EI services are struggling financially, with 43% making less than $25,000 a year. More than half of the children in EI had two or more demographic risk factors (e.g., poverty, single parent, low levels of maternal education), which
1 Other NEILS reports are listed in Appendix B and can be found at: www.sri.com/neils.

5-2
research has shown substantially increase the probability of poor outcomes in the future.
The diversity of children’s disabilities and family demographics have implications for EI at many levels. It reaffirms the importance of individualized services. The medically fragile newborn with a diagnosed disorder requires a far different level and kind of intervention from the 24 month old who displays much age-expected behavior but whose speech is unintelligible. Even if their demographic circumstances were identical, the information and support needs of families with children with different needs will vary. But we know that families’ demographic needs are not identical. Some are two-parent, economically secure families who can research their infant’s disability and recommended treatment on the Internet and have the resources to readily adjust their life circumstances to address their child’s needs and intervention plan. Many families whose children qualify for EI do not fit this pattern, however. Many are struggling economically and have other children in the household, possibly even another child with special needs. Some do not speak English and may not be able to communicate easily with their interventionists. Some have limited education levels, do not have another adult with whom to share the responsibilities for caring for the child, or both. Some are foster parents who will care for this child only for a limited number of months. The service coordination function of EI is important for all families, but especially so for those who are facing multiple life challenges.
For all families receiving EI, identifying how best to help the family address the child’s needs must be viewed in the context of that family’s life circumstances. The question is always the same, “What does this family need to be able to support this child’s development?” However, the answers will be quite different, given the diverse demographics of families in EI. For some families, the answer may be well beyond the scope of EI services. The legislation for the Part C program of the Individuals with Disabilities Education Act (IDEA) recognizes the importance of the family in promoting the child’s development. The diversity of the eligible population as evidenced in NEILS findings underscores the importance of individualizing each family’s program of EI services and supports. The diversity of children and families served in EI also raises questions about what constitute the best service approaches. Much remains to be learned about which services (type, duration, delivery model) work best for which kind of children. This already complex question becomes even more complex when the diversity of family circumstances is taken into account. For EI programs to be truly evidence based, more research is required on what works best for children and families with differing needs and life circumstances.
The Transitory Nature of Disability and Delay in Young Children
As noted above, Part C specifies three categories of children eligible for services: those with developmental delays, those with diagnosed conditions with a high

5-3
probability of resulting in developmental delay, and those with risk conditions (served at the discretion of each state). When children meet the eligibility criteria for their state, they can receive EI services. Such a process may sound straightforward, but we know that decisions based on the development of young children are rarely clear-cut. Developmental problems occur along a continuum; they do not fall into “yes-no” categories. As a result, there will always be children who have significant delays for whom eligibility is not in question, children who “barely qualify” because their development is slightly below the eligibility criteria, and children who are experiencing developmental problems but who do not qualify because their development is slightly above the eligibility cut-off. From a national perspective, moreover, eligibility is even more complex because states establish their own eligibility criteria for what constitutes developmental delay. Children with developmental delays in one state may not be eligible for services in another when different cut-offs are used for determining delay.
The state-to-state variations also apply to diagnosed conditions, but the extent of those differences has not been studied. Federal policy requires serving children with “high probability” conditions, but because no set of such conditions has been agreed on, states and programs must decide for themselves which conditions qualify. Some conditions such as Down syndrome or blindness elicit easy consensus about having a high probability for resulting in a developmental delay. For a number of other conditions, the developmental outcomes are less well understood, and it is not clear how states (or local programs) are deciding which children with those conditions should be served. One condition that does have a strong body of evidence to support the importance of EI in preventing developmental problems is very LBW (i.e., children born weighing less than 1000 grams). We know, however, that not all states are serving these children; if they were, the number of children in Part C would be much higher. NEILS found that 10% of the children entering EI were very LBW—or about 19,000 children in Part C in the year NEILS started. In that same year, about 58,000 very LBW children were born across the country. The difference is even greater when all LBW children are considered. NEILS data on who is served in EI indicated that children with a wide range of conditions are receiving services, but the study could not address how consistently any of these conditions were being served from state to state.
An encouraging NEILS finding is that, for children with some conditions, disability and delay identified before 36 months are transitory. A sizable percentage of children who received EI services had problems that resolved as the child grew older. NEILS found that 16% of the children served in EI programs left the program before they turned 36 months of age (although some of these departures may been because the family no longer wanted to participate). Another 20% continued until 36 months, but did not receive additional services (although some of these children were on waiting lists for services). More than one-third (37%) of former EI participants did not receive preschool special education services. In

5-4
kindergarten, 42% of former EI participants did not receive special education services (10% had a disability or condition, but did not receive services; 32% did not have a disability). Children with delays and risk conditions were more likely than children with diagnosed conditions not to receive special education services in kindergarten, but some children in all of the eligibility categories no longer needed services by kindergarten. Some of the children who did and did not receive special education services in kindergarten appeared to be doing quite well, but this was especially true for those who were not receiving special education. For instance, kindergarten teachers indicated that 82% of the former EI participants without a disability in kindergarten had thinking and reasoning skills that were normal for their age. A comparison of these children’s literacy and numeracy skills with those of the general population of kindergarteners around the country showed comparable performance. These data are especially important because they refute the reasonable hypothesis that, even though these children are not receiving special education, they are not doing well and are likely to need special education in the future. On the contrary, by many indicators, their performance in kindergarten appears quite solid.
More research is needed before we can fully understand the possible long-term outcomes of all of the developmental and health-related problems that can occur in the first 36 months of life. Some conditions have been better researched than others, but in general much is still to be learned. NEILS documents that some children have conditions that will require services only for a short period. One of the implications of the diversity of children served in EI and the transitory nature of some conditions is that EI addresses fundamentally different issues for different groups of children and families. For some families, EI provides services and supports that help them deal with the needs of a child with a life-threatening health problem. For other families, EI helps them cope with the implications of their child’s severe disability and is the first service system in a series of many systems that the family will encounter. We know that such children will, with a high level of certainty, require special education services through high school graduation. For these children, EI seeks to enhance their development and prevent more serious secondary consequences associated with the condition. For other families, EI provides the extra support and assistance needed to work through what can turn out to be a time-limited developmental challenge. For these families, EI functions as a prevention program, providing services early in the child’s life to offset the possible need for services later. The problem is addressed, and the child never needs services again. For other children, the long-term outcomes may fall somewhere between needing lifelong services and never needing services again. Problems may re-occur, and the child’s functioning may improve but remain borderline with needs reemerging at older ages.
We emphasize the transitory nature of disability here because this particular finding requires examining how we think about EI goals. As many people have correctly

5-5
come to think of EI, it is a program trying to offset long-term consequences of disability or delay for children with moderate or severe conditions that appear early in life. But it is also an intervention and prevention program for children with conditions that can be resolved. In addition, it can serve as a program to monitor uncertain developmental progress for some children who have early mild difficulties that may or may not turn out to be significant disabilities as the child ages. In the absence of much needed research on the developmental course for all the conditions diagnosed before age 3, it would seem to be sound policy to continue to provide services and supports to families of children who present a variety of problems, recognizing that these services can contribute to eliminating or reducing the need for services in the future. A critical policy question for states thus continues to be who should be served in EI. Setting more stringent eligibility requirements means that children with milder impairments will not be eligible for services, but these may be the very children for whom EI services could eliminate the need for services in the future. Additional analyses of the NEILS data set will further elucidate which children are likely to be experiencing good outcomes at kindergarten.
Communication Skills: A Widespread and Persistent Developmental Problem
One notable exception to the extensive diversity among the population of children served in EI is the widespread presence of communication problems. Children in EI differ in many ways, but a large percentage begin EI with communication problems and, for many, these problems continue through kindergarten. NEILS findings show that 41% of the children were eligible for EI because of a speech or communication delay. For children between 24 and 36 months of age, the figure was 75%. At the beginning of EI services, when parents of children older than 12 months were asked about their child’s ability to make his or her needs known, 41% indicated the child had a little trouble, and 29% reported a lot of trouble or that their child did not communicate at all. Not surprisingly, given this information, NEILS found that more than half (52%) of the children in EI received speech therapy, the most frequently provided service after service coordination. More children could have been receiving some kind of language intervention through other providers as well, but NEILS has no data on the targets of such intervention.
By 36 months of age, children in the general population are well on their way to becoming effective communicators. For instance, a 21 month old generally has about 50 words in his or her vocabulary. By 36 months of age, only 48% of former EI participants were reported to have a 50-word vocabulary. Children who are 25 months old will typically use at least 2- to 3-word sentences. By 36 months of age, that was true for 58% of the EI graduates. By 35 months, children in the general population can give their first names, which only 55% of the EI graduates at 36 months could do well. Parents reported that 42% of the EI participants

5-6
communicated as well as other children at 36 months, 36% said their child had a little trouble, and 22% indicated a lot of trouble or no communication at all. The good news is that 30% of the parents of children older than 12 months at entry reported their children were functioning higher at 36 months than at entry, with only 15% reporting a decline. By the end of EI, children’s communication skills had improved, but many children were still having problems.
At kindergarten, parents were again asked to report on their children’s communication skills, and 60% reported their child communicated as well as other children (up from 42% at 36 months). Teachers reported 60% of the former EI participants had skills that were normal for their age with regard to understanding others and 50% with regard to communicating with others. Among kindergarteners receiving special education, their teachers reported 40% had age-expected skills with regard to understanding others, but only 28% had those skills in regard to communicating with others. More than one in five (22%) were reported to be receiving special education primarily for a speech or language problem, and three out of four were reported to have a speech or language problem as one of their disabilities. Speech therapy was thus by far the most frequently reported service of former EI participants in kindergarten; 84% of children with Individualized Education Plans (IEPs) received that service.
These data indicate that communication problems are widespread among children receiving EI services and that for many the problems persist throughout early childhood. Communication skills are important for many aspects of successful functioning in early childhood: for interacting with adults to learn about one’s world, for interacting with peers and forming friendships, for meeting basic needs such as asking for food, and for having the basis for acquiring literacy skills in elementary school. Consequently, impaired communication can easily lead to problems in other areas, including behavior, as discussed in the next section. NEILS findings underscore the importance of intervening early and effectively to improve children’s communication skills. They also highlight the importance of supporting families in promoting language development and communication. The findings reinforce the need to have EI professionals who are trained to address communication needs. Although this is the specialty area of speech therapists, communication needs are so widespread and have such potentially powerful impacts that children and families would be well served if a focus on enhancing communication skills was embedded in many interactions between EI professionals and children and families.
Much remains to be learned about how to interpret delays in communication skills in infants and toddlers. Some children can catch up without intervention. For others, a communication delay is the first marker of far more serious emerging developmental problems. We know that waiting for children to catch up can be a risky strategy, but intervening unnecessarily is a costly both for the program and the family. The practice of intervention will continue to evolve as the science behind

5-7
communication development and intervention practices progresses; for the interim, however, NEILS data suggest that addressing early communication problems should lie at the heart of EI. Interestingly, although communication problems are common among former EI participants, many children with those problems do not receive EI services. Of all the 6 years olds in the United States receiving special education, a communication problem was the primary disability for 62%, compared with only 22% of the former EI participants in kindergarten. NEILS findings reinforce the importance of policies and programs that focus on communication skills in the early childhood years—assisting parents and other caregivers to promote language development; assisting pediatricians, caregivers, and families to recognize possible delays; building a qualified work force to address delays in young children; and establishing high-quality language-rich early childhood programs for all children to prevent delays.
Social and Emotional Problems: Present yet Invisible
When EI providers were asked to indicate the reason why a child was eligible for EI, a social or behavioral problem was indicated for only 4% of the children. When parents were asked about their child’s behavior at this same time point, we learned that:
• 25% of the children were jumpy or easily startled.
• 14% were quiet and passive.
• 19% were not easily involved in everyday things.
• 22% were easily distracted by sights and sounds.
• 18% did not show interest in nearby adults.
• 25% had trouble playing with other children.
• 11% were often aggressive with other children.
These responses do not necessarily indicate that the children had problems of sufficient scope to warrant a clinical diagnosis, but they do suggest that some of the children had behavioral or social interaction difficulties that merited attention. Furthermore, 32% of the families reported they often had a difficult time in figuring out what to do about their child’s behavior.
As discussed in more detail in a later section, NEILS found that EI is made up primarily of some combination of service coordination, general intervention, speech, occupational, or physical therapy. The study also found that EI services (excluding service coordination) are provided by some combination of a special educator or a child development specialist or the professional corresponding to the three primary therapies. Given EI’s current providers, it is reasonable to speculate that EI as a field lacks personnel with the necessary training or background to identify or address

5-8
issues related to socioemotional behavior. Infant mental health is a relatively new field, with a limited number of well-trained practitioners. The NEILS findings suggest that children and families would benefit from having EI programs acquire the expertise to take a broader look at children’s functioning. All EI personnel working directly with children and families would benefit from at least introductory training in identifying and addressing socioemotional difficulties in infants and toddlers. The Part C legislation acknowledges the importance of social and emotional development by, for example, requiring that the Individualized Family Service Plan (IFSP) include the child’s present levels of development in five areas, including social or emotional development. That legal requirement, however, may not suffice to alert providers to needs in this area if they do not bring the specific clinical expertise required to identify social or emotional problems or if they are not using assessment tools reflecting the latest developments in infant mental health, or both.
NEILS outcome data at 36 months and at kindergarten converge to paint a picture of a minority of children who participated in EI who continue to have a variety of different socioemotional or behavior-related challenges. At 36 months, 32% of parents reported that their child was highly distractible, 13% indicated the child did not persist at tasks, 10% reported the child’s behavior was very challenging, and 5% described their child as very withdrawn. A consistent predictor related to being in one of these groups at 36 months was having additional problems besides a communication delay and also having trouble communicating, reinforcing the link between communication difficulties and social interaction problems. Substantial research supports this link. At kindergarten, teachers reported that 60% of EI graduates were normal for their age with regard to behavior and that 54% were normal with regard to social skills. The corresponding figures for children with IEPs in kindergarten were 46% and 36%. Children’s social skills are reflected in their friendships. Parents reported that 51% of the former EI graduates with IEPs had been invited to another child’s house to play in the past week compared with 76% of those without IEPs.
NEILS findings present a strong message about the importance of identifying and addressing socioemotional issues early to assist parents in caring for their children and to provide children with the best chance of achieving success in preschool, kindergarten, and later in school. Even at these young ages, behavioral differences are emerging. Some of these differences may result in challenges for the family and have the potential to negatively affect the parent-child relationship both immediately and in the future. These same behaviors present difficulties for young children in child care and other group settings. Challenging behaviors or other possibly problematic behaviors such as being overly distractible may be early indicators of emerging problems. Families need support in meeting the specific needs of their child and in preventing the development of undesirable and avoidable secondary negative outcomes. Professionals working with families of

5-9
young children with disabilities and developmental delays need to be aware of the different kinds of behavioral challenges young children may present. They also need to have the knowledge and skills to identify behaviors that are outside the boundaries of typical development and to help families effectively address a range of behavioral challenges.
Understanding the Impact of Health
NEILS data, perhaps not surprisingly, showed that infants and toddlers in EI were less healthy than infants and toddlers in the general population. Specifically, at entry into EI only 62% of infants and toddlers in EI were rated as in excellent or very good health compared with 84% of children younger than 4 years of age in the general population. Conversely, at entry, infants and toddlers in EI were eight times more likely to be rated in fair or poor health (16% versus 2%). The relatively high proportion of children in EI in poor health at entry to services was not surprising because many infants served by EI face medical challenges related to their birth history. One-third (32%) of all children receiving EI services were born at LBW, and many of the diagnosed conditions that make children eligible for EI services have associated health problems. It is somewhat surprising that the percentage of children in the EI population experiencing poor health, although decreasing, continued to be much higher than that for the general population through kindergarten. By 36 months, 65% of children in EI were rated in excellent or very good health, with 13% rated in fair or poor health. By kindergarten, these percentages were 71% and 11%, respectively.2
As is true for the general population of young children, children in EI who were minority status (African-American and Hispanic) and living in poverty were more likely to be in poor health. A child’s health status at EI entry predicted health status at 36 months, and for 64% of the children no change in health status occurred between the two points. Children who experienced a decline in health status between entry and 36 months (15%) were more likely to be minority children, those who entered at younger ages, those with mothers with lower levels of education, and those living in lower income households. Children with poor health at entry to EI were more likely to display negative behaviors when they began EI services. The relationship between health and behavior also existed at kindergarten. Poor health at entry to EI was associated with lower teacher ratings for cooperation and assertion and with higher ratings for problem behaviors. One of the more surprising and troubling NEILS findings was that families of children in poor health were less likely to experience positive family outcomes at 36 months of age. The child’s health status at entry and at 36 months was related to having less positive family outcomes when the child was 3.
2 Over the course of collecting data for NEILS, 83 of the 3,338 children being followed in the study died,
most before age 3.

5-10
These findings suggest that children with serious chronic health problems and their families constitute a unique subgroup within the population of children and families served by EI and that their special circumstances merit more intense study. We can assume that during their time in EI these families encounter numerous professionals, including a number of medical specialists. Effective service coordination may thus be especially important for these families. The care demands of their children may be unusually taxing, suggesting the importance of the availability of respite care. Because these families could be experiencing less positive family outcomes for numerous reasons, EI programs need to understand those reasons to serve these families better. The relationship between poor health and subsequent negative behavior also warrants further study so that those working with the child and family can help the family address some of the challenges presented by the child’s health problems. Research has already documented the added stresses (time, emotional, financial) on families with a young child with significant health problems, but more research is needed on defining appropriate program models to serve children in less than optimal health and to support their families better. NEILS data suggest that current programs are not serving this group as well as they could.
Poverty and Disability
Research has provided extensive documentation of the negative impacts of poverty on child development. Programs that have been created for young children or their families with the hope of breaking the link between poverty and poor outcomes include Head Start and Early Start at the federal level and the many state-operated preschool programs for children from low-income families. NEILS found that 27% of the families receiving EI had household incomes of less than $15,000 per year compared with 21% for the general population. Applying the federal poverty guidelines for 1998 to the data on income and size of household, 28% of the families participating in EI were determined to be at or below the poverty level, and another 23% were within 101% to 200% of the federal poverty level.
Children receiving EI services and living in poverty are likely to be at high risk for poor development, given they are both poor and have a delay or disability. Some of these differences manifest themselves at entry to EI. Children living in poverty were less likely to receive services for only a speech and language delay (14% versus 27% for nonpoor children). They were more likely to have had a difficult birth history (prematurity, LBW, or staying in the hospital after birth, 57% versus 48% nonpoor). They were more likely to have been in fair or poor health (22% versus 12% nonpoor). They were more likely to have hearing problems and trouble using their limbs. Children receiving EI services who were in poverty were more likely to be African-American (41%) or Hispanic (22%).

5-11
Some of the differences between the children in EI from poor and nonpoor families continued at 36 months. More than one in five (21%) of the children who had received EI services and were living in poverty were in fair or poor health at 36 months compared with 8% of the nonpoor. Children living in poverty were less likely to have near age-level communication, motor, and cognitive skills at 36 months compared with nonpoor children. At kindergarten, children living in poverty were no more likely than nonpoor children to have an IEP, although they were less likely to have near-age-level communication and cognition skills. Furthermore, within the group of EI graduates who did not have an IEP in kindergarten, those who were living in poverty at entry to EI were less likely to have near-age-level communication and cognition skills.
The high proportion of children and families living in poverty served by EI programs is to be expected, given that research has shown low-income children are at increased risk for disability. For example, poverty is associated with poor birth outcomes, which in turn increase the likelihood of the child and family needing EI. Because NEILS has no data on children and families not served, the study has no way of knowing whether EI is reaching all children and families in poverty who might be eligible for services. However, the fact that EI programs are serving a high proportion of families living in poverty is a positive reflection on EI’s efforts to locate and serve these higher risk families. More research is needed on who is not being reached by EI and why they are not.
One of the biggest questions raised by the large number of low-income families is how best to deliver effective services to these families. As reported elsewhere in this report and discussed in the next section, EI typically entails about an hour-long home visit once a week. Is that enough service to produce good outcomes, especially given that these children face the risks associated with both disability and poverty? Is this an effective model of service? Service coordination was written into the law in recognition that families often have to interface with multiple professionals, frequently from different early childhood and family support agencies. For families living in poverty, some of these professionals are highly likely to be outside of the EI system. Does EI service coordination encompass these professionals? How are EI programs coordinating with other programs in their community designed for low-income families such as Early Head Start? Much more needs to be learned about how families with young children with a delay or disability who also are living in poverty are being connected to EI, how they are being served, and how they should be served. NEILS has demonstrated that these families constitute a sizable segment of families receiving EI services and has confirmed that the combination of disability and poverty lowers the odds for good outcomes.

5-12
The Nature of EI Services
The Part C legislation specifies the types of services that constitute EI, but it also gives states great latitude in how they design their EI systems. EI services have many different characteristics (e.g., setting, type, frequency, duration) that make it difficult to provide a simple description of EI as currently provided. NEILS data about EI services addressed many of these characteristics, and although what any given child and family received varied significantly, some clear patterns emerged overall.
NEILS found that EI services are predominantly delivered in the home, that the core set consists of six services, and that most families receive two, three, or four services. The most frequent setting for EI services was in the home or home of a child care provider (76%), with clinics and center-based EI programs the next most frequent settings (28% for each of these settings). EI services consist mainly of service coordination (for 78% of families served); speech/language therapy (52%); special instruction for the child (43%); occupational therapy (39%); developmental monitoring (37%); and physical therapy (37%). No other service was provided to more that 19% of families. Most families received two (18%), three (19%), or four services (17%), but nearly one-fourth (26%) received six or more services. The most common combinations included service coordination, plus special instruction for the child and/or one or more therapies.
The amount of service is a characteristic that receives much attention because it drives cost and because of a widely held, but not well-researched assumption, that more service is better. NEILS data show that the median amount of scheduled service was 1.5 hours per week. Most families (63%) were scheduled to receive 2 hours or less per week of total service. Only 16% were scheduled to receive more than 4 hours per week. Similar to data about other early childhood programs and services (e.g., home visiting programs), families missed about one-fourth of their scheduled services. Taken together, the data on scheduled and missed services show that most families received relatively small amounts of face-to-face service. These numbers refer only to services provided directly to the child or family. Families also receive services in other ways; for example, when a service coordinator makes a call on their behalf. We also know that providers spent far more than an hour to deliver an hour of service because of the time required for other activities such as transportation, planning, and completing paperwork.
One other characteristic of EI services—the focus of service—makes this small amount of service worrisome. Providers were asked to report on whether the service focused on the child alone, the parent alone, or both the child and parent. Providers reported that home-based services focused on both the child and adult for 55% of the families; for 44% of families, however, the services focused only on the child. This finding is disturbing because recommended practice in EI is to work with the parent on how to support the child’s development so that optimal and/or
5-13
therapeutic interactions can be incorporated into the child’s daily activities. Such a limited amount of direct intervention with the child alone is unlikely to have much effect on the child’s development.
NEILS data about the EI providers showed that families are working with the kinds of professionals who provide the kinds of services mentioned above; that is, service coordinators; speech, physical, and occupational therapists; child development specialists; or special educators. Most families worked with two or three professionals; however, 13% worked with six or more professionals. Families receiving EI services were likely to work with a professional who was: female; white; of any age, but older if a nurse or special educator, and younger if a speech language pathologist or service coordinator; unlikely to speak a language other than English; highly educated (often with a bachelor’s degree or higher); and with varying years of EI experience. Professionals providing EI services generally work for a public or private agency, although some are self-employed.
NEILS examined average expenditures for services and how expenditures vary for children with different types of needs. The average total expenditure for the entire length of time the child and family received EI services was $15,740. Given that the average child received services for 17.2 months, the average monthly expenditure was approximately $916. Not surprisingly, expenditures varied for different types of children receiving EI services. For four disability-related categories—risk condition only, communication delay only, developmental delay with no diagnosed condition, and diagnosed condition—the average monthly expenditures for each category were $549, $642, $948, and $1,103, respectively. It is noteworthy, however, that expenditures varied considerably within each of these four categories and that the costs for most children within each category were less than the average.
When expenditures were examined along with child outcome at 36 months, the findings indicated a predictable pattern: expenditures for children with the most significant disabilities were highest, and those children had the poorest outcomes. This relationship is consistent with other cost studies of health and human services: the most resources are expended on those with the greatest needs (e.g., health care costs for severe, life-threatening, and chronic health conditions; social service costs for children in the child welfare system). It is also important to note that these expenditures are far lower that the extraordinarily high costs of institutionalization that were incurred for children with severe disabilities in the past.
NEILS data provide preliminary information on the basic structure of EI services as they were delivered in the late 1990s. NEILS was limited in the kind of information about services produced, given that the data were collected through interviews and surveys. The essence of EI is the interaction between the family and the professional, and information at that level was not available. We do not know from NEILS what providers were trying to address through their interventions or how they were doing it (although we do know that far too many were working with just

5-14
the child). Nor do we know how well services were delivered. We also know little about if and how professionals worked as a team, which is another core tenet of EI recommended practice. NEILS data on families’ perceptions of their services and their providers indicate that families were very pleased with numerous aspects of service delivery—an important and reassuring finding. It does not necessarily mean that the services were of high quality, however, because families had no standard against which to evaluate how well professionals provided services. Understanding how Part C is being implemented requires more in-depth information about the nature of the interactions that constitute EI services. Similarly, to improve programs, more research is needed on what constitutes high-quality EI service and how to ensure uniformly high quality for all families. From NEILS, we know that a core of services constitutes EI as currently practiced and that the amount of face-to-face time that families spend with providers is surprisingly short for many families. Future studies need to examine the nature of EI services in far more depth.
EI as a Program for Families
From its inception, the Part C program was predicated on the assumption that it should benefit families. The legislation stated “there is an urgent and substantial need ….to enhance the capacity of families to meet the special needs of their infants and toddlers…. “(P.L. 99-457, 1986, Sec 671). The legislation was based on research that documented the challenges faced by families of young children with disabilities, including having to deal with multiple service agencies. The legislation acknowledged that families needed support to care for their children and to promote their children’s development and learning. Part C required that families be full partners in planning and implementing EI services to address their needs and concerns, and that services be family-centered and coordinated. In short, the legislation that created Part C recognized that to address the needs of infants and toddlers with special needs effectively, programs need to support their families. Accordingly, NEILS set out to look at how well programs were providing that support.
To examine outcomes for families who participated in EI, the NEILS research team identified a set of family outcomes and then developed interview items to capture the outcomes identified (Bailey et al., 1998). This work drew on existing research and addressed the following questions:
• Did the family see EI as appropriate in making a difference in their child’s life?
• Did the family see EI as appropriate in making a difference in their family’s life?
• Did the family have a positive view of professionals and the special service system?
• Did EI enable the family to help their child grow, learn, and develop?

5-15
• Did EI enhance the family’s perceived ability to work with professionals and advocate for services?
• Did EI assist the family in building a strong support system?
• Did EI help enhance an optimistic view of the future?
• Did EI enhance the family’s perceived quality of life?
This set of guiding questions, in effect, reflected a synthesis of what was known about possible effects of EI on families and desired outcomes.
NEILS data show excellent positive outcomes for families overall, beginning shortly after their children entered EI at the time of their initial IFSPs, continuing through 36 months when most children transition out of EI, and remaining highly positive when the children entered kindergarten. At 36 months and again at kindergarten entry, most families reported that they knew how to: care for their child’s basic needs; help their child grow, learn, and develop; handle their child’s behavior; work well with professionals; find needed services; attain needed help and support from relatives and friends generally and in dealing the challenges of having a child with a disability or special need; take part in community activities in which they desired to participate; and work and play well together as a family. Contemporary and projected ratings of families’ quality of life at 36 months and at kindergarten showed that families were quite optimistic about how they were faring. Families saw the support and information they received from EI as helpful. They also viewed EI professionals as supportive and respectful.
From the discussion above about the transitory nature of disability, it follows that EI provides support services for some families who will never need those services again. For other families of children with life-long disabilities and long-term needs for special services, EI provides the first of many encounters with service systems. Whether EI services are the beginning of a family’s ongoing relationship with disability services or the only such services they will ever receive, these positive family outcomes suggest that EI has realized the legislative intent of being a program that addresses the needs of families with some areas needing improvement, as discussed below. NEILS findings suggest the legislation was correct in creating a program for families and that establishing EI as a family-centered enterprise was sound policy. For families of infants with significant disabilities or serious medical conditions, the benefits of EI, especially early on, may support the family in adjusting to the needs of its child. Amid the increasing focus on child outcomes, it is easy to lose sight of the substantial benefits that EI provides to families.
Within this context of overall positive family outcomes, two notable exceptions need to be addressed. First, even though the majority of families reported positive outcomes, low-income and minority families were less likely to do so. It is important to note, however, that very few families gave negative ratings to the family outcome

5-16
items; instead, the low-income and minority families’ ratings were just less positive than those of other families. Nevertheless, these findings suggest that greater attention needs to be paid to EI accessibility and appropriateness for families from different backgrounds. This issue will grow in significance for EI as the population of the country becomes more diverse. Second, two outcomes were not as positively rated as other outcomes and may warrant closer scrutiny in future research and/or modifications of service delivery: (1) some parents were not confident about their ability to deal with their child’s behavior, and (2) some were not able to take part in community activities as much as they would have liked. As noted above, the finding about behavior suggests that EI may not be doing as good a job as it could in assisting families with behavioral and early mental health issues. The finding about community participation may reflect the more general demands of being the parent of an infant or toddler, but it may also suggest that EI may need to discuss desired community activities more explicitly and help families participate in those activities.
Despite these areas in need of improvement, NEILS data clearly show that EI is highly regarded by the participating families. Families see the program as having a positive impact on their children and on their families. For those families who will need continuing special services for their children, as well as those who will not, EI provides with a strong foundation of competencies, confidence, and hope for the future.
Conclusion
NEILS was designed to be a descriptive study of those served in the EI programs supported through Part C of IDEA, the services they receive, the cost of those services, and the outcomes that children and their families experience. This report has presented answers to these questions. Like so many studies of large social programs, NEILS has left a number of important questions unanswered and also raised other questions. NEILS was not intended to assess the effectiveness of EI. Given that all children in the study participated in EI, it was not possible to unequivocally attribute the outcomes experienced at 36 months or at kindergarten to the EI services they received. The study documented that children who receive Part C services experienced a range of outcomes, including a sizable percentage of children who were doing as well as their same-age peers by kindergarten. The study also verified what was already known without the data: some children with disabilities identified in the first 3 years of life are likely to experience significant challenges at every stage of their lives. NEILS documented that the great majority of parents were extremely pleased with their EI experiences. Furthermore, families who participated in EI reported many positive outcomes, including being able to care for their children and advocate for them with professionals, both when the children were in EI and later when they were in kindergarten. Again, it is not

5-17
possible to say for sure that EI was responsible for these outcomes, but findings about how families perceived themselves and EI programs were very encouraging.
NEILS was a first step in understanding how our national policy of providing EI services for families of very young children with special needs is unfolding. Much more information about the program is needed to ensure that the legislation is fulfilling its intended objectives. A national study examining similar questions needs to be repeated on a regular basis because we do not know how much of what was studied in NEILS has changed. The NEILS families participated in EI in 1997 through 2001. In the intervening years, policy changes at the state level (e.g., changing eligibility definitions and funding formulas), changes at the federal level (e.g., the Child Abuse Prevention and Treatment Act), and changes in the broader early childhood context (e.g., more state-level early childhood initiatives and policy attention to early developmental screening) may have had substantial impacts on the nature of who is served in EI and what they receive.
Results-based accountability in early childhood has increased the emphasis on outcomes since NEILS began. Accordingly, plans are under way in all states to develop systems for regularly collecting information about child outcomes for children participating in Part C programs. When these state systems have matured sufficiently to produce valid and reliable data on child outcomes, some of the answers to the outcomes questions NEILS has addressed will become available at the state level. Child outcomes data, however, are only part of what will be needed for setting policy and improving programs. To fully understand the impact of Part C of IDEA, more in-depth information about how the law is being implemented nationally will be required. NEILS has provided a general picture of what constituted EI in this country at a given point in time, but NEILS has not addressed critical questions such as who receives high-quality EI. It is hoped that future research continues to describe what EI is and provides much needed information on the quality of services being provided. Program administrators and policy makers need comprehensive data about services and outcomes to make this important enterprise progressively better for future generations of young children with delays and disabilities and their families.


A-1
Appendix A NEILS Recruitment and Return Rates for Children Receiving Early Intervention
Services
Sample Recruitment
Data Element Number sampled Number
participating Percent States 20 20 100 Counties 97 94 97 Programsa 182 Children who entered early intervention (EI) during recruitment (Form A data) 5,668 5,668 100 Children eligible for the study 4,867b NA Children participating in the study 4,867 3,338 68.6 aThe total number of programs in the selected counties was never tallied, but we estimate that fewer than 10 programs across the country declined to take part in the study. Of the 182 programs that participated in the study, 175 returned data during the recruitment period. bYounger than 31 months, English- or Spanish-speaking parent/guardian , did not have a sibling already participating in EI. Note: Demographic data were collected for the 5,668 children who entered EI, allowing the 3,338 whose families consented to participate to be weighted to account for nonresponse.

A-2
Participation/Return Rates Instrument Number possible Actual Percent
Enrollment interview/mail questionnaire
- Interview only - Interview or mail
questionnaire - Interview, mail
questionnaire, or some items from the enrollment interview collected in a later interview, weighted and used for Enrollment Family Interview (EFI) analysis
3,338
33,38
3,338
2,975
3,055
3,200
89.1
91.5
95.9
First interim interview 2,047 1,629 79.6 Second interim interview 1,058 762 72.0 36-Month interview/mail questionnaire
- Interview only - Interview or mail
questionnaire
3279
3,279
2672
2,758
81.5
84.1 Service Record 1c 3,338 2,820 84.5 Any service data 3,338 2,968 88.9 Complete service data 3,338 1,949 58.4 Average percentage of individual service datad - - 75.1 Service provider survey 4,851 2866 59.1 Program director survey 1,213 659 54.3 Kindergarten interview/mail survey
- Interviews - Mail questionnaires - Interview or mail
questionnaire - Cases with at least one
interview or questionnaire - Cases used for
Kindergarten Family Inter view (KFI) analysis, selected as being the kindergarten year
3,118e
3,118
3,118
2,549 f 128 f
2,677 f
2,356
2,298
75.6
73.7
Kindergarten teacher survey - Surveys for which a
teacher’s name was provided that could be used in analyses
1,902
1,581
83.1
cService Records were sent every 6 months. The complete number of Service Records varies across children from 1 to 6. depending on how long the child was in EI (e.g., a child who stayed in EI less than 6 months would have only one Service Record). The analyses are based either on the first Service Record or the service history for the child’s time in EI.

A-3
dThis is the average percentage across children with service data available. If a child had six of six possible forms, the child’s percentage would be 100%. A child with two of six possible forms would have a percentage of 33%. The average of the percentages for all children was 75.1%, meaning the average child had 75.1% of the Service Records he or she was supposed to have. eEighty-three children had died by kindergarten. Another 137 were either lost to follow-up or withdrew from the study. fBecause families were contacted the year the child was age-eligible for kindergarten and because not all children entered kindergarten on time, some families were interviewed in successive years until the child entered kindergarten. Those cases entailed more than one interview or mail questionnaire. There were 2,354 initial interviews/mail questionnaires at the time the child was age-eligible for kindergarten, 311 next-year interviews/mail questionnaires, and 12 interviews/mail questionnaires with families contacted a third time.


B-1
Appendix B NEILS REPORTS AND PAPERS
NEILS Peer-Reviewed Publications
Bailey, D. B., Hebbeler, K., Scarborough, A., Spiker, D., Mallik, S., & Simeonsson, R. J. (2004). First experiences with early intervention: A national perspective. Pediatrics, 113(4), 887-896.
Bailey, D., Hebbeler, K., Spiker, D., Scarborough, A., Mallik, S., & Nelson, L. (2005). 36-month outcomes for families of children with disabilities participating in early intervention. Pediatrics, 116, 1346-1352.
Bailey, D. B., McWilliam, R. A., Darkes, L. A., Hebbeler, K., Simeonsson, R. J., Spiker, D., & Wagner, M. (1998). Family outcomes in early intervention: A framework for program evaluation and efficacy research. Exceptional Children, 64, 313-328.
Hebbeler, K., Levin, J., Perez, M., Lam, I., & Chambers, J. (manuscript in preparation). Expenditures for early intervention services.
Hebbeler, K., & Spiker, D. (2003). Initiatives on children with special needs. In J. Brooks-Gunn & L. Berlin (Eds.), Early child development in the 21st century: Profiles of current research initiatives (pp. 269-325). New York: Teachers College Press.
Raspa, M. J., Bailey, D. B., Scarborough, A. A., & Hebbeler, K. (manuscript in preparation). National patterns of early intervention services for children with disabilities and their families.
Robinson, J. B., Scarborough, A. A., & Hebbeler, K. M. (2006). Children with hearing problems receiving Part C early intervention services. Manuscript submitted for publication.
Scarborough, A. A., Hebbeler, K. M, Simeonsson, R. J., & Spiker, D. (in press). Caregiver descriptions of the developmental skills of infants and toddlers entering early intervention services. Journal of Early Intervention.
Scarborough, A. A., Hebbeler, K. M., & Spiker, D. (2006). Eligibility characteristics of infants and toddlers entering early intervention in the U.S. Journal of Policy and Practice in Intellectual Disabilities, 3(1), 57-64.
Scarborough, A. A., Hebbeler, K. M., Spiker, D., & Simeonsson, R. J. (in press). Dimensions of behavior of toddlers entering early intervention: Child and family correlates. Infant Behavior and Development.
Scarborough, A. A., Snyder, E. H., Hebbeler, K. M., & Nelson, L. (2006). Children receiving Part C services: Child care and maternal employment. Manuscript submitted for publication.

B-2
Scarborough, A., Spiker, D., Mallik, S., Hebbeler, K., Bailey, D., & Simeonsson, R. (2004). A national picture of children and families entering early intervention. Exceptional Children, 70(4), 469-483.
Simeonsson, R. J., Scarborough, A. A., & Hebbeler, K. M. (2006). ICF and ICD codes provided a standard language of disability in young children. Journal of Clinical Epidemiology, 59, 364-372.
Snyder, E. H., Scarborough, A. A., & Hebbeler, K. M. (2006). Socioeconomic status of children and families receiving Part C early Intervention services. Manuscript submitted for publication.
Spiker, D., Hebbeler, K., & Mallik, S. (2005). Developing and implementing early intervention programs: Children with established disabilities. In M. J. Guralnick (Ed.), A developmental systems approach to early intervention: National and international perspectives (pp. 305-349). Baltimore: Paul H. Brookes Publishing.
Spiker, D., & Hebbeler, K. (1999). Early intervention services. In M.D. Levine, W.B. Carey, & A.C. Crocker (Eds.), Developmental-behavioral pediatrics (3rd Ed.) (pp. 793-802). Philadelphia: W. B. Saunders..
Spiker, D., Hebbeler, K., Wagner, M., Cameto, R., & McKenna, P. (2000). A framework for describing variation in state early intervention systems. Topics in Early Childhood Special Education, 20, 195-207.
NEILS Annual Report to Congress Chapters
U.S. Department of Education, Office of Special Education Programs. (2000). Characteristics of children and families entering early intervention. Chapter in the 22nd Annual Report to Congress on the Implementation of the Individuals with Disabilities Education Act.
U.S. Department of Education, Office of Special Education Programs. (2001). Services received by children and families entering early intervention. Chapter in the 23rd Annual Report to Congress on the Implementation of the Individuals with Disabilities Education Act.
U.S. Department of Education, Office of Special Education Programs. (2001) Results experienced by children and families entering early intervention. Chapter in the 23rd Annual Report to Congress on the Implementation of the Individuals with Disabilities Education Act.
U.S. Department of Education, Office of Special Education Programs. (2001). Characteristics of children and families entering early intervention. Chapter in the 23rd Annual Report to Congress on the Implementation of the Individuals with Disabilities Education Act.
U.S. Department of Education, Office of Special Education Programs. (2002). Results experienced by children and families 1 year after beginning early intervention. Chapter in the 24th Annual Report to Congress on the Implementation of the Individuals with Disabilities Education Act.

B-3
NEILS Technical Reports Prepared for the Office of Special Education Programs
Bailey, D., Hebbeler, K., & Scarborough, A. (2002). Families’ first experiences with early intervention. Menlo Park, CA: SRI International.
Bailey, D., Hebbeler, K., & Scarborough, A. (2002). National Early Intervention Longitudinal Study: Families’ first experiences with early intervention. NEILS Data Report No. 2. Menlo Park, CA: SRI International.
Bailey, D., Scarborough, A., Hebbeler, K., Spiker, D., & Mallik, S. (2004). The National Early Intervention Longitudinal Study. Family outcomes at the end of early intervention. NEILS Data Report 6. Menlo Park, CA: SRI International.
Hebbeler, K., Spiker, D., Mallik, S., Raspa, M., & Scarborough, A. (2006). Characteristics of early intervention services. Unpublished Manuscript.
Hebbeler, K., Spiker, D., Mallik, S., Scarborough, A., & Simeonsson, R. (2003). Demographic characteristics of children and families entering early intervention. Menlo Park, CA: SRI International.
Hebbeler, K., Spiker, D., Mallik, S., Scarborough, A., & Simeonsson, R. (2003). The National Early Intervention Longitudinal Study. Demographic characteristics of children and families entering early intervention. NEILS Data Report 3. Menlo Park, CA: SRI International.
Hebbeler, K., Spiker, D. Wagner, M., Cameto, R., & McKenna, P. (1999). State-to-state variations in early intervention systems. Menlo Park, CA: SRI International.
Hebbeler, K., & Wagner, M. (1998). The National Early Intervention Longitudinal Study (NEILS) design overview. Menlo Park, CA: SRI International.
Hebbeler, K., Wagner, M., Spiker, D., Scarborough, A., Simeonsson, R., & Collier, M. (2001). The National Early Intervention Longitudinal Study (NEILS): A first look at the characteristics of children and families entering early intervention services. NEILS Data Report No. 1. Menlo Park, CA: SRI International.
Levin, J., Perez, M., Lam, I., Chambers, J. G., & Hebbeler, K. (2004). Expenditure study. Menlo Park, CA: SRI International.
Spiker, D., Hebbeler, K., Mallik, S., Scarborough, A., Simeonsson, R., & Bailey, D. (2006). Functioning, developmental skills, and behavior of children entering early intervention. Unpublished Manuscript.
Spiker, D., Hebbeler, K., Wagner, M., & Javitz, H. (2002). Sampling and weighting procedures: Enrollment form, family interview, service records. Menlo Park, CA: SRI International.
Spiker, D., Mallik, S., Hebbeler, K., Scarborough, A., Simeonsson, R., & Bailey, D. (2004). Birth history and health status of children entering early intervention. Menlo Park, CA: SRI International.

B-4
Spiker, D., Mallik, S., Hebbeler, K., Scarborough, A., Simeonsson, R., & Bailey, D. (2004). National Early Intervention Longitudinal Study: Birth History and Health Status of Children Entering Early Intervention. NEILS Data Report 5. Menlo Park, CA: SRI International.
Spiker, D., Scarborough, A., Mallik, S., Simeonsson, R., Hebbeler, K., & McWilliam, R. (2004). The National Early Intervention Longitudinal Study. Functional and behavioral characteristics of children beginning early intervention. Menlo Park, CA: SRI International.
Zercher, C., Spiker, D., & Hebbeler, K. (2006). Service providers for children in early intervention. Unpublished Manuscript.
Dissertations
Raspa, M. J. (2004). Patterns of early intervention services: Relationships with child and family characteristics, family satisfaction, and perceived impact (Doctoral dissertation, University of North Carolina, 2004). ProQuest Dissertations and Theses, AT 3156195.
Scarborough, A. A. (2001). Behavioral patterns of toddlers with speech language delay: The relationship with child, family and poverty. (Doctoral dissertation, University of North Carolina, 2000). Dissertation Abstracts International, Section A: Humanities and Social Sciences, 61 (11-A), 4339.