Embed Size (px)
Citation preview

THE INFLUENCE OF CONSULTING GROUPS ON TELEVISION NEWS
by
BETSEY P. HARDMAN, B.S.
A THESIS
IN
MASS COMMUNICATIONS
Submitted to the Graduate Faculty of Texas Tech University in
Partial Fulfillment of the Requirements for
the Degree of
MASTER OF ARTS
August, 1990

e Betsey P. Hardman, 1990

ACKNOWLEDGEMENTS
I want to express my gratitude to the chairman of my committee.
Dr. Mark Harmon, for his encouragement and guidance in the preparation
of this study. I am especially grateful to him for his abundant
supply of patience and for always assuring me that there would be a
light at the end of the tunnel. I also want to express my
appreciation to the other members of my committee, Dr. Dennis Harp and
Dr. Jerry Hudson. I am grateful for their assistance and valuable
constructive criticism.
This thesis is dedicated to my family—Jody, Jennifer, Aubrey,
Morgan, and Blake Hardman—who suffered through two long years without
a wife/mother and supported me in my personal search for identity and
self-fulfillment. And to my parents—Mundy and Betsey Peale—who,
though unable to be with me to share the satisfaction of this
accomplishment, have always been my inspiration and deserve credit for
their many years of guidance and encouragement.
0.1

TABLE OF CONTENTS
ACKNOWLEDGEMENTS ii
LIST OF TABLES v
CHAPTER
I. INTRODUCTION 1
The Impact of Television 1
Three Research Perspectives 2
The Institutional Perspective 6
The Institutional Perspective and Television News 7
II. LITERATURE REVIEW 12
Agenda-Setting: An Overview .12
Broadcast News: An Agenda Built for the Gatekeeper . . . 13
The Television News Format 18
III. METHODOLOGY 26
IV. RESULTS AND DISCUSSION 33
Significant Cosmetic-Specific Variables 35
Natural Sound 35
Story Treatment 38
Anchor Two/Three-Shot 45
Anchor Tag 48
Reporter Stoop/Turn 50
Significant Content-Specific Variables 52
Story Length 52
Story Person 58
111

Geographic Orientation 58
Story Topic
V. SUMHARY AND CONCLUSIONS ^®
REFERENCES ^
APPENDIX ^^
IV

LIST OF TABLES
1. Natural Sound Percentages: Sub-Scunple Comparison 36
2. Natural Sound Percentages: Primo/Magid Comparison . . . . 37
3. Story Treatment Percentages: Sub-sample Comparison . . . . 39
4. Story Treatment Percentages: ARD/Primo Comparison . . . . 41
5. Story Treatment Percentages: Non-consulted/Consulted Comparison 43
6. Story Treatment Percentages: ARD/Non-consulted Comparison 44
7. Anchor Two- or Three-Shot Percentages: Sub-sample Comparison 46
8. Anchor Two- or Three-Shot Percentages: Consulted/ Non-consulted Comparison 47
9. Anchor Tag Percentages: Sub-sample Comparison 49
10. Reporter Stoop/Turn Percentages: Sub-sample Comparison . . 51
11. Story Length 53
12. Story Length Percentages: Sub-sample Comparison 55
13. Weather/Sports Report Length 56
14. Story Person Percentages: Sub-Scunple Comparison 59
15. Story Person Percentages: Magid/Non-consulted
Comparison 60
16. Geographic Orientation Percentages: Sub-sample
Comparison 61
17. Story Topic Percentages: Sub-sample Comparison 64
18. Story Topic Percentages: Magid/ARD Comparison 65
19. Violence/Crime, Accidents/Disasters Percentages:
Sub-sample Comparison 67

CHAPTER I
INTRODUCTION
The Impact of Television
A great deal of research conducted in recent years has
documented the rapid rise in popularity of television and how it
changed the way American families use their time. Recent statistics
reveal that the average viewer now watches television for nearly seven
hours a day. That translates to almost one-third of our waking hours
(The Roper Organization, 1989). For Americans who grew up with the
medium, television "is a given, a permanent fixture sitting, literally
and figuratively, in the middle of our lives" (Rapping, 1987, p. 5).
Both scholarly studies and rating surveys tend to agree that
television news has become the public's most important source of
information (Iyengar & Kinder, 1987). Rubin (1984), for example,
found that the most strongly endorsed reason for watching television
among 300 respondents from two Midwestern communities was
"information/learning." On a national level, the most recent Roper
survey (1989) indicates that 66% of those surveyed rely on television
more than any other medium as their primary source for news.
By 1980, whether the subject was Vietnam, black militancy, student rage, Watergate, Iran, Abscaun, assassination attempts or presidential primaries and elections, it could be argued that, to an extraordinary degree, until TV reported it, it had not happened. (Lesher, 1982, p. 7)
Local newscasts became just as important as network news
programs. Rapid growth in the 1960s of new TV technologies, which
permitted live, up-to-the-minute reports of breaking news, "enabled

stations to turn trivial local events into sensational colorful
dramas" (Rapping, 1987, p. 43).
Consequently, critics argue that "television messages have
become so familiar to us that they appear to be 'The Simple Truth'.
. . . In fact, we do not see the world as it is. We see it as TV
presents it to us" (Cross, 1983, p. 12).
The implication is that television newscasts have become "the
arena for public recognition of significant events" (Altheide, 1976,
p. 25) and require a new definition of information. When the salience
of news events is predominantly affected by what we see on broadcast
news, our whole fraune of reference becomes influenced by those whose
responsibility it is to transform events into news.
Three Research Perspectives
Traditionally, television news critics and scholars looked at
local television news selection in terms of audience perception and
directed us toward effects research. Following in the footsteps of
initial newspaper studies, the research literature on broadcast news
approached the subject of content from one of three perspectives:
agenda-setting, gatekeeping, and agenda-building.
Agenda-setting is an interactional process (DeFleur &
Ball-Rokeach, 1982). The media selectively choose topics and
information to present to the public. The public, in turn, sorts this
information in accordance with their own interests. The agenda-
setting perspective looks at local television news content in terms of

specific issues manifested at one time and later adopted by the public
in some measurable behavior, such as voting.
Agenda-setting is a useful technique for studying some passing
and limited effects of broadcast news content on the salience of
specific issues. However, it is too narrowly defined to be useful in
understanding local television news and fails to acknowledge the full
scope of the newscast. The content or agenda of local television news
is more than issues. Agenda may be influenced by the build-up of
topics over time, the amount of time given to a subject, the
cumulative development of a newscast theme, the manner of
presentation—all aspects of content beyond specific issues.
The second approach looked at local television news content from
the point of view of the gatekeeper—usually a news producer,
assignment editor, or news director—and how that gatekeeper exercises
news judgment. Gatekeeping research expanded the definition of the
local news agenda to encompass not only issues but also other aspects
of content, such as topic selection, story length, positioning, and
presentation. This approach recognized that someone must ultimately
exercise news judgment and make decisions involving all aspects of
local television news content.
Although gatekeeping was useful in developing a broader
definition of television news content, the research is limited by the
fact that it tends to view the gatekeeper as an independent authority.
In reality, many people, organizations, and institutional factors,
such as geography, station resources, and time, may influence what a

gatekeeper can do and what kind of news judgment he or she may make
(Harmon, 1989b).
The agenda-building perspective is the third and most recent
approach to the study of news content selection. Agenda-building
research investigated the origin of issues in the media's agenda
rather than the relationship between the media and the audience. The
research in this area recognized that there are people who seek to
influence the agenda and organizations designed specifically to
influence news judgment. Such organizations hope to influence the
public agenda by building the television news agenda for the
gatekeeper.
Using the expanded definition of agenda encompassing all aspects
of content, this study looked at one such agenda-builder hired by news
organizations to make recommendations which ultimately affect the
newscast content. The research goal was to determine to what degree,
if any, a television news consulting firm builds the local television
news agenda for the gatekeeper. Although one cannot prove causal
links between what the consultant recommends and what appears on the
air, it would be useful, and was the purpose of this study, to draw
associations between the news consultants used and evident differences
in the content of local television newscasts.
It is surprising that no one has looked at consulting firms
(who, after all, are specifically designed to be agenda-builders) and
examined their effect on content. Virtually no empirical studies
address the contributions of television consultants to the agenda-
building process of broadcast news. The literature examines many of

the variables which contribute to the agenda of television newscasts,
but most of the research fails to look at the big picture and only
rarely makes reference to the consulting firms which frame that
picture.
This study was based on the premise that broadcast news agenda-
building research would be best served by considering the newscast as
one complete entity. The agenda referred to in this study is not
framed in the traditional context of issues, but in the institutional
perspective which takes into account the entire realm of newscast
content. The real influence-wielding effect may not lie in the issues
of news stories nor even in the selection of stories to be aired—the
traditional avenue of gatekeeping research. The power of the newscast
to influence the salience of issues and events may encompass the
entire range of elements in a newscast—the actors, the images, the
sounds, and the words.
The focus of this study was similar to what Graber (1987)
referred to in her "gestalt" coding approach to television news as
"the totality of meaning that results from the interaction of verbal
and visual story elements" (Graber, 1987, p. 74). And to the extent
that news consultants develop procedural guidelines for shaping the
format of newscasts, they are major contributors to this "voice of the
news" and a primary link in the multi-variable chain of the agenda-
building process of broadcast news.

The Institutional Perspective
Although organizational and medium-specific considerations
largely are ignored by agenda-setting studies, there is a considerable
eunount of research on the institutional framework of a medium and its
influence on agenda-building.
The principal controversy surrounding agenda-setting research has been characterized by "either/or" statements of causality: Either the media set an agenda for the public, or the media reflect an agenda set by the public. This ignores the very real possibility that the media agenda is a product of the institutional fraunework within which it is created. (Carragee, Rosenblatt, & Michaud, 1987, p. 43)
Ideally, the news media are vital to the functioning of our
socio-political system. The media educate and enlighten the public by
providing factual information as objectively as possible. This, in
turn, enables citizens to become more responsible participants in the
political process.
All communicated messages, however, involve decisions. The
communicator must decide which information to include, which to omit,
which to emphasize, and which to de-emphasize. Too often the value
judgments involved in this process are taken for granted,
". . . believing they are based on well-intentioned, traditional
journalistic norms of newsworthiness, professional judgments of what
the public needs or ought to know" (Robinson & Levy, 1986, pp. 16-17).
Although editors and producers may believe they respond to true
"news value" in the selection of stories, they may actually be
responding to a set of altered values determined by the organization
and dependent upon the economic demands of the medium. "In America,

and throughout the modern world, communication is big business [and]
like any business, its needs and interests are directed toward
increasing profit, not toward promoting the welfare of society as a
whole" (Cross, 1983, p. 13). The fact of the matter is communication
is subject to the same commercial laws of supply and demand as any
other business.
In order to survive, mass media must generate profits or adequate financing, which requires attracting mass audiences. Ratings measure how well the mass media do this, and revenues depend on such ratings. Audience behavior (what is listened to, watched, read, and bought) and audience norms (what entertains, what offends) are fundamental to mass media systems. (Jaunieson & Campbell, 1983, p. 106)
As DeFleur and Ball-Rokeach (1982) pointed out, the first
requirement of a true system is self-preservation. In order to
survive, the media must provide the type of product or service the
market demands.
The Institutional Perspective and Television News
When applied to television news, the institutional perspective
becomes an umbrella covering all contributing variables to the content
selection process and short-term effects of agenda-setting.
The institutionalization of news messages has become a sanctioned activity. In the process of watching the news, people learn what is significant from the standpoint of those who work within practical and organizational limitations to find, schedule, film, and report events-as-news. (Altheide, 1976, pp. 25-26)
The institutional perspective also answers some of the criticism
leveled at broadcast journalists. It explains how traditional
journalistic values of proximity, timeliness, and prominence can be

8
altered by the institutional framework of the medium to produce more
stories that depend on routine channels which maintain the status quo.
Or, how time-honored "news values," such as human interest, novelty,
and conflict, are translated into the entertaining, the sensational,
and the negative.
Organizational limitations and corporate financial goals make it
necessary for news directors to mold news and information into
entertaining newscasts that attract viewers (Fink, 1988). To satisfy
this requirement, policies are developed and procedures are formulated
to "reduce the uncertainties of news to manageable proportions"
(Epstein, 1973, p. 259).
Actually, television news was the victim of its own popularity.
"By the late 1960s it became clear to local television managers that
news could be converted from begrudging obligation to profit-leader.
News became too important to be left to the journalists" (Harmon,
1989a, p. 1).
Encouraged by the money-making potential of what had previously
been considered a necessary but expensive station image-maker, local
stations began allocating money to improve the quality of their
newscasts. And because the profitability of that newscast was
dependent upon the size and demographic quality of its audience, much
of the money was spent on specialists hired to help stations attract
larger audiences. Audience appeal became a predominant factor in news
judgments (Smith, 1988, p. 342).
"Everyone needed a 'media consultant'—it was not enough to have
a general sense of what was wanted" (Rapping, 1987, p. 46). But

9
"media consultant," as originally conceived by the partnership of
Philip McHugh and Peter Hoffman in 1962, did not mean news specialist.
Their intention was to advise on a wide range of television
programming. As local stations surrendered programming to the
networks, however, the consulting partnership became limited to
locally produced newscasts (Powers, 1977).
The increasing popularity of the news consultant also was due,
in part, to the fierce competition that still exists on the local
level. Today, most cities have affiliate stations for all three
networks, at least one independent station (and often more), and a
vast array of cable channels all seeking the largest share of the
audience (Fink, 1988, p. 135).
Unlike networks, affiliates spend a disproportionate amount of their budgets on news. At most local stations, news is the single greatest expense. This means that news ratings—the estimates of the size and composition of viewing audience—have greater significance for local stations than at the networks. (Altheide, 1976, p. 14)
From an institutional perspective, ratings are the criteria by
which stations gauge the quality of broadcast news. "A loss of a
ratings point on a local news program can be worth between $200,000
and $1 million a year" (Westin, 1982, p. 64). And news standards or
values are largely determined by audience interests or tastes as
perceived by the consulting firms that conduct audience research
studies for local stations.
In terms of agenda-building, the institutional perspective of
television news can be argued to have disturbing implications.
"Clearly, all this has central importance to any discussion of

10
ethical, socially responsible journalism for it means newsroom issues
of what is good or bad, right or wrong could be decided for the most
part outside the newsroom" (Fink, 1988, p. 104).
Another link is added to what is already a complex chain of
variables affecting the content of local television newscasts. For
just as an institutional perspective is crucial to any discussion of
television news agenda-building, television consultants play a
prominent role in the institutional perspective. And if, indeed,
consultants do influence newscasts through agenda-building within
television news, they may ultimately affect the agenda-setting
process.
The hypotheses for this study are as follows:
HYPOTHESIS ONE: There will be a significant difference in
the presentation of news content between consulted and
non-consulted newscasts.
News stories will be coded for presence or absence of the following
cosmetic-specific variables affecting news presentation: number of
graphics, use of natural sound on video tape recordings, banter/chit
chat among anchors, appearance of two or more anchors on the news set
at one time (anchor two/three-shot), anchor-read addition to end of
taped reporter story (anchor tag), reporter stand-up report in taped
story, reaction shot of reporter in taped story, and reporter
involvement in taped field report (e.g., touching/pointing,
stooping/turning, walking).

11
HYPOTHESIS TWO: There will be a significant difference in
news content between consulted and non-consulted
newscasts.
News stories will be coded for the following content-specific
variables affecting news content: length (in seconds), type,
initiative, person, orientation, treatment, and topic. (Definitions
of these variables are located in Chapter III, Methodology.)

CHAPTER II
LITERATURE REVIEW
Agenda-Setting; An Overview
The agenda-setting hypothesis originated in Walter Lippmann's
work Public Opinion (1922). Lippmann made a distinction between the
environment or real world around us and what he termed the pseudo-
environment or our individual perceptions of that world. He argued
that mass communication creates pictures in our heads, and these
images contribute to opinion formation in respect to issues believed
to be most important.
Initially, agenda-setting research stayed within the traditional
context of mass communication and political behavior. Early studies
concentrated on whether the news media "through their routine
structuring of social and political reality . . . influence the agenda
of public issues around which political caunpaigns and voter decisions
are organized" (Bryant & Zillmann, 1986, p. 4).
The first real test of the agenda-setting hypothesis was
provided by McCombs and Shaw in 1972. A content analysis of the 1968
presidential campaign was combined with a voter survey of perceived
issues in one community. The study hypothesized that "the mass media
set the agenda for each political campaign, influencing the salience
of attitudes toward the political issues" (p. 177). They found that
the media significantly influenced voters' perceptions of major
issues, supporting their hypothesis.
12

13
As more sophisticated studies noted later, there was one major
methodological problem in McCombs and Shaw's study. Using a static
design, "it maximized media effects because it consisted only of
undecided voters" (Carragee et al., 1987, p. 37) and was, therefore,
unable to establish a causal relationship between media coverage and
the public agenda. The research did, however, stimulate more than 50
empirical studies on agenda-setting during the next ten years.
Although studies which concentrated on cross-lagged correlations
and longitudinal data to determine the direction of the agenda-setting
effect were an advance over the previous static design, they still did
not demonstrate any conclusive evidence of a causal relationship.
Later studies looked at the impact of individual differences on
agenda-setting. At best, however, "major empirical findings
concerning the agenda-setting hypothesis are both conflicting and
inconclusive" (Carragee et al., 1987, p. 39).
In fact, referring to his initial agenda-setting studies,
McCombs and his colleague noted in a recent article that "correlations
alone do not establish the causal assertion that the news media
influence the public agenda. These correlations might even be
spurious, an artifact resulting from a common source for both the
press and public agendas" (Bryant & Zillmann, 1986, p. 5).
Broadcast News: An Agenda Built for the Gatekeeper
Although the findings of numerous studies conducted over the
past 20 or 30 years have supported the existence of the agenda-setting
effect, relatively little research has been done on how and on what
14
criteria the media agenda is developed (Berkowitz, 1987). Most of
these studies have concentrated on one or more of the short-term
effects and emphasized the particular news value associated most often
with those effects as being the primary influence in the agenda-
building process.
Generally, gatekeeping research was based on the assumption that
journalists are taught to select information from the environment for
processing as news based on a set of traditional news values. But
only a few of the studies took into account the organizational
structure of the media institution as a significant contributing
factor to topic selection or perceived content value. As Harmon
(1989a) noted in his doctoral dissertation:
One should not assume that either traditional news values or any journalist's personal values dictate news selection decisions. Journalists operate within chains of command and news organizations. These organizations, and eventually these journalists, implicitly adapt the definition of news to fit the needs and capabilities of the organization. (p. 61)
Indeed, the whole assumption of "traditional" values determining
news selection rather than medium-specific institutional concerns
suggests that all those in the profession—no matter what their
position in the organizational hierarchy of the media institutions—
agree on one definition of news. Further, such an assumption presumes
that each member of a news team "will act according to these concepts
even when their actions conflict with the interests of the
organization that employs them" (Epstein, 1972, pp. 29-30).
In broadcast news, recent studies have suggested that news
values may not have universal definitions. Smith (1988) surveyed

15
local television reporters, producers, and news directors to determine
the degree to which they agreed with critics who say the quality of
broadcast news is inferior to print. "At each step up the chain of
command, television newsworkers become less critical of their craft"
(p. 344), suggesting that news "value" may be somewhat more subjective
than traditional and more organization or job-related than
journalistically "professional." Smith also noted a significant
paradox in the findings:
Local television reporters and producers agree with much of what critics say about their efforts, but agree even more strongly that they can usually do their jobs the way they want. This implies either that they feel powerless in face of television journalism's shortcomings, or that they have little desire to improve the quality of television news. Neither conclusion is reassuring, (p. 346)
In either case, it points to a certain degree of modification of
professional values in accordance with the peculiar requisites of the
broadcast news organization. "Because local news is profitable
according to the size and demographic quality of its audience, there
can be considerable pressure to consider audience appeal when making
news judgments" (Smith, 1988, p. 342). But although local TV
journalists attempt to predict audience preference for news topics,
studies indicate these predictions are not always accurate.
In a phone survey (Wulfemeyer, 1984), respondents were asked to
rank-order various categories and subcategories of news stories.
Television journalists were then asked to predict viewer preferences
based on the same set of categories. Results indicated that "in
general, the journalists thought that viewers would be most interested

16
in stories dealing with sex, crime and violence, but the viewers
reported they were most interested in stories dealing with the
economy, consumerism and education" (p. 435). In another study, the
authors concluded that both broadcast managers and editors agreed that
audience research is necessary, but were unsure whether audience
feedback alone was the best source (Hewitt & Houlberg, 1986).
The pressure to attract the most viewers produces what Adams and
Fish (1987) referred to as "nonproductive management practices such as
. . . over reliance on expensive consultants, and too much emphasis on
minor fluctuations in ratings points" (p. 154).
And consultants, by their own admission, are more concerned with
the market than with journalism (e.g.. Powers, 1977, pp. 80-81). They
are hired to give local stations an edge against the competition in
the race for ratings. While no studies on the effects of consultants
could be found in the research literature, several professional
broadcast journalists and TV news critics have described consultants'
function in the television news industry.
[The consultant] advises on the production values of a newscast, the attractiveness of the set, the "atmosphere" among the "personalities," the lucidity of the writing. He may comment on the appearance of this anchorman or that sportscaster. He may—on the basis of his surveys of "attitudes and opinions"—suggest some broad ranges of interest among the viewing audience . . . . (Powers, 1977, p. 81)
Although consultants argue this advice is designed solely to
create a more appealing newscast format, their influence may have an
indirect but very important effect on the content of that newscast.
17
The influence of consultants is especially important when considering
how story selection influences the public's agenda.
A recent study (Carragee et al., 1987) pointed out that the
focus of news content research may need to be re-evaluated. The real
agenda-setting effect may be the result of newscast formatting
considerations.
Content analysis has repeatedly shown that the emphasis of television news is not on issues; it focuses instead on the non-substantive aspects of important events. Yet, agenda-setting research has continued to examine the issues presented in television news. Moreover, the nonsubstantive emphasis has led many researchers to conclude that television news has no agenda-setting effect. This finding is a direct result of the narrow confines in which agenda-setting research has been conducted. If one looks beyond this faulty conceptualization, it becomes apparent that television's emphasis on non-substantive matters may constitute an important influence on public perceptions of socio-political reality. (p. 43)
In another recent study, Altheide (1985) examined TV coverage of
the Iranian hostage crisis to determine if television news formatting
was an accurate predictor of story selection or news coverage. The
study argued that "TV news format provides the essential framework
through which content is selected, interpreted and presented"
(p. 346). Results indicated that certain events or stories will more
readily fall into news formats than others, and those which contain
more of the desired format qualities will be selected over those which
contain less.
Broadcast news gatekeepers (producers, assignment editors,
reporters, news directors) may not be independent operators
influencing the public agenda. Their newscasts may depend on format
considerations which often fall under the jurisdiction of the

18
consultant. The "definition of news," then, becomes more the result
of formatting, and "traditional values" are altered in accordance with
the more audience-appealing format qualities.
The Television News Format
"Television is by definition a visual medium, and every
successful newscast will take advantage of that fact . . . .
Newscasters must take care to provide a visually-intriguing, well-
paced, well-balanced, inherently interesting report" (Harmon, 1989a,
p. 65). However, as agenda-building research suggests, these
considerations often have adverse side effects which produce a
newscast that falls somewhere between the dichotomous philosophies of
Marshall McLuhan and Frank Lloyd Wright—a form versus substance
dilemma.
Gans (1980) pointed out that story selection is closely
connected to the technology of the medium.
[Medium considerations] enable story selectors to exploit the technological distinctiveness of their news media and to achieve the purposes which new organizations set for themselves to distinguish themselves from and compete with organizations using a different technology. (pp. 157-158)
Taking McLuhan's contention that "the medium is the message" a
bit further, Altheide (1976) argued that "people's images of reality
are not just derived from the TV medium per se, but are consequences
of the way television is used in presenting news messages" (p. 24).
To be effective—that is, to appeal to an audience accustomed to being
entertained by the medium—the television newscast requires pacing and
style. The format of the program must be capable of holding the

19
attention of viewers, regardless of the content. "The form of the
news, both of the entire program and of individual stories or items,
is structured, repetitive, and ritualistic" (Adams & Schreibman, 1978,
p. 78).
Formatting is accomplished in broadcast news by adapting events
to organizational "rules and procedures for defining, recognizing,
selecting, organizing, and presenting information as news" (Altheide,
1985, p. 346). Local stations often will develop these formatting
rules and procedures based on the research findings of consulting
firms.
The procedures vary only slightly. First, there generally is a survey of the station's broadcast area to determine the strengths and weaknesses of the news presentations. On-the-scene visits by the consultants follow, and from those come specific recommendations about whom to hire or fire as on-air personnel, whom to hire as producers and how to create a "look" and pace for broadcast. (Westin, 1982, p. 212)
In his study of television news formats, Altheide (1985) found
five basic elements or characteristics common to broadcast news
reports: accessibility, visual quality, draima and action, perceived
audience relevance, and encapsulation and thematic unity (p. 346).
The presence of one or more of these elements in a news event tends to
resolve some of the practical concerns of the medium. Most of the
literature examining the methods of selecting stories for broadcast
news consists of empirical studies which support these formatting
criteria.
Given the visual nature of the medium, it stands to reason that
pictures would be of primary consideration in developing the newscast.

20
One scholar pointed out that visual spectacle was an important
consideration in all aspects of TV news, especially "in the selection
of themes around which to build news stories" (Weaver, 1975, p. 91).
Echoing Altheide's idea of thematic unity in television
formatting, other critics have argued that broadcast news is
"clustered" into neatly packaged segments (Adams & Schreibman, 1987).
"A cluster consists of a general topic, subdivided into two or more
stories, and suffused with one or more on-going themes" (p. 78).
Fishman (1980) exaimined the correlation between the number of
news stories on crime against the elderly in New York City and the
actual number of crimes reported. His study hypothesized that
journalists will often sort the massive amounts of news and
information they receive by identifying news themes which help them
both in organizing and selecting stories. Findings indicated that
while stories about crime increased, the actual number of crimes
decreased.
Fishman concluded that the results suggest thematic unity
considerations may increase sensitivity to stories of a similar type.
In broadcast news where time constraints restrict the number of
stories covered during a newscast, evidence of thematic unit in the
newscast formatting may have important implications for the agenda-
building process. Events may be considered more newsworthy if they
can be identified within the confines of previously established
thematic criteria. The broadcast news agenda may be limited to
stories that fit this formatting mold.

21
In essence, "News formats inform the decision about where to
look for news, as well as what news looks like" (Arlen, 1969, p. 349).
But because TV news is essentially visual in nature, any event or
issue which can be covered visually will have a better chance of being
included on the newscast agenda. In addition to thematic unity and
topic mix considerations, a story's newsworthiness may also be judged
by its visual quality. Television news agenda-building may be
confined by how well a news event can be visually represented.
Indeed, Chet Huntley once commented that the broadcast industry
was so preoccupied with the fear of dullness and low ratings that
awesome subjects were neglected because they were not good TV (Cross,
1983). "Stories about banks robbing people," Huntley said, "cannot be
made as entertaining as shots of people robbing banks" (cited in
Cross, p. 72).
TV news critic Ron Powers (1977) outlined what he called the
consultant's "blueprint for audience-building" (p. 73). Powers
maintained that this blueprint contains procedural recommendations
which include a high story count with very limited time for each
report and heavy use of visuals whenever possible. Veteran
broadcaster Av Westin's (1982) experience with consultants tended to
agree.
The same preference manifested itself in the consultant's concern for "pace." No one would argue that a well-produced and energetic broadcast has more chance of retaining the viewer's interest than a dull and plodding one. However, consultants often emphasized pace at the expense of content. They provided suggested guidelines about lengths of reports. Those that had pictures could run longer; those that were picture poor were to be cut short or eliminated. (p. 216)

22
Iyengar and Kinder (1987) point out that the way television news
"frames" a problem may be just as important as whether the problem
appears on the newscast at all (p. 34). Their study argued that
perceptual prominence or the vivid, dramatic nature of television's
visual news format rivets audience attention and increases recall.
Findings suggested, however, that news stories directing "viewers'
attention to the flesh and blood victims of national problems prove no
more persuasive than news stories that cover national problems
impersonally" (p. 42). They concluded that the results may be due to
the viewers' focus on the melodrauna inherent in vivid presentations
rather than on the point being made.
The dramatic mode is not necessarily plotting of action to create suspense or to suspend disbelief; but it consists, so far as televisual communication is concerned, in using spoken-discursive language to frame sequentially arranged audiovisual events theatrically in order to enable the audience to experience reality . . . . It is the framing and sequencing, partial staging and partial rehearsing, which thrills, involves, and envelops the audience in the multidimensional reality. (Batra, 1987, p. 28)
In order to gain and hold audience attention, a newscast will
present hard news as drama because such events usually contain most of
the essential criteria of the television news format. "The typical
news story is organized dramatically to identify a problem, to
describe it in a narrative of rising action, to locate the
protagonists and set them against each other (usually in short
interviews), and to create some sort of resolution" (Jamieson &
Campbell, 1983, p. 20).

23
This is not to say that all stories selected for broadcast news
are always dramatic or confrontational. Television critics point out
that
some important issues, such as the economy, are not easily reduced to concrete, dramatic bites of information . . . . Consequently, television seeks out the human interest angle in an economic story and focuses on the rate of inflation, translated into the increased cost of a basket of groceries in representative cities . . . . (Jaunieson & Campbell, 1983, p. 33)
This accomplishes a dual purpose in that economic news is encapsulated
to fit the broadcast news story format and reduced to a more personal
level to meet the criterion of audience relevancy.
A recent study (Stone, Hartung, & Jensen, 1987) found an evenly
balanced mix between bad news and good news on local television. The
study hypothesized that compared to network news there would be more
bad than good news in a local newscast, and those stories which
contained bad news would run longer and carry more video coverage.
The authors concluded that the results may be indicative of
organizational considerations rather than formatting procedures.
"While national news, with its vastly superior resources, can obtain
video footage to accompany most stories . . . local stations may have
neither the resources nor the time to obtain accompanying video for
breaking news stories" (p. 43).
Once again, we see the importance placed on the visual in
television news.
It is likely local television news producers, editors and camera crews will be eager to insure video accompaniment for as many stories as possible in each newscast. They can be assured of having video coverage of local charitable marathon races, parks and zoos on sunny days,

24
school openings, speakers at local civic groups and a wide variety of feature story events which are prepared or at least scheduled in advance. Most of these stories are likely to be good. (Stone et al., p. 44)
Local news, then, may concentrate on "pseudo-events," often
planned and orchestrated especially for the convenience of television
news. Political debates, news conferences, briefings, and interviews
all fall into this category. They are easily accessible, which is
another important element in broadcast news selection.
In a recent study, Berkowitz (1987) made the distinction between
these staged events he defined as "routine channel news" and
spontaneous events which he labeled "enterprise channel news." One of
the hypotheses tested in his study was that routine channel news was
more prevalent in local and network newscasts than enterprise channel
news. "The results of this study suggest that officials and
executives may dominate the agenda-building process in television
news, as indicated by the predominance of routine news in both local
and network television" (p. 513).
Another study (Manning-Miller, 1989) that demonstrates the
significance of accessibility in story selection exaumined the
relationship between the media and its political election agenda with
respect to political candidates' personal attributes and campaign
resourcefulness. The findings suggested that
the candidate's ability to "create news" is helpful to news organizations. Candidates are known to make broadcasters' jobs easier by furnishing a sustained, subsidized flow of information and enter an exchange relationship where sources reduce the cost of news work to increase control over news content. (p. 5)

25
The research tends to confirm the significance of the five
elements Altheide (1985) found to be the basic criteria in formatting
broadcast news—accessibility, visual cjuality, drauna and action,
perceived audience relevance, and encapsulation and thematic unity.
To what extent television news consultants affect these formatting
decisions is still a grey area in terms of empirical research.
Many broadcast professionals and TV critics have expressed
concern over the apparent degree of influence consultants have in the
newsroom. Long-respected broadcast journalist and news anchor Walter
Cronkite once gave a stern warning to the industry, referring to
television news practices as becoming "cosmetic, pretty packaging
. . . editing by consultancy" (Batra, 1987, p. 152). The limited
research that exists points to the important role of consultants in
"packaging" newscasts and, thereby, indirectly influencing the agenda
evident in newscast content. Empirical studies are necessary to
examine whether consultant influence is building the agenda of local
television news.
The intent of this study was to add to the existing agenda-
building research by empirically testing to determine if, in fact,
consultant influence can be detected in the presentation and content
of local television newscasts.

CHAPTER III
METHODOLOGY
To establish a correlation between newscast characteristics and
consultant influence, the research design of this study consists of
content analyses of a sample of television news stories. In
accordance with 21 specifically defined coding categories, the
researcher viewed and coded a national sample of 16 randomly selected
local newscasts collected by two independent news consulting firms.
This resulted in a total case sample of 242 stories.
The sample consisted of both early and late news reports taped
by volunteers in small and large markets for Audience Research and
Development (ARD) in Dallas, Texas, and Primo Newservice, Inc., in Old
Greenwich, Connecticut. Of the 242 cases, 55% (132 stories) were
taken from late newscasts and 45% (110 stories) were from early
newscasts. The newscasts were taped at different times of the year
between 1987 and 1990 for the purpose of evaluating the newscasts of
clients and their competitors.
Three different consulting firms were represented by the sample.
Of the 16 newscasts, four were consulted by ARD, four by Primo, and
four by Magid (another leading consultant in Marion, Iowa). The
remaining four newscasts had no known consultant at the time of
broadcast.
The news story was the unit of analysis for this study. A news
story was defined as any topic, event, report, or statement by the
anchor or introduced by the anchor and treated as a single unit. The
26
27
weather report, sports report, and news or promotional "bumpers" were
also considered as case units. Of the 242 cases, 68 were from
newscasts consulted by Magid, 61 were from ARD, 61 Primo, and 52 were
from non-consulted newscasts.
In order to determine whether certain audio and video techniques
are consultant-specific or unique to consulted newscasts, news stories
were coded in terms of cosmetics as well as content categories.
Cosmetics are elements of presentation that may be incidental to
content but consequential to the style or appeal of the newscast
(e.g., use of graphics or anchor/reporter emphasis). A sample of the
coding sheet is provided in the appendix of this study.
The first four coding categories were designed to identify the
newscast and consisted of demographic information primarily supplied
by ARD and Primo. Column one listed the four possible consultant
categories: 1—Magid, 2—ARD, 3—Primo, or 4—non-consulted. The
second column was for market rank coded as integers from 1 to 200.
This information was cross checked with market ratings listed in
Broadcasting Yearbook (1990).
Column three coded the time of broadcast as either 1—early
evening or 2—late evening. The fourth column recorded the integer
corresponding to the position of the news story in the newscast (i.e.,
1—lead story, 2—second story, 3—third story, etc.).
The fifth coding category was designed to ascertain the pace of
the news report, an element of consequence to both content and
cosmetics. This category was included to determine if a correlation
or association exists between the number and length of stories in a

28
newscast and the presence or absence of a consultant. The column
recorded the length of the story in seconds.
Column six coded news content by story type, either 1—hard
news, 2—soft news, or 3—not applicable. Content type coding was
included to ascertain any difference between the amount of hard and
soft news reported on consulted and non-consulted newscasts.
Story-type category definitions for this study were developed by
Carroll (1985) but modified to create a dichotomous variable. Hard
news was defined as "the report of an event that happened or was
disclosed within the previous twenty-four hours and treats an issue of
on-going concern" (p. 879). A story was considered to be hard if it
was breaking news that dealt with a serious issue and the facts of the
moment.
Soft news stories treated topics of human interest and special
features or provided background and context to serious issues and
events. "Soft news does not deal with social issues, public policy or
controversies that concern members of the audience" (Carroll, 1985,
p. 879).
The "not applicable" code for this content category was used
primarily for weather and sports reports. Promotional bumpers and
occasional news bumpers that highlighted several story types were also
coded as having no content type. With the exception of story
treatment (column 11), the remaining categories also included a "not
applicable" code to accommodate weather, sports, and bumpers.
The next content category also replicated Carroll's (1985)
study. Content was coded by story initiative, identifying whether the

29
story was the result of a spontaneous event, a planned event, or
reporter enterprise. Story initiative was included in this study to
determine if the number of spontaneous, planned, and enterprise
stories in a newscast remained proportionate despite consultant
influence. Carroll defined these categories as follows:
A spontaneous event was one that came with virtually no notice (e.g., flood, accident, murder). Preplanned events were press conferences, opening nights, ceremonial appearances or other (pseudo) events planned with news media coverage in mind . . . . Enterpriser stories resulted from initiative in identifying topics that otherwise would not be included in the newscasts. These stories were done because the news organization judged the items to be important or newsworthy. (p. 879)
Column eight was a unique category designed to ascertain the
"person" of the story: 1—first person, 2—second person, 3—third
person, or 4—not applicable. The category was included in this
analysis to determine if consulted newscasts are more likely to
reflect a "voice of the news" than non-consulted newscasts. Although
primarily affecting the style of the newscast, the voice of a story
was considered equally consequential to news content.
The voice of a story was generally determined by the tone and
word choice in the story lead. Stories which made frequent reference
to "I, me" or the station name or call letters were coded as first
person. Examples of first person stories would include story leads
such as "KAKE news has learned . . . .," or "As we reported last night
. . . .," and "I talked with the mayor and he assured me . . . ."
Second-person stories often referred specifically to the
audience or the community or used the word "you" frequently. Stories
urging the audience not to travel due to inclement weather or telling

30
"you" about important events or issues in "our community" are examples
of second-person stories.
Stories were coded as third person if the emphasis was on "they"
or no pronouns were used at all. For example, a story with a lead
such as "On Capitol Hill today, legislators passed a bill . . . ."
would be coded as third person.
The ninth column was a cosmetic category to determine the number
of times graphics, chromakey, or character-generated information was
used in a story. Names and titles superimposed over virtually every
video tape recording for the purpose of identification were not
included. Only images used to enhance or embellish the news content
were coded by integers.
In column ten, story content was coded by geographic orientation
to determine whether the predominant areas of coverage differed
between consulted and non-consulted newscasts. The categories
included 1—metro, 2—area of dominant influence, 3—state, 4—region,
5—national, 6—international, and 7—not applicable.
Metro stories were news events or issues within the city or home
county. An ADI (Area of Dominant Influence) code was given to stories
in the station's coverage area outside the home county, and state news
consisted of stories outside the metro or ADI coverage area but within
the home state. Stories were coded as regional if they concerned
events or issues in adjoining states, national for all other U.S.
locations, and international if the content covered news of other
countries.

31
The next category coded was story treatment—both a content-
specific category affecting the "weight" or presumed importance of the
news story and a cosmetic element affecting the manner in which news
content is presented. Story treatment was coded to determine if
either consulted or non-consulted newscasts relied more heavily on
video presentation of news content and to ascertain anchor or reporter
emphasis. Treatment categories included 1—reader, 2—voice-over, 3 —
voice-over with video tape recording (VTR), 4—anchor package, 5—
reporter package, 6—reporter studio or newsroom segment with VTR, 7 —
live remote, 8—bumper, 9—sports report, and 10—weather report.
The first four categories indicate anchor emphasis. Stories
were coded as reader if the content was treated as straight news
reading by the anchor, voice-over if the anchor read the story over
video footage, and voice-over with VTR if the video footage included a
sound bite or taped interview.
An anchor or reporter package was defined as an edited field
report. It may contain video coverage with voice-over, sound bite,
and stand-up reporting or summaries by the anchor or reporter.
Packages depend on good video for presenting news content.
The next two treatment codes emphasize the reporter. A story
was coded as studio or newsroom segment if the reporter appeared live
on the set to give his or her news report. A live remote story
spotlighted the reporter at the scene of the event at the time of the
newscast and emphasized the immediacy of the news report.
Other production elements that encroached on the actual newshole
of a newscast were coded as bumpers. These included transitions,

32
teases, and promotions. The sports and weather reports were both
coded as single-story treatments.
News content was coded by story topic in column 12, using a
modified Deutschmann system of classification. Story topic was coded
to determine whether the percentage of content topics differed from
consulted to non-consulted news reports. Topic codes included 1—
government, 2—violence/crime, 3—economy, 4—sports (for stories
outside the regular sports report), 5—education, 6—accidents/
disaster, 7—public health and welfare, 8—weather (for stories
outside the regular weather report), 9—politics/campaigns,
10—general human interest, 11—agriculture, 12—other, and 13—not
applicable.
The remaining nine columns were cosmetic categories coded either
1—absent, 2—present, or 3—not applicable. They were included in
the analysis to determine how much was added to the newscast in the
form of visuals and other stylistic techniques often associated with
consultants and to provide some indication of the amount of substance
or actual news content in a newscast.
Presence or absence coding categories included: natural sound
on tape (coded for voice-over stories or voice-over with VTR), banter
or chit-chat between anchors/reporters, and anchor/reporter two- or
three-shot. The final six categories pertained to package reports
only and included: touching or pointing by reporter/anchor, stooping
or turning by reporter/anchor, walking by reporter/anchor, field
stand-up report, reaction shot of anchor/reporter, and anchor
statement tagged to package.

CHAPTER IV
RESULTS AND DISCUSSION
The findings of this study indicated that consultants leave a
discernable individual mark on local television newscasts, but their
collective influence is difficult to isolate. Although there were
many similarities between consulted and non-consulted news stories,
results of analysis were statistically significant for nine of the 17
coded variables. Differences were evident both between consulted and
non-consulted newscasts, as well as among the consulted sub-samples.
Data collected for this study were grouped to reflect cosmetic-
specific variables (hypothesis I) and content-specific variables
(hypothesis II). Frequency distributions were run on the entire
sample and compared to sub-sample frequencies for Magid, ARD, Primo,
and non-consulted stories. To test the study's hypotheses and
determine the significance of correlations and differences suggested
by frequency distributions, Chi-square analyses were computed for both
cosmetic and content variables.
Cosmetic-specific variables included the number of graphics used
in a story and the following story categories coded for presence or
absence: natural sound, banter or chit-chat, anchor/reporter two- or
three-shot, reporter touching/pointing, reporter stooping/turning,
reporter walking, field stand-up, reporter reaction shot, and anchor
tag. These categories were grouped together to determine if
consultant influence can be detected in elements of presentation that
may contribute to the style or appeal of the newscast.
33

34
content-specific variables included the following news story
categories: length, type, initiative, person, geographic orientation,
treatment, and topic. Content-specific data were studied to determine
if consultant influence can be detected in newscast content.
For the purpose of review, hypotheses one and two were as
follows:
HYPOTHESES ONE: There will be a significant difference in
the presentation of news content between consulted and
non-consulted newscasts.
HYPOTHESES TWO: There will be a significant difference in
news content between consulted and non-consulted
newscasts.
Analysis of data should reveal a statistically significant
difference between consulted and non-consulted newscasts in both the
manner in which news is presented and in the content of news stories. r
Significant correlations in variable frequencies should be evident
between the two sub-samples.
The total sample consisted of 242 news stories from a national
random selection of 16 local newscasts. Of the total sample, 28.1% of
the stories were from newscasts consulted by Magid; 25.2% were from
ARD and Primo, respectively; and 21.5% were from non-consulted
newscasts. There were 110 stories (45.45%) from early evening news
reports (5:00 p.m. to 7:00 p.m. starting time) and 132 stories
(54.55%) from late evening newscasts (8:00 p.m. to 11:00 p.m. starting
time).

35
More than half of the stories in the Magid sub-sample (58.85%)
were from late evening newscasts. This was also the mode for Primo
(54.10%) and non-consulted (57.70%). The majority of stories in the
ARD sub-sample (52.46%) were from early evening reports.
The consulted sub-sample consisted of 35.8% Magid stories and
32.10% each from ARD and Primo. Corresponding to the non-consulted
sample, the majority of consulted stories (53.7%) were from late
evening newscasts.
Significant Cosmetic-Specific Variables
Natural Sound
Results of analysis for the use of sound on video tape in news
stories demonstrated only a moderate degree of association (p=.0824).
However, differences in frequency distribution among the consultants
indicated a possible correlation.
Although more than half of the Primo sub-sample (53.19%)
contained natural sound, 44% of all stories without natural sound were
from Primo newscasts—26% more than Magid or non-consulted (see Table
1). ARD and non-consulted data were within two stories of expected
frequencies.
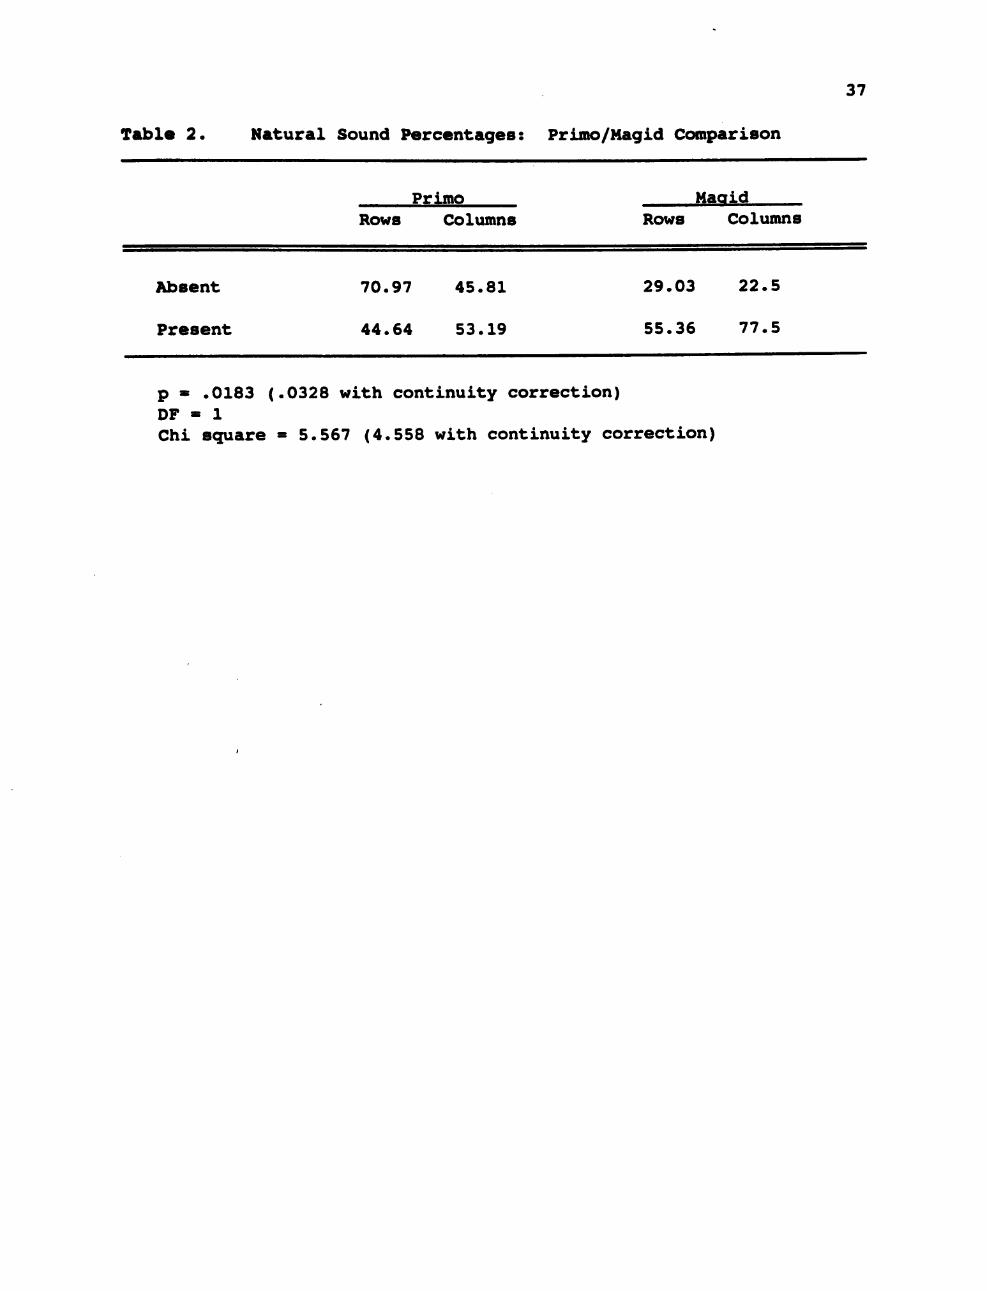
To further test the association between Primo and the use of
natural sound, cells were collapsed comparing Primo to each sub-sample
individually. Results indicated a statistically significant
difference between Primo and Magid. Chi-square with continuity
correction was 4.56 and the significance level was .032. There was
one degree of freedom (see Table 2).

36
Table 1. Natural Sound Percentages: Sub-sample Comparison
Mao id ARD Primo Non-consuIted Rows Columns Rows Colvunns Rows Columns Rows Columns
Absent 18 22.5 20 33.33 44 46.81 18 26.47
Present 30.69 77.5 19.8 66.67 24.75 53.19 24.75 73.53
p a .0824 DF « 3 Chi square » 6.693 Contingency coefficient » .206
37
Table 2. Natural Sound Percentages: Primo/Magid Comparison
Primo Maoid Rows Columns Rows Columns
Absent 70.97 45.81 29.03 22.5
Present 44.64 53.19 55.36 77.5
p * .0183 (.0328 with continuity correction) DF « 1 Chi square « 5.567 (4.558 with continuity correction)

38
Although there was slightly less than a 10% difference between
the two sub-samples for the number of stories coded present, natural
sound was absent in nearly 41% more Primo stories than Magid. It
appears Primo newscasts may use less natural sound on video tape.
Story Treatment
Although this variable may also be considered content-specific,
the degree of perceived importance placed on news as manifested by the
amount of video emphasis given to a story involves effects research
beyond the scope of this study. For this reason, story treatment was
included with cosmetic variables to determine if any correlations were
possible between anchor or reporter emphasis and consulted or non-
consulted newscasts.
With weather and sports reports common to all newscasts, each
sub-sample contained the exact number of each. Consequently, these
categories were not included in the analyses.
Chi-square statistics indicated a modest association with
significance of .055 and contingency coefficient of .365. There were
21 degrees of freedom with a Chi-square of 32.21 (see Table 3).
Again, observed and expected frequencies indicated that differences
among consultants accounted for the association.
Of all sub-samples, ARD comprised either the highest or lowest
percentage of stories in five of the eight treatment categories. And,
in four of those five categories, the reverse was true for Primo,
suggesting an opposite association for the two sub-samples.

39
Table 3. Story Treatment Percentages: Sub-sample Comparison
Maoid ARD Primo Non-consulted Rows Columns Rows Columns Rows Columns Rows Columns
Reader 25.58 18.33 37.21 30.19 16.28 13.21 20.93 20.45
Voice-over 29.63 26.67 12.96 13.21 31.48 32.08 25.93 31.82
Voice-Over with VTR 27.50 18.33 15 11.32 30 22.64 27.5 25
Anchor Package 0 0 0 0 0 0 100 2.27
Reporter Package 27.71 15 31.43 20.75 22.86 15.09 20 15.91
3.77 40 7.55 20 4.55
14.29 1.89 42.86 5.66 0 0
18.87 10 3.77 0 0
Newsroom Segment
Live Remote
Bumper
20
42.86
40
3.33
5
13.33
20
14.:
50
p = .0557 DF = 21 Chi square = 32.211 Contingency coefficient = .365

40
Testing the association yielded statistically significant
results. Comparing ARD and Primo, there were six degrees of freedom
with a Chi-square of 17.16 and significance of .008. The contingency
coefficient was .373 (see Table 4).
In all but one of the treatment categories, ARD had at least
twice as many stories as Primo or as few as half. With the same
number of stories in both sub-samples, however, expected values were
identical for both ARD and Primo.
The only category with near the expected values was reporter
package (see Table 4). Of all package stories, ARD represented
slightly more than half (57.89%) and Primo slightly less (42.11%).
The category with the largest difference between the two sub-samples
was bumper. ARD stories represented 83.33% of all bumpers—nearly 67%
more than Primo.
In terms of reporter or anchor emphasis, the data did not
establish any clear pattern for either ARD or Primo. Comparing row
totals, the largest percentage of readers were from ARD newscasts (see
Table 4). But, Primo outweighed ARD in voice-overs and voice-overs
with video recordings—the remaining anchor emphasis treatment
categories. In reporter emphasis categories, similar frequencies were
observed—ARD had a larger percentage of reporter packages but fewer
newsroom and live remotes than Primo.
However, comparing column totals and combining percentages of
the three anchor emphasis categories, 67.93% of the Primo sub-sample
tended to rely more heavily on anchors compared with 54.72% of the
stories from ARD newscasts (see Table 4). Combining reporter emphasis

41
Table 4. Story Treatment Percentages: ARD/Priroo Comparison
^RD Primo Rows Columns Rows Columns
Reader 69.57 30.19 30.43 13.21
Voice-Over 29.17 13.21 70.83 32.08
Voice-Over with VTR 33.33 11.32 66.67 22.64
Anchor Package 0 0 0 0
Reporter Package 57.89 20.75 42.11 15.09
Newsroom Segment 33.33 3.77 66.67 7.55
Live Remote 25 1.89 75 5.66
83.33 18.87 16.67 3.77 Bumper
p » .0087 DF = 6 Chi square = 17.162 Contingency coefficient = .373

42
categories (reporter package, newsroom segment, and live remotes)
resulted in less than a two percent difference between the two sub-
samples. While both ARD and Primo appear to rely more on anchors
(more than half of each sub-sample), Primo may prefer to use video
enhancement more than ARD.
Chi-sc[uare analysis was also computed to compare the combined
consulted sub-sample with non-consulted stories. Although results
were not statistically significant (p=.077), an association was
indicated. The largest category difference was in the use of bumpers
(see Table 5). The non-consulted sample contained no bumpers at all,
while 12.05% of all consulted stories were coded in this category.
To determine if the observed differences were the result of one
consultant, Chi-square statistics were computed to compare each of the
consulted sub-samples individually with the non-consulted sub-sample.
Comparing Primo to non-consulted stories was not significant (p=.479)
nor was the analysis comparing Magid to the non-consulted saunple
(p=.169).
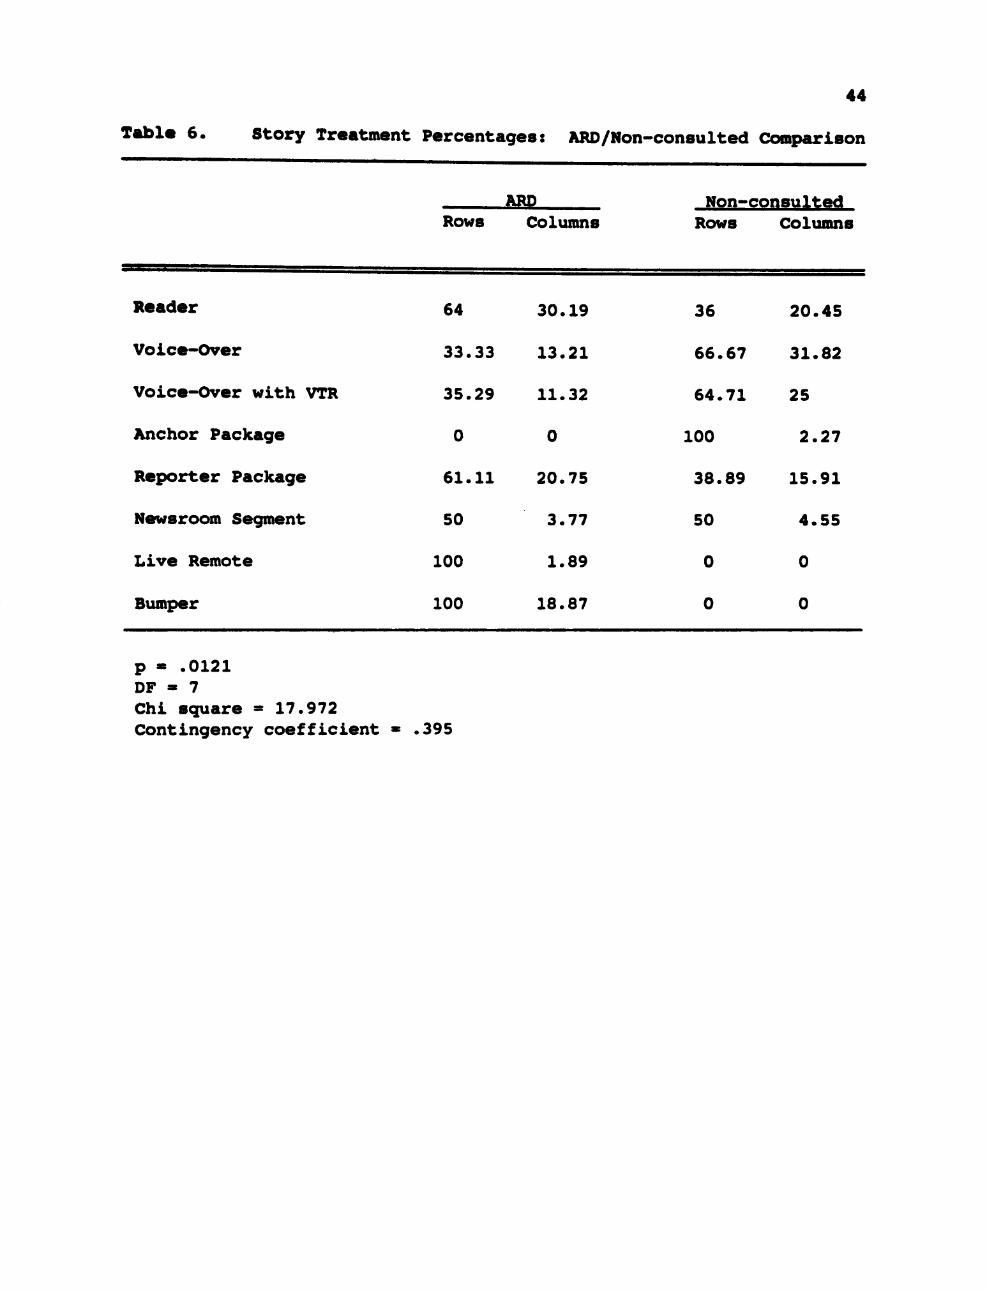
The analysis with statistically significant results compared
non-consulted stories to the ARD sub-sample. With seven degrees of
freedom, Chi-square was 17.972 and the significance level was .0121
(see Table 6). Corresponding to the ARD and Primo comparison, results
indicated anchor emphasis categories accounted for the difference.
Again, ARD tended to run twice as many readers while the non-consulted
sub-sample consisted of twice the voice-overs and voice-overs with
video recordings.

43
Table 5. Story Treatment Percentages: Non-consulted/Consulted Comparison
Consulted Rows Columns
Non-consulted Rows Columns
Reader
Voice-Over
Voice-Over with VTR
Anchor Package
Reporter Package
79.07
74.07
72.5
20.48
24.1
17.47
80 16.87
20.93
25.93
27.5
100
20
20.45
31.82
25
2.27
15.91
Newsroom Segment 80 4.82 20 4.55
Live Remote
Bumper
100
100
4.22
12.05
0
0
0
0
p » .0772 DF « 7 Chi square > 12.796 Contingency coefficient .24
44
Table 6. Story Treatment Percentages: ARD/Non-consulted Comparison
ARD Non-consulted Rows Columns Rows Columns
Reader 64 30.19 36 20.45
Voice-Over 33.33 13.21 66.67 31.82
Voice-Over with VTR 35.29 11.32 64.71 25
Anchor Package 0 0 100 2.27
Reporter Package 61.11 20.75 38.89 15.91
Newsroom Segment 50 3.77 50 4.55
Live Remote 100 1.89 0 0
Bumper 100 18.87 0 0
p « .0121 DF » 7 Chi square » 17.972 Contingency coefficient » .395

45
Three-way analyses were also run, but the only statistically
significant findings compared ARD, Primo, and the non-consulted sub-
samples. With 14 degrees of freedom and a Chi-square of 30.508, the
significance was .0065 with contingency coefficient of .411. It
appears that Primo and non-consulted newscasts are similar in terms of
story treatment.
Anchor Two/Three-Shot
This cosmetic variable demonstrated statistically significant
differences between consulted and non-consulted sub-samples. Chi-
square was 10.535 with three degrees of freedom and a significance of
.0145 (see Table 7).
The variable was coded present in more than half of both Magid
(57.14%) and ARD (58.14%) sub-samples but absent in nearly three-
fourths of all the non-consulted stories (71.15%). Primo newscasts
tended to correspond more with non-consulted newscasts. The variable
was coded absent in more than half (55.74%) of the Primo sub-sample.
Additional analyses demonstrated this similarity.
Statistics were computed to compare the combined consulted sub-
sample with non-consulted stories. The relationship had a
significance of .0075 with one degree of freedom and a Chi-square
(with continuity correction) of 7.139 (see Table 8).
Chi-square analyses were also computed to compare each consulted
sub-sample with non-consulted stories. Results indicated a
statistically significant relationship between the non-consulted sub-
sample and both Magid (p=.0157) and ARD (p=.0076). Comparing Primo to

46
Table 7. Anchor Two- or Three-Shot Percentages: Sub-sample Comparison
Maoid ARD Primo Non-consulted Rows Columns Rows Columns Rows Columns Rows Columns
Absent 14.42 42.86 17.31 41.86 32.69 55.74 35.58 71.15
Present 22.99 57.14 28.74 58.14 31.03 44.26 17.24 28.85
p - .0145 DF « 3 Chi square « 10.535 Contingency coefficient » .229

47
Table 8. Anchor Two- or Three-Shot Percentages: Consulted/Non-consulted Comparison
Consulted Non-consulted Rows Columns Rows Columns
Absent 64.42 48.2 35.58 71.15
Present 82.76 51.8 17.24 28.85
p - .0075 DF = 1 Chi square - 7.139 (with continuity correction) Contingency coefficient « .201

48
the non-consulted sub-sample, the statistics were not significant
(p=.1349).
Consulted newscasts used more two- or three-shots of anchors
than non-consulted newscasts. Primo newscasts tend to use multiple
anchor camera shots slightly less than the other consultants but more
than non-consulted newscasts. However, the differences are not
statistically significant.
Anchor Tag
Analysis of anchor statements tagged to the end of reporter
packages suggested a moderately significant difference between all
four sub-samples. There were three degrees of freedom, Chi-square was
7.423, and the p value was .059 (see Table 9).
Comparing column percentages suggested that the correlation was
the result of differences between consultants. ARD tended to use
anchor tags more often. Proportionately, the sub-samples were nearly
evenly divided—Magid and Primo demonstrating similar tendencies, and
ARD and the non-consulted percentages also corresponding.
While the variable was coded absent in 93.33% of all Primo
cases, anchor tags were used in 44.44% of the non-consulted stories
and 42.86% of the ARD sub-sample—a difference of less than two
percent. Magid percentages were much closer to the Primo sub-sample
with the variable coded absent in 84.62% of the stories (see Table 8).
These similarities were confirmed by the lack of significant findings
in additional analyses computed to determine consulted/non-consulted
associations.

49
Table 9. Anchor Tag Percentages: Sub-sample Comparison
Maoid ARD Primo Non-gpn^ul,!^^ Rows Columns Rows Columns Rows Columns Rows Columns
Absent 29.95 84.62 21.05 57.14 36.84 93.33 13.16 55.56
Present 15.38 15.38 46.15 42.86 7.69 6.67 30.77 44.44
p B .0596 DF - 3 Chi square - 7.423 Contingency coefficient » .356

50
Reporter Stoop/Turn
Among the reporter emphasis variables, only one reflected any
significant difference. Statistics computed to determine the
possibility of correlations among sub-samples between the presence or
absence of reporter stooping and turning demonstrated statistically
significant results between the consultants (see Table 10).
The variable was absent in 100% of both Magid and ARD packages.
Although slightly more than half (53.33%) of the Primo sub-sample did
not involve the reporter stooping or turning, Primo stories
represented 77.78% of the total number of packages that did contain
the variable. The non-consulted saunple tended to include reporter
stooping/turning even less than Primo (77.78% absent), but still
represented 22.22% of the stories coded with the variable present.
Once again, it appears a discrepancy between Primo and the other
two consulted sub-samples accounts for the difference. Testing this
assumption, two-by-two analyses were run comparing Magid to Primo and
ARD to Primo. In both cases, results were statistically significant.
Comparing Magid and Primo, Chi-square (with continuity
correction) was 5.791 with one degree of freedom. Significance was
.0161 with a contingency coefficient of .473. The analysis comparing
ARD and Primo had a significance level of .0124 with a slightly higher
contingency coefficient of .479. Chi-square (with continuity
correction) was 6.252.

51
Table 10. Reporter Stoop/Turn Percentages: Sub-sample Comparison
Magid ARD Primo Non-consulted Rows Columns Rows Columns Rows Columns Rows Columns
Absent 30.95 100 33.33 100 19.05 53.33 16.67 77.78
Present 77.78 46.67 22.22 22.22
p = .0022 DF = 3 Chi square = 14.607 Contingency coefficient = .472

52
Significant Content-Specific Variables
Story Length
Excluding weather and sports reports, the mean story length of
the total sample was 55.30. The shortest story of the sample ran
seven seconds, and the maximum story length was 225 seconds (see Table
11). This resulted in a wide range of 218 seconds. Using 10-second
intervals, the mode for sample story length was 20 to 30 seconds long
(24.76%). Frequency distributions recorded the second largest
percentage of stories in the 10- to 20-second interval (16.19%).
The mean of all five sub-saunples—Magid, ARD, Primo, consulted,
and non-consulted—were also in the 50- to 60-second interval,
indicating no real frequency differences between groups. While the
modes also reflected similarities (with the exception of Primo which
had no mode), story count and minimum lengths suggested the variable
may yield possible associations.
The Magid sub-sample had the largest number of stories with a
total count of 60. Story length ranged from a minimum of seven to a
maximum of only 149—76 seconds shorter than the maximum range of the
total sample (see Table 11). Magid had the lowest mean story length
at 50.57. Frequency distributions indicated that nearly half of this
sub-sample fell in the 10- to 20-second and the 20- to 30-second
intervals.
The non-consulted story count totaled only 44—nine less than
ARD and Primo, and 16 less than Magid—suggesting non-consulted
newscasts tend to contain fewer stories (see Table 11). Although the
mode corresponded to all three consultants, frequency distributions

53
Table 11. Story Length
Total Non-Sample Magid ARD Primo consulted Consulted
Total Count
Minimum
Maximum
Range
Sum
Mean
Mode*
210
7
225
218
11612
60
156
149
53
8
206
198
3034 2989
20-30 20-30 20-30
53
11
225
214
2971
55.30 50.57 56.40 56.06
none
44
15
178
163
2618
59.50
20-30
166
7
225
218
8994
54.18
20-30
*Measured in seconds.

54
recorded the second largest percentage of non-consulted stories in the
30- to 40-second interval (13.46%). This was in contrast to the other
samples that all tended to have larger percentages of stories in the
10- to 20-second interval.
In order to compute Chi-square statistics to determine the
possibility of significant differences in story length among the sub-
samples, 10-second range restrictions were used from 0 to 120 seconds.
All stories more than 120 seconds were grouped together. There were a
total of eight story length categories.
Analysis results comparing all four sub-samples were moderately
significant (see Table 12). The data appears to indicate that Magid
newscasts tend to air more stories 10 to 30 seconds in length. With
21 degrees of freedom, the significance level was .0495 and the
contingency coefficient was .345. Chi-square was 32.711.
Sub-sample frequency distributions were also compared to
determine if consulted and non-consulted newscasts devoted a
proportionate amount of time to weather and sports reports. Although
the data did not indicate significant discrepancies to support
hypothesis I, the length of Prime's weather and sports reports
suggested a possible association among consulted newscasts (see Table
13) .
The mean length of time Primo newscasts devoted to the weather
report was 156.75 seconds—at least one minute shorter than both Magid
and ARD. With a mean of 224 seconds, the average length of non-
consulted weather reports was also more than a minute longer than

55
Table 12. Story Length Percentages: Sub-sample Comparison
Length in Magid ARD Primo Non-consulted
Seconds Rows* Columns** Rows Columns Rows Columns Rows Columns
0-10 16.67 1.47 83.33 8.2
11-20 37.5 22.06 30 19.67 22.5 14.75 10 7.69
21-30
31-45
46-60
31.25 22.06 20.83 16.39 16.67 13.11 31.25 28.85
32.14 13.24 10.71 4.92 39.29 18.03 17.86 9.62
23.08 8.82 23.08 9.84 38.46 16.39 15.38 7.69
61-90 11.76
91-120 22.73
2.94
7.35
17.65 4.92 41.18 11.48 29.41 9.62
27.27 9.84 22.73 8.2 27.27 11.54
over 120 27.27 22.06 29.09 26.23 20 18.03 23.64 25
•Reflects total sample. **Reflects sub-sample.
p = .0495 DF = 21 Chi square = 32.711 Contingency coefficient = .345

"8 3 <A C O
u
CA
8. V)
0)
a
^ s fVI
rg
56
( M r̂ i n (NJ
o .» <>j
o i n ro
>o o>
(M
"8 3 <A C O u • c o
w
0>
0>
in
8:
5
o CO
rsi « o>
o 'J ' rvj
eo (M
CO *•> fc. 3 eo
(> f \ j
o ^ ^
>« r j o
«o i n (M
<u
a 0)
K. »»
CO
(VJ m
<
<ft
8.
0)
fC
190
205
267
225
fc
o
943
865 .2
5
235
216.
o» c 0)
1.4
JJ
O
a 0)
o: m o a ui 0)
x: (0 0)
CO
8. (A
<0
0»
Q>
<D
(0 A'
o
3
CO
C -
8. c/>
(D 4)
s
o o
:9 s
in (M
CM yQ
£S
^ 2 OK
(M
m o CO
(M m
N
>o (VJ
(M
i n
o
o u M
n
0) rH
H
c 3 o u
c <0
c (0 0) v>
u D CO CO

57
Primo, but only eight seconds more than the other two consulted
newscasts.
The total amount of time devoted to the weather per sub-sample
also suggested a similarity between Magid, ARD, and non-consulted
newscasts (see Table 13). Totals for Magid and ARD were only one
second apart (864 and 865 seconds, respectively) and the sum of the
length of non-consulted weather reports (896 seconds) was just 32
seconds more than the Magid sub-sample. With a total of 627 seconds,
Primo devoted significantly less time to weather—a minute and a half
less than Magid or ARD and more than two minutes less than the non-
consulted sub-sample.
Sports report frequency distributions indicated the opposite
emphasis but the same similarities between non-consulted, Magid, and
ARD sub-samples. Primo tended to devote more time to sports than non-
consulted or either of the other consulted newscasts (see Table 13).
Although the mean length of a Primo weather report was only slightly
more than 20 seconds longer than the shortest mean of the other sub-
samples, the total length of Primo weather reports was more than a
minute longer than all three sub-samples.
It should be kept in mind, however, that restricting the
comparison to only weather or sports reports reduced the sub-samples
to a total of four stories each (one weather or one sports report per
newscast). While this number is relative to the total sample, it is
not sufficient to be representative of the sub-samples. The range
between minimum and maximum length of both weather and sports reports
58
indicates these small sub-samples may be too erratic to suggest
correlations.
Story Person
Although results of analysis did not indicate a statistically
significant difference among the four sub-samples and story person
(p=.1311) nor between consulted and non-consulted stories (p=.1291),
both levels of significance suggested a weak association. Once again,
observed frequencies and column percentages reflected differences
between Primo and the other two consultants (see Table 14).
Magid (32.76%) and ARD (27.66%) tended to have more second-
person stories, and both Primo and the non-consulted samples tended to
place more emphasis on third person (71.15% and 76.19%, respectively).
Additional analysis indicated a moderate statistically significant
difference between Magid and non-consulted stories (see Table 15).
Chi-square was 6.35 with two degrees of freedom. The significance
level was .0418, and the contingency coefficient was .244.
Of the total number of Magid and non-consulted stories coded
first person, the Magid sub-sample represented 69.23%. Magid also had
52% more of the total number of second-person stories. The Magid
newscasts tend to air more stories written in the first or second
person than non-consulted newscasts.
Geographic Orientation
Analysis results indicated a strong correlation. Chi-square was
35.329 with 15 degrees of freedom and a significance of .0022. The
contingency coefficient was .397 (see Table 16).

59
Table 14. Story Person Percentages: Sub-sample Comparison
Magid ARD Primo Non-consulted Rows* Columns** Rows Columns Rows Columns Rows Columns
1st Person 32.14 15.54 28.57 17.02 25 13.46 14.29 9.52
2nd Person 41.3 32.76 28.26 27.66 17.39 15.38 13.04 14.29
3rd Person 24 51.72 20.8 55.32 29.6 71.15 25.6 76.19
•Reflects total sample. ••Reflects sub-Seunple.
p = .1311 DF = 6 Chi square = 9.85 Contingency coefficient = .217

60
Table 15. Story Person Percentages: Magid/Non-consulted Comparison
Magid Non-consulted Rows* Columns** Rows Columns
1st Person 69.23 15.52 30.77 9.52
2nd Person 76 32.76 24 14.29
3rd Person 48.39 51.72 51.61 76.19
•Reflects total sample. ••Reflects sub-sample.
p = .0418 DF = 2 Chi square = 6.35 Contingency coefficient = .244

61
Table 16. Geographic Orientation Percentages: Sub-sample Comparison
M*°^d ARD Primo Non-consulted Rows* Columns** Rows Columns Rows Columns Rows Columns
Metro/
City 40.28 50 18.06 29.55 18.06 26.53 23.61 44.74
ADI 27.03 17.24 13.51 11.36 48.65 36.73 10.81 10.53
State 30.77 13.79 34.62 20.45 19.23 10.2 15.38 10.53 Adjoining Stations 0 0 100 9.09 0 0 0 0
National 24.44 18.97 26.67 27.27 24.44 22.45 24.44 28.95
International 0 0 20 2.27 40 4.08 40 5.26
*Reflects total sample. **Reflects sub-sample.
p « .0022 DF « 15 Chi square * 35.329 Contingency coefficient = .397

62
To determine the direction of the correlation, several
additional tests were computed comparing different pairs of sub-
samples, as well as consulted and non-consulted stories. While the
later proved to be insignificant (p=.3399), statistically significant
differences among consulted sub-samples were indicated.
Data from analysis comparing Magid with ARD suggested a moderate
association. The significance level was .0484 with five degrees of
freedom and a Chi-sc[uare of 11.153. The contingency coefficient was
.314.
Of the two sub-samples, more Magid stories originated in the
metro area than ARD stories—50% compared with 29.55%. ARD, however,
contained a higher percentage of stories than the Magid sub-sample in
all but one of the remaining categories. It appears that Magid
newscasts prefer metro news.
Testing the association further, statistics were computed
comparing Magid with Primo, and results were slightly more
significant. With a Chi-square of 10.39 and four degrees of freedom,
the significance level was .0343 with a contingency coefficient of
.298. Again, Magid demonstrated a much greater tendency than Primo
(26.53%) to include more metro news. Primo tended to concentrate on
the ADI area (36.73%), although not to the same extent.
Analysis was also computed to compare ARD and Primo. The
results suggested a statistically significant association between the
sub-samples and the variable. There were five degrees of freedom and
a significance level of .027. Chi-square was 12.635 with a
contingency coefficient of .346.
63
Areas reflecting the greatest difference between the two sub-
samples were ADI and state. Corresponding to the Magid comparison,
Primo tended to air more ADI news than the ARD sub-sample (11.36%) —
more than a 25% difference. ARD contained 20% more state stories than
Primo.
Storv Topic
Analysis of this variable indicated a moderately significant
difference between all four sub-samples. There were 33 degrees of
freedom, and Chi-square was 48.557. The significance was .0395, and
the contingency coefficient was .438 (see Table 17).
Differences among the sub-samples were difficult to locate due
to the number of cells and the broad range of percentages. The
largest discrepancies between observed frequencies and expected values
were attributed to differences among the consultants. There were a
larger number of Magid stories covering accidents/disasters and a
larger number of Primo stories about violence/crime. More than 42% of
the total number of stories coded as accidents/disasters were from the
Magid sub-sample, and 40% of all violence/crime stories were from
Primo.
The only additional analysis with significant results, however,
compared the frequencies of Magid with ARD (see Table 18). With 10
degrees of freedom, the p value level was .0542. Chi-square was
18.044, and the contingency coefficient was .375. Comparing rows,
Magid again represented the largest percentage of accident/disaster
stories with 78.57% of the total. Nearly 70% of the stories coded as

64
Table 17. Story Topic Percentages: Sub-sample Comparison
Magid ARD Primo Non-consulted Rows* Columns** Rows Columns Rows Columns Rows Columns
Government 12 5.17 24 11.54 32 15.69 32 18.18
6.9 36 17.31 40 19.61 8 4.55
26.32 8.62 42.11 15.38 10.53 3.92 21.05 9.09
1.72 0 0 0 0 50 2.27
5.17 33.33 3.85 16.67 1.96 0 0
Accidents/ Disasters 42.31 18.97 11.54 5.77 23.08 11.76 23.08 13.64
Public Health 21.43 5.17 28.57 7.69 14.29 3.92 35.71 11.36
Violence/ Crime
Economy
Sports
Education
16
26
50
50
Weather 42.86 5.17 42.86 5.77 0 0 14.29 2.27
Politics/ campaigns 100 6 . 9 0 0 0 0 0 0
Human Interest 24 20.69 30 28.85 22 21.57 24 27.27
Agriculture 0 0 0 0 100 1.96 0 0
Other 34.62 15.52 7.69 3.85 38.46 19.61 19.23 11.36
*Reflects total sample. **Reflects sub-sample.
p = .0395 DF = 33 Chi square = 48.557 Contingency coefficient = .438

65
Table 18. Story Topic Percentages: Magid/ARD Comparison
Magid ARD Rows* Columns** Rows Columns
30.77
38.46
100
60
6.9
8.62
1.72
5.17
Government 33.33 5.17 66.67 11.54
Violence/Crime 30.77 6.9 69.23 17.31
Economy 38.46 8.62 61.54 15.38
Sports
Education 60 5.17 40 3.85
Accidents/Disasters 78.57 18.97 21.43 5.77
Public Health/Welfare 42.86 5.17 57.14 7.69
Weather 50 5.17 50 5.77
Politics/Campaigns 100 6.9 0 0
Human Interest 44.44 20.69 55.56 28.85
Agriculture 0 0 0 0
Other 81.82 15.52 18.18 3.85
•Reflects total sample. ••Reflects sub-sample.
p = .0542 DF = 10 Chi square = 18.044 Contingency coefficient = .375

66
violence/crime were from the ARD sample—more than twice the number of
Primo stories.
To isolate areas of possible correlation further, additional
statistics were computed collapsing cells to create a two-by-four
analysis. The independent variables were the story topics
violence/crime and accidents/disasters (see Table 19). The results
were statistically significant (p=.0261) with a .392 contingency
coefficient. There were three degrees of freedom, and Chi-square was
9.251. Column percentages indicated similarities between Magid and
the non-consulted sub-sample. The difference between the two samples
in the percentage of violence/crime and accidents/disaster stories was
less than two percent.

67
Table 19. Violence/Crime, Accidents/Disasters Percentages; Sub-sample Comparison
Magid ARD Primo Non-consulted Rows^ Columns^^ Rows Columns Rows Columns Rows Columns
Violence/ Crime 16 26.67 36 75 40 62.5 8 25
Accidents/ Disasters 42.31 73.33 11.54 25 23.08 37.5 23.08 75
•Reflects total sample. ••Reflects sub-sample.
p = .0261 DF = 3 Chi square = 9.251 Contingency coefficient = .392

CHAPTER V
SUMMARY AND CONCLUSIONS
Local television is rapidly becoming a prime source of news.
Those responsible for the news decisions that transform everyday
events into the sights and sounds of the evening newscast are also
partially responsible for building the public agenda of issues and
events. But how much of that responsibility actually rests on the
individual shoulders of the traditional television news gatekeeper?
This study was written to determine to what degree consultant
influence outside the newsroom affects news decisions and the content
of local newscasts.
Researchers investigating the news agenda traditionally have
approached the subject primarily in terms of issues and have
concentrated more on effects than on content. But the agenda framed
by local television news is more than issues. It exists within the
institutional framework of the television medium and encompasses all
aspects of content.
Of particular concern to this study was the potential for
influencing the agenda—in the broadest sense of the word—through the
cumulative development of a newscast theme or format. Examining the
newscast as a complete entity, evidence of recurring elements—the
amount of time given to news topics, the manner in which stories are
presented, etc.—contribute to a totality of meaning that ultimately
influences the audience perception of news.
68

69
Consequently, the degree to which consultants are responsible
for developing guidelines that shape newscast format is also
indicative of consultant influence in building the local television
news agenda for the gatekeeper.
To detect this influence, the study examined 242 news stories
for evidence of differences in newscast content between consulted and
non-consulted newscasts. Samples from three consulting firms were
chosen with the underlying assumption that correlations between
consulted and non-consulted newscasts would be evident despite
competitive practices among consultants.
Of the cosmetic-specific variables studied, results did not lend
support to hypothesis I. The findings indicated an overall similarity
of local television newscasts. Both sub-samples tended to use only
one graphic per news story (45.24% of the total saunple), as well as
natural sound on stories with video tape recordings (66.87% of the
total sample). Voice-over was the preferred story treatment (the mode
for all four sub-samples) and banter/chit chat between anchors was
absent in more than two-thirds of both sub-samples—81.61% of the
total saunple of news stories.
Support for hypothesis II was weak as well. Similarities
between consulted and non-consulted newscasts were also evident in
content-specific variables. The majority of stories of all sub-
samples were soft news, planned events, of general human interest, and
written in the third person.
However, results of this study reflected a discernable influence
of consultants in both the presentation and content of news stories.

70
but the direction and degree of that influence probably is consultant
specific. One should note that other explanations for the differences
are possible—and may emerge from a larger sample or comparisons among
groups of non-consulted stations. Nevertheless, there were some
interesting differences and statistically significant correlations
between the four sub-saunples when compared individually.
Overall, Primo appeared to account for most of the more
statistically significant cosmetic differences among the consulted
sub-samples. Primo tended to use less natural sound and fewer
multiple anchor shots. Although all three consultants preferred to
emphasize the anchor in story treatment, Primo also tended to use more
video enhancement of anchor stories (voice-overs and voice-overs with
sound bites) than both Magid or ARD. Promotional bumpers were used
considerably less in Primo newscasts.
When one examines reporter emphasis variables among the three
consulted sub-samples, Primo demonstrated the only significant
difference by including shots of the reporter stooping/turning in
nearly half of all package stories.
ARD varied significantly between the other two consulted sub-
samples only in story treatment and the use of anchor tags. Although
both Primo and Magid preferred voice-over story treatment, ARD tended
to use more straight readers. The sub-sample also ran more anchor
tags at the end of stories than either of the other two consulted sub-
saunples.
These cosmetic-specific differences may indicate direct
consultant influence on the gatekeeper and indirect influence on the

71
newscast agenda. A preference for video enhancement may preclude news
stories that are less easily presented visually. Using promotional
bumpers subtracts time from the newshole, which may mean fewer news
stories.
The Magid sub-sample appeared to account for most of the
content-specific differences. Reflecting a preference for more short
stories per newscast, Magid contained the largest number of stories
between consulted samples and the highest percentage of stories less
than 30 seconds in length. The sub-saunple also represented the
largest number of second-person stories, suggesting a preference for
"news you can use."
Magid also appeared to prefer stories about the metro area more
than the other consultants and was less diverse in terms of geographic
orientation. Primo, however, also demonstrated a preference for ADI
area stories, but still maintained proportionately more story
representation in other areas.
Although all the consultant sub-saunples tended to air more
general human interest stories than other story topics, Magid appeared
to prefer news of accidents/disasters more than the other two
consultants. Again, Primo demonstrated a similar preference for
violence/crime.
These content-specific differences also suggest consultant
influence in the complex process of newscast agenda-building. If a
faster pace is the preferred format, gatekeepers may air more short
stories that contain less information and only headline the news

72
event. A preference for news of violence or disasters may sensitize
the gatekeeper to select more sensational stories.
The non-consulted sub-sample tended to correspond more with
Primo in terms of cosmetic-specific variables and with Magid in terms
of content-specific variables. This explains the lack of significant
differences between consulted and non-consulted news stories.
Frequency distributions of the non-consulted sub-sample were generally
similar to the consultant sub-saunple that accounted for the difference
among consultants.
The use of multiple anchor shots was the only variable with a
statistically significant correlation between consulted and non-
consulted sub-samples not accounted for by differences among
consultants. Although Primo and the non-consulted sub-sample both
tended to include multiple anchor shots less than Magid and ARD, the
non-consulted preference for this variable was considerably weaker and
accounted for the association.
This tendency of non-consulted stories to correspond with the
consultant that demonstrates the widest shift from the consulted norm
may be a result of what Harmon (1989a) described as "the cross-
pollination effect [that] leads to local TV newscasts of very
predictable style and content" (p. 136). Anchor emphasis, video
enhancement, preoccupation with the sensational, and an abundance of
local news is a formula for television that may be more the result of
the institutional framework of the medium than an indication of
consultant influence.

73
Rather than representing a difference in presentation and
content among the consultant newscasts, Magid and Primo may be more
traditional in newscast content than ARD. Magid and Primo may reflect
the norm by emphasizing time-honored television news practices in both
content and cosmetics that have proven effective. Only ARD newscasts
reflected occasional deviations from the norm.
Nevertheless, the findings of this study indicate that
consultants do leave their mark on local television newscasts. The
direction and degree of that influence, however, may depend on the
consultant, and future research needs to study consultants in terms of
predictability. Consultant influence on the cumulative effect of
watching the same newscast each evening may be an important part of
agenda-setting that requires further investigation.

REFERENCES
Adams, R. c., & Fish, M. J. (1987). TV news directors' perceptions of station management style. Journalism Ouarterlv. 64. 154-162
Adams, W., & Schreibman, F. (Eds.). (1978). Television network news Washington, D.C.: George Washington University.
Altheide, D. L. (1976). Creating realitv (Vol. 33). Beverly Hills: Sage Publications.
Altheide, D. L. (1985). Impact of format and ideology on TV news coverage of Iran. Journalism Ouarterly. 62, 346-351.
Arlen, M. J. (1969). Living-room war. New York: The Viking Press.
Batra, N. D. (1987). The hour of television: Critical approaches. Metuchen, N.J.: The Scarecrow Press, Inc.
Berkowitz, D. (1987). TV news sources and news channels: A study in agenda-building. Journalism Ouarterlv. 64, 508-519.
Bryant, J., & Zillmann, D. (Eds.). (1986). Perspectives on media effects. Hillsdale, N.J.: Lawrence Erlbaum Associates.
Carragee, K., Rosenblatt, M., & Michaud, G. (1987). Agenda-setting research: A critique and theoretical alternative. In S. Thomas (Ed.), Studies in Communication Research, Vol. 3 (pp. 35-49). Norwood, N.J.: Ablex.
Carroll, R. L. (1985)-. Content values in TV news programs in small and large markets. Journalism Quarterly, 62, 877-882.
Cross, D. W. (1983). Mediaspeak. New York: Copward-McCann.
DeFleur, M. L. , & Ball-Rokeach, S. (1982). Theories of mass communication (4th ed.). New York: Longman.
Epstein, E. J. (1973). News from nowhere. New York: Random House.
Fink, C. C. (1988). Media ethics in the newsroom and beyond. New York: McGraw-Hill Book Company.
Fishman, M. (1980). Manufacturing the news. Austin: University of Texas Press.
Gans, H. J. (1980). Deciding what's news. New York: Vintage Books.
74

75
Graber, D. A. (1987). Television news without pictures? Critical Studies in Mass Communication, 49(1), 74-78.
Harmon, M. D. (1989a). Local television news gatekeeping (Doctoral dissertation, Ohio University, 1988). University Microfilms International.
Harmon, M. D. (1989b). Market size and local television news judgment. Journal of Media Economics. Spring 1989, 15-29.
Hewitt, J., & Houlberg, R. (1986). Local broadcast news editors and managers: A multiple station, single market study. Journalism Ouarterlv. 63, 834-839.
Iyengar, S., & Kinder, D. R. (1987). News that matters. Chicago: University of Chicago Press.
Jamieson, K. H., & Campbell, K. K. (1983). The interplay of influence. Belmont, California: Wadsworth Publishing.
Lesher, S. (1982). Media unbound. Boston: Houghton.
Lippmann, W. (1922). Public opinion. New York: MacMillan.
Manning-Miller, C. L. (1989, August). Media agenda-building and
election campaigns. Paper presented at AEJMC Annual Conference, Washington, D.C.
McCombs, M. E., & Shaw, D. L. (1972). The agenda-setting function of mass media. Journalism Quarterly, 36, 176-187.
Powers, R. (1977). The newscasters. New York: St. Martin's Press.
Rapping, E. (1987). The looking glass world of nonfiction TV. Boston: South End Press.
Robinson, J., & Levy, M. R. (1986). The main source. Beverly Hills: Sage Publications.
Roper Organization, Inc. (1989). Public attitudes toward television and other media in a time of change (No. 14). New York, N.Y.: Television Information Office.
Rubin, A. (1984). Ritualized and instrumental television viewing. Journal of Communication, 34:/ 67-77.
Smith, C. (1988). News critics, newsworkers and local television news. Journalism Ouarterly, 65, 341-346.
Stone, G., Hartung, B., & Jensen, D. (1987). Local TV news and the good-bad dyad. .Tnurnalism Ouarterly, 64. 37-44.

76
Weaver, P. (1975). Newspaper news and television news. In D. Cater & R. Adler (Eds.), Television as a social force: New approaches to TV criticism (pp. 81-94). New York: Praeger Publishers.
Westin, A. (1982). Newswatch. New York: Simon and Schuster.
Wulfemeyer, K. T. (1984). Perceptions of viewer interests by local TV journalists. Journalism Ouarterlv. 61. 432-435.

APPENDIX
TV NEWS CODING
Column 1 — Consultant 1—Magid 2—Audience research and development 3—Primo 4—Non consulted
Columns 2-4 — Market Rank (001-200)
Column 5 — Time 1—Early evening newscast 2—Late evening newscast
Columns 6 & 7 — Story Number (01-99)
Columns 8-10 — Story Length (001-999 seconds)
Column 11 0—NA 1—Hard 2—Soft
Column 12 0—NA 1—Spontaneous 2—Planned 3~Enterprise
Column 13 — "Person of the Story" 1—1st person, "I, me" 2—2nd person, "you" 3—3rd person, "they" 4—NA
Column 14 — Number of Graphics (0-9)
Column 15 — Geographic Orientation 0—NA 1—Metro, city, or home county 2 Area of dominant influence, coverage area outside home county 3 state, the home state of the station outside the metro or ADI 4—Region, adjoining states
77

78
5—National, all other U.S. locations 6—International
Columns 16-17 — Story Treatment 1—Reader 2—Voice-over 3—Voice-over with VTR 4—Anchor package 5—Reporter package
6 Reporter studio or newrooom segment with or without VTR 7—Live remote with or without VTR 8—Bumper 9—Sports report
10—Weather report
Columns 18-19 — Story Topic 0—NA 1—Government 2—Violence/crime 3—Economy 4—Sports 5—Education 6—Accidents/disaster 7—Public health and welfare 8—Weather 9—Politics/campaigns
10—General human interest 11—Agriculture 12—Other
Presence or absence coding
1—absent, 2—present, 0—not applicable
Natural sound Banter or chit-chat at beginning or end of story Anchor 2-shot at beginning or end of story
In packages:
Touching or pointing by reporter/anchor Stooping or turning by reporter/anchor Walking by reporter/anchor Field stand-up in a package Reaction shot of anchor or reporter Anchor tag to package

PERMISSION TO COPY
In presenting this thesis in partial fulfillment of the
requirements for a master's degree at Texas Tech University, I agree
that the Library and my major department shall make it freely avail
able for research purposes. Permission to copy this thesis for
scholarly purposes may be granted by the Director of the Library or
my major professor. It is understood that any copying or publication
of this thesis for financial gain shall not be allowed without my
further written permission and that any user may be liable for copy
right infringement.
Disagree (Permission not granted) Agree (Permission granted)
Student's signature
Date
n-.jn-'lc) Date