Embed Size (px)
Citation preview

PHYSICAL REVIEW E JUNE 1998VOLUME 57, NUMBER 6
Dynamics of viscoplastic deformation in amorphous solids
M. L. Falk and J. S. LangerDepartment of Physics, University of California, Santa Barbara, Santa Barbara, California 93106
~Received 11 December 1997!
We propose a dynamical theory of low-temperature shear deformation in amorphous solids. Our analysis isbased on molecular-dynamics simulations of a two-dimensional, two-component noncrystalline system. Thesenumerical simulations reveal behavior typical of metallic glasses and other viscoplastic materials, specifically,reversible elastic deformation at small applied stresses, irreversible plastic deformation at larger stresses, astress threshold above which unbounded plastic flow occurs, and a strong dependence of the state of the systemon the history of past deformations. Microscopic observations suggest that a dynamically complete descriptionof the macroscopic state of this deforming body requires specifying, in addition to stress and strain, certainaverage features of a population of two-state shear transformation zones. Our introduction of these statevariables into the constitutive equations for this system is an extension of earlier models of creep in metallicglasses. In the treatment presented here, we specialize to temperatures far below the glass transition andpostulate that irreversible motions are governed by local entropic fluctuations in the volumes of the transfor-mation zones. In most respects, our theory is in good quantitative agreement with the rich variety of phenom-ena seen in the simulations.@S1063-651X~98!01306-3#
PACS number~s!: 83.50.Nj, 62.20.Fe, 61.43.2j, 81.05.Kf
r-nvioicids
inncssdis
raic
ano
n-’’
veth
auav
uce
htao
a-inmhas
ith
urn-
rd-em-hes ofnicaliors
atat
h un-f the. Inseeen-nts
allyrm-in,
callre-inin-e ar-
indnalme-thisison,loyse-nby
I. INTRODUCTION
This paper is a preliminary report on a moleculadynamics investigation of viscoplastic deformation in a nocrystalline solid. It is preliminary in the sense that we hacompleted only the initial stages of our planned simulatproject. The results, however, have led us to a theoretinterpretation that we believe is potentially useful as a gufor further investigations along these lines. In what followwe describe both the simulations and the theory.
Our original motivation for this project was an interestthe physics of deformations near the tips of rapidly advaing cracks, where materials are subject to very large streand experience very high strain rates. Understanding thesipative dynamics that occur in the vicinity of the crack tipnecessary to construct a satisfactory theory of dynamic fture @1#. Indeed, we believe that the problem of dynamfracture cannot be separated from the problem of understing the conditions under which a solid behaves in a brittleductile manner@2–6#. To undertake such a project we evetually shall need sharper definitions of the terms ‘‘brittleand ‘‘ductile’’ than are presently available; but we leasuch questions to future investigations while we focus onspecifics of deformation in the absence of a crack.
We have chosen to study amorphous materials becthe best experiments on dynamic instabilities in fracture hbeen carried out in silica glasses and polymers@7,8#. Weknow that amorphous materials exhibit both brittle and dtile behavior, often in ways that, on a macroscopic levlook very similar to deformation in crystals@9#. More gener-ally, we are looking for fundamental principles that migpoint us toward theories of deformation and failure in broclasses of macroscopically isotropic solids where thinkingdeformation in terms of the dynamics of individual disloctions @2,3# is either suspect, due to the absence of underlycrystalline order, or simply intractable, due to the extrecomplexity of such an undertaking. In this way we hope tthe ideas presented here will be generalizable perhap
571063-651X/98/57~6!/7192~14!/$15.00
-enale,
-esis-
c-
d-r
e
see
-l,
df
getto
some polycrystalline materials or even single crystals wlarge numbers of randomly distributed dislocations.
We describe our numerical experiments in Sec. II. Oworking material is a two-dimensional, two-component, nocrystalline solid in which the molecules interact via LennaJones forces. We purposely maintain our system at a tperature very far below the glass transition. In texperiments, we subject this material to various sequencepure shear stresses, during which we measure the mecharesponse. The simulations reveal a rich variety of behavtypical of metallic glasses@10–13# and other viscoplasticsolids @14#, specifically, reversible elastic deformationsmall applied stresses, irreversible plastic deformationsomewhat larger stresses, a stress threshold above whicbounded plastic flow occurs, and a strong dependence ostate of the system on the history of past deformationsaddition, the molecular-dynamics method permits us towhat each molecule is doing at all times; thus we can idtify the places where irreversible molecular rearrangemeare occurring.
Our microscopic observations suggest that a dynamiccomplete description of the macroscopic state of this defoing body requires specifying, in addition to stress and stracertain average features of a population of what we shall‘‘shear transformation zones.’’ These zones are smallgions, perhaps consisting of only five or ten molecules,special configurations that are particularly susceptible toelastic rearrangements in response to shear stresses. Wgue that the constitutive relations for a system of this kmust include equations of motion for the density and interstates of these zones; that is, we must add new tidependent state variables to the dynamical description ofsystem@15,16#. Our picture of shear transformation zonesbased on earlier versions of the same idea due to ArgSpaepen, and others who described creep in metallic alin terms of activated transitions in intrinsically heterogneous materials@17–22#. These theories, in turn, drew oprevious free-volume formulations of the glass transition
7192 © 1998 The American Physical Society

s t
wineo
foiaouedn
tectiohef
ewbeisa
raemae
ovennviou
thuapoolaT
th
altiog
tsities
r
s
r--
d-
theo-
qs.e
thatointhela-
ofqua-
temnceulkr aren-
iseat
d byn
senionsndhat
57 7193DYNAMICS OF VISCOPLASTIC DEFORMATION IN . . .
Turnbull, Cohen, and others in relating the transition ratelocal free-volume fluctuations@20,23–25#. None of thosetheories, however, were meant to describe the lotemperature behavior seen here, especially the different kof irreversible deformations that occur below and abovstress threshold, and the history dependence of the respof the system to applied loads.
We present the theory of the dynamics of shear transmation zones in Sec. III. This theory contains four crucfeatures that are not, so far as we know, in any previanalysis. First, once a zone has transformed and relievcertain amount of shear stress, it cannot transform agaithe same direction. Thus the system saturates and, inlanguage of granular materials, it becomes ‘‘jammed.’’ Sond, zones can be created and destroyed at rates proporto the rate of irreversible plastic work being done on tsystem. This is the ingredient that produces a thresholdplastic flow; the system can become ‘‘unjammed’’ when nzones are being created as fast as existing zones aretransformed. Third, the attempt frequency is tied to the noin the system, which is driven by the strain rate. The stochtic nature of these fluctuations is assumed to arise fromdom motions associated with the disorder in the systFourth, the transition rates are strongly sensitive to theplied stress. It is this sensitivity that produces memoryfects.
The resulting theory accounts for many of the featuresthe deformation dynamics seen in our simulations. Howeit is a mean-field theory that fails to take into account aspatial correlations induced by interactions between zoand therefore it cannot explain all aspects of the behathat we observe. In particular, the mean-field nature oftheory precludes, at least for the moment, any analysisstrain localization or shear banding.
II. MOLECULAR-DYNAMICS EXPERIMENTS
A. Algorithm
Our numerical simulations have been performed inspirit of previous investigations of deformation in amorphosolids @26–29#. We have examined the response to anplied shear of a noncrystalline, two-dimensional, twcomponent solid composed of either 10 000 or 20 000 mecules interacting via Lennard-Jones forces. Our molecudynamics algorithm is derived from a standard NP~number, pressure, temperature! dynamics scheme@30#, i.e.,a pressure-temperature ensemble, with a Nose-Hoovermostat @31–33# and a Parinello-Rahman barostat@34,35#modified to allow imposition of an arbitrary two-dimensionstress tensor. The system obeys periodic boundary condiand both the thermostat and barostat act uniformly throuout the sample.
Our equations of motion are
rn5pn
mn1@ «#•~rn2R0!, ~2.1!
pn5Fn2~@ «#1j@ I # !pn , ~2.2!
j51
tT2S Tkin
T21D , ~2.3!
o
-dsanse
r-lsa
inhe-nal
or
inges-n-.
p-f-
fr,yesorr
of
es-
-l-r-
er-
nsh-
@ «#521
tP2
V
NkBT~@sav#2@s#!, ~2.4!
L5@ «#•L . ~2.5!
Here rn and pn are the position and momentum of thenthmolecule andFn is the force exerted on that molecule by ineighbors via the Lennard-Jones interactions. The quantin square brackets, e.g.,@ «# or @s#, are two-dimensionaltensors.T is the temperature of the thermal reservoir,V isthe volume of the system~in this case, the area!, andN is thenumber of molecules.Tkin is the average kinetic energy pemolecule divided by Boltzmann’s constantkB . @s# is theexternally applied stress and@sav# is the average stresthroughout the system computed to be
@sav# i j 51
4V(n
(m
Fnmi r nm
j , ~2.6!
whereFnmi is the i th component of the force between pa
ticles n and m, r nmj is the j th component of the vector dis
placement between those particles, andV is the volume ofthe system.L is the locus of points that describe the bounary of the simulation cell. While Eq.~2.5! is not directlyrelevant to the dynamics of the particles, keeping track ofboundary is necessary in order to properly calculate intermlecular distances in the periodic cell.
The additional dynamical degrees of freedom in E~2.1!–~2.5! are a viscosityj, which couples the system to ththermal reservoir, and a strain rate@ «#, via which the exter-nally applied stress is transmitted to the system. Note
@ «# induces an affine transformation about a reference pR0, which, without loss of generality, we choose to be torigin of our coordinate system. In a conventional formution, @s# would be equal to2P @ I #, whereP is the pressureand @ I # is the unit tensor. In that case, these equationsmotion are known to produce the same time-averaged etions of state as an equilibrium NPT ensemble@30#. By in-stead controlling the tensor@s#, including its off-diagonalterms, it is possible to apply a shear stress to the syswithout creating any preferred surfaces that might enhasystem-size effects and interfere with observations of bproperties. The applied stress and the strain-rate tensoconstrained to be symmetric in order to avoid physically uinteresting rotations of the cell. Except where otherwnoted, all of our numerical experiments are carried outconstant temperature, withP 5 0, and with the sampleloaded in uniform, pure shear.
We have chosen the artificial time constantstT andtP torepresent physical aspects of the system. As suggesteNose @31#, tT is the time for a sound wave to travel ainteratomic distance and, as suggested by Anderson@36#, tPis the time for sound to travel the size of the system.
B. Model solid
The special two-component system that we have choto study here has been the subject of other investigat@37–39# primarily because it has a quasicrystalline groustate. The important point for our purposes, however, is t

taalo
uc
es
a
oo
rgth
envhcathffi
lini
e
hv
ul
vomlaaicoth
in
err
he
usedveperi-set
meiated
are-e
icalra-
antns.on-sedaer
a-e-
lyco-
al see,in-bes
ig.thed-
tant
ses,s tos-%.
oni-thisallical
wethe
in-ld it
7194 57M. L. FALK AND J. S. LANGER
this system can be quenched easily into an apparently sglassy state. Whether this is actually a thermodynamicstable glass phase is of no special interest here. We carethat the noncrystalline state has a lifetime that is very mlonger than the duration of our experiments.
Our system consists of molecules of two different sizwhich we call ‘‘small’’ (S) and ‘‘large’’ (L). The interac-tions between these molecules are standard 6-12 LennJones potentials
Uab~r !54eabF S aab
r D 12
2S aab
r D 6G , ~2.7!
where the subscriptsa,b denoteS or L. We choose thezero-energy interatomic distancesaab to be
aSS52sinS p
10D , aLL52sinS p
5 D , aSL51, ~2.8!
with bond strengths
eSL51, eSS5eLL51
2. ~2.9!
For computational efficiency, we impose a finite-range cuton the potentials in Eq.~2.7! by setting them equal to zerfor separation distancesr greater than 2.5aSL . The massesare all taken to be equal. The ratio of the number of lamolecules to the number of small molecules is halfgolden mean
NL
NS5
11A5
4. ~2.10!
In the resulting system, it is energetically favorable for tsmall molecules to surround one large molecule or for filarge molecules to surround one small molecule. The higfrustrated nature of this system avoids problems of locrystallization that often occur in two dimensions wherenucleation of single-component crystalline regions is dicult to avoid. As shown by Lanc¸on et al. @37#, this systemgoes through something like a glass transition upon coofrom its liquid state. The glass transition temperature0.3T0, wherekBT05eSL . All the simulations reported herhave been carried out at a temperatureT50.001T0, that is, at0.3% of the glass transition temperature. Thus all of the pnomena to be discussed here take place at a temperaturemuch lower than the energies associated with the molecinteractions.
In order to start with a densely packed material, we hacreated our experimental systems by equilibrating a randdistribution of particles under high pressure at the low teperature mentioned above. After allowing the system to reat high pressure, we have reduced the pressure to zeroagain allowed the sample to relax. Our molecular-dynamprocedure permits us to relax the system only for timesthe order of nanoseconds, which are not long enough formaterial to experience any significant amount of annealespecially at such a low temperature.
We have performed numerical experiments on two diffent samples, containing 10 000 and 20 000 molecules,spectively. All of the simulation results shown are from t
blelynlyh
,
rd-
ff
ee
elyl
e-
gs
e-eryar
em-xndsne
g,
-e-
larger of the two samples; the smaller sample has beenprimarily to check the reliablility of our procedures. We hacreated each of these samples only once; thus each exment using either of them starts with precisely the sameof molecules in precisely the same positions. As will becoclear, there are both advantages and uncertainties assocwith this procedure. On the one hand, we have a very cfully controlled starting point for each experiment. On thother hand, we do not know how sensitive the mechanproperties of our system might be to details of the prepation process, nor do we know whether to expect significsample-to-sample variations in the molecular configuratioTo illustrate these uncertainties, we show the elastic cstants of the samples in Table I. The moduli are expresthere in units ofeSL /aSL
2 . @Note that the Poisson ratio fortwo-dimensional~2D! system has an upper bound of 1 raththan 0.5 as in the three-dimensional case.# The appreciabledifferences between the moduli of supposedly identical mterials tell us that we must be very careful in drawing dtailed conclusions from these preliminary results.
C. Simulation results
1. Macroscopic observations
In all of our numerical experiments, we have tried simpto mimic conventional laboratory measurements of visplastic properties of real materials. The first of these ismeasurement of stress at constant strain rate. As we shalthis supposedly simplest of the experiments is especiallyteresting and problematic for us because it necessarily protime-dependent behavior near the plastic yield stress.
Our results for two different strain rates are shown in F1. The strain rates are expressed in units proportional tofrequency of oscillation about the minimum in the LennarJones potential, specifically, in units ofv0[(eSL /maSL
2 )1/2,wherem is the particle mass.@The actual frequency for theSL potential, in cycles per second, is (3321/3/p)v0>1.2v0.# As usual, the sample has been kept at constemperature and at pressureP50. At low strain, the materialbehaves in a linearly elastic manner. As the strain increathe response becomes nonlinear and the material begindeform plastically. Plastic yielding, that is, the onset of platic flow, occurs when the strain reaches approximately 0.7Note that the stress does not rise smoothly and monotcally in these experiments. We presume that most ofirregularity would average out in larger systems. As we shsee, however, there may also be more interesting dynameffects at work here.
In all of the other experiments to be reported here,have controlled the stress on the sample and measuredstrain. In the first of these, shown in Fig. 2, we havecreased the stress to various different values and then heconstant.
TABLE I. Sample sizes and elastic constants.
Sample MoleculesShear
modulusBulk
modulus2D Poisson
ratioYoung’smodulus
1 10 000 9.9 31 0.51 302 20 000 16 58 0.57 50

zfi
tre
reu
dat
ores
as
to
eral
mpleout
ands aitdis
andlesre-
lopstheave
abythis
oftic
ea-e theheoffor-lso,tionoth
veheare thes inare
allap-di-
-n
te
abee
ap
iaoryiets
ing
, thed in
57 7195DYNAMICS OF VISCOPLASTIC DEFORMATION IN . . .
In each of these experimental runs, the stress starts atand increases at the same constant rate until the desiredstress is reached. The graphs show both this applied s~solid symbols! and the resulting strain~open symbols!, asfunctions of time, for three different cases. Time is measuin the same molecular-vibration units used in the previoexperiments, i.e., in units of (maSL
2 /eSL)1/2. The stresses an
strain axes are related by twice the shear modulus so ththe response is linearly elastic, the two curves lie on topone another. In the case labeled by triangles, the final stis small and the response is nearly elastic. For the calabeled by circles and squares, the sample deforms pl
FIG. 1. Shear stress vs strain for strain rates of 1024 ~solid lines!and 231024 ~dotted lines!. The thicker lines that denote the simulation results exhibit both linear elastic behavior at low strain anonlinear response leading to yield at approximatelyss50.35. Thethinner curves are predictions of the theory for the two strain raStrain rate is measured in units of (eSL /m aSL
2 )1/2; stress is mea-sured in units ofeSL /aSL
2 .
FIG. 2. Shear strain~open symbols! vs time for several appliedshear stresses~solid symbols!. The stresses have been ramped upa constant rate until reaching a maximum value and then haveheld constant. The strain and stress axes are related by twicshear modulus so that, for linear elastic response, the openclosed symbols would be coincident. For low stresses the samresponds in an almost entirely elastic manner. For intermedstresses the sample undergoes some plastic deformation prijamming. In the case where the stress is brought above thestress, the sample deforms indefinitely. Time is measured in uni(maSL
2 /eSL)1/2; stress is measured in units ofeSL /aSL
2 .
eronalss
ds
, iffssesti-
cally until it reaches some final strain, at which it ceasesundergo further deformation on observable time scales.~Wecannot rule out the possibility of slow creep at much longtimes.! In the case labeled by diamonds, for which the finstress is the largest of the three cases shown, the sacontinues to deform plastically at constant stress throughthe duration of the experiment. We conclude from thesea number of similar experimental runs that there existwell-defined critical stress for this material, below whichreaches a limit of plastic deformation, that is, it ‘‘jams,’’ anabove which it flows plastically. Because the stressramped up quickly, we can see in curves with squaresdiamonds of Fig. 2 that there is a separation of time scabetween the elastic and plastic responses. The elasticsponse is instantaneous, while the plastic response deveover a few hundred molecular vibrational periods. To seedistinction between these behaviors more clearly, we hperformed experiments in which we load the system tofixed, subcritical stress, hold it there, and then unload itramping the stress back down to zero. In Fig. 3, we showstress and the resulting total shear strain, as functionstime, for one of those experiments. If we define the elasstrain to be the stress divided by twice the previously msured, as-quenched, shear modulus, then we can computinelastic strain by subtracting the elastic from the total. Tresult is shown in Fig. 4. Note that most, but not quite all,the inelastic strain consists of nonrecoverable plastic demation that persists after unloading to zero stress. Note aas shown in Fig. 3, that the system undergoes a small diladuring this process and that this dilation appears to have belastic and inelastic components.
Using the simple prescription outlined above, we hameasured the final inelastic shear strain as a function of sstress. That is, we have measured the shear strain oncsystem has ceased to deform as in the subcritical caseFig. 2, and then subtracted the elastic part. The resultsshown in Fig. 5. As expected, we see only very smamounts of inelastic strain at low stress. As the stressproaches the yield stress, the inelastic strain appears toverge approximately logarithmically.
d
s.
tenthendletetoldof
FIG. 3. Stress and strain vs time for one particular loadwhere the stress has been ramped up toss50.25, held for a time,and then released. Note that, in addition to the shear responsematerial undergoes a small amount of dilation. Time is measureunits of (maSL
2 /eSL)1/2; stress is measured in units ofeSL /aSL
2 .

ysAomllydeefi
eroco
itiay,ly
n
or-her
ti-s toreial,ed,
ap-To
bleweareis-
.entima-ar-e a
laubheuro
logh
-thn
eri-ded,w theliedhs.forlasticbutticalall
7196 57M. L. FALK AND J. S. LANGER
The final test that we have performed is to cycle the stem through loading, reloading, and reverse loading.shown in Fig. 6, the sample is first loaded on the curve fra to b. The initial response is linearly elastic, but, eventuadeviation from linearity occurs as the material begins toform inelastically. Fromb to c, the stress is constant and thsample continues to deform inelastically until reaching anal strain atc. Upon unloading, fromc to d, the system doesnot behave in a purely elastic manner but rather recovsome portion of the strain inelastically. While held at zestress, the sample continues to undergo inelastic strain reery from d to e.
When the sample is then reloaded frome to f , it under-goes much less inelastic deformation than during the inloading. Fromf to g the sample again deforms inelasticallbut by an amount only slightly more than the previousrecovered strain, returning approximately to pointc. Uponunloading again fromg to h to i , less strain is recovered tha
FIG. 4. Elastic and inelastic strain vs time for the same simution as that shown in Fig. 3. The inelastic strain is found by stracting the linearly elastic strain from the total strain. Note tpartial recovery of the inelastic portion of the strain that occduring and after unloading. Time is measured in units(maSL
2 /eSL)1/2.
FIG. 5. Final inelastic strain vs applied stress for stresses beyield. The simulation data~squares! have been obtained by runninthe simulations until all deformation apparently had stopped. Tcomparison to the theory~line! was obtained by numerically integrating the equations of motion for a period of 800 time units,duration of the longest simulation runs. Stress is measured in uof eSL /aSL
2 .
-s
,-
-
rs
v-
lin the previous unloading fromc throughe.
It is during reverse loading fromi to k that it becomesapparent that the deformation history has rendered the amphous sample highly anisotropic in its response to furtapplied shear. The inelastic strain fromi to k is much greaterthan that frome to g, demonstrating a very significanBauschinger effect. The plastic deformation in the initial drection apparently has biased the sample in such a way ainhibit further inelastic yield in the same direction, but theis no such inhibition in the reverse direction. The matertherefore, must in some way have microstructurally encodi.e., partially ‘‘memorized,’’ its loading history.
2. Microscopic observations
Our numerical methods allow us to examine what is hpening at the molecular level during these deformations.do this systematically, we need to identify where irreversiplastic rearrangements are occurring. More precisely,must identify places where the molecular displacementsnonaffine, that is, where they deviate substantially from dplacements that can be described by a linear strain field
We start with a set of molecular positions and subsequdisplacements and compute the closest possible approxtion to a local strain tensor in the neighborhood of any pticular molecule. To define that neighborhood, we defin
--
sf
w
e
eits
FIG. 6. Stress-strain trajectory for a molecular-dynamics expment in which the sample has been loaded, unloaded, reloaunloaded again, and then reverse loaded, all at stresses beloyield stress. The smaller graph above shows the history of appshear stress with letters indicating identical times in the two grapThe dashed line in the main graph is the theoretical predictionthe same sequence of stresses. Note that a small amount of inestrain recovery occurs after the first unloading in the simulation,that no such behavior occurs in the theory. Thus the theorecurve from c through h unloads, reloads, and unloads againalong the same line. Time is measured in units of (maSL
2 /eSL)1/2;
stress is measured in units ofeSL /aSL2 .

ngge
aner
hege-
r
h
ow
atn,e,itgh
utprr
intosell
lo-ns-
ureer
ur-ol-
axishisiedthe
eenheld
ng
nhashich
forea-
earas
57 7197DYNAMICS OF VISCOPLASTIC DEFORMATION IN . . .
sampling radius, which we choose to be the interaction ra2.5aSL . The local strain is then determined by minimizinthe mean-square difference between the actual displacemof the neighboring molecules relative to the central onethe relative displacements that they would have if they win a region of uniform strain« i j . That is, we define
D2~ t,Dt !5(n
(i
S r ni ~ t !2r 0
i ~ t !2(j
~d i j 1« i j !
3@r nj ~ t2Dt !2r 0
j ~ t2Dt !# D 2
, ~2.11!
where the indicesi and j denote spatial coordinates and tindexn runs over the molecules within the interaction ranof the reference molecule,n50 being the reference molecule.r n
i (t) is the i th component of the position of thenthmolecule at timet. We then find the« i j that minimizesD2
by calculating
Xi j 5(n
@r ni ~ t !2r 0
i ~ t !#3@r nj ~ t2Dt !2r 0
j ~ t2Dt !#,
~2.12!
Yi j 5(n
@r ni ~ t2Dt !2r 0
i ~ t2Dt !#
3@r nj ~ t2Dt !2r 0
j ~ t2Dt !#, ~2.13!
« i j 5(k
XikYjk212d i j . ~2.14!
The minimum value ofD2(t,Dt) is then the local deviationfrom affine deformation during the time interval@ t2Dt, t#.We shall refer to this quantity asDmin
2 .We have found thatDmin
2 is an excellent diagnostic foidentifying local irreversible shear transformations. Figurecontains four different intensity plots ofDmin
2 for a particularsystem as it is undergoing plastic deformation. The stressbeen ramped up toussu50.12 in the time interval@0,12# andthen held constant in an experiment analogous to that shin Fig. 2. Figure 7~a! showsDmin
2 for t510, Dt510. It dem-onstrates that the nonaffine deformations occur as isolsmall events. In Fig. 7~b! we observe the same simulatiobut for t530, Dt530; that is, we are looking at a later timbut again we consider rearrangements relative to the inconfiguration. Now it appears that the regions of rearranment have a larger scale structure. The pattern seenlooks like an incipient shear band. However, in Fig. 7~c!,where t530, Dt51, we again consider this later time blook only at rearrangements that have occurred in theceding short time interval. The events shown in this figuare small, demonstrating that the pattern shown in Fig. 7~b!is, in fact, an aggregation of many local events. Finally,Fig. 7~d!, we show an experiment similar in all respectsFig. 7~a! except that the sign of the stress has been reverAs in Fig. 7~a!, t510, Dt510, and again we observe sma
e
ntsde
7
as
n
ed
ale-ere
e-e
d.
isolated events. However, these events occur in differentcations, implying a direction dependence of the local traformation mechanism.
Next we look at these processes in yet more detail. Fig8 is a closeup of the molecular configurations in the lowleft-hand part of the largest dark cluster seen in Fig. 7~c!,shown just before and just after a shear transformation. Ding this event, the cluster of one large and three small mecules has compressed along the top-left to bottom-rightand extended along the bottom-left to top-right axis. Tdeformation is consistent with the orientation of the applshear, which is in the direction shown by the arrows on
FIG. 7. Intensity plots ofDmin2 , the deviation from affine defor-
mation, for various intervals during two simulations.~a!–~c! showdeformation during one simulation in which the stress has bramped up quickly to a value less than the yield stress and thenconstant.~a! shows deformations over the first 10 time units and~b!over the first 30 time units.~c! shows the same state as in~b!, butwith Dmin
2 computed only for deformations that took place durithe preceding 1 time unit. In~d!, the initial system and the timeinterval ~10 units! are the same as in~a!, but the stress has beeapplied in the opposite direction. The gray scale in these figuresbeen selected so that the darkest spots identify molecules for wuDminu'0.5aSL .
FIG. 8. Closeup picture of a shear transformation zone beand after undergoing transformation. Molecules after transformtion are shaded according to their values ofDmin
2 using the samegray scale as in Fig. 7. The direction of the externally applied shstress is shown by the arrows. The ovals are included solelyguides for the eye.

keofine
-e
inWesugericricet
or
nict
aifymin
emi.ethi
th
inlables
mbytofari-ew
ioe
l inC
oanedulysib
in
vi-at
normaltion
s inrcesdi-ay
-he
ope
arelid.oks ofrlyFig.la-id
ainmeionfea-on-pearof
nesfor-
heyrytwotwobess.
nsti-t bi-tesveleeens in
chzone
tionwill
hatn-
uror-e a
end
7198 57M. L. FALK AND J. S. LANGER
outside of the figure. Note that this rearrangement taplace without significantly affecting the relative positionsmolecules in the immediate environment of the transformregion. This is the type of rearrangement that Spaepen idtifies as a ‘‘flow defect’’@20#. As mentioned in the Introduction, we shall call these regions shear transformation zon
III. THEORETICAL INTERPRETATION OF THEMOLECULAR-DYNAMICS EXPERIMENTS
A. Basic hypotheses
We turn now to our attempts to develop a theoreticalterpretation of the phenomena seen in the simulations.shall not insist that our theory reproduce every detail of thresults. In fact, the simulations are not yet complete enoto tell us whether some of our observations are truly genproperties of the model or are artifacts of the ways in whwe have prepared the system and carried out the numeexperiments. Our strategy will be first to specify what wbelieve to be the basic framework of a theory and thendetermine which specific assumptions within this frameware consistent with the numerical experiments.
There are several features of our numerical experimethat we shall assume are fundamentally correct and whtherefore, must be outcomes of our theory. These arefollowing. ~i! At a sufficiently small, fixed load, i.e., underconstant shear stress less than some value that we identa yield stress, the system undergoes a finite plastic defortion. The amount of this deformation diverges as the loadstress approaches the yield stress.~ii ! At loading stressesabove the yield stress, the system flows viscoplastically.~iii !The response of the system to loading is history dependIf it is loaded, unloaded, and then reloaded to the sastress, it behaves almost elastically during the reloading,it does not undergo additional plastic deformation. Onother hand, if it is loaded, unloaded, and then reloaded wa stress of the opposite sign, it deforms substantially inopposite direction.
Our theory consists of a set of rate equations describplastic deformation. These include an equation for the inetic strain rate as a function of the stress plus other variathat describe the internal state of the system. We also polate equations of motion for these state variables. Defortion theories of this type are in the spirit of investigationsHart @15#, who, to the best of our knowledge, was the firstargue in a mathematically systematic way that any satistory theory of plasticity must include dynamical state vaables, beyond just stress and strain. A similar point of vihas been stressed by Rice@16#. Our analysis is also influ-enced by the use of state variables in theories of frictproposed recently by Ruina, Dieterich, Carlson, and oth@40–45#.
Our picture of what is happening at the molecular levethese systems is an extension of the ideas of Turnbull,hen, Argon, Spaepen, and others@17–21,23–25#. These au-thors postulated that deformation in amorphous materialscurs at special sites where the molecules are able to rearrthemselves in response to applied stresses. As describSec. II, we do see such sites in our simulations and shallthese shear transformation zones as the basis for our anaHowever, we must be careful to state as precisely as pos
s
gn-
s.
-eeh
alhal
ok
tsh,he
asa-g
nt.e.,
ethe
gs-s
tu-a-
c-
nrs
o-
c-gein
sesis.le
our definition of these zones because we shall use themways that were not considered by the previous authors.
One of the most fundamental differences between preous work and ours is the fact that our system is effectivelyzero temperature. When it is in mechanical equilibrium,changes occur in its internal state because there is no thenoise to drive such changes. Thus the shear transformazones can undergo transitions only when the system imotion. Because the system is strongly disordered, the foinduced by large-scale motions at the position of any invidual molecule may be noisy. These fluctuating forces meven look as if they have a thermal component@46#. Thethermodynamic analogy~thermal activation of shear transformations with temperature being some function of tshear rate! may be an alternative to~or an equivalent of! thetheory to be discussed here. However, it is beyond the scof the present investigation.
Our next hypothesis is that shear transformation zonesgeometrically identifiable regions in an amorphous soThat is, we assume that we could, at least in principle, loat a picture of any one of the computer-generated stateour system and identify small regions that are particulasusceptible to inelastic rearrangement. As suggested by8, these zones might consist of groups of four or more retively loosely bound molecules surrounded by more rig‘‘cages,’’ but that specific picture is not necessary. The midea is that some such irregularities are locked in on tiscales that are very much longer than molecular collistimes. That is not to say that these zones are permanenttures of the system on experimental time scales. On the ctrary, the tendency of these zones to appear and disapduring plastic deformation will be an essential ingredientour theory.
We suppose further that these shear transformation zoare two-state systems. That is, in the absence of any demation of the cage of molecules that surrounds them, tare equally stable in either of two configurations. Veroughly speaking, the molecular arrangements in theseconfigurations are elongated along one or the other ofperpendicular directions, which, shortly, we shall take tocoincident with the principal axes of the applied shear streThe transition between one such state and the other cotutes an elementary increment of shear strain. Note thastability is the natural assumption here. More than two staof comparable stability might be possible but would harelatively low probability. A crucial feature of these bistabsystems is that they can transform back and forth betwtheir two states but cannot make repeated transformationone direction. Thus there is a natural limit to how mushear can take place at one of these zones so long as theremains intact.
We now consider an ensemble of shear transformazones and estimate the probability that any one of themundergo a transition at an applied shear stressss . Becausethe temperatures at which we are working are so low tordinary thermal activation is irrelevant, we focus our attetion on entropic variations of the local free volume. Obasic assumption is that the transition probability is proptional to the probability that the molecules in a zone havsufficiently large excess free volume, say,DV* , in which torearrange themselves. This critical free volume must dep

tio
p-s
itymle
s
e
e
fo
eeg
reteq
ona
enouth
ebit
geneedesiola
onbecan
. II,m,ef
e allfore
ec-as-
to
r aes.s-u-sto
ionoteym-in
bili-
thean-
ffi-eeit isances,
57 7199DYNAMICS OF VISCOPLASTIC DEFORMATION IN . . .
on the magnitude and orientation of the elastic deformaof the zone that is caused by the externally applied stressss .
At this point, our analysis borrows in its general aproach, but not in its specifics, from recent developmentthe theory of granular materials@47# where the only exten-sive state variable is the volumeV. What follows is a verysimple approximation, which, at great loss of generalleads us quickly to the result that we need. The free volui.e., the volume in excess of close packing that the partichave available for motion, is roughly
V2Nv0[Nv f , ~3.1!
whereN is the total number of particles,v f is the averagefree volume per particle, andv0 is the volume per particle inan ideal state of random dense packing. In the dense solidinterest to us herev f!v0 and thereforev0 is approximatelythe average volume per particle even when the systemslightly dilated. The number of states available to this systis roughly proportional to (v f /h)N, whereh is an arbitraryconstant with dimensions of volume~the analog of Planck’sconstant in classical statistical mechanics! that plays no roleother than to provide dimensional consistency. Thus thetropy, defined here to be a dimensionless quantity, is
S~V,N!>N lnS v f
h D>N lnS V2Nv0
N h D . ~3.2!
The intensive variable analogous to temperature isx:
1
x[
]S
]V>
1
v f. ~3.3!
Our activation factor, analogous to the Boltzmann factorthermally activated processes, is therefore
e2~DV* /x!>e2~DV* /v f !. ~3.4!
A formula like Eq.~3.4! appears in various places in thearlier literature@17,23–25#. There is an important differencbetween its earlier use and the way in which we are usinhere. In earlier interpretations, Eq.~3.4! is an estimate of theprobability that any given molecule has a large enough fvolume near it to be the site at which a thermally activairreversible transition might occur. In our interpretation, E~3.4! plays more nearly the role of the thermal activatifactor itself. It tells us something about the configurationprobability for a zone, not just for a single molecule. Whmultiplied by the density of zones and a rate factor, abwhich we shall have more to say shortly, it becomestransformation rate per unit volume.
Note what is happening here. Our system is extremnonergodic and, even when it is undergoing appreciastrain, does not explore more than a very small part ofconfiguration space. Apart from the molecular rearranments that take place during plastic deformation, the ochance that the system has for coming close to any statequilibrium occurs during the quench by which it is forminitially. Because we control only the temperature and prsure during that quench, we must use entropic consideratto compute the relative probabilities of various molecuconfigurations that result from it.
n
in
,e,s
of
ism
n-
r
it
ed.
l
te
lyles-
lyof
-nsr
The transitions occurring within shear transformatizones are strains and therefore they must, in principle,described by tensors. For present purposes, however, wemake some simplifying assumptions. As described in Secour molecular-dynamics model is subject only to a uniforpure shear stress of magnitudess and a hydrostatic pressurP ~usually zero!. Therefore, in the principal-axis system ocoordinates, the stress tensor is
@s#5F2P ss
ss 2PG . ~3.5!
Our assumption is that the shear transformation zones aroriented along the same pair of principal axes and therethat the strain tensor has the form
@«#5F«d «s
«s «dG , ~3.6!
where«s and«d are the shear and dilational strains, resptively. The total shear strain is the sum of elastic and ineltic components
«s5«sel1«s
in . ~3.7!
By definition, the elastic component is the linear responsethe stress
«sel5
ss
2m, ~3.8!
wherem is the shear modulus.In a more general formulation, we shall have to conside
distribution of orientations of the shear transformation zonThat distribution will not necessarily be isotropic when platic deformations are occurring and very likely the distribtion itself will be a dynamical entity with its own equationof motion. Our present analysis, however, is too crudejustify any such level of sophistication.
The last of our main hypotheses is an equation of motfor the densities of the shear transformation zones. Denthe two states of the shear transformation zones by the sbols1 and2 and letn6 be the number densities of zonesthose states. We then write
n65R7n72R6n62C1~ss«sin!n61C2~ss«s
in!.~3.9!
Here theR6 are the rates at which6 states transform to7states. These must be consistent with the transition probaties described in the previous paragraphs.
The last two terms in Eq.~3.9! describe the way in whichthe population of shear transformation zones changes assystem undergoes plastic deformation. The zones can benihilated and created, as shown by the terms with coecientsC1 and C2, respectively, at rates proportional to thrate ss«s
in at which irreversible work is being done on thsystem. This last assumption is simple and plausible, butnot strictly dictated by the physics in any way that we csee. As a caveat we mention that in certain circumstanwhen the sample does work on its environment,ss«s
in could

ioe
oucaha
reyioeao
thecin
n
alesthe
cy
tioesil
oin
terents
theoveof
tary
m,gre-
e
u-yoftive
t-r-ichol-ingive
valtion
rved
ainithin
to
7200 57M. L. FALK AND J. S. LANGER
be negative, in which case the annihilation and creatterms in Eq.~3.9! could produce results that would not bphysically plausible. We believe that such states intheory are dynamically accessible only from unphysistarting configurations. In related theories, however, tmay not be the case.
It is important to recognize that the annihilation and cation terms in Eq.~3.9! are interaction terms and that thehave been introduced here in a mean-field approximatThat is, we implicitly assume that the rates at which shtransformation zones are annihilated and created dependon the rate at which irreversible work is being done onsystem as a whole and that there is no correlation betwthe position at which the work is being done and the plawhere the annihilation or creation is occurring. This is,fact, not the case as shown by Fig. 7~b! and is possibly theweakest aspect of our theory. With the preceding definitiothe time rate of change of the inelastic shear strain«s
in hasthe form
«sin5VzD«@R1n12R2n2#, ~3.10!
where Vz is the typical volume of a zone andD« is theincrement of local shear strain.
B. Specific assumptions
We turn now to the more detailed assumptions and anses that we need in order to develop our general hypothinto a testable theory. According to our hypothesis aboutprobabilities of volume fluctuations, we should write thtransition rates in Eq.~3.9! in the form
R65R0 expF2DV* ~6ss!
v fG . ~3.11!
The prefactorR0 is an as-yet unspecified attempt frequenfor these transformations. In writing Eq.~3.11! we have usedthe assumed symmetry of the system to note that ifDV* (ss)is the required excess free volume for a1→2 transition,then the appropriate free volume for the reverse transimust beDV* (2ss). We adopt the convention that a positivshear stress deforms a zone in such a way that it enhanceprobability of a1→2 transition and decreases the probabity of a 2→1 transition. ThenDV* (ss) is a decreasingfunction of ss .
Before going any further in specifying the ingredientsR0, DV* , etc., it is useful to recast the equations of motionthe following form. Define
ntot[n11n2 , nD[n22n1 , ~3.12!
and
C~ss
ens
cu
ste
the
ie
e
a
tiat
eeWtha-beene
hathed
at
ti
ie
th
tial
ofma-
toanessd in
s ath
n
57 7201DYNAMICS OF VISCOPLASTIC DEFORMATION IN . . .
ably, the only properties of importance to us for the prespurposes are the magnitude ofR0 and the fact that it vanishewhen the shear rates vanish.
Finally, we need to specify the ingredients ofDV* andv f . For DV* we choose the simple form
DV* ~ss!5V0* exp~2ss /m !, ~3.19!
whereV0* is a volume, perhaps of order the average mole
lar volumev0, andm has the dimensions of a shear moduluThe right-hand side of Eq.~3.19! simply reflects the fact thathe free volume needed for an activated transition will dcrease if the zone in question is loaded with a stresscoincides with the direction of the resulting strain. Wchoose the exponential rather than a linear dependencecause it makes no sense for the incremental free volumeV0*to be negative, even for very large values of the applstresses.
Irreversibility enters the theory via a simple switching bhavior that occurs when thess dependence ofDV* in Eq.~3.19! is so strong that it converts a negligibly small ratess50 to a large rate at relevant, nonzero values ofss . Ifthis happens, then zones that have switched in one direcunder the influence of the stress will remain in that stwhen the stress is removed.
In the formulation presented here, we considerv f to beconstant. This is certainly an approximation; in fact, as sin Fig. 3, the system dilates during shear deformation.have experimented with versions of this theory in whichdilation plays a controlling role in the dynamics via varitions in v f . We shall not discuss these versions furthercause they behaved in ways that were qualitatively differfrom what we observed in our simulations. The differencarise from feedback between inelastic dilation and flow toccur in these dilational models and apparently not insimulations. A simple comparison of the quantities involvdemonstrates that the assumption thatv f is approximatelyconstant is consistent with our other assumptions. If wesume that the increment in free volume at zero stress musof order the volume of a small particleV0* 'v0'0.3 andthen look ahead and use our best-fit value for the raV0* /v f'14.0 ~see Sec. III D, Table II!, we find v f'0.02.Since the change in free volume due to a dilational strain«dis Dv f5«d /r, where r is the number density and«d,0.2% for all shear stresses except those very close to yit appears that, generally,Dv f'«dv0!v f . Even when«d51%, the value observed in our simulations at yield,
TABLE II. Values of parameters for comparison to simulatiodata.
Parameter Value
s 0.32
VzD«n` 5.7%n 50.0V0* /v f 14.0
m 0.25
ntot(0)/n` 2.0
t
-
.
-at
be-
d
-
t
one
nee
-t
ste
s-be
o
ld,
e
dilational free volume is only about the same as the inifree volume estimated by this analysis.
As a final step in examining the underlying structurethese equations of motion, we make the scaling transfortions
2m«sin
s[E,
nD
n`[D,
ntot
n`[L,
ss
s[S. ~3.20!
Then we find
E5 EF~S,L,D!, ~3.21!
D52F~S,L,D!~12SD!, ~3.22!
L52F~S,L,D!S~12L!, ~3.23!
where
F~S,L,D!5R0@LS~S!2DC~S!# ~3.24!
and
C~S!51
2FexpS 2V0*
v fe2ASD 1expS 2
V0*
v feASD G ,
S~S!51
2FexpS 2V0*
v fe2ASD 2expS 2
V0*
v feASD G .
~3.25!
Here,
A[s
m, E[
2mVzD«n`
s. ~3.26!
The rate factor in Eq.~3.18! can be rewritten
R05 n1/2~S21 E2!1/4, ~3.27!
where
n[s
2mn. ~3.28!
C. Special steady-state solutions
Although, in general, we must use numerical methodssolve the fully time-dependent equations of motion, we csolve them analytically for special cases in which the strS is held constant. Note that none of the results presentethis subsection, apart from Eq.~3.35!, depend on our specificchoice of the rate factorR0.
There are two specially important steady-state solutionconstantS. The first of these is a jammed solution in whicE50, that is,F(S,L,D) vanishes and therefore
D5LS~S!
C~S!5LT~S!, ~3.29!
where
T~S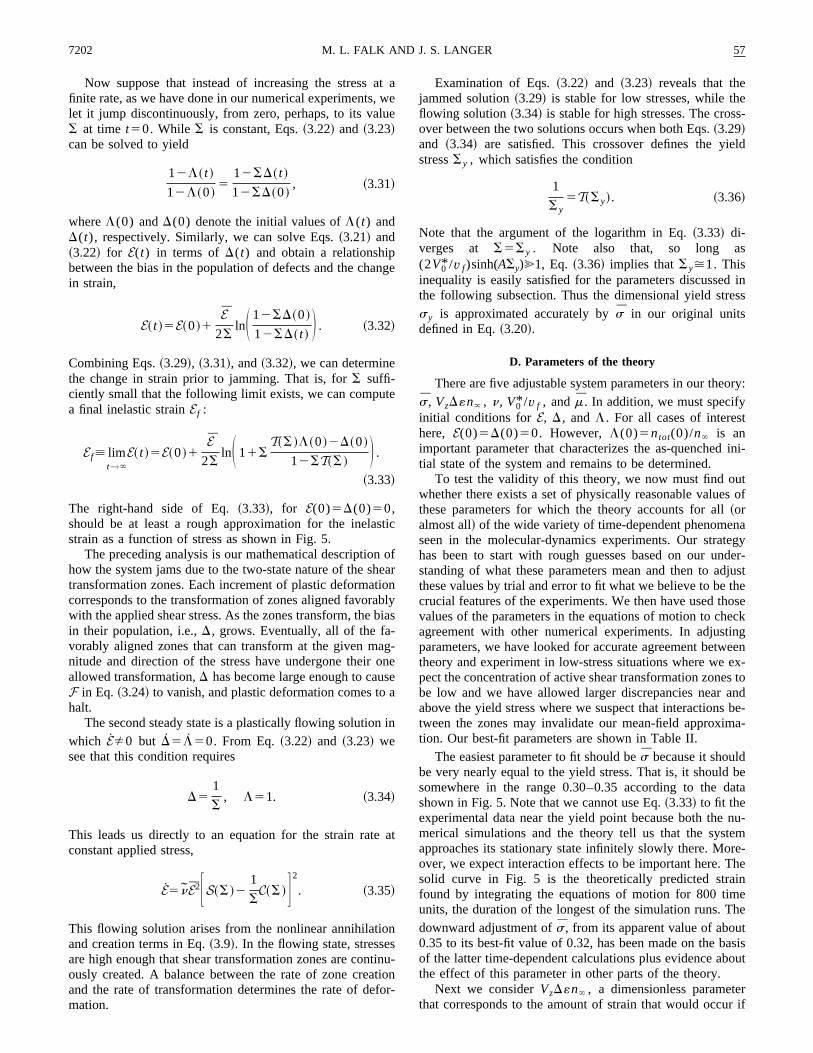
at, wue
n
te
st
ohetiobb
aosea
i
a
onstintifo
es-
ld
s
d inss
ory:
t
ini-
uts of
naegyder-
djusttheoseeckingeen
ex-s toandbe-a-
beata
nu-emre-heinehetasisout
rr if
7202 57M. L. FALK AND J. S. LANGER
Now suppose that instead of increasing the stressfinite rate, as we have done in our numerical experimentslet it jump discontinuously, from zero, perhaps, to its valS at time t50. While S is constant, Eqs.~3.22! and ~3.23!can be solved to yield
12L~ t !
12L~0!5
12SD~ t !
12SD~0!, ~3.31!
whereL(0) andD(0) denote the initial values ofL(t) andD(t), respectively. Similarly, we can solve Eqs.~3.21! and~3.22! for E(t) in terms of D(t) and obtain a relationshipbetween the bias in the population of defects and the chain strain,
E~ t !5E~0!1E
2SlnS 12SD~0!
12SD~ t ! D . ~3.32!
Combining Eqs.~3.29!, ~3.31!, and~3.32!, we can determinethe change in strain prior to jamming. That is, forS suffi-ciently small that the following limit exists, we can compua final inelastic strainEf :
Ef[ limt→`
E~ t !5E~0!1E
2SlnS 11S
T~S!L~0!2D~0!
12ST~S! D .
~3.33!
The right-hand side of Eq.~3.33!, for E(0)5D(0)50,should be at least a rough approximation for the inelastrain as a function of stress as shown in Fig. 5.
The preceding analysis is our mathematical descriptionhow the system jams due to the two-state nature of the stransformation zones. Each increment of plastic deformacorresponds to the transformation of zones aligned favorawith the applied shear stress. As the zones transform, thein their population, i.e.,D, grows. Eventually, all of the fa-vorably aligned zones that can transform at the given mnitude and direction of the stress have undergone theirallowed transformation,D has become large enough to cauF in Eq. ~3.24! to vanish, and plastic deformation comes tohalt.
The second steady state is a plastically flowing solutionwhich EÞ0 but D5L50. From Eq.~3.22! and ~3.23! wesee that this condition requires
D51
S, L51. ~3.34!
This leads us directly to an equation for the strain rateconstant applied stress,
E5 n E2FS~S!21
SC~S!G2
. ~3.35!
This flowing solution arises from the nonlinear annihilatiand creation terms in Eq.~3.9!. In the flowing state, stresseare high enough that shear transformation zones are conously created. A balance between the rate of zone creaand the rate of transformation determines the rate of demation.
ae
ge
ic
farnlyias
g-ne
n
t
u-onr-
Examination of Eqs.~3.22! and ~3.23! reveals that thejammed solution~3.29! is stable for low stresses, while thflowing solution~3.34! is stable for high stresses. The crosover between the two solutions occurs when both Eqs.~3.29!and ~3.34! are satisfied. This crossover defines the yiestressSy , which satisfies the condition
1
Sy5T~Sy!. ~3.36!
Note that the argument of the logarithm in Eq.~3.33! di-verges at S5Sy . Note also that, so long a(2V0* /v f)sinh(ASy)@1, Eq. ~3.36! implies thatSy>1. Thisinequality is easily satisfied for the parameters discussethe following subsection. Thus the dimensional yield stresy is approximated accurately bys in our original unitsdefined in Eq.~3.20!.
D. Parameters of the theory
There are five adjustable system parameters in our thes, VzD«n` , n, V0* /v f , andm. In addition, we must specifyinitial conditions forE, D, and L. For all cases of intereshere, E(0)5D(0)50. However, L(0)5ntot(0)/n` is animportant parameter that characterizes the as-quenchedtial state of the system and remains to be determined.
To test the validity of this theory, we now must find owhether there exists a set of physically reasonable valuethese parameters for which the theory accounts for all~oralmost all! of the wide variety of time-dependent phenomeseen in the molecular-dynamics experiments. Our strathas been to start with rough guesses based on our unstanding of what these parameters mean and then to athese values by trial and error to fit what we believe to becrucial features of the experiments. We then have used thvalues of the parameters in the equations of motion to chagreement with other numerical experiments. In adjustparameters, we have looked for accurate agreement betwtheory and experiment in low-stress situations where wepect the concentration of active shear transformation zonebe low and we have allowed larger discrepancies nearabove the yield stress where we suspect that interactionstween the zones may invalidate our mean-field approximtion. Our best-fit parameters are shown in Table II.
The easiest parameter to fit should bes because it shouldbe very nearly equal to the yield stress. That is, it shouldsomewhere in the range 0.30–0.35 according to the dshown in Fig. 5. Note that we cannot use Eq.~3.33! to fit theexperimental data near the yield point because both themerical simulations and the theory tell us that the systapproaches its stationary state infinitely slowly there. Moover, we expect interaction effects to be important here. Tsolid curve in Fig. 5 is the theoretically predicted strafound by integrating the equations of motion for 800 timunits, the duration of the longest of the simulation runs. Tdownward adjustment ofs, from its apparent value of abou0.35 to its best-fit value of 0.32, has been made on the bof the latter time-dependent calculations plus evidence abthe effect of this parameter in other parts of the theory.
Next we considerVzD«n` , a dimensionless parametethat corresponds to the amount of strain that would occu

eneincean
nmtho
hesuoth
e
as
sgdThretii
ivefr
ngon
aw
sym
.ethwsa
At
nric
f tns
tho
amet
tre
stTheost
ps,ve
healso
sethetraintheiblythee forOur
rainnon
the, noun-
p in
rx-
theodausema-
weas
tesanditu-t or
as0.3,
e is
57 7203DYNAMICS OF VISCOPLASTIC DEFORMATION IN . . .
the density of zones were equal to the equilibrium conctration (ntot5n`) and if all the zones transformed in thsame direction in unison. Alternatively, if the local straincrementD« is about unity, then this parameter is the fration of the volume of the system that is occupied by shtransformation zones. In either way of looking at this quatity, our best-fit value of 5.7% seems sensible.
The parametern is a rate that is roughly the product of aattempt frequency and a statistical factor. The only systedependent quantity with the dimensions of inverse time ismolecular vibrational frequency, which we have seen isorder unity. Our best-fit value of 50 seems to imply that tstatistical factor is moderately large, which, in turn, implithat the shear transformation zones are fairly complex, mtimolecule structures. Lacking any first-principles theorythis rate factor, however, we cannot be confident aboutobservation.
Our first rough guess for a value ofV0* /v f comes from theassumption thatDV* must be about one molecular volumin the absence of an external stress and thatv f is likely to beabout a tenth of this. Thus our best-fit value of 14.0 is resuringly close to what we expected.
The parameterm, a modulus that characterizes the sentivity of DV* to the applied stress, is especially interestinOur best-fit value of 0.25 is almost two orders of magnitusmaller than a typical shear modulus for these systems.means that the shear transformations are induced bytively small stresses or, equivalently, the internal elasmodes within the zones are very soft. This conclusionsupported quite robustly by our fitting procedure. Alternatassumptions, such as control by variations in the averagevolume v f discussed earlier, produce qualitatively wropictures of the time-dependent onset of plastic deformati
Finally, we considerL(0)5ntot(0)/n` , the ratio of theinital zone density to the equilibrium zone density. This prameter characterizes the transient behavior associatedthe initial quench; that is, it determines the as-quenchedtem’s first response to an applied stress. We can learn sothing about this parameter by looking at later behavior, ithe next few segments of a hysteresis loop such asshown in Fig. 6. If, as is observed there, the loop narroafter the first leg, then we know that there was an excesshear transformation zones in the as-quenched systemthat this excess was reduced in the initial deformation.initial excess meansL(0).1, consistent with our best-fivalue of 2.0.
E. Comparisons between theory and simulations
We now illustrate the degree to which this theory can acannot account for the phenomena observed in the numeexperiments.
Figure 9 summarizes one of the principal successes otheory, specifically, its ability to predict the time-dependeonset of plastic deformation over a range of applied stresbelow the yield stress. The solid lines in the figure showshear strains in three different simulations as functionstime. In each simulation the stress is ramped up at the scontrolled rate, held constant for a period of time, and thramped down, again at the same rate. In the lowest curvestress reaches a maximum of 0.1 in our dimensionless s
-
-r-
-ef
e
l-fis
-
i-.eis
la-cs
ee
.
-iths-e-
.,atsofnd
n
dal
hetesefe
nhess
units (eSL /aSL2 ), in the middle curve 0.2, and in the highe
0.3. The dashed lines show the predictions of the theory.excellent agreement during and after the ramp up is our mdirect evidence for the small value ofm quoted above. Thedetailed shapes of these curves at the tops of the ramwhere ss drops abruptly to zero, provide some qualitatisupport for our choice of the rate dependence ofR0 in Eq.~3.18!. As shown in Fig. 5 and discussed in Sec. III D, tfinal inelastic strains in these ramp-up experiments arepredicted adequately by the theory.
The situation is different for the unloading phases of theexperiments, that is, during and after the periods whenstresses are ramped back down to zero. The theoretical srates shown in Fig. 9 vanish abruptly at the bottoms oframps because our transformation rates become negligsmall at zero stress. In the two experimental curves forhigher stresses, however, the strain continues to decreasa short while after the stresses have stopped changing.theory seems to rule out any such recovery of inelastic stat zero stress; thus we cannot account for this phenomeexcept to remark that it must have something to do withinitial state of the as-quenched system. As seen in Fig. 6such recovery occurs when the system is loaded andloaded a second time.
In Fig. 6, we compare the stress-strain hysteresis loothe simulation~solid line! with that predicted by the theory~dashed line!. Apart from the inelastic strain recovery aftethe first unloading in the simulation, the theory and the eperiment agree well with one another at least throughreverse loading to pointk. The agreement becomes less goin subsequent cycles of the hysteresis loop, possibly becshear bands are forming during repeated plastic defortions.
In the last of the tests of theory to be reported here,have added in Fig. 1 two theoretical curves for stressesfunctions of strain at the two different constant strain raused in the simulations. The agreement between theoryexperiment is better than we probably should expect for sations in which the stresses necessarily rise to values a
FIG. 9. Strain vs time for simulations in which the stress hbeen ramped up at a controlled rate to stresses of 0.1, 0.2, andheld constant, and then ramped down to zero~solid lines!. Thedashed lines are the corresponding theoretical predictions. Timmeasured in units of (maSL
2 /eSL)1/2.

aric
s ith
f t
ia
di
th,icgheofa
omoeo-orik
ore
or.ryicaon
r-W
, beseeb
nfothla
lsenatw
uron
emssa
a
he-of
wenstheat
os-ich
ch-ay
la-
w-nd
ma-f ad
ing, atac-
a-usin
talap-asy
nd-an
lesin-belaterysi-emal-
e.
emw,m-
allyweer-rgy
tndn.
ionnoturrs-
7204 57M. L. FALK AND J. S. LANGER
above the yield stress. Moreover, the validity of the compson is obscured by the large fluctuations in the data, whwe believe to be due primarily to small sample size.
Among the interesting features of the theoretical resultFig. 1 are the peaks in the stresses that occur just prior toestablishment of steady states at constant stresses. Tpeaks occur because the internal degrees of freedom osystem, specificallyD(t) and L(t), cannot initially equili-brate fast enough to accommodate the rapidly increasingelastic strain. Thus there is a transient stiffening of the mterial and a momentary increase in the stress needemaintain the constant strain rate. This kind of effect maypart be the explanation for some of the oscillations instress seen in the experiments. In a more speculative veinnote that this is our first direct hint of the kind of dynamplastic stiffening that is needed in order to transmit histresses to crack tips in brittle fracture. The strain rates nthe tips of brittle cracks are at least of the same ordermagnitude as the strain rates imposed here and may inbe substantially higher.
IV. CONCLUDING REMARKS
The most striking and robust conclusion to emerge frthis investigation, in our opinion, is that a wide rangerealistic, irreversible, viscoplastic phenomena occur in antremely simple molecular-dynamics model a twdimensional, two-component, Lennard-Jones amorphsolid at essentially zero temperature. An almost equally sting conclusion is that a theory based on the dynamicstwo-state shear transformation zones is in substantial agment with the observed behavior of this model. This thehas survived several quantitative tests of its applicability
We stated in our Introduction that this is a preliminareport. Both the numerical simulations and the theoretanalysis require careful evaluation and improvements. Mimportantly, the work so far raises many important questiothat need to be addressed in future investigations.
The first kind of question pertains to our moleculadynamics simulations: Are they accurate and repeatable?believe that they are good enough for present purposeswe recognize that there are potentially important difficultiThe most obvious of these is that our simulations have bperformed with very small systems; thus size effects mayimportant. For example, the fact that only a few shear traforming regions are active at any time may accountabrupt jumps and other irregularities sometimes seen insimulations, e.g., in Fig. 1. We have performed the simutions in a periodic cell to eliminate edge effects. We ahave tried to compare results from two systems of differsizes, although only the results from the larger systempresented here. Unfortunately, comparisons between anydifferent initial configurations are difficult because of oinability, as yet, to create reproducible glassy starting cfigurations~a problem that we shall discuss next!. However,we have seen qualitatively the same behavior in both systand assume that phenomena that are common to bothtems can be used as a guide for theoretical investigation
As noted in Sec. II B and in Table I, our two systems hquite different elastic moduli.~Remarkably, their yieldstresses were nearly identical. It would be interesting to le
i-h
nheesehe
n--to
newe
arfct
fx-
us-fe-
y
lsts
eut.ne
s-re-
ot
reo
-
sys-.d
rn
whether this is a repeatable and/or physically important pnomenon.! The discrepancy between the elastic propertiesthe two systems leads us to believe that, in future work,shall have to learn how to control the initial configuratiomore carefully, perhaps by annealing the systems afterinitial quenches. Unfortunately, straightforward annealingtemperatures well below the glass transition is not yet psible with standard molecular-dynamics algorithms, whcan simulate times only up to about 1ms for systems of thissize even with today’s fastest computers. Monte Carlo teniques or accelerated molecular-dynamics algorithms meventually be useful in this effort@49–51#. An alternativestrategy may be simply to look at larger numbers of simutions.
By far the most difficult and interesting questions, hoever, pertain to our theoretical analysis. Although Figs. 7 a8 provide strong evidence that irreversible shear transfortions are localized events, we have no sharp definition o‘‘shear transformation zone.’’ So far, we have identifiethese zones only after the fact, that is, only by observwhere the transformations are taking place. Is it possibleleast in principle, to identify zones before they becometive?
One ingredient of a better definition of shear transformtion zones will be a generalization to isotropic amorphosystems in both two and three dimensions. As we notedSec. III, our functionsn6(t) should be tensor quantities thadescribe distributions over the ways in which the individuzones are aligned with respect to the orientation of theplied shear stress. We believe that this is a relatively egeneralization; one of us~M.L.F.! expects to report on workalong these lines in the future.
Our more urgent reason for needing a better understaing of shear transformation zones is that, without suchunderstanding, we shall not be able to find first-principderivations of several, as-yet purely phenomenological,gredients of our theory. It might be useful, for example, toable to start from the molecular force constants and calcuthe parametersV0* and m that occur in the activation facto~3.19!. These parameters, however, seem to have clear phcal interpretations; thus we might be satisfied to deduce thfrom experiment. In contrast, the conceptually most chlenging and important terms are the rate factor in Eq.~3.18!and the annihilation and creation terms in Eq.~3.9!, wherewe do not even know what the functional forms ought to b
Calculating the rate factor in Eq.~3.18!, or a correct ver-sion of that equation, is clearly a very fundamental problin nonequilibrium statistical physics. So far as we knothere are no studies in the literature that might help us copute the force fluctuations induced at some site by externdriven deformations of an amorphous material. Nor doknow how to compute a statistical prefactor analogous, phaps, to the entropic factor that converts an activation eneto an activation free energy.@48# We do know, however, thathat entropic factor will depend strongly on the size astructure of the zone that is undergoing the transformatio
As emphasized in Sec. III, the annihilation and creatterms in Eq.~3.9! describe interaction effects. Even withithe framework of our mean-field approximation, we do nknow with any certainty what these terms should be. Oassumption that they are proportional to the rate of irreve

ve
l bs.p
et
sivie
mth
spne
de-ipe
al-es,
st-nto
E-cesECant-ord F.hnnde
57 7205DYNAMICS OF VISCOPLASTIC DEFORMATION IN . . .
ible work is by no means unique.~Indeed, we have triedother possibilities in related investigations and have arriat qualitatively similar conclusions.! Without knowing moreabout the nature of the shear transformation zones, it wildifficult to derive such interaction terms from first principle
A better understanding of these interaction terms is escially important because these are the terms that will havbe modified when we go beyond the mean-field theoryaccount for correlations between regions undergoing pladeformations. We know from our simulations that the actzones cluster even at stresses far below the plastic ystress and we know that plastic yield in real amorphousterials is dominated by shear banding. Thus, generalizingpresent mean-field theory to one that takes into accounttial variations in the densities of shear transformation zomust be a high priority in this research program.
Finally, we return briefly to the question that motivatethis investigation: How might the dynamical effects dscribed here, which must occur in the vicinity of a crack tcontrol crack stability and brittle or ductile behavior? As w
e
e
gi
es
d
e
e-tooticeld
a-ea-s
,
have seen, our theoretical picture of viscoplasticity doeslow large stresses to be transmitted, at least for short timthrough plastically deforming materials. It should be intereing to see what happens if we incorporate this picture itheories of dynamic fracture.
ACKNOWLEDGMENTS
This research was supported by DOE Grant No. DFG03-84ER45108, by the DOE Computational ScienGraduate Fellowship Program and, in part, by the MRSProgram of the National Science Foundation under GrNo. DMR96-32716. We wish particularly to thank Alexander Lobkovsky for his attention to this project and fnumerous useful suggestions. We also thank A. Argon anLange for guidance in the early stages of this work, J. Cafor directing us to the papers of E. Hart, and S. Langer aA. Liu for showing us their closely related results on thdynamics of sheared foams.
n,
@1# J. Langer and A. Lobkovsky, J. Mech. Phys. Solids~to bepublished!.
@2# J. Rice and R. Thomson, Philos. Mag.29, 73 ~1974!.@3# J. Rice, J. Mech. Phys. Solids40, 239 ~1992!.@4# M. Khantha, D. Pope, and V. Vitek, Phys. Rev. Lett.73, 684
~1994!.@5# L. Freund and Y. Lee, Int. J. Fract.42, 261 ~1990!.@6# P. Steif, J. Mech. Phys. Solids31, 359 ~1983!.@7# J. Fineberg, S. Gross, M. Marder, and H. Swinney, Phys. R
Lett. 67, 457 ~1991!.@8# J. Fineberg, S. Gross, M. Marder, and H. Swinney, Phys. R
B 45, 5146~1992!.@9# T.-W. Wu and F. Spaepen, Philos. Mag. B61, 739 ~1990!.
@10# P. Chaudhari, A. Levi, and P. Steinhardt, inGlassy Metals II,edited by H. Beck and H.-J. Guntherodt~Springer-Verlag, Ber-lin, 1983!, Vol. 53, p. 127.
@11# F. Spaepen and A. Taub, inAmorphous Metallic Alloys, editedby F. Luborsky~Butterworths, London, 1983!, p. 231.
@12# A. Taub, Acta Metall.30, 2117~1982!.@13# H. Kimura and T. Matsumoto, inAmorphous Metallic Alloys
~Ref. @11#!, p. 187.@14# E. Oleinikraux, O. Salamatina, S. Rudnev, and S. Sheno
Polym. Sci.35, 1532~1993!.@15# E. Hart, Acta Metall.18, 599 ~1970!.@16# J. Rice, inConstitutive Equations in Plasticity, edited by A.
Argon ~MIT Press, Cambridge, MA, 1975!, p. 23.@17# F. Spaepen, Acta Metall.25, 407 ~1977!.@18# A. Argon, Acta Metall.27, 47 ~1979!.@19# A. Argon and H. Kuo, Mater. Sci. Eng.39, 101 ~1979!.@20# F. Spaepen and A. Taub, inPhysics of Defects, edited by J.-P.
P. R. Balian and M. Kleman, 1981 Les Houches LecturSession XXXV~North-Holland, Amsterdam, 1981!, p. 133.
@21# A. Argon and L. Shi, Acta Metall.31, 499 ~1983!.@22# V. Khonik and A. Kosilov, J. Non-Cryst. Solids170, 270
~1994!.@23# M. Cohen and D. Turnbull, J. Chem. Phys.31, 1164~1959!.
v.
v.
n,
,
@24# D. Turnbull and M. Cohen, J. Chem. Phys.34, 120 ~1961!.@25# D. Turnbull and M. Cohen, J. Chem. Phys.52, 3038~1970!.@26# D. Deng, A. Argon, and S. Yip, Philos. Trans. R. Soc. Londo
Ser. A329, 549 ~1989!.@27# S. Kobayashi, K. Maeda, and S. Takeuchi, Acta Metall.28,
1641 ~1980!.@28# K. Maeda and S. Takeuchi, Philos. Mag. A44, 643 ~1981!.@29# D. Srolovitz, V. Vitek, and T. Egami, Acta Metall.31, 335
~1983!.@30# S. Melchionna, G. Ciccotti, and B. Holian, Mol. Phys.78, 533
~1993!.@31# S. Nose, J. Chem. Phys.81, 511 ~1984!.@32# S. Nose, Mol. Phys.52, 255 ~1984!.@33# S. Nose, Mol. Phys.57, 187 ~1986!.@34# M. Parrinello and A. Rahman, J. Appl. Phys.52, 7182~1981!.@35# M. Parrinello and A. Rahman, J. Chem. Phys.76, 2662~1982!.@36# H. Anderson, J. Chem. Phys.72, 2384~1980!.@37# F. Lancon, L. Billard, and P. Chaudhari, Europhys. Lett.2, 625
~1986!.@38# F. Lancon and L. Billard, J. Phys.~France! 49, 249 ~1988!.@39# R. Mikulla, J. Roth, and H.-R. Trebin, Philos. Mag. B71, 981
~1995!.@40# J. Dieterich, Pure Appl. Geophys.116, 790 ~1978!.@41# J. Dieterich, J. Geophys. Res.84, 2161~1979!.@42# J. Rice and A. Ruina, J. Appl. Mech.105, 343 ~1983!.@43# A. Ruina, J. Geophys. Res.88, 10 359~1983!.@44# J. Dieterich,PAGEOPH143, 283 ~1994!.@45# J. Carlson and A. Batista, Phys. Rev. E53, 4153~1996!.@46# S. Langer and A. Liu~unpublished!.@47# A. Mehta and S. F. Edwards, Physica A157, 1091~1990!.@48# J. Langer, Ann. Phys.~N.Y.! 54, 258 ~1969!.@49# G. Barkema and N. Mousseau, Phys. Rev. Lett.77, 4358
~1996!.@50# A. Voter, J. Chem. Phys.106, 4665~1997!.@51# A. Voter, Phys. Rev. Lett.78, 3908~1997!.


![Viscoplastic behavior with effect of memory []](https://img.dokumen.tips/doc/110x75/61b00bf9fea4e649e60a0e51/viscoplastic-behavior-with-effect-of-memory-.jpg)


