Embed Size (px)
Citation preview


DYNAMICS ISSUE 36 DYNAMICS ISSUE 36 1
CONTENTS
EDITORIAL Dynamics welcomes editorial from all users of CD-adapco software or services. To submit an article: Email: [email protected] Telephone: +44 (0)20 7471 6200
EDITOR Deborah Eppel - [email protected] ASSOCIATE EDITORS Anna-Maria Aurich - [email protected] Goodwin - [email protected] Prashanth Shankara - [email protected] Titus Sgro - [email protected] DESIGN & ART DIRECTION Ian Young - [email protected] PRESS CONTACT US: Lauren Gautier - [email protected] Europe: Julia Martin - [email protected] ADVERTISING SALES Geri Jackman - [email protected] EVENTS US: Lenny O’Donnell - [email protected] Europe: Sandra Maureder - [email protected]
SUBSCRIPTIONS & DIGITAL EDITIONS Dynamics is published approximately twice a year, and distributed internationally. All recent editions of Dynamics, Special Reports & Digital Reports are now available online: www.cd-adapco.com/magazine We also produce our monthly e-dynamics newsletter which is available on subscription. To subscribe or unsubscribe to Dynamics and e-dynamics, please send an email to [email protected]
2806
20 36
INTRODUCTION 02 - Is MDX the Future of Engineering David L. Vaughn - CD-adapco
FROM THE BLOG 03 - STAR-CCM+ v9.02 Preview: Volume Rendering Matthew Godo - CD-adapco
04 - Raindrops Keep Falling On My Head David Mann - CD-adapco
05 - Adjoint Blog Joel Davidson - CD-adapco
MULTI-DISCIPLINARY DESIGN EXPLORATION06 - Multi-Disciplinary Design Exploration: Unleashing Simulation Led Design Sabine Goodwin - CD-adapco
LIFE SCIENCES28 - Blood Flow Simulations Bring Safer and Affordable Hemodialysis to the Masses Prashanth S. Shankara - CD-adapco
40 - Numerical Simulations for Tablet and Coating Sabine Goodwin, Oleh Baran & Kristian Debus - CD-adapco
MARINE16 - Sailing Design Using Optimization and Fluid Structure Interaction Algorithm Edward Canepa - University of Genova Fabio D’Angeli - La Spezia University
20 - Aerodynamic and Hydrodynamic CFD Simulations of the High Performance Skiff R3 Simone Bartesaghi - Milano, Italy Ignazio Maria Viola - University of Edinburgh, UK
SPORTS44 - From World Records to Daily Mobility Paolo Baldissera & Cristiana Delprete - Politecnico di Torino
ELECTRONICS12 - The Key to the Future: Design Exploration Titus Sgro - CD-adapco
24 - Coupled Thermal-Electrical Simulations Shed on LED Performance Pier Angelo Favarolo & Lukas Osl - Zumtobel Group Sabine Goodwin & Ruben Bons - CD-adapco
GROUND TRANSPORTATION32 - Turbochargers - Development and Challenges Jawor Seidel - Atlanting GmbH 36 - Computational Thermal Management of Transient Turbocharger Operation Fabiano Bet & Gerald Seider - InDesA GmbH
AEROSPACE48 - Shaping the Future, One Engineer at a Time Mike Richey - The Boeing Company Steve Gorrell & Joe Becar - Brigham Young University Titus Sgro - CD-adapco

DYNAMICS ISSUE 36 DYNAMICS ISSUE 362
Great designs aren’t born fully formed and beautiful. They evolve, shaped by exposure to the rigor of real-life operation.
Engineers know this. There are few words that cast as much fear into the heart of an engineer as “untested”. From the very earliest days of our careers, we learn the hard way that “untested things”, such as components, ideas and designs, break under the stress of real-life operation. That, in part, is the art of engineering: taking things and making them better, finding out how they break, why they break, and working out clever ways in which to prevent them from breaking in the future.
The challenge for engineers has always been finding ways in which they can perform this testing during the design process. In the old days that happened in the lab; with the rigors of real-life operation reduced to a series of idealized physical tests, usually aimed at testing only the extremes of operation. Although this approach was often successful, it had three main flaws. Firstly, it was expensive, both in terms of time and money. Secondly, reducing real life operating conditions into a lab test often involves simplification of the problem to the extent that the idealized test is often not a good representation of the way the product is used in reality. Thirdly, concentrating on “worst case scenarios” has a tendency to lead to over-engineered, inelegant products.
For many years, engineering simulation
was simply a new-fangled alternative to this type of lab testing, sharing all of the same flaws. It was expensive, in terms of licensing and hardware costs. The numerical models were often unable capture all of the important physics, and often it was deployed so late in the design process that only a few “worst case” simulations were possible.
In this issue we introduce a concept called MDX - which is short for Multi-disciplinary Design Exploration. MDX is a methodology for automatically testing designs from early in the concept stage, against all of the physics that might influence its performance, working out which set of design parameters will break, and which will improve it.
MDX is possible because engineering simulation software now increasingly allows engineers to determine how a product will perform under the actual conditions that it will face during its operational life without resorting to gross simplification. If necessary, this can involve multiple simulation software tools working in concert, each specialized in addressing a specific part of the problem, which together allow an engineer to simulate the entire system, rather than just a particular piece of it.
Another enabling factor is the emergence of robust multi-purpose design exploration and optimization tools that automatically drive the design in directions that engineering intuition alone could never take it. The combination of design
exploration tools and mature engineering simulation results in products that are truly
“better, faster, cheaper” under real life operating conditions.
A final factor is affordability. As a result of new licensing schemes, the cost of simulating multiple variations of a single design is substantially reduced, enabling organizations to harness all of the computing resources available to them. This allows MDX to be deployed from the earliest stages of the design process and helps to ensure that great concepts evolve into great designs - and eventually great products.
As you read through this magazine, please take special note of those articles that demonstrate the use of MDX on real engineering projects and consider how these techniques might be applicable to your own engineering projects. In the coming months will be looking at even more applications that will hopefully convince you that MDX is the future of simulation, and of engineering as a whole.
Enjoy your read!
David L. VaughnVP Marketing
INTRODUCTION DAVID L. VAUGHN
“The challenge for engineers has always been finding ways in which they can perform this testing during the design process. ”
Is MDX the Future of Engineering?

DYNAMICS ISSUE 36 DYNAMICS ISSUE 36 3
FROM THE BLOG: www.cd-adapco.com/blog
VOLUME RENDERING, A WELL-KNOWN SCIENTIFIC VISUALIZATION METHOD, IS BEING INTRODUCED WITH OUR LATEST VERSION OF STAR-CCM+!
When you hear the phrase “Volume Rendering”, the first thing that may come to mind is a collection of
highly compelling medical images depicting our internal organic structures. You might also recall movie blockbuster special effects showing things like clouds, smoke, storms and explosions. And you might be thinking that these high-end visualizations are the exclusive domain of dedicated medical imaging facilities and animation powerhouses like Dreamworks and Pixar. What would you think about being able to create a “Volume Rendered” depiction of your CFD results on your laptop? And why would you want to in the first place?
When we examine our CFD results, we traditionally use “surfaces” to understand and communicate our findings. We look at boundaries within our regions to see what is happening at inlets, outlets and walls with various boundary conditions imposed. Spanning the volume of our regions, we create derived planes to understand spatial variations in scalar functions. Iso-surfaces give us a way to look more closely inside the region volume but even these visualization tools are still fundamentally “surfaces”. In specifying the location of a derived plane or value of an iso-function, we are making an assumption that we know where to look for problems. For complex models, even with experience, it becomes increasingly possible during post-processing efforts to miss critical areas where device performance may be adversely affected.
Volume rendering on the other hand is a “volume-based” visualization method. In the volume render illustration of the combustion chamber (above), we cannot only see the fine structures associated with temperature variations, but we also have an idea of where temperature gradients
are high or low. Higher scalar gradients are more opaque whereas lower ones are more transparent. If we compare the volume rendered illustration to a series of iso-surfaces, the utility of this new visualization method immediately becomes clear. Which scientific visualization of this combustion chamber would you show to your manager?
While volume rendering technology is not new, accessibility to it is. Anyone familiar with video games can appreciate how graphics cards continue to aggressively push the boundaries of capability and performance and volume rendering is perfectly suited to take advantage of these steady hardware improvements. But even the best graphics card is going to struggle if data management is not well considered.
Why is Data Management Relevant to this Discussion? Let’s step back for a moment... Volume rendering generates a picture from a set of voxels. Voxels are box-shaped volume elements, arranged on a regular grid, to which the attributes of opacity, color and lighting can be applied. For volume rendering to work, we need to divide and conquer our model domain once more, this time breaking it down into a resampled volume instead of a mesh.
Resampled volume can get expensive so a trade-off has to be made between the time and resources needed for resampling versus the desired end quality. To this end, we have included controls that easily manage the cost of volume rendering by changing the cell size to voxel ratio. One of our unique features is that our resampling method is adaptive.An example where areas closer to the blade surfaces have a higher voxel refinement is shown above. Resampling methods that use a constant voxel size will not only require more resources (since they will be more dense than they need to be in the far field regions), but will be susceptible to loss of detail (because they will be too coarse) particularly near surfaces where vortex shedding is initiated. Resampling is also a fully parallelized operation on our servers. Even with large models, the time needed to change from say, vorticity magnitude to a mass fraction scalar, will be comparatively small.
For a quick start, you can snap your resampling target volume directly to a part. For some applications, such as trying to capture the downstream wake for a moving object, you can modify your target volume
interactively, resampling only the partial volume of interest. This approach lets you reduce your volume rendering costs while increasing your through put.
Our research and development of this scientific visualization method combines many “state-of-the-art” techniques to deliver a high performance and cost-effective implementation. Volume rendering, along with resampling as a new derived part is now in your hands with the most recent release. Special colormaps, targeted for use with volume rendering are included and more will become available as this new capability matures. Looking slightly ahead past the current release, we will deliver a fully interactive colormap editor to let you fully personalize your own colormaps. Additional lighting methods will also be added for further control, making your volume rendered visualizations even more realistic.
Volume Rendering
MATTHEW GODOProduct Manager, STAR-CCM+
Isosurface of temperature in combustion chamber
Volume rendering of temperature within a combustion chamber
Spray nozzle with volume rendering
Cell size/voxel ratio controls cost of volume rendering

DYNAMICS ISSUE 36 DYNAMICS ISSUE 364
FROM THE BLOG: www.cd-adapco.com/blog
DISPERSED MULTIPHASE MODEL ACCELERATES SIMULATION OF WATER AND ICE MANAGEMENT PROBLEMS
While raindrops falling on your head might represent a minor annoyance, the same raindrops accumulating on
your car windscreen, or forming as ice on an aircraft wing can represent a serious safety concern. However, until recently simulating multiphase problems such as aircraft icing, vehicle soiling and water management has presented a significant computational challenge, due to the need to model the tiny particles of water as huge numbers of discrete Langrangian droplets. These droplets impinge on key vehicle surfaces, such as aircraft wings and car side mirrors, to form a fluid film or, if supercooled as in the case of aircraft at altitude, solid ice. The injection of such a large number of droplets, which are typically tens of microns in diameter, made such simulations computationally expensive, and impingement could be patchy unless a very large number of droplets were injected.
The introduction of the new Dispersed Multiphase (DMP) model will change that forever, providing a more computationally efficient method for simulating water and ice management scenarios.
The Dispersed Multiphase ModelThe new Dispersed Multiphase model is a lightweight, computationally efficient, Eulerian model which treats the impinging water droplets as a continuous background phase superimposed on the single phase primary flow. This results in a model which is very much less computationally expensive than the Lagrangian equivalent, without the need for the full physics capability of Eulerian Multiphase (EMP). This approach guarantees a smooth and repeatable impingement pattern on the car, aircraft, or other geometry being modeled, so that
high quality results can be achieved at the first attempt.
The capabilities and benefits of the new model are best illustrated by a couple of examples.
Application: Vehicle SoilingOne of the applications to benefit from the addition of the new DMP model is the simulation of vehicle soiling. Knowing which surfaces of a car rain or mud will strike, and how thick the resultant water film will be as it runs back is critical to maintaining visibility for safe driving conditions. For example, it is important to know where water runs back on the side windows which cannot be easily cleared and may obscure visibility of side mirrors.
Such an example is illustrated above. Here a section of the side of a car has been modeled with side mirror and side window with a Dispersed Multiphase impinging phase. The impinging droplets form a film on the vehicle surfaces using the fluid film model in STAR-CCM+ and the thickness of the resultant film on the side window is shown. The film is similar in thickness and distribution as when obtained with an equivalent Lagrangian run, but the DMP simulation took around one third of the total CPU time, and shows a less patchy distribution of the film thickness, leading to significant increases of productivity. Application: Aircraft Deicing and Anti-IcingWhen using Dispersed Multiphase for modeling the build-up of ice on the critical surfaces of aircraft, such as wings, nacelles, pitot tubes, and control surfaces STAR-CCM+ has a number of other
Raindrops Keep Falling On My Head
complementary tools that can be used to give a more complete understanding of the icing phenomena.
As in the vehicle soiling example, DMP is used to simulate the impinging water droplets. However, in this case the droplets are supercooled and freeze on impact, potentially hazardously modifying the aerodynamics and ability of the pilot to control the aircraft.
When modeling ice build-up in STAR-CCM+, the user has the option to either represent the ice as a solid volume fraction in the fluid film with only a numerical thickness or, more realistically, the solid component can be removed from the film and the surface is automatically moved outward by the appropriate amount to account the removed mass. In this case, the volume mesh is automatically morphed to accommodate the thickness of ice that builds-up. This leads to a much more realistic definition of the ice and the resultant changes to the aerodynamics of the aircraft.
Another complementary new feature is the ability to scale the amount by which the ice build-up advances each time-step. This scaling factor can be used to drastically reduce the sim ulation time and takes advantage in the fact that the timescales of the advancing ice front and of the aerodynamics are many orders of magnitude different and therefore effectively decoupled, so that this scaling can be used without any impact on accuracy and gives a substantial reduction in run times.Hopefully, this serves to give you a flavor of some of the exciting applications that can now be modeled more easily and quickly with Dispersed Multiphase.
DAVID MANNProduct Manager, STAR-CCM+

DYNAMICS ISSUE 36 DYNAMICS ISSUE 36 5
FROM THE BLOG: www.cd-adapco.com/blog
One of the greatest challenges of engineering analysis is being able to understand how changes in geometry and flow features might
influence your system’s performance. For a long time, the only way to gain insight into the sensitivity of engineering objectives to changes in input was to run multiple analyses and then dig through the results. The introduction of the adjoint solver in STAR-CCM+, however, changed that allowing for direct access to sensitivity information from a single simulation.
In the latest version of STAR-CCM+, we have a number of new features to broaden the applicability and improve the ease of use of the adjoint solver. Chief among these developments is the new tumble
and swirl cost function implemented based on direct feedback from our industrial users. This cost function, targeted at the IC engine community, allows for sensitivities to be presented with respect to a key metric used in steady-state port flow analyses. In such studies, improving the tumble and swirl characteristics of the port is critical so the additional insight that the adjoint solver brings will be of great benefit.
To improve ease of use, the adjoint cost functions have been migrated to STAR-CCM+’s standard reporting capability. This allows you to understand whether the cost functions you are interested in are returning sensible values before you run the adjoint solver itself. The
reports themselves are available irrespective of whether you are interested in adjoint or not, meaning that all users can benefit from the new tumble & swirl report as well as the addition of a pressure drop and uniformity deviation tumble and swirl report.
STAR-CCM+’s adjoint solver has already come a long way since it’s first release approximately eight months ago and the pace of development will continue. We believe it is a technology that can benefit all of our users and so continue to be committed to its future development with a dedicated team improving and enhancing the tool. There are a lot of exciting new features coming and beyond and I hope you get a chance to try them out and let us know what you think.
Adjoint Blog
JOEL DAVISONProduct Manager, STAR-CCM+
DYNAMICS ISSUE 36 DYNAMICS ISSUE 366
MULTI-DISCIPLINARY DESIGN EXPLORATION

DYNAMICS ISSUE 36 DYNAMICS ISSUE 36 7
Multi-disciplinary Design Exploration: Unleashing Simulation-Led DesignSABINE GOODWIN CD-adapco
In today’s fast-paced and competitive climate, improved product performance and shortening of lead times are critical for business success
across all industries. With computational resources more readily available, simulation, now more than ever, is a key enabler for making sound engineering decisions while addressing complex customer requirements. As engineering management has new visionary ideas and demands more product design variants in a shorter time, engineers must rely on efficient and flexible multi-disciplinary design exploration (MDX) to tap into the many benefits simulation has to offer and bring better performing products to market faster.
WHAT IS MDXCD-adapco’s vision for MDX is a comprehensive virtual process that facilitates every facet of multi-disciplinary design exploration, from single point simulation to fully automated deterministic optimization. It is an all-encompassing approach that delivers access to all the required tools for a complete simulation led design solution, including accurate multi-fidelity and multi-physics models, and automated processes within an easy-to-use infrastructure. Beyond the technology, a choice of flexible and affordable software licensing schemes is a requirement to implement a true MDX solution. CD-adapco makes the MDX vision affordable through our POWER licensing, thus giving engineers the freedom to select the right tool at the right time, no matter how complex the problem is. This opens the door for efficiently simulating
entire systems, giving companies more value and shorter delivery times while balancing resources and investments in their MDX implementation.
HISTORICAL BARRIERSUp until now, a number of technical barriers have kept multi-disciplinary simulation-based design from becoming mainstream in the product development cycle:
High computational demands Real-life engineering tasks require trade-off studies involving many multi-disciplinary objectives and constraints. The high dimensionality of the design space combined with the massive amount
of CPU hours necessary often make the process intractable in practice.
Numerical simulation road-blocks The success of optimization hinges on the accuracy and robustness of the underlying numerical methods. The mathematical models are often too sensitive to design changes, and cumbersome CAD-to-mesh approaches, poor auto-meshing and lack of process automation have been major road-blocks for a practical implementation.
Unknown design landscape The underlying features of a design space are unknown but the best optimization approach for improving a design highly
FIGURE 1: MDX is an all-encompassing approach that delivers access to all the required tools for a complete simulation-led design solution including accurate multi-fidelity and multi-physics models, and automated processes within an easy-to-use infrastructure.
MULTI-DISCIPLINARY DESIGN EXPLORATION

DYNAMICS ISSUE 36 DYNAMICS ISSUE 368
depends on these features. To get around this problem, manual studies are usually performed up-front to get insight into a design space. Once a method is selected, the user then has to fine-tune many parameters which often requires expertise and is time-consuming.
CAD interface and parameterization challenges The problem must be reduced to a set of design parameters useful for optimization. These parameters not only need to be defined, they are altered during the optimization process and a new CAD geometry must be generated. Historically, this has been done through interfacing with the CAD group, causing an interruption in the workflow and resulting in long design cycles.
Prohibitive licensing costs Design exploration requires many simulations to be run at once on a large number of multi-core processors. Traditional licensing schemes are inflexible and do not respect the shifting patterns of usage that occur throughout the project life-cycle. Furthermore, software licensing costs for exploring a large design space are often prohibitive.
With its advanced technologies, CD-adapco has managed to overcome many of the technical barriers listed above, paving the way for innovation in a fast-paced production environment through MDX.
MDX: UNLEASHING THE FULL POWER OF YOUR ENGINEERING SIMULATIONThe MDX process has four important characteristics that help unleash the full power of engineering simulations:
Robust flexibility Allow for solving many types of engineering problems ranging from simple applications to the most complex multi-disciplinary and multi-physics systems. To accomplish this, the user must have the flexibility to choose the fidelity of the simulation, method of coupling the disciplines, complexity of the geometric models, type of design studies and whether to use legacy in-house or commercial off-the-shelf codes. This ‘plug-and-play’ approach is ideal when used in a production environment as it allows for easily managing the complexity of the simulations while remaining competitive and on-schedule.
Automation Give engineers the power to automate every step of the simulation workflow,
producing high-quality results with minimal user intervention. Features such as intuitive user interfaces combined with robust and automated approaches for setup and running of the simulations are essential.
Accuracy Employ simulation technologies that are best in class, with physical models that have been extensively validated and verified. This results in a toolset capable of accurately tackling the most complex multi-physics engineering problems.
Affordability Achieve a quick turnaround of results by using a flexible approach to parallel processing and ensuring scalability. In addition, hardware must be used as effectively as possible through powerful, flexible licensing models. This maximizes the value of a team’s computing resources while remaining affordable.
CD-adapco and its partners have been working closely together for many years to facilitate and streamline all steps of the design process. STAR-CCM+, HEEDS (developed by CD-adapco’s subsidiary company Red Cedar Technology) and POWER licensing are three core technologies that lie at the heart of CD-adapco’s vision for MDX.
STAR-CCM+: A COMPLETE MULTI-DISCIPLINARY SIMULATION TOOLKITSTAR-CCM+, CD-adapco’s flagship software, is a complete multi-disciplinary simulation toolkit, offering many features to address the historical barriers described above and helping to drive designs towards improved quality and reliability.
Advanced CAD-interface STAR-CCM+ has a built-in fully parametric 3D-feature based modeler (3D-CAD) for creating or modifying geometries. This streamlined process allows for exposing design parameters and gives the freedom to innovate without reliance on the CAD group. STAR-CCM+ also has CAD clients capability, allowing designers to leverage advanced models available in STAR-CCM+ from within their familiar CAD environment. In addition, CD-adapco has recently implemented the expansion of the CAD clients capability to include an important bi-directionality feature for interfacing CAD and STAR-CCM+. With this feature, design parameters are modified in STAR-CCM+ during the simulation and passed back to the CAD engine where the CAD geometry is updated and refreshed in STAR-CCM+ for the next step in the design process. This capability offers a seamless solution for automatic bi-
FIGURE 2: STAR-CCM+’s overset mesh technology was used to simulate and analyze the glass form-ing process. Shown here are the velocity contours along the center plane of the glass gob.
MULTI-DISCIPLINARY DESIGN EXPLORATION

DYNAMICS ISSUE 36 DYNAMICS ISSUE 36 9
directional geometry updates during the optimization process.
Process automation with JAVA and plug-ins STAR-CCM+ can be directly integrated into engineering processes through a powerful JAVA scripting functionality. From CAD import, to geometry changes, to mesh generation, to solutions, each of the steps in the workflow can be recorded into a macro which can then be modified and easily plugged into a third party optimization package. For example, STAR-CCM+ has been successfully coupled with OPTIMUS (developed by NOESIS solutions). CD-adapco has also delivered a plug-in to allow control of STAR-CCM+ from within Isight (an optimization code from SIMULIA), enabling engineers to take advantage of all the functionality of both Isight and STAR-CCM+ simultaneously.
Fully automated advanced meshing CAD data is often over-complicated and riddled with slivers and gaps. Repairing these dirty CAD models to ready them for building high quality computational meshes is cumbersome
and these manual intervention steps must be completely eliminated before CAD models can be embedded into the design optimization process. The surface wrapping technology in STAR-CCM+ seamlessly resolves many issues brought on by dirty CAD by shrink-wrapping a high quality triangulated surface mesh onto the geometry while respecting the fidelity of the underlying CAD. This meshing capability is an important enabler for performing geometry changes during the design optimization process, easily and robustly automating the path from initial geometry to mesh. STAR-CCM+ also has an overset mesh capability specifically useful for multiple body design optimization or parameter studies involving components with relative motions. When using overset meshes in the case of flow around bodies at various relative positions, one needs to generate the individual grids only once and then compute the flow for many relative positions and orientations by simply moving grids without re-meshing or changing boundary conditions. Figure 2 depicts a STAR-CCM+ solution using overset mesh to simulate the glass forming process.
With no need to worry about cell distortion or extreme ranges of motion, overset mesh is a game-changing technology to study multiple design configurations and operating parameters of this process.
Seamless optimization with Optimate+ Optimate+, an add-on to STAR-CCM+, is a script-less, practical solution for automation of design exploration and it helps designers quickly set up, execute and post-process design studies including parameter sweeps and designs of experiments from within the STAR-CCM+ environment. Optimate+ leverages the full functionality of the SHERPA search algorithm (developed by Red Cedar Technology). SHERPA offers an efficient way to search complex spaces because it provides a blend of search strategies simultaneously, leveraging the best of all methods and exploring the design space locally and globally at once. This approach is very effective when compared to the traditional tag team approach where optimization is performed in a serial way and maintains the weakness of the individual methods. As SHERPA is executed, it also learns
FIGURE 3: Design optimization using Optimate+ on the spoiler of a NASCAR geometry. The objective was to minimize the drag with a constraint on down-force.
MULTI-DISCIPLINARY DESIGN EXPLORATION

DYNAMICS ISSUE 36 DYNAMICS ISSUE 3610
about the design space and alters its decision making while the solution unfolds. For the user, this is all seamless. Once design parameters are set up, Optimate+ creates all necessary scripting, submits and monitors jobs, collects simulation data and post-processes the study. Figure 3 shows the results from a design optimization study on a spoiler of a NASCAR geometry using Optimate+. The baseline spoiler was parameterized in 3D-CAD and both height and rotation angle of the spoiler were defined as the design variables. The objective of the study was to modify the baseline spoiler to meet a required down-force constraint while minimizing the drag. A solution was obtained after 39 design cycles and the new spoiler showed a 43% increase in down-force with only a drag penalty of only 7.1%.
Economical sensitivity analysis with the adjoint solver The biggest challenge of gradient-based shape optimization has always been the formidable computational expense tied to constructing the sensitivity of the objective (or cost) functions with respect to the design variables. STAR-CCM+ includes an integrated discrete adjoint solver with both 1st and 2nd order adjoints for a wide range of cost functions, without requiring additional licenses. The adjoint solver is a powerful tool to compute the sensitivity of the cost function with respect to many design variables at the CPU cost equivalent to just one flow solution. In addition, the method provides guidance on how to best optimize the design from the start. Integration of an adjoint solver as part of a CFD suite enables an economical sensitivity analysis and allows for performing shape optimization involving few cost functions and many design variables. Figure 4 shows a shape optimization using the adjoint solver in STAR-CCM+ combined with morphing on a front wing. A 10% improvement in lower element down-force was obtained across ten design iterations.
HEEDS MDO: UNLOCK THE POWER OF YOUR CAE TOOLSHEEDS MDO (by Red Cedar Technology) is also an integral part of MDX as it offers complete flexibility by automating the design optimization process using your preferred multi-disciplinary analysis tools:
Seamless integration HEEDS MDO integrates seamlessly with your preferred CAE software tools to automate and expedite your current design workflow.
Powerful generic interface HEEDS MDO offers a powerful interface that allows for linking to any commercial or proprietary software tool to handle pre- and post-processing, simulation and multi-disciplinary optimization.
Ease of use HEEDS MDO is easy to learn and requires little optimization experience to discover optimal designs, often in a fraction of the time it would take to perform an handful of manual operations.
Automated design exploration HEEDS MDO offers a wide range of models to support MDX. These include automated Design Of Experiments (DOE), parameter and sensitivity studies and robustness and reliability assessments.
Revolutionary search strategies HEEDS MDO has revolutionary search
strategies to uncover new design concepts that improve products and significantly reduce development costs. There is no need to experiment with different optimization algorithms and confusing tuning parameters for each new problem. The SHERPA algorithm adapts itself to your problems automatically, finding better solutions faster, the first time.
POWER LICENSING: MAXIMIZE THE VALUE OF YOUR COMPUTE RESOURCESTraditional licensing schemes are inflexible and do not accommodate for spikes in usage, which means that, while some types of licenses are in high-demand, others lay unused. As compute resources become more affordable and simulation models grow increasingly larger, the traditional schemes get to be prohibitively
FIGURE 4: Shape optimization using the adjoint solver with morphing on front wing showing a 10% improvement in lower element down-force across 10 design iterations (above and below)
MULTI-DISCIPLINARY DESIGN EXPLORATION

DYNAMICS ISSUE 36 DYNAMICS ISSUE 36 11
expensive. CD-adapco’s powerful and flexible licensing schemes (also called POWER licensing) enable MDX by giving users access to the right tools at the right time, all at a fraction of the cost of traditional licensing schemes:
POWER SESSION gives users access to unlimited computational resources for a fixed cost, allowing for organizations to completely deploy their available resources towards the solution of large and complex simulation models.
POWER-ON-DEMAND is the gateway to fully flexible computing, with usage counted by-the-hour on an unlimited number of cores and uncounted number of sessions. This pay-as-you-
FIGURE 5: As compute resources become more and more affordable and simulation models become increasingly larger, the traditional schemes get to be prohibitively expensive. CD-adapco’s powerful and flexible licensing schemes enable MDX, giving users access to the right tools at the right time.
go approach allows users to deploy resources as (and when) needed and it provides an unlimited simulation burst capacity to top up software and hardware resources at times of peak demand.
POWER TOKENS is a needs-based usage approach that allows for applying license resources to match usage patterns. Each power token represents a process job on a CPU and the tokens can be split over several jobs or concentrated in one job, as the user sees fit. This scheme is specifically designed to allow the user to leverage their investment in a simulation model. By using POWER Tokens, the licensing cost of simulating multiple derivatives of a single design is significantly reduced, allowing users to explore the whole design space at a fraction of the cost of traditional licensing schemes.
CONCLUSIONCD-adapco and its partners are working closely together to help engineers maximize the value of their engineering simulation by providing robust, automated, and smart simulation tools to enable truly efficient multi-disciplinary design exploration (MDX). The key to making these tools mainstream in the product development cycle is to eliminate the prohibitively time-consuming manual steps from the workflow while at the same time making sure the process is accurate and remains flexible for the end user. STAR-CCM+, HEEDS and POWER licensing are powerful technologies that lie at the heart of CD-adapco’s vision for MDX, enabling companies to get more value with shorter delivery times while balancing resources and investments.
MULTI-DISCIPLINARY DESIGN EXPLORATION

DYNAMICS ISSUE 36 DYNAMICS ISSUE 3612
ELECTRONICS OPTIMIZATION IN ELECTRONICS COOLING

DYNAMICS ISSUE 36 DYNAMICS ISSUE 36 13
OPTIMIZATION IN ELECTRONICS COOLING ELECTRONICS
While every engineer strives to create the new best thing since sliced bread, often his or her work must be
focused on the more mundane: taking a product or idea already on the market and making it better, faster, smaller, lighter, cheaper or somehow more improved. This optimization, while not as exciting as groundbreaking new designs, is still vitally important for technological advancement. Compare the latest cell phones to the very first cell phone models ever made, or a laptop to the ENIAC, and you can see what optimization can do for the world, much less for customers, who are almost universally less curmudgeonly when they own a better product, even if it is only incrementally better.
CASE STUDY: A SIMPLE HEAT SINKWhile this is easily said, most engineers know that even optimizing a product with a very few number of variables can be expensive, time consuming and painfully difficult. In the past, millions could be spent on trying to optimize a product and only being partly successful. CD-adapco has the tools to turn that paradigm on its head.As an example of applying optimization to the electronics industry, a heat sink was optimized using CD-adapco’s Optimate+ in conjunction with STAR-CCM+. The guidelines of the heat sink were laid out as follows:
• A 40mm square base• A total height of 10mm• 3-8 fins that have a sharp kink at a
variable height, the angle of which must grow from the middle to the end, and no FIGURE 1: Examples of heat sink geometry created by Optimate+
THE KEY TO THE FUTURE:DESIGN EXPLORATIONTITUS SGROCD-adapco

DYNAMICS ISSUE 36 DYNAMICS ISSUE 3614
FIGURE 4: Air velocity profile through heat sink fins
FIGURE 2: Far view of air velocity profile around heat sink
FIGURE 3: Temperature profile of heatsink and surrounding air
ELECTRONICS OPTIMIZATION IN ELECTRONICS COOLING

DYNAMICS ISSUE 36 DYNAMICS ISSUE 36 15
kink can have more than a 70 degree turn
• Fins will be set equal distances apart and must have a reasonable gap between them
• The base thickness may vary to a thickness of up to 8mm
• The solution should be examined for several airflow speeds (1, 3, 5, 8 and 10 m/s)
With these requirements, it was a simple matter to create and build a heat sink within the STAR-CCM+ 3D-CAD tool. Using a series of constraints to ensure a robust and logical design, CD-adapco set up a simulation that could test literally thousands of different heat sink designs using hundreds more potential operating conditions quickly and easily. Figure 1 shows three different possible configurations generated from this.
Once this was properly designed, Optimate+ was tied in, with the software given instructions on what was the acceptable range for the variables of base thickness, “kink-height” (the height at which the sharp kink occurred on the fin), the angle of the kink, and the number and width of the fins, while a small Java code was written to control other case specific functions. The ability to code specific functions like this was essential for making the optimization of the heat sink easy to set up. Yet the code itself was trivial; even beginner coders can quickly learn how to write Java scripts for STAR-CCM+.
With all this set up, Optimate+ took everything the rest of the way. Optimate+ was built in conjunction with Red Cedar Technology, a subsidiary of CD-adapco, to bring its HEEDS multi-disciplinary optimization tool more directly into STAR-CCM+. It ran through hundreds of possible potential designs using the exclusive “Simultaneous Hybrid Exploration that is Robust, Progressive and Adaptive” (or SHERPA) optimization strategy. Using SHERPA, Optimate+ was able to determine the best possible design quickly and easily (a full optimization routine of 100+ runs took only two days on 80 total processors) and this was completely automatic. Optimate+ did all the fine tuning and calculations without any user input besides what the variables were and how many runs per routine were to be done. Even the post processing data for every run was automatically generated, removing the painfully tedious work and allowing detailed examination of the solutions the moment Optimate+ was done optimizing.
RESULTSThe targeted results were to minimize the thermal resistance and the mass of the heat sink. While these can conflict with one another, SHERPA’s Pareto search worked to minimize both at the same time. Table 1 shows the optimum heat sink for each of the various flow speeds. The ‘Performance’ term indicates SHERPA’s evaluation of how good a design is, and equally weighs ‘Thermal Resistance’ with mass, along with its special optimization calculations. As is readily apparent from table 1, a large drop (a 90% decrease) in ‘Thermal Resistance’ increases the performance drastically, despite the mass increasing by just over 15%.
The first thing that can easily be noticed about the results of the optimization is that, for each speed, the minimum base thickness turned out to be the most efficient, as well as the thinnest possible fins. This makes sense, as this reduces the mass and creates the most area possible for heat transfer. In addition, the maximum angle of the kink proved to be the most desirable for each of the most optimized results, though this was not nearly as universal. Table 2 shows the ten best results for a flow speed of 3 m/s.
A more important design result highlighted by Optimate+ was that the number of fins that was optimal went up as the flow speed increased. For an ideal cooling situation, the boundary layers for each of the fins should just touch at the downstream end of the fins. At low flow speed, the boundary layers
between the fins are thicker, thus a fewer number of fins produce an optimum cooling situation, while at higher speeds, the thinner boundary layers call for a thinner gap between fins, pushing up the number of fins on the same size sink. The optimization results reflect this, showing the greater number of fins as the air speed increases, as well as the drastically lower thermal resistance.
Figures 2 to 4 show a sampling of temperature and airflow results from the optimization routines.
FUTURE WORKAs the reader can imagine, the potential application for this would be nearly limitless. Already, many companies are using STAR-CCM+ to examine their designs in the digital world and perfect them before they ever build a physical prototype, and most often only one physical prototype is ever needed to be built. With Optimate+ and SHERPA, even more of this work can be automated.
Imagine inputting variables into a program and designing an entire passenger aircraft carrier with the click of a button. Picture an architect building the perfect comfort system for his building, ensuring every room is at a perfect temperature while avoiding “cold spots” in a room. Consider the design of an entire super computer, perfected, compacted and as energy efficient as possible being designed in days. Where will your imagination take you?
Flow Speed (m/s)
Evaluation # (out of
100)Performance
Thermal Resistance
Mass of Heatsink
Base Thickness
Kink Angle Fin WidthNumber of
fins
1 43 -0.952 4.2101 0.0040 1 35 0.2 3
3 51 -0.8964 1.2999 0.0045 1 35 0.2 5
5 79 -0.7878 0.5584 0.0047 1 35 0.2 6
8 41 -0.6195 0.1550 0.0047 1 35 0.2 6
Evaluation # (out of
100)Performance
Thermal Resistance
Mass of Heatsink
Base Thickness
Kink Angle Fin WidthNumber of
fins
29 -0.9674 1.6990 0.0039 1 35 0.2 3
49 -0.9643 1.4688 0.0046 1 25 0.2 6
80 -0.9631 1.3324 0.0051 1 35 0.2 7
78 -0.9500 1.4148 0.0047 1 30 0.2 6
36 -0.9399 1.3735 0.0047 1 35 0.2 6
54 -0.9364 1.5431 0.0041 1 25 0.2 4
46 -0.9209 1.4164 0.0044 1 25 0.2 5
81 -0.9201 1.4605 0.0042 1 35 0.2 4
43 -0.9022 1.3441 0.0044 1 30 0.2 5
51 -0.8964 1.2999 0.0045 1 35 0.2 5
TABLE 1: Specifications of optimized heat sinks
TABLE 2: The ten best designs for flow speed of 3 m/s
OPTIMIZATION IN ELECTRONICS COOLING ELECTRONICS

DYNAMICS ISSUE 36 DYNAMICS ISSUE 3616
MARINE OPTIMIZATION OF SPORTING VESSEL

DYNAMICS ISSUE 36 DYNAMICS ISSUE 36 17
SAIL DESIGN USING AN OPTIMIZATION AND FLUID STRUCTURE INTERACTION ALGORITHMEDWARD CANEPAUniversity of Genova
FABIO D’ANGELILa Spezia University
OPTIMIZATION OF SPORTING VESSEL MARINE
When designing a sailing craft with high performance characteristics, the
sails are clearly the main element that must be optimized in order to achieve maximum performance. The sails provide propulsion to the craft, using the kinetic power of the wind to generate the force required for movement. As with any machine that has to draw power from a fluid to achieve optimum performance, an accurate fluid-dynamic analysis is required. Furthermore, in order to ensure proper structural integrity and optimized performance for a large range of sail deformations, the loads generated by the fluid on the sails have to be carefully considered.
Consequently, an aeroelasticity study is needed to accurately predict the behavior of the sail while being affected by fluid flow under constraints. The sail, being made out of a permeable, membrane-like fabric that changes shape under the influence of the blowing air within the limits of its rigging, is intrinsically unstable, with the fabric changing its shape with loose material and elongating when under load. Because the sail can assume an infinite number of shapes, its geometry is not unequivocally set, and the different shapes are referred to as isometric surfaces.
With isometric deformation, the curvilinear distances between points on the sail surface remain constant and thus there is no stretching of the fabric. Generally in a sail, the isometric component of deformation is the one that predominates, which is why the term “design shape” is used by sailmakers in designing the shape of the sail and “flying shape” to refer to the shape that
the sail takes during navigation under the action of the incident airflow. These two can be very different depending on the sailing conditions.
Consider two scenarios: when a sail-powered ship sails upwind, it uses the mainsail and jib - a sail very far forward pointing fore and aft. The difference between design shape and flying shape
FIGURE 1: Block diagram of algorithms for assessing performance in the typical case (a) and by the new method (b)

DYNAMICS ISSUE 36 DYNAMICS ISSUE 3618
MARINE OPTIMIZATION OF SPORTING VESSEL
is minimal and the fluid-dynamic analysis can be applied directly to the design shape without needing to calculate the deformation. Although not readily apparent to an untrained eye, when sailing downwind, the spinnaker’s shape is unstable under these conditions, causing the approximation to fail. The flying shape of a sail in the downwind case is vastly different from the design shape; thus if the aerodynamics are analysed solely on the basis of the latter, major performance errors are likely to occur. Calculating the flying shape is thus fundamental as well as incredibly difficult.
In order to properly simulate such a complex phenomenon, two separate regimes must be considered. From a fluid-dynamics perspective, the simulation of a sail when the boat is sailing downwind is more challenging than for a ship sailing upwind as there is considerable flow separation, thereby restricting the simulation to CFD software that solves RANS, LES or similar equation systems. RANS, or Reynolds Averaged Navier Stokes, are a set of time averaged equations of motion for fluid flow. This calculation scheme is relatively fast and calculates turbulent flow well. LES, short
for Large Eddy Simulations, is based on filtering instead of averaging. A filter speed is set and flow speeds larger than the filter speed will be exactly calculated, while flow speeds smaller than the filter speed will be modeled. This is a much more time consuming, but more accurate method of calculating fluid flow. From a structural point of view, the deformation phenomenon is distinctly non-linear both in geometric and material terms and is highly complex.
Because of these complex calculations, the design and construction of sails has historically relied on the experience of sailmakers who have the expertise to create sails garnered by thousands of years of experimentation as opposed to mathematical and physical simulation using CFD codes. Only in the last ten years has sail design started using scientific analyses.Seeking greater clarity on the subject, La Spezia University began a class research project in its Nautical Engineering department aimed at developing a design and optimization algorithm for sail geometry. This research is critical because optimization of the geometry (design shape) in
various wind conditions can only be done with a known flying shape. Without one known flying shape, it would be impossible to calculate the load the wind applies to the sail.
As has already been noted above, the optimization process is complex, involving at the very least all of the steps below:
• Determination of the sail geometry based on specified dimensions;
• Generation of the sail surface area using the parameters defined above;
• Analysis of performance (thrust generated by the sail);
• Assessment of the shape of the sail when subjected to the aerodynamic loads calculated in the preceding point, while constrained to the fixed points where the sail attaches to the mast;
• Introduction of possible variations in constraint conditions, representing adjustments made by the crew to achieve maximum propelling thrust.
FIGURE 2: Trend in pressure on mainsail and gennaker with flow lines (view from stern)
FIGURE 3: Trend in pressure on mainsail and gennaker with flow lines (view from bow)
FIGURE 4: Trend in displacement and tensile stresses on a gennaker FIGURE 5: Flying shape of a gennaker

DYNAMICS ISSUE 36 DYNAMICS ISSUE 36 19
OPTIMIZATION OF SPORTING VESSEL MARINE
FIGURE 6: Representation of increase in performance with sail design
The conventional workflow summarized by this sequence of operations is shown in figure 1 and can be termed the “analysis algorithm”. This can in turn be used by a plugin optimization code which identifies user-selected input variables and optimizes its output. In the case of sail performance optimization, the above process uses the parameters that define the sail geometry as input variables and sail performance (propelling thrust or a combination of propelling thrust and heeling moment) as the output.
There are many types of algorithms using different mathematical approaches, each of which is applicable to a very specific type of problem. For the purpose of La Spezia’s Nautical Engineering course, the function to be optimized involves a large number of input variables (due to a complex geometry) and is markedly non-linear, which entails substantial calculation time to assess the function itself. The more conventional methods are based on evaluation of the derivatives of the target function, but for distinctly non-linear functions, as in this case, this may not be the right choice. Preference was then given to a genetic algorithm, which is typically robust but computationally expensive due to numerous evaluations of the target function, hence requiring considerable calculation time.
At this point, a decision had to be made whether to develop a suitable computational method or to try to find a ready-made commercial solution for each of the points highlighted. With regard to the definition of geometric parameters, generation of surfaces and the genetic algorithm, the university used an in-house code which they developed for this purpose. For performance prediction, they opted for CD-adapco’s STAR-CCM+. This choice was dictated by the reliability of the code and the ease of interfacing it with other commercial codes, such as ABAQUS.
This left the structural code as the only remaining tool to be chosen, which would compute the deformation of the design sail to obtain the flying sail item. Currently, most of the structural software used to calculate sail deformation applies an energy type approach for determining the condition for a balance between the loads acting on the structure and the constraints applied. The stable equilibrium configuration of the structure can in fact be calculated as the condition that minimizes the total potential energy. The structural calculation is thus static in type: for a given load condition, the equilibrium condition of the system is obtained, but
the time history of the deformation is not taken into account.
However, close observation of the range of prospects offered by STAR-CCM+ indicated that unsteady simulations (in which time is a variable) were possible with parts of the calculation domain in motion, which means that, using the mesh morphing feature, it is possible to assign an arbitrary displacement to a series of points in the domain and modify the grid accordingly. To complement STAR-CCM+, the university decided to develop a structural code that would analyze the solution from each time-step simulated in STAR-CCM+ then, using the co-simulation feature within STAR-CCM+, perform a dynamic analysis of deformation proceeding in parallel with the fluid-dynamic simulation. This would provide the displacement data for mesh morphing for each time-step within the framework of the fluid-dynamics calculation.
This calculation program, written by Fabio D’Angeli, was named SPrIng. In this code, the sail is discretized in the form of a grid of material points interconnected by springs. An explicit dynamic analysis is carried out to solve the equations of motion for each node. The displacement of the nodes due to the pressure loads acting on the sail are calculated over time until the required equilibrium condition is reached. This code, however, only affects the structural mesh within SPring. Within STAR-CCM+, the mesh that the CFD solution is calculated on, is manipulated by the code’s Mesh Morphing feature.
The final model is shown in figure 1(b), which outlines how the fluid-dynamic and structural programs proceed in parallel during the simulation, with continuous interchange between pressures (from fluid to structure) on one side and deformation (from structure to fluid) on the other. At the same time, the structural code modifies the shape of the sheet on the basis of the CFD loads supplied by the fluid-dynamic code. This process is continued until a dynamic equilibrium state is reached, which indicates the maximum propelling thrust. Figures 2 and 3 present the results of the fluid-dynamic calculation (trend in pressure on a mainsail and a gennaker with the addition of various flow lines) which enable assessment of performance.
Figures 4 and 5 on the other hand show the results of the structural calculation (displacement and tensile stresses on a gennaker), with the flying shape of a gennaker as an example.
Finally, figure 6 shows the improved performance obtained using the genetic algorithm to increase.
Using STAR-CCM+, La Spezia University was able to create a simulation that optimizes the performance of a sail-powered ship. With a bit of ingenuity on the side to develop a code simulating the motion of the sails, a picture of the detailed and complicated physics behind sail-powered thrust – mastered in the time of Homer but not well understood even today – has been painted, and now is being passed on to the next generation of engineers.
The authors would like to extend a special thank you to the Italian magazine Progettare for the publication of this article in their January/February 2013 issue (#368).

DYNAMICS ISSUE 36 DYNAMICS ISSUE 3620
MARINE SKIFF R3 DESIGN

DYNAMICS ISSUE 36 DYNAMICS ISSUE 36 21
AERODYNAMIC AND HYDRODYNAMIC CFD SIMULATIONS OF THE HIGH-PERFORMANCE SKIFF R3SIMONE BARTESAGHIPhD, Mechanical Engineer and Yacht Designer, Milano, Italy
IGNAZIO MARIA VIOLA PhD, Lecturer, Institute for Energy Systems, University of Edinburgh, UK
Skiffs are high-performance, fast and powerful dinghies designed for onshore racing. An example of Olympic skiff
is the well-known 49er. Skiffs have a light displacement, flat hull and an oversized sail-plan, allowing planing with light wind in both upwind and downwind conditions. The typical sail-plan comprises a square top mainsail, a blade jib and a gennaker tacked on the bowsprit. The righting moment is mostly due to the weight of the crew who uses racks and trapezes. In strong breeze and high boat speed conditions, the crew moves aft, lifting the bow out of the water in order to decrease the hydrodynamic drag and improve handling. Conversely, at low boat speeds, the crew moves forward in order to lift the transom out of the water.
This article presents the results of numerical simulations performed to support the design of the R3 skiff (Figure 1), which was developed for the regatta Mille e una vela per l’università (1001 sails for academia) by the students of the Politecnico di Milano, Italy. In particular, Marco Achler performed the naval architecture analysis as part of his Master Thesis. The competition Mille e una vela per l’università was introduced by Massimo Paperini and Paolo Procesi in 2005 and it has been raced every year since then. It has been promoted by the Università degli Studi Roma Tre until 2010 and by
FIGURE 1: A photograph of the R3 skiff sailing upwind and the overlaid results of the hydrodynamic simulations
SKIFF R3 DESIGN MARINE

DYNAMICS ISSUE 36 DYNAMICS ISSUE 3622
MARINE SKIFF R3 DESIGN
the Università degli Studi di Palermo in 2011 and 2012. The 2013 regatta, Trofeo 1001VELAcup® 2013, was raced in La Spezia. The competing boats must be designed, produced and helmed by undergraduate students. In addition, they must have a maximum length-over-all of 4.60m and a maximum beam-over-all of 2.10m, and be able to carry up to 33m2 of sail area.
The aerodynamic and hydrodynamic forces and moments acting on the boat were modeled separately and then combined into a velocity prediction program (VPP), which allows computing the optimum setup of the boat and the maximum boat speed. Different aerodynamic and hydrodynamic CFD simulations were performed in order to provide input for the VPP.
HYDRODYNAMIC SIMULATIONSFor the hydrodynamic model, several CFD simulations were performed to investigate the effect of the longitudinal crew position on the hull resistance. Only half the boat was modeled, taking advantage of its longitudinal symmetry and neglecting the heel angle (the sideways tilting of a boat whilst it sails) and leeway angle (angle between the heading and the water track direction). In fact, skiffs are normally sailed at very low angles of heel, and the high speed allows sailing at low angles of leeway with limited effect on the resistance of the flat hull. A non-conformal grid of about 0.5M hexahedral cells was used. The free surface was modeled using a volume of fluid approach and the boat was free to sink and trim. A range of Froude numbers, Fr, between 0.3 and 1.2 and different longitudinal crew positions were simulated. As an example figures 2 and 3 show the free surface elevation at Fr = 0.4 and 1.2, corresponding to a displacement and a planing regime, respectively. Figures 4 and 5 show the skin friction coefficient, Cf, and the net pressure coefficient, Cpnet (hydrostatic pressure coefficient subtracted from the pressure coefficient), for the same two Froude numbers. Figure 6 shows the coefficient of total resistance, Ct, for Froude numbers ranging from 0.3 to 1.2 and for three positions of the longitudinal Center of Gravity (CG), which is measured from the stern and presented in percentage of the boat length. As anticipated, at very low boat speeds (Fr < 0.4) the minimum resistance is achieved with the most forward simulated crew position (CG = 52%), at very high boat speeds (Fr > 1.05) the minimum resistance is achieved with the most aft simulated crew position
FIGURE 3: Contours of free surface elevation at Fr = 1.2
FIGURE 4: Contours of skin friction coefficient, Cf, for Fr = 0.4 and 1.2
FIGURE 5: Contours of net pressure coefficient, Cpnet, for Fr = 0.4 and 1.2
FIGURE 2: Contours of free surface elevation at Fr = 0.4

DYNAMICS ISSUE 36 DYNAMICS ISSUE 36 23
SKIFF R3 DESIGN MARINE
BAD SAIL TRIMS
OPTIMAL SAIL TRIMS
FIGURE 6: Total resistance coefficient, Ct, versus Froude number, Fr, for different longitudinal positions of the Center of Gravity (CG)
FIGURE 7: Leeward view of the skiff displaying Cp and streamlines colored to show the flow velocity magnitude, U
FIGURE 8: Windward view of the skiff showing Cp and streamlines colored to show the flow velocity magnitude, U
FIGURE 9: Cd versus Cl2 for the mainsail and jib at different trims in upwind conditions
(CG = 39%), while at intermediate boat speeds the minimum resistance is achieved with an intermediate crew position.
AERODYNAMIC SIMULATIONSAerodynamic simulations were performed for different mainsail and jib trims in upwind conditions. The crew plays a significant role in the aerodynamic resistance and thus, hull and crew were modeled together. Figures 7 and 8 show the pressure coefficient, Cp, and a set of streamlines
displaying flow velocity. The mesh, consisting of polyhedral cells and a prismatic boundary layer, comprised a total of about 3M cells. The sails were modeled as rigid membranes with zero thickness. Figure 9 shows the lift coefficient, Cl, and drag coefficient, Cd, for the wide range of simulated sail trims. When Cd is plotted versus the square of Cl, the optimum trims collapse on a straight line, where the intercept is the parasitic drag and the slope is inversely proportional to the effective aspect ratio of the combined sail-plan.
CONCLUSIONThe numerical simulations enabled the prediction of the boat speed for different design candidates and permitted to identify the optimum crew position, which drove the design of the deck layout. The boat raced the Mille e una vela per l’università for the first time on 24-27 September 2009 and finished 1st against 14 competitors on that edition. The same platform was used for the following regattas until 2012, when a different platform was designed by a new group of students.

DYNAMICS ISSUE 36 DYNAMICS ISSUE 3624
Light Emitting Diode (LED) manufacturers sort their products into ‘bins’ based on forward voltage, with the purpose of delivering the most consistent light possible. Despite the tight grouping of forward voltages in these bins, manufacturing tolerances continue to lead to significant variations in both current draw and temperatures inside the LEDs, resulting in a inhomogeneous light distribution, even within the same batch. These discrepancies also undermine the most noteworthy selling point of the LED : its long operational life. Zumtobel, a leading supplier of integral lighting solutions for professional lighting applications, has addressed this problem by investigating the highly interconnected process between the thermal and electrical characteristics of LEDs using coupled simulations with STAR-CCM+ and NGSPICE.
ELECTRONICS LED PERFORMANCE

DYNAMICS ISSUE 36 DYNAMICS ISSUE 36 25
COUPLED THERMAL-ELECTRICAL SIMULATIONS SHED LIGHT ON LED PERFORMANCEPIER ANGELO FAVAROLO & LUKAS OSLZumtobel Group
SABINE GOODWIN & RUBEN BONSCD-adapco
THE LED EXPLAINED
Figure 1 shows the forward current vs. forward voltage (I-V) characteristics of a typical diode. When placing a forward voltage
across an LED, as is the case with any diode, the current initially does not flow until the forward voltage is increased to a level sufficiently high to pass a certain threshold, after which it flows freely in the normal conducting direction. For LEDs, the I-V characteristics at which point this occurs affects the color and intensity of the light emitted; in other words, although the principal behavior is the same for all LEDs, the light produced highly depends on each individual current voltage characteristics.
THE LED THERMO-ELECTRICAL CHALLENGEAlthough the working principle of a diode is rather simple, in reality, designing luminaires that produce consistent light (both intensity and color) can be particularly challenging due to a number of unique operational characteristics of LEDs. Inherent manufacturing variations (both in materials and processes) often cause unexpected variations in the electrical response of an LED. As discussed above, its optical output (both total amount and spectrum) is highly dependent on the electrical energy (voltage and current) driving it and thus these manufacturing variations can lead to a deterioration of light quality. A typical disparity of the
I-V characteristics due to manufacturing variations is shown in figure 1. Binning LEDs after assembly to group them in batches that have similar responses narrows these variations, but it does not eliminate them. The choice of driver circuit topology –
whether the LEDs are electrically in series or parallel – also makes a significant difference in its sensitivity to variations (Figure 2). To make sure that failure of one LED does not cause an entire circuit to break down, they are often placed in parallel on the circuit driver. This means
LED PERFORMANCE ELECTRONICS
FIGURE 1: Typical forward and reverse voltage characteristics of a diode/LED

DYNAMICS ISSUE 36 DYNAMICS ISSUE 3626
ELECTRONICS LED PERFORMANCE
that each light in the circuit operates at the same voltage (as opposed to when they are placed in series where they see the same current). Thus, they are typically run on the steep part of their characteristic curve, resulting in a higher sensitivity in response to variations in manufacturing within even a single bin.
Much like a computer chip, an LED is also very sensitive to temperature changes. The operating temperature not only affects its lifetime, it determines the optical light output (how the eye perceives it) and thermal characteristics (amount of dissipated heat) of the LED-powered luminaire. Problems such as color shift (change in color over time) and luminous flux depreciation (loss in light amount) resulting from temperature variations can quickly become daunting for a manufacturer. One of the main selling points of LEDs is that they can run for 8 hours a day for 15 to 30 years, but if the thermal design is not right, this full potential will never be reached.
Some of the variations described above can be mitigated with electrical control circuitry, however, the proper design of an LED-powered luminaire that produces both consistent light color and intensity calls for a coupled electrical and thermal approach that can address the interdependencies between the electrical circuit response, temperature, heat dissipation and cooling approach.
COUPLING THE THERMAL AND ELECTRICAL RESPONSESZumtobel has coupled STAR-CCM+ (a computational tool for simulating flow/thermal behavior) to NGSPICE (an open-source circuit simulation software) to enable the accurate prediction of the interplaying effects between electrical and thermal behaviors of LEDs. Communication between the codes is established using an interactive JAVA macro. Figure 3 illustrates the approach taken to solve this closely coupled electro-thermal problem. When NGSPICE is executed from the macro, the circuit is solved including the forward voltage and forward current of the LEDs. From this, using a proprietary method developed by Zumtobel, the electrical power is determined, and using the temperature supplied by STAR-CCM+, the optical power (how much of the energy goes out as visible light) is computed. The heat rate (representing the portion of the power that is dissipated as heat) can subsequently be calculated by subtracting the radiant power from the electrical power. This heat rate is then fed to STAR-CCM+ which in turn computes all the system temperatures to be
FIGURE 2: LEDs in parallel have a high sensitivity to variations within a single bin
FIGURE 3: Electro-thermal simulation using STAR-CCM+ and NGSPICE
FIGURE 4: Test luminaire consisting of two LEDs connected in parallel
passed back to NGSPICE for the next step in the simulation. As discussed above, the temperatures have a significant impact on the electrical characteristics of the LED, thus this cycle is repeated until the simulation converges to an equilibrium state.
This process was demonstrated and validated on a test luminaire consisting of two LEDs connected electrically in parallel, mounted on an aluminum channel and placed on a wood table (Figure 4). This model has been extensively validated in the laboratory as it is one of Zumtobel’s standard experimental test configurations. A four terminal sensing method was used to measure current and voltage of each LED. The temperature was obtained through thermocouples (type T) on specific points of the copper pad, Printed Circuit Boards (PCB) and heat-sinks and these locations were used as reference points for the thermal simulations. In addition, a parametric study was performed during testing to better understand the impact of manufacturing tolerances (e.g. thickness of the traces, thermal conductivity) on the thermal
FIGURE 5: The STAR-CCM+ luminaire model in-cludes the PCB, LED pad and semi-conductor die
behavior of the system. One significant detail of the set-up that must also be noted is that there is a current meter connected in series with one of the LEDs which increases the resistance in that branch of the circuit. As a result, each of the lights in the circuit is expected to have a unique electrical response and operating temperature.

DYNAMICS ISSUE 36 DYNAMICS ISSUE 36 27
LED PERFORMANCE ELECTRONICS
FIGURE 6: Conformal mesh showing the details of the model in STAR-CCM+
FIGURE 7 : Interface of NGSPICE and STAR-CCM+ after 20 updates (200 STAR-CCM+ iterations)
FIGURE 8: Final solution showing solid tempera-tures and circulation around each of the LEDs
For the simulation, geometrical and material properties of the LEDs were provided by the manufacturer and half symmetry was used to keep the simulation time to a minimum. To include the effects of the current meter from the experiment in the simulation, a current-limiting resistor was modeled in series with one of the LEDs on the circuit. As shown in figure 5, significant attention was paid to modeling the important details of the system, including the Metal-Core Printed Circuit Board (MCPCB) with copper traces, the LED pad (with electrical connections) all the way down to the semiconductor die. For the simulation in STAR-CCM+, accurate capturing of the physics, including natural convection cooling and limiting temperature of the semiconductor die, was key. Furthermore, unique meshing capabilities available in STAR-CCM+ were applied to ensure accuracy of the simulations. As shown in figure 6, an all-conformal polyhedral mesh was generated and extrusions were used to allow for efficiently meshing the surrounding air while at the same time capturing the small physical features in the core area of the LEDs themselves. The flow and thermal behavior of the system were obtained by performing steady-state simulations using the segregated flow and energy solvers.
Figure 7 shows a screenshot of the coupled interface which facilitates real-time tracking of the various system parameters, including the forward current through each LED and the die temperatures as the solution unfolds. At start-up, an initialization (first guess) of current, temperature and optical power was made and during the simulation,
for every one step of NGSPICE, ten steps of STAR-CCM+ were performed. After approximately 200 iterations of STAR-CCM+ (which required only about 20 minutes of simulation time on a laptop), the forward current started to converge and the die temperatures settled. A fully converged solution was obtained after approximately 50 updates between NGSPICE and STAR-CCM+.
Figure 8 depicts the surface temperatures of the solids of the system. As discussed above, the simulation shows exactly what is expected: the increased resistance due to the presence of a current meter (modeled with a current-limiting resistor) in the experiment results in a significant difference in the final temperatures of each of the LEDs. A cut through one of the LEDs also shows the velocity field at convergence, displaying the expected natural convective air flow that cools the system.
CONCLUSIONLEDs have gained a tremendous amount of popularity in recent years due to their small size, efficiency and long life. In order to meet these expectations, the interdependencies between the electrical circuit response, temperature, heat dissipation and cooling must be taken into account during the design phase of LEDs. For companies like Zumtobel, delivering consistent light with the right intensity and color is crucial to the success of their product portfolio, and performing electro-thermal simulations early in the development process facilitates the prediction of the luminaire performance in lieu of physical prototyping and testing.
ABOUT ZUMTOBELZumtobel, a company of the Zumtobel Group, is an internationally leading supplier of integral lighting solutions for professional indoor and outdoor building lighting applications. For more than 50 years, Zumtobel has been developing innovative, custom lighting solutions that meet extremely exacting requirements in terms of ergonomics, economic efficiency and environmental compatibility as well as delivering aesthetic added value. Besides the very latest technology advances and research developments, the company’s many years of experience in project business with leading international architects, lighting designers and artists provides valuable impetus that stimulates the ongoing development of the company’s already comprehensive product portfolio.

DYNAMICS ISSUE 36 DYNAMICS ISSUE 3628
“We have a warm collaboration of research team members with a unique coincidence of expertise in management of patients with dialysis at the largest UK centre, and excellence in Computational Fluid Dynamics applied in clinically-based models of arterio-venous fistulae. Vascular access is the vital conduit between the patient and the technology of the dialysis machine, without which many patients will not survive established renal failure. Up to half of arterio-venous fistulae do not mature to use after surgical formation as a result of a biological process in the blood vessel wall called neointimal hyperplasia. STAR-CCM+ has allowed us to obtain a better understanding of flow patterns within fistulae, and their relation to neointimal hyperplasia. This has paved the way for clinical pilot studies to examine the configuration of arterio-venous fistulae which we hope will result in meaningful improvement in outcomes for patients.”
Dr. Neill Duncan - Renal Consultant and Clinical Lead for Dialysis, Imperial College London, Renal and Transplant Centre and Honorary Senior Lecturer
“Haemodialysis is a predominant modality for the treatment of end-stage kidney failure. It is dependent upon high-quality vascular access to the blood stream to allow effective removal and treatment of patients’ blood through a dialysis machine. The preferred method is through the use of an established native arterio-venous fistula, created by the surgical anastomosis of a patient’s own artery and vein, usually in the arm. This technique however is hampered by the high failure rate of these fistulae given that up to 50% fail before being used for the first time. In order to improve both clinical outcomes and patient experience, we are looking at new ways to address this important medical problem.It is exciting to be part of a multi-disciplinary research group within Imperial College, working with a wide range of aeronautical engineers, bioengineers, radiologists, nephrologists and surgeons, translating basic science and engineering concepts through to bedside patient care. Computational Fluid Dynamic simulations look to be central to our approach of understanding both why arterio-venous fistula failure occurs but also to design strategies to overcome this problem.”
Dr. Richard Corbett - Imperial College London, Renal and Transplant Centre
LIFE SCIENCES BLOOD FLOW SIMULATIONS
“STAR-CCM+ has played a critical role in our research – allowing us to better understand flow physics within AVF, and helping us work towards improving their design and function. The highly cross-disciplinary research ethos at Imperial, combined with its world-leading clinical centres, provides the perfect environment in which to conduct this type of research.”
Dr. Peter Vincent - Lecturer in Aerodynamics, Department of Aeronautics, Imperial College London

DYNAMICS ISSUE 36 DYNAMICS ISSUE 36 29
BLOOD FLOW SIMULATIONS BRING SAFER AND AFFORDABLE HEMODIALYSIS TO THE MASSESPRASHANTH S. SHANKARA CD-adapco
INTRODUCTION
Chronic Kidney Disease (CKD) is an increasing public health issue affecting more than 8% of the global population. The most
severe stage of CKD is End-Stage Renal Disease (ESRD) which is a total failure of the kidneys, requiring either dialysis or a kidney transplant for the patient to live. Statistics show that more than 50% of the patients suffering from ESRD do not meet the requirements for a transplant and hence depend on dialysis. An estimated two million people are currently receiving dialysis treatment worldwide. The majority of patients receiving this treatment are from five countries (US, Japan, Germany, Brazil and Italy) with a major populace of patients from the rest of the world not receiving treatment due to a lack of access to dialysis and the unaffordable cost of this expensive procedure [1].
Improved survival of patients on hemodialysis, coupled with the inability to provide enough renal transplants for the growing ESRD population, have resulted in an increase in the average time and number of patients on dialysis. When ESRD occurs, the kidneys cannot remove harmful substances from the blood. Hemodialysis removes the blood from the body and runs it through a special filter to eliminate the unwanted substances, and pumps the blood back into the body. The key requirement for hemodialysis is to draw the blood from inside the body. Access through a catheter is a short-term solution but longer-term, a connection between the arteries and the veins, known as an Arterio-Venous Fistulae (AVF) is
established in the wrist or upper arm of the patients. When the AVF dilates, blood flow through it is increased substantially and this provides an access point to remove blood from the body for purification.
Complications associated with vascular access and in particular the stability of AVFs is a major cause of morbidity among ESRD patients [1]. The patency
of AVF is often severely reduced by the inflammatory disease Intimal Hyperplasia (IH) and/or by thrombosis, causing unfavorable clinical outcomes, additional costs for healthcare systems and even death. AVF failures place a heavy cost burden on public-health systems, rendering such treatments expensive. These complications have established a need for a functional, durable and cost-effective vascular access.
FIGURE 1: A schematic illustration of an AVF in the arm, formed by anastomosing a vein onto an artery
BLOOD FLOW SIMULATIONS LIFE SCIENCES

DYNAMICS ISSUE 36 DYNAMICS ISSUE 3630
LIFE SCIENCES BLOOD FLOW SIMULATIONS
A team of researchers from Imperial College London are working towards using modern computational tools to develop novel AVF configurations with ‘favorable’ blood flow patterns, providing guidance to surgeons for dialysis treatments, and eventually making the procedure cheaper and less prone to failure due to IH. The team, consisting of researchers from Imperial College Renal and Transplant Centre, the Department of Medicine, the Department of Bioengineering and the Department of Aeronautics are collaborating with the Academic Health Science Centre and NIHR Comprehensive Biomedical Research Centre to use Computational Fluid Dynamics (CFD) to solve this internationally relevant healthcare problem. This article gives a brief overview of the research currently being undertaken at Imperial College London towards a safer, cost-effective dialysis procedure.
ARTERIO-VENOUS FISTULAE AND THEIR FAILUREAVF are access points to the blood circulation for hemodialysis, created by a vascular surgeon using the patient’s native vessels. The vessels used - an artery and a vein -are joined (anastomosed) with the end of the vein attached to a 5mm hole made in the side of the artery [2]. The blood flow, diverted from the artery into the vein, causes the vein to become enlarged and thicker, allowing placement of a large-gauge needle. In fact, in response to the steep pressure gradient existing between the arterial and the vein, the blood flow rate will increase and eventually the access will be able to deliver a blood flow of 300 to 500 ml/min [3], necessary to perform dialysis. As a comparison, the normal
blood flow through this area of the arm is around 50-100 ml/min.
Although AVF represents the gold standard of treatment for eligible patients, they still have a high failure rate of almost 50% [4] within the first month after their creation. Intimal Hyperplasia in the AVF occurs due to an abnormal thickening of the tunica intima of a blood vessel as a complication of the physiological remodeling process, triggered by altered flow conditions. This abnormal expansion negatively affects the patency of the AVF and eventually leads to its obstruction [5].
SAFER AVF DESIGN USING STAR-CCM+In recent decades, CFD, a numerical simulation technology first developed for aerospace applications, has become a popular alternative to experiments and has been used as a design tool in the Life Sciences industry. Applications of CFD include biomedical device design, as well as numerical diagnostics and pharmaceutical manufacturing.
With the use of numerical simulation, the research team at Imperial College London analyzed multiple AVF configurations to understand the impact of the geometry on the blood flow patterns and the likelihood of failure. CFD allows the study of blood flow in the vasculature and any required metrics of the flow, to be calculated based on a definition of the vascular geometry and inflow boundary conditions. Experiments are often difficult to perform for obtaining flow patterns in AVF configurations and present various limitations in human subjects, resulting in
only scant data being available. Metrics of most interest, such as Wall Shear Stress (WSS) and Oscillatory Shear Index (OSI), a measure of time variation of the direction of wall shear stress vector, are not readily available from experiments. Numerical simulation enables researchers to properly visualize such complex flow phenomena in greater detail and is non-invasive, with the ability to analyze multiple designs quickly and efficiently.
THE SIMULATION PROCESSThe process begins by obtaining a CAD model of the native arteries in the arm. Various AVF configurations are then formed on this native geometry via ‘virtual surgery’ (Figure 2). STAR-CCM+, CD-adapco’s flagship software, is then used to simulate the blood flow through each AVF configuration. STAR-CCM+ is a single integrated package with a CAD-to-solution approach and optimization capabilities enabling the user to effectively analyze multiple design variants and optimize for best design.
The AVF configurations were discretized using the automated polyhedral cell meshing technology of STAR-CCM+ with approximately 10 million polyhedral cells for each design. A close-up view of a volume mesh with prismatic layers at the wall is seen in figure 3. Automated prism layer generation on the walls was used to resolve the boundary layer flow at the wall of the vein, artery and AVF. The computational mesh was properly refined near the connection to capture the fine scale flow features. Incompressible Navier-Stokes equations were solved in the entire domain with the blood being modeled as a Newtonian fluid with constant viscosity. The inflow conditions for blood
FIGURE 3: View of the volume mesh at the AVF FIGURE 2: CAD model of AVF configuration formed in the arm via ‘virtual surgery’

DYNAMICS ISSUE 36 DYNAMICS ISSUE 36 31
BLOOD FLOW SIMULATIONS LIFE SCIENCES
THIS ARTICLE IS PART OF A TWO-SERIES SPOTLIGHT ON THE LIFE SCIENCES RESEARCH BEING CONDUCTED AT IMPERIAL COLLEGE LONDON ON DIALYSIS TREATMENT. THE NEXT EDITION OF DYNAMICS WILL FEATURE A FOLLOW-UP ARTICLE DELVING INTO THE DETAILS OF THE RESEARCH FINDINGS.
REFERENCES:[1] Feldman, H., Kobrin, S., Wasserstein, A. (1996): Hemodialysis vascular access morbidity, J. Am. Soc. Nephrol., 523–535, 1996.[2] Loth, F., Fischer, P. F., & Bassiouny, H. S.: Blood Flow in End-to-Side Anastomoses, Annual Review of Fluid Mechanics, 40(1), 367–393, 2008.[3] Sivansesan, S., How, T.V., Black, R., Bakran, A.: Flow patterns in the radiocephalic arteriovenous fistula: an in vitro study, Journal of Biomechanics, 32(9), 915–925, 1999.[4] Huijbregts, H. J. T., Bots, M. L., Wittens, C. H. a, Schrama, Y. C., Moll, F. L., Blankestijn, P. J.: Hemodialysis arteriovenous fistula patency revisited: results of a prospective, multicenter initiative, Clinical journal of the American Society of Nephrology: CJASN, 3(3), 714–9, 2008.[5] Sivansesan S, How T.V., Bakran A.: Sites of stenosis in AV fistulae for haemodialysis, Nephrol Dial Transplant 14: 118–120, 1999.All images courtesy of Imperial College London
flow into the artery were considered to be non-pulsatile in the initial stage with further simulations incorporating transient pulsatile flow as the boundary condition. The walls of the vessel were considered as rigid, no-slip walls.
EXPECTED VALUE OF SIMULATIONFigure 4 shows the contours of a passive scalar advected with the blood flow on planar sections at constant intervals along the artery, vein and the AVF connection for one of the designs. The concentration of the passive scalar gives a visual indication of how the blood is mixed in the AVF. The results from the simulation enable a qualitative assessment of the blood flow patterns. The non-physiological hemodynamics in this region causes WSS to fluctuate greatly. This behavior could result in the failure of the AVF due to inflammation.
The passive scalar concentration along a centerline plane in the AVF is seen in figure 5, showing uneven mixing of the blood at the junction of the AVF. Figure 6 shows streamlines of the blood flow through the connection. Such results from STAR-CCM+ enabled the research team to clearly identify areas of recirculation, swirl, high vorticity, high velocity and high/low wall shear stress in the fistula area. The hemodynamic parameters can also be studied individually upstream and downstream of the fistula to identify problem areas.
CONCLUSIONThe team of researchers from Imperial College London is undertaking numerical simulations to improve clinical outcomes for dialysis patients and reduce the financial burden for healthcare providers, by developing better designs to decrease the failure rates of AVF. Reduced rates of AVF failure will lead to improved patient experience, survival rate and cost-utility, making dialysis potentially affordable for lower-income populations. It is hoped that results from the study will also help solve a range of other long-standing healthcare problems, such as failure of vascular stents, arterial bypass grafts and organ transplants, due to IH. The ultimate objective of the research team is to provide guidance to the surgeons on the configuration of AVF for healthy flow patterns and reduced potential for failure. This serves as an excellent example of the far-reaching impact of numerical simulation into our daily life, helping save lives with the same ease as which it helps to build products.
FIGURE 4: Concentration of a passive scalar, advected with blood flow, on different plane sections along the artery, vein and AVF
FIGURE 5: Concentration of a passive scalar, advected with blood flow, on a centerline plane section in the AVF
FIGURE 6: Streamlines showing flow features inside the AVF
THE RESEARCH TEAM
DR. PETER VINCENTDepartment of Aeronautics, Imperial College London - CFD Lead
PROF. COLIN CARODepartment of Bioengineering, Imperial College London - Bioengineering Lead
DR. NEILL DUNCANImperial College London, Renal and Transplant Centre, Hammersmith Hospital - Clinical Lead
MISS LORENZA GRECHYDepartment of Aeronautics, Imperial College London - CFD
MR FRANCESCO IORIDepartment of Bioengineering, Imperial College London - CFD
DR. RICHARD CORBETTImperial College London, Renal and Transplant Centre, Hammersmith Hospital - Clinical
PROF. WLADYSLAW GEDROYCSt Mary’s Hospital - Clinical
JEREMY CRANE Imperial College London, Renal and Transplant Centre, Hammersmith Hospital - Surgical Lead
DR. MARC REAImperial College NHS Healthcare Trust - Clinical

DYNAMICS ISSUE 36 DYNAMICS ISSUE 3632
GROUND TRANSPORTATION ATLANTING TURBOCHARGERS
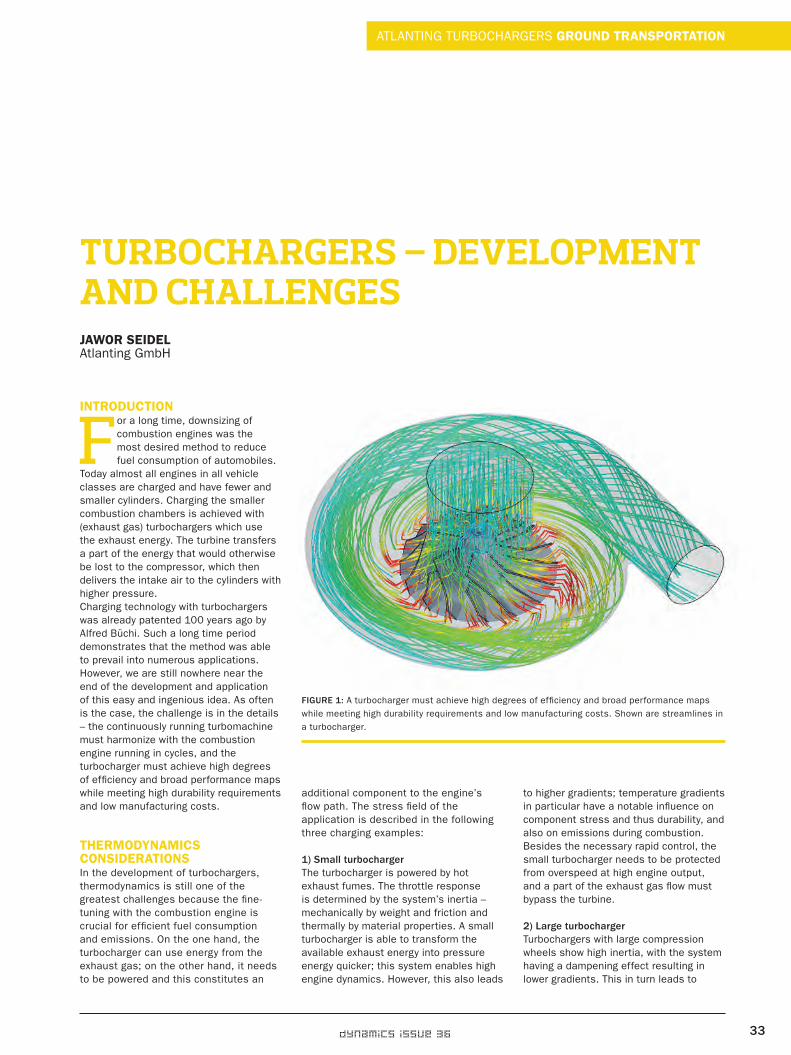
DYNAMICS ISSUE 36 DYNAMICS ISSUE 36 33
TURBOCHARGERS – DEVELOPMENT AND CHALLENGESJAWOR SEIDELAtlanting GmbH
INTRODUCTION
For a long time, downsizing of combustion engines was the most desired method to reduce fuel consumption of automobiles.
Today almost all engines in all vehicle classes are charged and have fewer and smaller cylinders. Charging the smaller combustion chambers is achieved with (exhaust gas) turbochargers which use the exhaust energy. The turbine transfers a part of the energy that would otherwise be lost to the compressor, which then delivers the intake air to the cylinders with higher pressure.Charging technology with turbochargers was already patented 100 years ago by Alfred Büchi. Such a long time period demonstrates that the method was able to prevail into numerous applications. However, we are still nowhere near the end of the development and application of this easy and ingenious idea. As often is the case, the challenge is in the details – the continuously running turbomachine must harmonize with the combustion engine running in cycles, and the turbocharger must achieve high degrees of efficiency and broad performance maps while meeting high durability requirements and low manufacturing costs.
THERMODYNAMICS CONSIDERATIONS In the development of turbochargers, thermodynamics is still one of the greatest challenges because the fine-tuning with the combustion engine is crucial for efficient fuel consumption and emissions. On the one hand, the turbocharger can use energy from the exhaust gas; on the other hand, it needs to be powered and this constitutes an
additional component to the engine’s flow path. The stress field of the application is described in the following three charging examples:
1) Small turbochargerThe turbocharger is powered by hot exhaust fumes. The throttle response is determined by the system’s inertia – mechanically by weight and friction and thermally by material properties. A small turbocharger is able to transform the available exhaust energy into pressure energy quicker; this system enables high engine dynamics. However, this also leads
to higher gradients; temperature gradients in particular have a notable influence on component stress and thus durability, and also on emissions during combustion. Besides the necessary rapid control, the small turbocharger needs to be protected from overspeed at high engine output, and a part of the exhaust gas flow must bypass the turbine.
2) Large turbochargerTurbochargers with large compression wheels show high inertia, with the system having a dampening effect resulting in lower gradients. This in turn leads to
FIGURE 1: A turbocharger must achieve high degrees of efficiency and broad performance maps while meeting high durability requirements and low manufacturing costs. Shown are streamlines in a turbocharger.
ATLANTING TURBOCHARGERS GROUND TRANSPORTATION

DYNAMICS ISSUE 36 DYNAMICS ISSUE 3634
disadvantages in engine dynamics and consequently to increased consumption at highly transient operating conditions. On the other hand, lower temperature gradients lead to better voltages and emissions, which is beneficial for acoustics. In addition, the complete exhaust gas flow can be directed through the turbine and a greater potential of exhaust energy can be used.
3) Multi-stage turbochargerMulti-stage turbochargers usually comprise of two turbochargers. The combination of a smaller and a bigger turbocharger is meant to exploit the advantages of both configurations mentioned previously. The small charger provides the dynamics, the bigger charger uses the exhaust energy even at high engine output. However, a significantly more complex control of such systems, a lower overall turbocharger efficiency (product of the individual stages), higher costs, and the need for construction space have to be expected.
THE CASE FOR COMPUTER-AIDED ENGINEERING In addition to the abovementioned requirements regarding the use of a turbocharger with a combustion engine, the developers must consider complex physical processes with high demands on thermo- and structural dynamics. Energy transmission with a turbomachine is always transient, impeller blades are swinging, gaps are changing over the perimeter due to rotor dynamics, and the exhaust admission into the turbine is pulsating. The heat flow inside the turbocharger depends on both the temperature of the lubricating oil and of the surrounding environment. Engine operation and the real assembly situation with the turbocharger under various flow inlet/outlet conditions have an essential influence on fuel consumption and emissions.It takes a lot of experience to handle this complexity, and structural and standardized development processes must be applied for a good prospect of success. Particularly suitable for this purpose are computer-aided development environments. More and more, detailed software-based modeling is enabled by rising computing power and sinking hardware costs. Today, a major part of turbocharger development is based on simulations with the appropriate level of detail and precision. Implementation of automation and mathematical methods is made very easy. High reproducibility of simulation results and the possibility to compare a large number of variants facilitate the creation of a standardized development process.
PARAMETRIC INTERDISCIPLINARY MATRIX PROCESS Atlanting GmbH has achieved a standardized development process by implementing a Parametric Interdisciplinary Matrix process (PIM process). Figure 2 shows the development of thermodynamics using the example of a compressor. The PIM process starts with parametric models which allow variation and evaluation of different geometries. In addition to the integration of performance chart calculations, attempts are made to reduce the number of necessary design analyses further by means of methods like DoE (Design of Experiment) and LuT (Look up Table).The application of the PIM process leads to a significant reduction of development times – about 50% on average. Several business objectives (function, durability) and influence factors (manufacturing, costs) are simultaneously integrated into the models. This leads to synergies in the
design cycle which enable a high degree of product maturity at an early stage of development. Atlanting’s structured PIM process combines long-term experience in the development of turbomachines and combustion engines with the know-how about computer-aided product development, and thus serves as a customized tool for developmental tasks.
AUTOMATING THE CALCULATION OF THE CHARACTERISTIC COMPRESSOR DIAGRAM Thermodynamic properties of turbomachines can be described by the use of characteristic diagrams. A characteristic compressor diagram consists of a number of speed lines, each of which holds several operating points. The usable operational area of a compressor stage is limited by the surge and choke line and the maximum permissible peripheral speed of the
FIGURE 2: PIM – Development of compressor
GROUND TRANSPORTATION ATLANTING TURBOCHARGERS

DYNAMICS ISSUE 36 DYNAMICS ISSUE 36 35
impeller. The pumping describes a stall as a result of decreasing mass flows under high compression ratio. This causes a backflow inside the compressor until a stable forward-pointing mass flow is restored and pressure build-up begins again. The exact position of the surge line is hard to define. Part variances/tolerances and installation conditions affect the position of the surge line and the whole characteristic diagram. Due to the huge number of operating points, an automation of the calculation of the characteristic diagram is necessary.Figure 3 demonstrates the boundary conditions of an approach which enables a quick and stable automation. Besides the boundary pressure conditions at the intake and outlet, an additional aperture is inserted before the compressor outlet. Together with a predefined rotational speed of the impeller, the operational point of the compressor is completely characterized. Subsequently, in analogy to the hot-gas testing system, the aperture can gradually be closed starting at the fully open position and thus the counter-pressure can be increased. In this way, it is possible to characterize the speed line from choke line towards the surge line without having to change the boundary conditions (pressure/pressure → pressure/mass flow). In particular, close to the surge line this procedure proves to be numerically very stable in combination with the STAR-CCM+ solver.Specific characteristics which replace the abort criteria were implemented to determine the location of the surge line. Unlike the numerical solver residua, these characteristics are strongly related to the physical process of pumping
FIGURE 3: Boundary conditions for CFD map simulation FIGURE 4: Baffle factor
and allow the collection of reliable information about the position of the surge line, and therefore about when to terminate the calculations. On the other side of the characteristic diagram, calculations were made at the choke line with fully open aperture starting at a compression ratio of πV = 1. Because the determination of the surge line is not limited by cross-sections and pressure losses of the test-bench set-up, the characteristics of the compressor are more evident. In addition, STAR-CCM+ allows the continuous meshing of impeller and housing. This robust and automated method makes the whole process faster and, together with the calculation of characteristics, provides a reliable tool for further development of compressor stages.
TESTING AND SIMULATION Today, testing and simulation can either complement or replace each other. The choice between testing and simulation is primarily determined by time and cost factors, e.g. the development of suitable simulation models and the required computing times compared with prototype procurement and testing. The development of turbochargers always requires a compromise.
On the hot-gas test bench, attempts are made to create comparable conditions by flow-calming sections and standardized superstructures in order to compare distinguishing properties of different machines with the help of measured characteristic diagrams and to verify development steps. In the course of the
development, unreal operational conditions are used, such as stationary operational points instead of the transient start-up of the engine.
Through the testing, simulation models can be improved, and the simplifications of the simulation can be secured. It is up to the engineers’ abilities to integrate simulations into the overall development process with the necessary model depth, and consider computational times. As a general rule, CFD simulations are usually carried out with simplified and standardized boundary conditions, just like bench tests.
CONCLUSION Besides non-steady phenomena like pumping, designers are more and more focused on the transient behavior of turbochargers. This is significantly influenced by the mechanical but also the thermal inertia of the whole turbomachine. Within its installation space, the turbocharger is also subject to different thermal boundary conditions which affect the heat flux and the behavior of the turbomachine. Moreover, details specific to the application make comparisons difficult and challenge the structured development process.
In the future, characteristic diagrams of turbochargers will extend to more dimensions (e.g. include varying operating conditions). Atlanting GmbH is convinced that software simulation is a continuously growing field in the development process of turbochargers because test-stands are limited in space and energetic dimensions.
ATLANTING TURBOCHARGERS GROUND TRANSPORTATION

DYNAMICS ISSUE 36 DYNAMICS ISSUE 3636
GROUND TRANSPORTATION INDESA TURBOCHARGERS

DYNAMICS ISSUE 36 DYNAMICS ISSUE 36 37
COMPUTATIONAL THERMAL MANAGEMENT OF TRANSIENT TURBOCHARGER OPERATIONFABIANO BET & GERALD SEIDERInDesA GmbH
INTRODUCTION
With the ever-increasing spotlight on fuel efficiency and emission control, turbochargers are projected
to be in increasing demand with more cars adopting this technology for increased power and more miles per gallon of fuel. Initially designed for aircraft engines operating at high altitudes, turbochargers offer an elegant, simple boost to an engine’s performance and are being adopted in cars, motorcycles, trucks, trains and marine vessels. Turbochargers convert the waste exhaust gases from the engine into compressed air for the engine, resulting in more air intake which allows the engine to burn more fuel. An engine with turbocharging produces increased power without significantly increasing engine weight due to their simplistic design, resulting in huge benefits in efficiency and performance. Typical turbochargers consist of a turbine and a compressor connected by a shaft, with the engine exhaust air running the turbine, which in turn delivers air to the compressor via an air pump. To keep the weight down, the turbine and compressor are made of ceramic materials and the high rotational rate of the turbines, sometimes as high as 30 times the engine, coupled with high exhaust gas temperatures, makes the thermal management of turbochargers a critical design challenge.
Integrating modern computational methods into the design cycle helps in understanding the thermal behavior of turbochargers by offering insight into component and system performance.
Numerical simulation opens up a whole gamut of possibilities in the understanding of the workings, efficiency and design of rotating components in the turbocharger from a thermal perspective. Recent advances in time-accurate CFD computations, turbulence modeling and processor speed have made transient computational analysis a practical design tool for turbocharger analysis. In this article, InDesA offers a glimpse into their use of computational methods using CD-adapco’s STAR-CCM+ for efficient design of turbochargers.
TURBOCHARGER DESIGN – A THERMAL PERSPECTIVEA turbocharger is thermodynamically coupled to the combustion engine and driven by the exhaust gas which expands
through the turbine and powers the compressor which is mechanically linked through a rotating shaft. The hot exhaust gas from gasoline engines can exceed 1000°C at the inlet of the turbine and needs to be insulated from the intake air entering the compressor at ambient temperatures. This temperature difference of up to 1000°C in one component with rotating parts at very high speeds is challenging, not only from a mechanical perspective but also from the flow and thermal side.
Thermal management refers to the balancing of the heat fluxes inside the turbocharger while controlling and limiting temperatures for the structure of the turbocharger housing and rotating assembly as well as for lubrication and coolant fluids. Thermal management must
FIGURE 1: Sub-systems for coupled turbocharger simulation
INDESA TURBOCHARGERS GROUND TRANSPORTATION

DYNAMICS ISSUE 36 DYNAMICS ISSUE 3638
also control heat transfer by radiation, convection and conduction to the ambient and neighboring components. Thermal interaction with the environment can be strong and can lead to damage of the turbocharger, exhaust manifold as well as the neighboring components.
The temperature difference between the exhaust gas and the intake air is an engineering challenge, in addition to the temperature change caused by a sudden load change, for example, from accelerating at full load to zero and back to full load. Those incidences can cause temperature changes of several hundred degrees within seconds on the turbocharger exhaust side leading to high thermal stresses and eventually fatigue. This is why transient thermal analysis is essential for structural analysis and the layout of turbocharger designs.
Thermal reliability is certainly the main goal of thermal management. However, it should be mentioned that heat transfer from the exhaust side to the compressor can lower the efficiency of the compressor and thus directly influences engine performance. Besides, unstable compressor operation can be triggered if the compressor is operating close at its pump or surge line.
Thermal analysis of turbochargers is based on thorough gas dynamics analysis. Pressure and shear stresses from the gas flow through turbine and compressor are balanced with frictional losses from the rotating shaft and with mass inertia from the rotating assembly, allowing for steady state as well as for transient operation of the turbocharger. InDesA has gained expertise and confidence in flow simulation of compressors and turbines with STAR-CCM+. Even local supersonic flow areas with interacting shock waves can be captured in the diffuser of a compressor near surge operation. Thus, entire performance maps for compressors from pump to surge line can be simulated which is one precondition to deal with transient flow and thermal phenomena.
SIMULATION METHODOLOGYA simulation approach with direct thermal-fluid-structure coupling (CFD/CHT) was chosen for the turbocharger and its closer environment. This includes the exhaust gas, the intake air, coolant and engine oil as well as different materials for the rotating assembly, compressor and turbine housing, bearings and seals as well as for heat shields (Figure 1). The rotating assembly is coupled to the flow through compressor and turbine by fluid-body-
interaction where the resulting moments from the flow on the compressor and turbine wheel are used to compute the angular acceleration of the assembly. Friction torque for the bearings and seals were estimated with the angular velocity and oil temperature as dependent variables. The rotation of the assembly is coupled to the non-rotating regions by sliding interfaces.
To close the system, a simplified approach was taken to link the compressor outlet flow to the turbine inlet flow by implementing basic thermodynamic models for the charge air cooler and for combustion yielding intake and outlet valve timing through field functions. To accelerate the turbocharger, the fuel mass flow rate is simply increased which basically simulates diesel engine operation. The increase of fuel rate is controlled by use of a PI-controller with a fuel-air-ratio target. This approach serves to demonstrate the capabilities of the overall approach. For more realistic engine operation, whether diesel or gasoline, it is recommended to use a GT-POWER 1D simulation model that can be directly coupled to the STAR-CCM+ model, allowing for more control of throttle, fuel injection,
ignition, valve timing, waste gate or VTG positions and EGR rates.
SIMULATION MODEL AND BOUNDARY CONDITIONSThe turbocharger used for this investigation is shown in figure 2. It is connected to a simple cast exhaust manifold with a heat shield underneath and to an exhaust pipe. Inlet and outlet hoses are attached to the compressor. Using the Conjugate Heat Transfer (CHT) approach, all fluid and structural continua were meshed with polyhedral cells. For all fluid regions close to solid walls with boundary-layer-like-flow, prism layers were integrated with a minimum of four layers. For accuracy reasons, all interfaces were node-to-node connected and conformal. The resulting mesh contained 14 million cells with 24 regions and seven physics continua. No volume mesh was used outside the turbocharger as the heat shields are only thermally connected to the system by radiation. Heat transfer coefficients and ambient temperature were defined on the outer surfaces of the turbocharger and the heat shields to account for thermal convection. Volume flow rates and inlet temperatures were
FIGURE 2: Simulation model of a turbocharger
FIGURE 3: Dynamic response of turbocharger
GROUND TRANSPORTATION INDESA TURBOCHARGERS

DYNAMICS ISSUE 36 DYNAMICS ISSUE 36 39
prescribed at the inlet boundary for coolant and oil, whereas for the intake air, stagnation pressure and temperature were set as inlet boundary conditions. A back pressure was defined at the compressor outlet. Finally, transient response of the system was controlled by the fuel rate with the assumption that the engine speed does not change due to the change of load.
Figure 3 shows the transient profile for the exhaust gas and intake air mass flow rates as they respond to the increase of fuel mass flow rate. This test case consists of three intervals: a steady state period with respect to engine operation and thermal state followed by an interval where the fuel rate is ramped up to its target value. The last interval resumes constant engine operation where thermal conditions start to adjust to the new operating point with the turbocharger running at a higher speed. The oscillations in the fuel mass flow rate are caused by the fuel-air-ratio controller and hence can be observed for the gas mass flow rates as well.
DISCUSSION OF RESULTSFor simplicity, it is assumed that the exhaust gas pressure at the inlet of the
exhaust manifold is equal to the boost pressure. The engine and drive train inertia are neglected. As a consequence, a rapid response of the exhaust gas and the rotating assembly is observed (Figure 3).
Thermal response is lagging behind mechanical response of a turbocharger. In fact, the temperatures at different locations show different response times (Figure 4). At the end of the simulation, after three seconds, temperatures have not reached a constant state. At that point, the flow field is stable and the simulation can be continued with moving reference frames for the rotating assembly to reach the final thermal state if that is desired.
The temperature profiles can give some indication on whether transient operation can be critical for the turbocharger structure. In the end, a transient stress analysis must be performed to detect critical thermal stresses where the thermal analysis with STAR-CCM+ delivers the temperature field as input at discrete time steps. A sample temperature contour plot is given in figure 5 for a discrete time step.
The temperature of the turbine wheel and housing is influenced in the first
place by the exhaust gas temperature and the compressor wheel and housing by air compression. The instantaneous temperature field results from the balance of all heat fluxes from the turbocharger structure to the coolant and engine oil, as well as to the ambient environment through convection and radiation. Also, thermal interaction of different parts of the turbocharger and the heat shield is significant to determine correct structural temperatures.
In principal, there are three options if critical stresses are detected from a structural analysis. In general, the problem can be cured by either bringing down temperatures, adapting the geometry so that thermal stresses decrease, or by changing to a more robust material for the turbocharger. Exhaust gas temperatures can be controlled by reducing boost, retarding ignition timing, and by enrichment of air/fuel mixture. However, a further option is provided by a thorough analysis of thermal heat fluxes within the turbo charger. Once we gain an understanding of the interaction of the heat fluxes between the different media, they can be eventually redirected by small changes of the water jacket or of thermal bridges within the structure. This is often a more elegant way to cure thermal problems than to adjust combustion parameters.
CONCLUSIONThermal analysis has become an elementary and reliable technique within the virtual product creation process of turbochargers. It creates an essential input for structural stress analysis to detect thermal stresses which can lead to structural fatigue. For simplicity, thermal stress analysis is often done for hot/cold states only. However, with the capabilities of transient thermal analysis, transient thermal stress can be detected which may be more critical in comparison to steady state analysis. On the other hand, transient thermal effects can also relieve sudden temperature changes as thermal inertia from the masses involved can damp thermal shocks as well. Short but sudden turbocharger acceleration will not immediately lead to critical temperatures. This is why transient thermal analysis will result in higher fidelity of thermal stress prediction.
The presented methodology is a manageable approach using CD-adapco’s STAR-CCM+ to couple transient flow phenomena in the turbine and compressor with the rotating group and at the same time predict thermal response.
FIGURE 4: Thermal response due to turbocharger acceleration
FIGURE 5: Temperature contours in turbocharger structure
INDESA TURBOCHARGERS GROUND TRANSPORTATION

DYNAMICS ISSUE 36 DYNAMICS ISSUE 3640
LIFE SCIENCES TABLETING AND COATING

DYNAMICS ISSUE 36 DYNAMICS ISSUE 36 41
NUMERICAL SIMULATIONS FOR TABLETING AND COATINGSABINE GOODWIN, OLEH BARAN & KRISTIAN DEBUSCD-adapco
Solid dose tablet manufacturing processes often lack reliability and robustness as a result of errors in production and a
shortfall in process control. Facing unprecedented economic pressures, pharmaceutical manufacturing companies are continuously looking to improve on the quality of their products and the productivity of their processes. Multi-physics numerical simulation is emerging as a game-changing technology to help step up efficiency, enhance quality, and shorten time-to-market through virtual prototyping and optimization.
CHALLENGES OF SOLID DOSE TABLET MANUFACTURINGTableting (compression from a powder into a solid dose tablet) and tablet coating are two vitally important steps in the tablet manufacturing process that ultimately determine the weight, thickness, density, hardness and coating of the final solid dosage form. Variability in any of these attributes not only negatively impacts the release profile and therapeutic efficacy of the medicine, it alters the disintegration and dissolution properties of the tablet, leads to tablet defects and causes breakage during bulk packaging and transport.
With the adoption of novel manufacturing processes such as non-stop end-to-end processing, and the push to build quality and efficiency into production, solid dose tablet manufacturers have a challenging road ahead of them because they must pinpoint the key factors and requirements that will lead to robust
and repeatable processes, resulting in superior products.
WHY NUMERICAL SIMULATIONS?Multi-physics Computational Fluid Dynamics (CFD) is a numerical method for predicting the coupled behavior of fluid, gas and particulate flows including heat and mass transport. A significant advantage of using numerical simulations is that it allows for the validation of a design or process before physical tests need to be carried out. For example, the development of a new tablet shape or coating material calls for performing an extensive number of costly and time-consuming experiments to avoid unexpected variations, identify unpredictable process parameters and address scale-up problems. Studying these effects through numerical simulations can greatly reduce time, material and development costs. In addition, numerical visualization tools offer a wealth of detailed information,
not always readily available from experimental tests. This not only results in an increased level of insight into the details of what is going on inside the processes, it enables innovation.
STAR-CCM+ PROVIDES THE SOLUTIONSWith its automated polyhedral meshing technology and comprehensive range of physics models, STAR-CCM+ is a complete multi-disciplinary simulation toolkit to tackle a wide range of applications in the pharmaceutical industry. One capability in STAR-CCM+ that is particularly well-suited for the simulation of tablet manufacturing processes is Discrete Element Modeling (DEM), fully coupled with numerical flow simulations and delivered in a single software environment.
Tableting and coating involve a large number of discrete particles that interact with each other and the fluids surrounding them. DEM accurately
FIGURE 1: STAR-CCM+ simulation with DEM showing a pharmaceutical powder packed and com-pressed inside a tablet die. Variations in color reflect the non-uniformity of the granule distribution.
TABLETING AND COATING LIFE SCIENCES
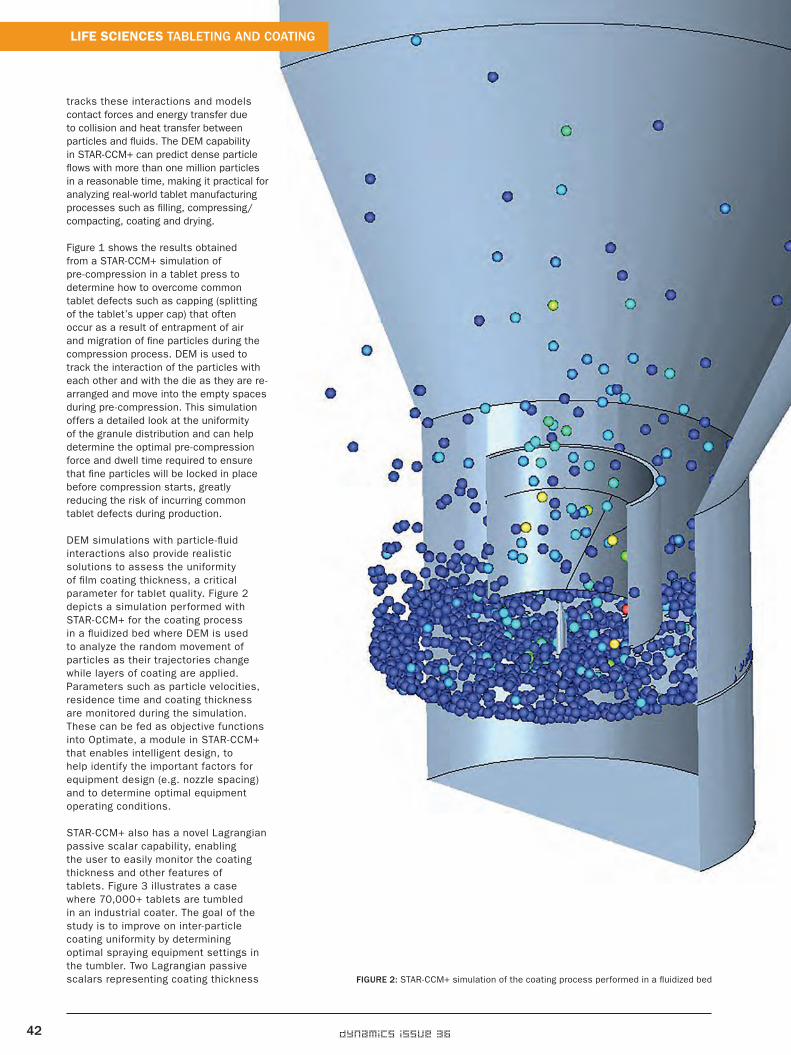
DYNAMICS ISSUE 36 DYNAMICS ISSUE 3642
tracks these interactions and models contact forces and energy transfer due to collision and heat transfer between particles and fluids. The DEM capability in STAR-CCM+ can predict dense particle flows with more than one million particles in a reasonable time, making it practical for analyzing real-world tablet manufacturing processes such as filling, compressing/compacting, coating and drying.
Figure 1 shows the results obtained from a STAR-CCM+ simulation of pre-compression in a tablet press to determine how to overcome common tablet defects such as capping (splitting of the tablet’s upper cap) that often occur as a result of entrapment of air and migration of fine particles during the compression process. DEM is used to track the interaction of the particles with each other and with the die as they are re-arranged and move into the empty spaces during pre-compression. This simulation offers a detailed look at the uniformity of the granule distribution and can help determine the optimal pre-compression force and dwell time required to ensure that fine particles will be locked in place before compression starts, greatly reducing the risk of incurring common tablet defects during production.
DEM simulations with particle-fluid interactions also provide realistic solutions to assess the uniformity of film coating thickness, a critical parameter for tablet quality. Figure 2 depicts a simulation performed with STAR-CCM+ for the coating process in a fluidized bed where DEM is used to analyze the random movement of particles as their trajectories change while layers of coating are applied. Parameters such as particle velocities, residence time and coating thickness are monitored during the simulation. These can be fed as objective functions into Optimate, a module in STAR-CCM+ that enables intelligent design, to help identify the important factors for equipment design (e.g. nozzle spacing) and to determine optimal equipment operating conditions.
STAR-CCM+ also has a novel Lagrangian passive scalar capability, enabling the user to easily monitor the coating thickness and other features of tablets. Figure 3 illustrates a case where 70,000+ tablets are tumbled in an industrial coater. The goal of the study is to improve on inter-particle coating uniformity by determining optimal spraying equipment settings in the tumbler. Two Lagrangian passive scalars representing coating thickness FIGURE 2: STAR-CCM+ simulation of the coating process performed in a fluidized bed
LIFE SCIENCES TABLETING AND COATING

DYNAMICS ISSUE 36 DYNAMICS ISSUE 36 43
are defined: one with source volume confined to one cone above the surface, another with source volume confined to two cones and with an effective spray area identical to the one of the first passive scalar. Using this approach, a single simulation allows for a comparison of the inter-particle coating uniformity for two different spray zones and the result indicates that the two-spray configuration provides a more uniform coating distribution.
CONCLUSIONIn today’s competitive climate, manufacturing of solid dose tablets must have a focus on building quality and efficiency into processes, and multi-physics CFD simulations offer a cost-effective way to achieve this through rapid prototyping and optimization. The complex flow-fields associated with tableting and coating can be addressed with ease by using the high-end physics models delivered by STAR-CCM+, including the powerful DEM and novel passive scalar capabilities. Users in the pharmaceutical industry are fully leveraging these state-of-the art technologies as it opens the door to explore innovative ways to improve quality, reduce cost and shorten time-to-market.
In today’s competitive climate, manufacturing of solid dose tablets must have a focus on building quality and efficiency into the processes. This can be accomplished through rapid prototyping and optimization using multi-physics simulation. FIGURE 3: Simulation with STAR-CCM+ comparing coating thickness variation of one and two sprays
in a tumbler
TABLETING AND COATING LIFE SCIENCES

DYNAMICS ISSUE 36 DYNAMICS ISSUE 3644
SPORTS HUMAN-POWERED VEHICLES

DYNAMICS ISSUE 36 DYNAMICS ISSUE 36 45
FROM WORLD RECORDS TO DAILY MOBILITYPAOLO BALDISSERA & CRISTIANA DELPRETEMechanical and Aerospace Engineering Department, Politecnico di Torino
The broad category of Human-Powered Vehicles (HPVs) includes all those mechanical means of transport driven or ridden by man
that use only human muscle power, or in an assisted manner, to transport people, animals and goods across land, water, underwater and, even, in some cases, by air. Human-Powered Vehicles (HPV) include all forms of transport by land, water or air where the vehicle is mainly driven by human power. Of late, variations of HPVs have started to include assistance from other power sources like electric engines to make them more feasible for multiple applications while still relying on human muscular strength to generate the energy required to drive the assisting device. For historical and market reasons, the best-known terrestrial HPV is the bicycle which, despite not being the most efficient or fastest means of transport, has significant benefits in terms of convenience and enjoys, in its various forms, a widespread popularity both in sports and urban transport, especially in central and northern European countries. Over the last decade, alongside traditional bicycles, other types of HPVs have become increasingly popular, in particular recumbent bicycles and tricycles or those with supine pedalling posture and supported by a seat instead of the classic saddle. The main advantages of these is that they have the best aerodynamics and are the most comfortable to ride, especially for long distances, because of the more natural position of the cyclist’s back, neck and arms. The search for higher performance in sports has produced faired and semi-faired variants (front or tail only) ranging from the current record-breaking streamliner (two-wheeled, full fairing) to velomobiles for daily mobility (faired and recumbent FIGURE 2: The COR-AL13 prototype with the faired tail designed
FIGURE 1: Anthropometric proportions of the CAD mannequin and the cyclist representing the team
HUMAN-POWERED VEHICLES SPORTS

DYNAMICS ISSUE 36 DYNAMICS ISSUE 3646
tricycles). In Italy, the Propulsion Humana – Human-Powered Vehicles Italia Association was established to promote, organize and regulate all activities in the HPV sector. Its members are practitioners, enthusiasts, designers and manufacturers and they represent Italy at the WHPVA (World Human-Powered Vehicle Association).
AERODYNAMICS: THE TRUMP CARD For those cyclists who regularly experience riding bicycles at speeds above 25-30 km/h, aerodynamic drag becomes by far the major factor in their overall balance and overcoming this by using total or partial fairings can provide substantial benefits in terms of speed-power ratio. Furthermore, it is evident that the speed records are all held by amateur cyclists, and such records would not be imaginable on traditional bikes, not even if ridden by the most skilled professionals. Since 2012, thanks to the support of CD-adapco, Team Policumbent has used STAR-CCM+ for the analysis of this fundamental aspect in the design of prototypes. In this article, we present the results of a study conducted by the team in order to design an optimal tail fairing, numerically evaluating the effects on the performance of a previously non-faired prototype.
DESIGN AND CFD ANALYSIS The design of the aerodynamic tail for the prototype recumbent bike, COR-AL13, was addressed by means of an accurate anthropometric measurement of the cyclists representing the team. In this way, it was possible to appropriately scale and position a detailed 3D model of a human mannequin (Figure 1). We were then able to proceed with the definition of a first CAD
draft in Solidworks, made using the loft function from several reference sections and designated longitudinal curves with symmetrical NACA profiles. The CAD geometry for the numerical simulations included the cycle and the cyclist in riding position. On the basis of the results obtained in the previous simulations, three successive versions of the tail were designed with the objective of maximizing effectiveness. In all cases, the fairing design also incorporated part of the frame below the cyclist (Figure 2) and had total lengths of 1,550 mm, 1,700 mm and 1,750 mm respectively, for the three versions compared. The challenge of optimising the HPV aerodynamics is complicated further by the fact that the air arrives on the tail after being perturbed by the front part where the chassis and cyclist are directly exposed. A well shaped tail avoids further increases in drag force caused by the low pressure area behind the cyclist’s head and back (Figures 3a and 3b). It can also help achieve a degree of laminarity, at least in part of the flow, thereby facilitating a pressure recovery that gives rise to a favorable forward push. One limitation of using CFD for cycling is the difficulty of simulating the movement of the legs. Although it is easy
with the appropriate boundary conditions to take account of the rotation of the wheels and possibly the front crown, introducing the motion of the lower limbs in simulation increases the complexity and the computational burden. Therefore, it was decided to ignore this aspect, as is often done with the numerical simulation of traditional racing bikes, reserving a quantification of its specific influence for future wind tunnel and on-road (coast-down) tests.Three different geometries of the tail were analyzed using STAR-CCM+ by placing the model of the HPV with the rider in a rectangular tube similar to a wind tunnel. The computational models were discretized using polyhedral cells and contained approximately 970,000 cells each. Harnessing the parallel processing power of STAR-CCM+, on a workstation equipped with eight 3-GHz processors and 16 GB RAM, the simulation required a total of 3 hours for 1,500 iterations, but convergence of the solution was achieved in approximately one third of the time, with approximately 430 iterations.
COMPARING RESULTS In the comparative analysis of the different
FIGURE 4: Individual parts contributions to the overall drag
FIGURE 3: Flow velocity around the cyclist at various cross sections without tail (a, b) and with tail (c)
Configuration Tail length [mm]
CF Drag [N] Lift [N]
Without tail - - 0.144 19.73 -4.68
Tail 1 1,550 0.117 15.50 -2.70
Tail 2 1,700 0,117 15.47 -2.70
Tail 3 1,750 0,133 16.20 -2.65
TABLE 1: Results comparison without and with different versions of the tail
SPORTS HUMAN-POWERED VEHICLES

DYNAMICS ISSUE 36 DYNAMICS ISSUE 36 47
designs, we focused on certain areas in particular by exploiting the post-processing capabilities of the software for:
• the resistant force parallel to the flow, divided into its two normal and tangential components (and therefore the analysis of the pressures and shear stresses as a whole)
• the force in the direction perpendicular to the flow, to evaluate possible effects of lift or down force
• the analysis of the rear contrail in terms of flow velocity (Figures 3 and 5)
• the analysis of the contribution of each element of the mannequin and the overall resistance of the vehicle, in order to identify further potential improvements (Figure 4)
From the results of the simulations, the second model of the tail (L = 1,700 mm) has emerged as having a greater efficiency in terms of drag and the coefficient of aerodynamic force CF (Table 1). The asymmetry of the iso-speed areas (Figures 3 and 5) suggests that the position of the legs and arms of the cyclist plays an important role as a whole, creating an imbalance in the flow due to different conditions on both sides of the faired tail. It remains to be seen whether these effects are mitigated or amplified in real kinematic conditions with the legs moving. The side view of the velocity profiles in the median plane (Figure 3a) shows possible areas of intervention in the gap between the front wheel and frame and between the frame and handlebars, as has already been realized and directly implemented on the non-faired prototype (opening image). A proper design is also desirable in the area of the interface between the bob and tail, to ensure tangency conditions that minimize disturbances in the airflow. The possibility offered by STAR-CCM+ to quantify the contributions of each individual component on the overall resistance leaves no room for
doubt, even in the case of the analysis without a faired tail. The torso and head of the cyclist represent most of the contribution (Figure 4) and therefore, to break the speed records, the search for a more extreme reclining position is the way forward. Other relevant contributions come from legs and arms: thus short cranks limit the travel of the knees (115 mm in Aurelien Bonneteau’s record breaking bike compared to 170 mm standard) and hands should be held in a clenched position, possibly retracting the elbows to the front of the torso.
CONCLUSIONS AND FUTURE DEVELOPMENTS The CFD analysis has largely confirmed the contribution of a faired tail in terms of improving the aerodynamics of the vehicle-cyclist system in the recumbent field and has helped to refine the design of the aerodynamic appendix. The reduction of drag force obtained with the addition of the tail results in a decrease of about 20% of the power required for a pace of 60 km/h, which is sustainable even for a medium level amateur athlete. Additionally, a decrease (43%) of downforce is noted with the presence of the tail. This is useful for improving the performance of tire rolling in racing, without impairing the safety and drivability of the vehicle. The comparison with simulated conditions has not only allowed us to identify the best geometry among those developed, but has provided useful suggestions and confirms the potential improvements to other areas of the bicycle and possible postures the cyclist must hold in order to reduce resistance. The knowledge acquired during the analysis phase continues to support the growth of the team and the development of the new prototypes mentioned above. The numerical simulations greatly benefit the push to break the existing speed records and the design of velomobiles in support of a new mobility powered by humans.
THE TEAM Policumbent is a student team, based at the Politecnico di Torino, focused on the design, implementation and use of Human-Powered vehicles. The team has been active since 2009, the year in which, as a result of funds awarded by the Student Design Commission of the university and the technical support of some SMEs, it embarked on the design of its first prototype, which was followed by others every year. The team has grown in numbers over the years until it was divided into two groups of ten students each and is currently working on two ambitious projects:1. A streamliner to challenge the world record speed of 133.78 km/h on level terrain (Sebastiaan Bowier, 2013) at the 2014 Human-Powered Speed Challenge of Battle Mountain (the goal of participating in the 2013 edition was postponed for technical and economic reasons) and possibly, in the future, the course record of 91.6 kilometres per hour (Francesco Russo on Eiviestretto at the Lausitzring circuit, Germany).2. A velomobile with assisted pedal for daily mobility in an urban and suburban environment, with the objective of a demonstration tour of more than 1,000 km in Italy at the end of August 2014. The students, who are assigned design, simulation and experimentation tasks, subdivided under the guidance of the authors (Scientific Head: Prof. C. Delprete, Technical Advisor: Engineer P. Baldissera), have the opportunity to devote their theses to a task with practical implications implemented in a collaborative environment, while gaining experience about group dynamics. When working on Human-Powered subjects, they also acquire a greater sensitivity to the issues of new mobility and a better perception of the physical quantities involved, addressing the analysis of power and energy data and speed on a “human” scale.
FIGURE 6: Flow streamlines around the bike/rider colored by velocity magnitudeFIGURE 5: Turbulent Kinetic Energy profile on the bike and the rider with wake behind the vehicle shown, colored by velocity magnitude
HUMAN-POWERED VEHICLES SPORTS

DYNAMICS ISSUE 36 DYNAMICS ISSUE 3648
AEROSPACE UAV DESIGN IN CAPSTONE ENGINEERING COURSE

DYNAMICS ISSUE 36 DYNAMICS ISSUE 36 49
SHAPING THE FUTURE,ONE ENGINEER AT A TIMEMIKE RICHEY The Boeing Company
STEVE GORRELL & JOE BECARBrigham Young University
TITUS SGROCD-adapco
INTRODUCTION: WHAT IS AerosPACE?Perhaps one of the greatest challenges currently facing the aerospace industry is the imminent retirement of a large amount of the workforce. According to a recent workforce study, nearly 50% of employees in large aerospace companies will be eligible for retirement in 2014. The industry, accounting for more than 5% of the United States’ Gross Domestic Product (the market value of all final goods and services in the country) by itself, faces enormous challenges as such a massive “brain drain” depletes the available workforce and saps it of critical experience.
In addition to this, a growing skills gap in high tech manufacturing and a high attrition rate – 45% of young professionals plan on leaving their current employer within five years – present major challenges for employers. The Boeing Company is one example of this looming workforce shortage, its 170,000+ employees averaging over 48 years old. Their attempts to rectify this with new, fresh graduates have been hampered by the lack of multi-disciplinary and interdepartmental courses available at universities.
In a concerted effort to recruit more skilled engineers that have multi-disciplinary training, Boeing has invested millions in STEM programs and recently helped organize the AerosPACE program
(Aerospace Partners for the Advancement of Collaborative Engineering), which is a university-industry partnership for a capstone engineering design course that teaches multi-disciplinary design and collaborative engineering to students.
The AerosPACE organization brings together stakeholders from industry, multiple universities and government to build core competencies and expand industry desired skills for the next generation of aerospace engineers in an environment similar to what engineers would find in actual industry jobs. Its focus is not only to bridge skill gaps, but also to provide a design, build, fly capstone project to unify all the disparate theoretical training engineers have
received in their courses and to learn important soft skills, such as teamwork, effective collaboration and deadline management. The AerosPACE course brought in subject matter experts fromacademia and with industry participation from Boeing senior executives to new recruits to ensure a rigorous course in accordance with high university standards.
The AerosPACE framework has four foundational elements: stakeholder engagement, incorporating learning sciences, advanced manufacturing, and collaborative social networks and learning analytics. These four elements work in unison to provide a holistic approach to close the knowing-doing gap and increase student engagement and participation in
FIGURE 1: AerosPACE framework
UAV DESIGN IN CAPSTONE ENGINEERING COURSE AEROSPACE

DYNAMICS ISSUE 36 DYNAMICS ISSUE 3650
science and technology majors as well as competency development and transition into the STEM workforce (Figure 1).
One unique and promising aspect of AerosPACE is the commitment by Boeing to make coaches available to each team. There is one CAD, CFD and FEA coach per team, giving students the opportunity to ask specific questions and attend lectures and labs. There is also an overall Boeing coach assigned to each team (this is in addition to a faculty coach assigned to each team). Boeing coaches attend weekly team meetings if possible, follow team discussions on CorpU, and are available for questions and mentoring.
While the primary purpose of AerosPACE is to teach students more industry focused skills, it also provides an opportunity to conduct research on the effectiveness of different design team formation techniques (for example ad-hoc vs. hierarchical, based on seniority, vs. “intelligent” formation methods). The desire was to use this information to help create an automated design team formation software tool. Another objective was to investigate personnel profile development methods to learn what the key characteristics are that need to be measured to evaluate someone for a position on a design team and how those characteristics are best measured. Using research methods such as experimentation, observation and evaluation to describe the characteristics and experience of team members, the goal is to predict what qualities would create a good candidate for distance work on a design team.
THE 2013-2014 AerosPACE PROJECTThe 2013-2014 AerosPACE course partners are The Boeing Company,
Brigham Young University, Embry-Riddle Aeronautical University, Georgia Institute of Technology and Purdue University. Teams consisting of students from each university were asked to design, build and test a UAV that can monitor agricultural fields to improve crop yield. The UAV must meet various mission parameters, as indicated in figure 2.
Thirty-six students from the four universities were organized into three teams, who were carefully measured for skill competencies to ensure each team had the required skillsets. Boeing and faculty “coaches” were assigned to the teams. Each team was expected to address technical areas, such as aerodynamics, materials, propulsion, manufacturing, structural analysis (such as the inclusion of spars, ribs, joints, etc.), materials, weight, aircraft control, assembly testing, launch, recovery and reporting.
Students were instructed through lectures and labs recorded on WebEx, covering topics such as Integrated Product and Process Design, constraint sizing and analysis in Excel, Open VSP, MotorCalc, Siemens NX CAD software and CD-adapco’s STAR-CCM+ multi-disciplinary CAE software.
Each of the teams created their own design largely by the end of the first semester (Winter 2013) and presented their preliminary design results to a Boeing Advisory Board. While there is far too much information to include here, a brief summary of the design steps follows.
Teams began with a mission profile to help guide their design, as shown in figure 3. This helped the team to identify feasible design requirements, such as take-off, flight and landing speeds, flight ceiling, rate of climb and turning radius. Using this information, teams created a design space graph to locate their feasible values for
FIGURE 2: Proposed mission profile for UAV to be designed
FIGURE 3: Sample mission profile developed by Team 1 students
FIGURE 4: Design Space Graph developed by Team 1 students to refine design
FIGURE 5: Weight and Center of Gravity Analysis for Team 2’s design
FIGURE 6: Design and construction blueprints of Team 3’s design: Two horizontal spars (in red) to secure and reinforce the main body, and two spars running the length of the wings give their testing model high endurance
AEROSPACE UAV DESIGN IN CAPSTONE ENGINEERING COURSE

DYNAMICS ISSUE 36 DYNAMICS ISSUE 36 51
wing loading and power loading, as shown in figure 4.
Figure 5 shows the weight and center of gravity analysis done by one of the teams. It shows the various parts that must be incorporated into the aircraft, their estimated weight, and the resulting location of the center of gravity. This team’s design is predicted to weigh just under the RFP constraint of 12 lbs. One team plans to use 3D printing to build their entire UAV. Their design (Figure 6) shows the individual pieces to be printed, as well as carbon fiber spars assisted by external fasteners, making it very easy to change out parts that may get damaged.
CFD ANALYSISAll of the teams have refined their design enough to begin running CFD analysis with STAR-CCM+. Preliminary CFD work was done by a graduate teaching assistant with Blended-Wing-Body (BWB) UAV geometries similar to ones the teams were designing. The intent was to anticipate problems the students would face and find solutions that would lead to a high-quality simulation more quickly.
All the teams had CAD geometry generated from OpenVSP for the conceptual design of their UAV. In order to more specifically target problems individual teams might
encounter with their specific geometry, the wing skin geometry from one of the teams was used to build a mesh. The OpenVSP geometry was exported to NX and section cuts were used to form a through-curves mesh of the body since the panel methods of OpenVSP did not yield sufficient surface smoothness. From NX, the solid body of the wing was exported as a parasolid which STAR-CCM+ could read. A spherical flow domain, including only half of the wing to save computational expense, was generated from the geometry. When the simulation lift and drag coefficients were compared with those obtained from wind tunnel tests the team conducted, the results were encouraging. Figure 7 shows the overall mesh at three million cells and figure 8 shows the zoomed-in trailing edge.
Key goals for the grid were a refined leading and trailing edge, a refined wake area, wall y+ values less than one, and slow boundary growth for accurate momentum dissipation. The wing surfaces were split at the leading and trailing edges to create separate boundaries were the surface mesh could be refined. The trimmer mesh model was used to take advantage of the “Trimmer Wake Refinement” option for refining downwind of the UAV (shown in figure 7), which would parametrically change with a change in angle of attack. The prism layer stretching ratio was adjusted until satisfactory wall y+ values were achieved.
The teams were advised on how to improve their meshes, using strategies such as proper fluid domain construction, leading and trailing edge refinement, and wake refinement. All the students were encouraged to attend CD-adapco’s training webinar for Design-Build-Fly competitions.
One of the teams initially encountered issues with their prism layers terminating at the trailing edge, which was fixed with assistance from a support engineer from CD-adapco. The final solution involved using a baffle interface to grow more prism layers from the trailing edge, as shown in figure 8. The velocity contours
and wall y+ values of a simulation are shown in figure 9. However, STAR-CCM+ offers inter-connectivity between NX and STAR-CCM+, and this solved the issue quickly and easily.
TO THE FUTUREAs of this writing, the students had begun the spring semester, with much design work still going on – approximately 75% of the design work of their UAV’s are complete. However, they have already contributed something even greater: The AerosPACE students are not the only ones learning. Boeing has kept a close eye, using surveys and tests of the members of the teams to improve the still infant program as well. Communication has proven to be the most important function: the more communication, the better the teams are able to work together and student satisfaction in the course increases. The AerosPACE team also obtained tremendous feedback on improving the technology and instruction of the course, including file sharing and the lectures, labs, and support for learning advanced tools like Siemens NX and STAR-CCM+.
The skills taught through the course have helped students grow as engineers, and they recognize they are being taught skills that will be of great use to them in the workplace. The partnership between The Boeing Company and participating universities have shown that a cooperative approach to capstone courses can yield great benefit for all parties involved, and the partnership is expected to continue and expand in the coming years.
In addition to the authors, we would like to acknowledge the primary faculty at each institution: Shigeo Hayashibara from Embry-Riddle Aeronautical University, Carl Johnson from Georgia Institute of Technology and John Sullivan from Purdue University. We also acknowledge the Boeing coaches lead by Michael Wright.
FIGURE 7: Trimmer wage refinement of UAV wing
FIGURE 8: Baffle interface at the trailing edge of the wing to correctly apply prism layers on simulation design
FIGURE 9: Wall Y+ and velocity contours of final simulated design
UAV DESIGN IN CAPSTONE ENGINEERING COURSE AEROSPACE

DYNAMICS ISSUE 36 DYNAMICS ISSUE 3652
w
TRAINING
• JAVA™ Scripting - Process Automation• STAR-CCM+ Wizard Creation• Computational Fluid Dynamics (CFD) for the Chemical Industry (Coming Soon)• Vehicle Thermal Management• Effective Heat Transfer• Introduction to Particle Modeling using the Discrete Element Method• Lagrangian Multiphase Flow Modeling• Advanced Engineering Optimization (Coming Soon)• Internal Combustion Engine Analysis• Turbomachinery Engineering (Coming Soon)• Applied Computational Combustion• External Vehicle Aerodynamics (Incompressible) (Coming Soon)
• Aeroacoustics• High Speed Aerodynamics (Coming Soon)• Virtual Building Analysis (including Fire Simulation)• Advanced Meshing• Offshore Computational Engineering• Battery Modeling• SPEED Machine Design• STAR-Cast• Cabin Comfort Analysis (Thermal, Acoustic, HVAC Systems)• Electronics Thermal Management• Computational Analysis of Wind Parks• Wind Turbine Analysis
CHOOSE FROM ONE OF THE FOLLOWING COURSES:
TRAINING COURSESTraining adds incredible value to the software you have purchased and comes highly recommended by all. Courses are regularly held at CD-adapco offices around the world including Detroit, Houston, Seattle, London, Nuremberg, Paris, Turin and others. The courses listed on our website can be scheduled to suit your requirements. To take advantage of this, please request information form your account manager.
Courses are held in small groups and the number of available places can be checked online at:www3.cd-adapco.com/training/multi_day.htmlJust click on the course you are interested in to get an overview on the dates, locations, and availability. If the course is not scheduled in an office near you, then why not take it via distant learning, CD-adapco’s internet-based remote learning service. To find out more or to get a course scheduled to suit your requirements, please contact your account manager.
Specialized Courses:New specialized courses relating to application-specific areas are developed throughout the year. Check for these courses at www3.cd-adapco.com/training.
STAR-Tutor Interactive:STAR-Tutor Interactive offers a broad range of tutorials and elective short courses which are delivered by our highly qualified team via live streaming feed. These virtual classes extend and focus knowledge built up from the introductory STAR-CCM+ class to cover specific engineering analysis areas. For more information, please visit: www3.cd-adapco.com/training/star_tutor.html
Note:In most situations, it will be possible to register trainees on the course of their choice. However, if requests for places are received too close to the course date, this may not be possible. Availability of places can be obtained online or by contacting your local office.
CHECK OUT THIS LINK FOR COURSE AVAILABILITY: www3.cd-adapco.com/training/calendar
TRAINING VENUESDetroit - United StatesHouston - United StatesSeattle - United StatesLondon - United KingdomNuremberg - GermanyParis - FranceTurin - ItalyBangalore - IndiaSão Paulo - BrazilYokohama - JapanOsaka - JapanSeoul - South KoreaShanghai - China
View your local course offerings, customer testimonials and register for an upcoming course at www3.cd-adapco.com/training.To register for a course complete the online registration or request a faxable form from your local support office.
Germany: [email protected]
Italy: [email protected]
Japan: [email protected]
USA: [email protected]
France: [email protected] Brazil: [email protected]
South Korea: [email protected]
(+1) 631 549 2300
(+49) 911 946 433
(+44) 20 7471 6200
(+39) 011 562 2194
(+81) 45 475 3285
(+33) 141 837 560
India: [email protected]
China: [email protected]
(+91) 804 034 1600
(+86) 216 100 0802
(+55) 113 443 6273
(+82) 2 6344 6500
TRAINING TO FIT INTO YOUR SCHEDULE & LOCATION:www3.cd-adapco.com/training