Embed Size (px)
Citation preview
DYNAMIC ANALYSIS OF MULTI-STOREY BUILDING
UDAYA BALA K1*, MANISH KUMAR GUPTA2 AND SENTHIL PANDIAN M3
1P.G. student, School of Mechanical and Building Sciences, VIT University, Chennai, India2Structural Engineer, Manish Consultants, Gurgaon, India
3Assistant professor, School of Mechanical and Building Sciences, VIT University, Chennai, India
(Received 17 June, 2017; accepted 24 November, 2017)
Key words: Response spectrum method, Time history method, Multi-storey building
Jr. of Industrial Pollution Control 33(S3)(2017) pp 1405-1413www.icontrolpollution.comReview Article
*Corresponding authors email: [email protected]
INTRODUCTION
The one of the most sensitive issues that the Structural Engineers face is the selection of proper procedure for estimating the seismic performance of the structure. This is very important when they are dealing with high rise structures as the improper selection of the method ultimately leads to the results which are far away from the correct results. Dynamic analysis is one of the effective procedures for evaluating the seismic performance of the building. The damage control is one of important design considerations which is increasing its influence and can be achieved only by introducing dynamic analysis in the design. The dynamic analysis can be done by soft wares like Etabs, Staad Pro, and SAP. Etabs is one of the leading software which is presently using by many companies and Structural Engineers for their projects. In this paper Etabs is used for the dynamic analysis of the multi-storey building. The methodology followed in Etabs for the analysis is as follows modelling of the multi-storey building, static analysis, designing and dynamic analysis. For the study, the multi-storey building is being designed to resist almost all the lateral forces. The tower-area columns are located in
the grid of 10.4 × 10.4 m having square and rectangle sizes. In basement areas, columns are at 8 × 8 m grid (approx.) and columns with beam-slab system is provided.
LITERATURE REVIEW
Bahador, et al., 2011 has modelled a multi-storey irregular building with 20 storeys using Etabs and deled how the height of the building will affect the structural response of the building which has shear walls and also dynamic responses of building is investigated under actual earthquakes, EL-CENTRO 1949 and CHI-CHI Taiwan 1999. (Mohammed and Gouse, 2015) has taken a 15 storey high building with different shapes like rectangular, L-shape, H-shape, C-shape for comparison and dynamic analysis has been done to evaluate the deformation of the structure. (Dubey, et al., 2015) has modelled multi-story irregular buildings with 20 stories and has been investigated dynamic responses of the building under actual earthquake, DELINA (ALASKA) 2002 to compare time history and response spectrum methods. (Mohit and Savita, 2014) has taken a problem on G+30 storied regular building for static
ABSTRACT
In this paper, for the dynamic analysis, a plan of a multi-storey building is taken and it has been modelled with different structural elements for minimum story displacement. The dynamic analysis of multi-storey buildings is done using Etabs 2015 by IS and SP codal provisions (ETABS User’s Manual, 2015). The multi-storey building is R.C.C. structure with 3 basements + ground floor + 14 upper floors in zone IV with a maximum earth fill of 750 mm on the ground floor for landscape requirements. By comparing the results of dynamic analysis, the performance of the structural system can be evaluated.

1406 BALA ET AL.
and dynamic analysis as per the IS-1893- 2002-Part-1 for the zones- 2, 3 and summarized the post processing results. (Yousuf and Shimpale, 2013) has taken four models of G+5 building with one symmetric plan and remaining irregular plan for dynamic analysis with plan irregularities to minimize the damage to the structure and its structural components during an earthquake. (Ni and Kyaw, 2014) has taken a 12 storied building for comparative study of static, dynamic analysis under load consideration of Uniformed Building Code (UBC-1997) and compared displacement, storey shear, storey moment and storey drift. (Arvindreddy and Fernandes, 2015) has taken a 15 storey regular, irregular building for static, dynamic analysis and shown the behaviour of irregular structure in comparison with regular structure.
DATA TO BE USEDA. Initialization of grid system
As mentioned, the study is on multi-storey building, the grid system is initialized for the building with the dimensions as per the plan with 3 basements + ground floor + 14 upper floors. The irregular multi-storey building modelled is for office purpose Table 1 and (Fig. 1-3).
By taking the plan of multi-storey building, four building models are modelled with different structural elements which are as follows:
1) Building with flat slabs
2) Building with floor slabs
3) Building with flat slabs & shear walls
4) Building with floor slabs & shear walls.
B. Material properties
As the structure is the reinforced concrete one, the materials are concrete and steel.
• Density of reinforced concrete shall be 25 kN/m3.
• The min. Grade of Concrete in all RCC structural members shall be as follows:
RCC columns, shear walls
• From foundation to ground floor: M55
• From ground floor to third floor: M45
• From third Floor to sixth floor : M40
Plan Height (m)Total height of the building
(From plinth To terrace) 61.5
Basement- 3 3.6Basement- 2 3.6Basement- 1 5.2Ground floor 4.8Typical floors 4.05 on each
Table 1. Data to be used
Fig. 1 Basement plan.
Fig. 2 Ground floor plan.
Fig. 3 Typical floor plan.
1407
TEMPERATURE TREND ANALYSIS USING NONPARAMETRIC TEST: A CASE STUDY OF COIMBATORE CITY
• Above sixth floor : M35
RCC beams at basements: M25
RCC beams at ground floor-tower area: M25
RCC Beams at ground floor- Non-tower area: M35
RCC slabs at basements and ground floor: M25
• Flat slab with drops: M35
RCC beams and slabs at typical floors (Superstructure): M35
• High yield strength deformed bars Fe 500 conforming to IS 1786:2008 with Fy= 500 N/mm2 is used.
C. Section properties
The sections required for the building are frame sections and slab sections. As the building is of multi-storey one, the sections have to be meeting the requirements of loads. The frame sections are beams and columns. A set of dimensions are taken for beams and columns.
The beam dimensions are as follows,
230 × 750 mm
300 × 525 mm
300 × 600 mm
300 × 1350 mm
300 × 1850 mm
350 × 600 mm
450 × 600 mm
450 × 1850 mm
600 × 600 mm
600 × 750 mm
600 × 1850 mm
700 × 675 mm
750 × 750 mm
The column dimensions are as follows,
300 × 525 mm
300 × 600 mm
450 × 900 mm
600 × 600 mm
600 × 1050 mm
750 × 750 mm
750 × 900 mm
750 × 1050 mm
900 × 900 mm
900 × 1050 mm
900 × 1200 mm
1050 × 1050 mm
1050 × 1200 mm
1200 × 1200 mm
1200 × 1350 mm
1250 × 1400 mm
1400 × 1250 mm
1400 × 1400 mm
The typical flat slab sections used is of thickness 250 mm with a drop of 150 mm and typical floor slab sections used is of thickness 150 mm. The shear walls used are of thickness 300 mm, 350 mm, 400 mm, 450 mm and 900 mm.
D. Modelling of frame and slab elements
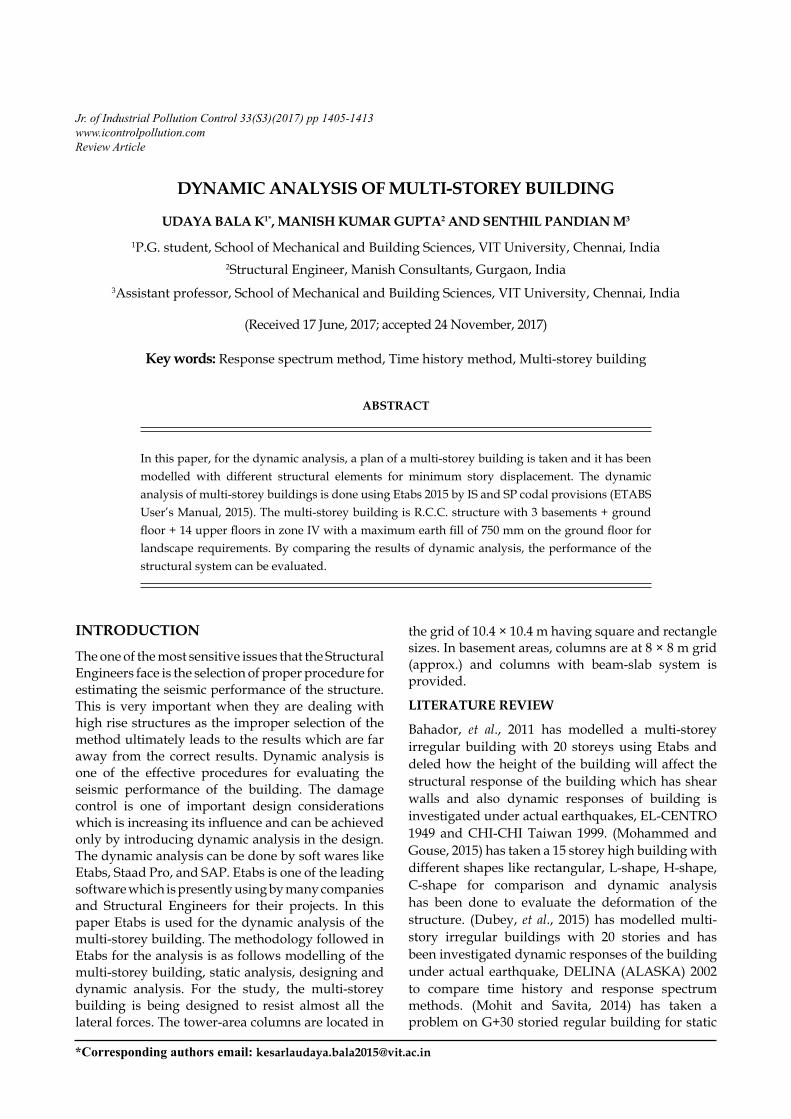
The modelling of frame and slab elements is done with the dimensions as mentioned above in the section properties. The floor slabs are modelled as membrane elements and flat slabs are modelled as thin-shell elements (Fig. 4-7).
E. Loading parameters
Self weights of materials
• Density of reinforced concrete- 25.0 kN/m3
• Density of structural steel- 78.5 kN/m3
• Density of plain concrete- 24.0 kN/m3
Fig. 4 Building with flat slabs.

1408 BALA ET AL.
• Density of floor finishes/plasters- 20.0 kN/m3
• Density of soil (Saturated) - 20.0 kN/m3
Imposed (live) loads
• Typical Floor- 4.0 kN/m2
• 1st basement floor- Stack parking- 7.5 kN/m2
• Ground Floor-Fire tender access region- 12.0 kN/m2
• All basement floors- 5.0 kN/m2
• Terrace- 5.0 kN/m2
Dead loads
• Self-weight of slab (Typical flat slab=0.250 × 25) - 6.25 kN/m2
• Self-weight of slab (Typical 250+150 thick drop near columns= 0.400 × 25) - 10 kN/m2
• Self-weight of typical floor slab (0.150 × 25) - 3.75 kN/m2
• Self-weight of slab (1st and 2nd basement floor) (=0.15 × 25) - 3.75 kN/m2
• Self-weight of Slab (Ground Floor) (=0.200 × 25) - 5.00 kN/m2
• Floor Finish (1st and 2nd basement floor) (Including services) (=2 kN/m2 + 0.5 kN/m2 for services) - 2.50 kN/m2
• Floor finish on ground and typical floor- 2.0 kN/m2
• False ceiling and services on ground and typical floor- 0.25 kN/m2
• Partition wall on ground & typical floor- 1.0 kN/m2
• Floor finish on terrace
• Brick Bat Coba (avg. 175 mm thick) - 3.50 kN/m2
• Flooring + Insulation- 1.50 kN/m2
• False Ceiling- 0.25 kN/m2
• Suspended services below slab- 0.25 kN/m2
• Concrete pedestals for placing and erecting services on top of slab- 3.75 kN/m2
• Facade Load on periphery- 5.0 kN/m
Fig. 5 Building with floor slabs.
Fig. 6 Building with flat slabs and shear walls.
Fig. 7 Building with floor slabs and shear walls.
1409
TEMPERATURE TREND ANALYSIS USING NONPARAMETRIC TEST: A CASE STUDY OF COIMBATORE CITY
Self-weight of different walls
Dynamic analysis of multi-storey building:
200 mm thick block wall of (4.05 m - 0.6 m) height = (4.05-0.6) × (0.200 × 8 + 0.040)
• 20) = 8.28 kN/m
Dynamic analysis of multi-storey building:
100 mm thick block wall of (4.05 m - 0.6 m) height = (4.05-0.6) × (0.100 × 8 + 0.040)
• 20) = 5.52 kN/m
Dynamic analysis of multi-storey building:
150 mm thick Parapet wall of 1m height on terrace = 1 × (0.150 × 8 + 0.040)
• 20) = 2.0 kN/m
ANALYSISA. Response spectrum analysis
Under earthquake ground motions, it’s a maximum response representation of idealized single degree freedom system which is having certain period and damping. The terms maximum relative displacement, maximum absolute acceleration or maxmimum relative velocity are expressed for various damping values by plotting maximum response against undamped natural frequency. For this purpose, according to (IS 1893(Part 1):2002, 2002), response spectrum analysis case is performed (IS: 875 (Part 1), 1987; IS: 875 (Part 2), 1987; IS: 456-2000, 2000).
B. Time history analysis
When structure’s base is subjected to a specific time history ground motion, the dynamic response analysis of it, at each time increment is called ‘time history analysis’. From past natural events alternatively recorded ground motions database is time histories reliable source but all seismological characterstics for the site suitability aren’t recorded in any given site. In time history generation, the three main parameters are recorded ground motions from analogous magnitude, distance and soil condition category(bin). To make site characterstics more definite and similar, we have to add more constraints to characterstics of the bin. But in the bin, there may be serious avilability limit for real records. The target response spectrum will be determined from seismic hazard analysis which can be different from response spectrum of selected ground motions around fundamental period of the structure. To comply mean spectral accelerations with target spectrum records are scaled by single factor scales. Simply with a single factor scaling of the record,
close agreement will not be achieved between the response spectrum of the record and target (SP-16-1980; IS: 13920, 1993).
METHODOLOGYThe multi-storey building is modelled with 14 stories, 2 basements and dynamic analysis has been done by response spectrum and time history analysis.
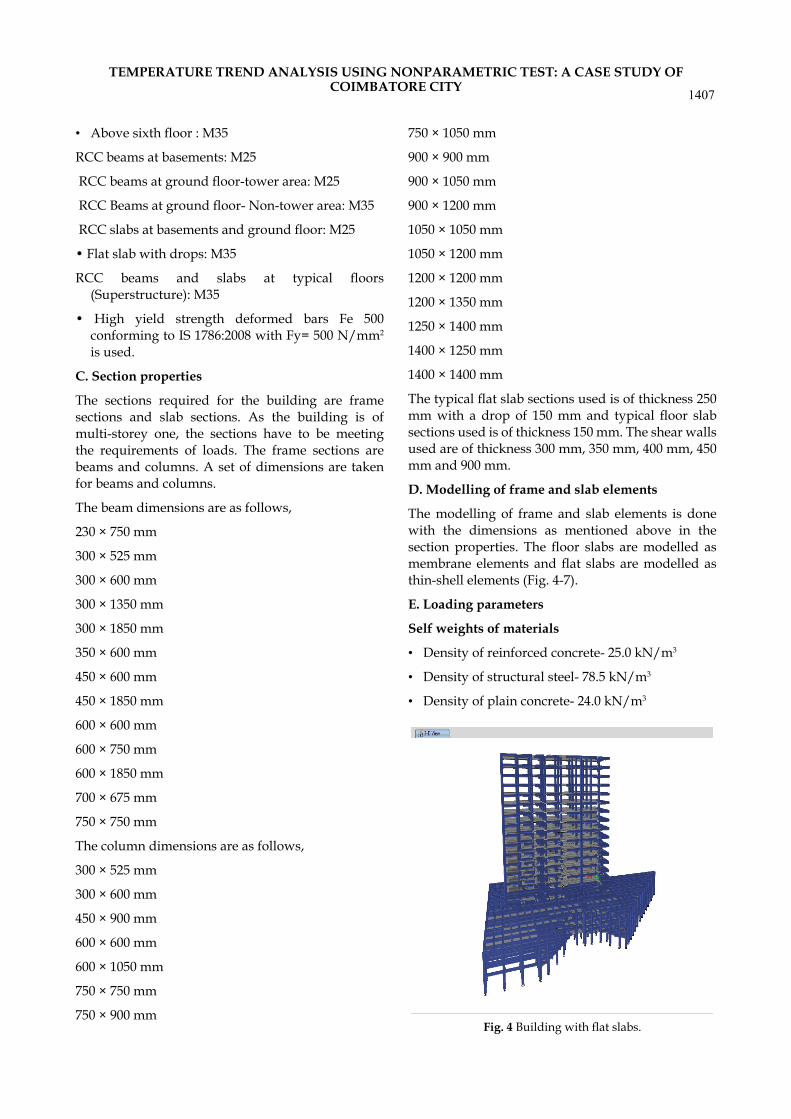
RESULTS AND DISCUSSIONThe maximum storey displacement of the buildings in different stories in both X and Y direction for response spectrum analysis is shown in (Fig. 8 and 9). The maximum storey drift of the buildings
Fig. 8 Max. storey displacement in X-direction.
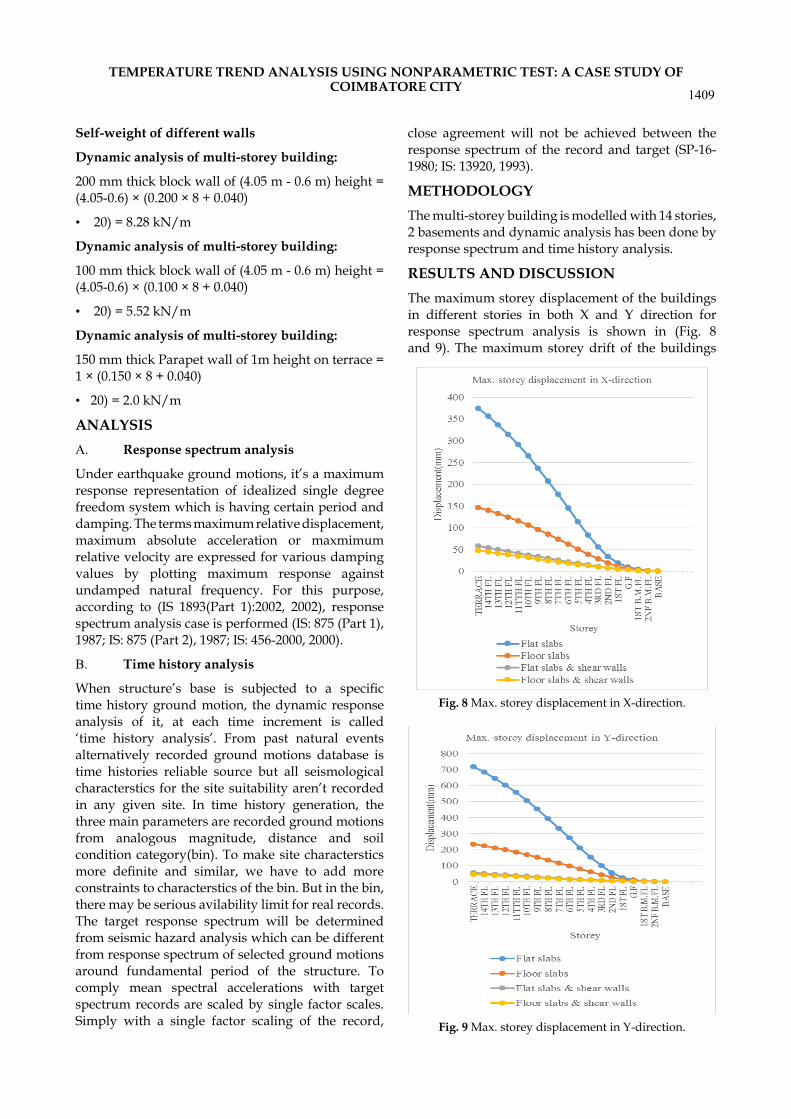
Fig. 9 Max. storey displacement in Y-direction.
1410 BALA ET AL.
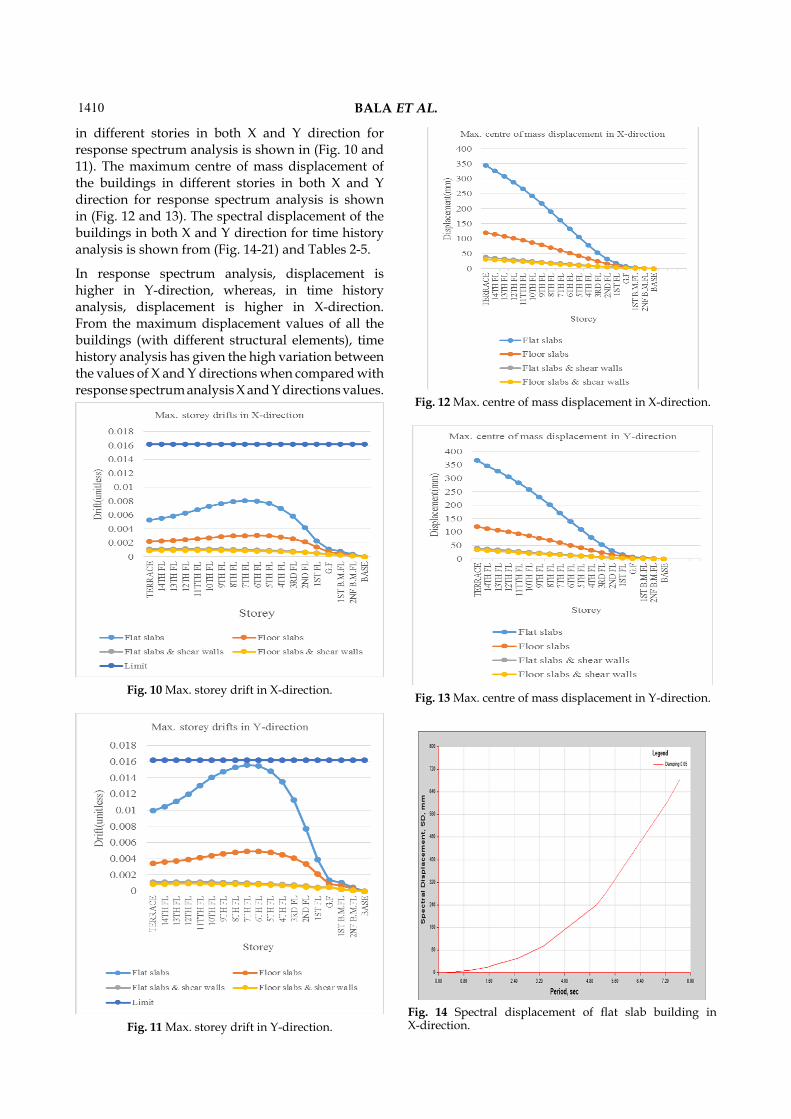
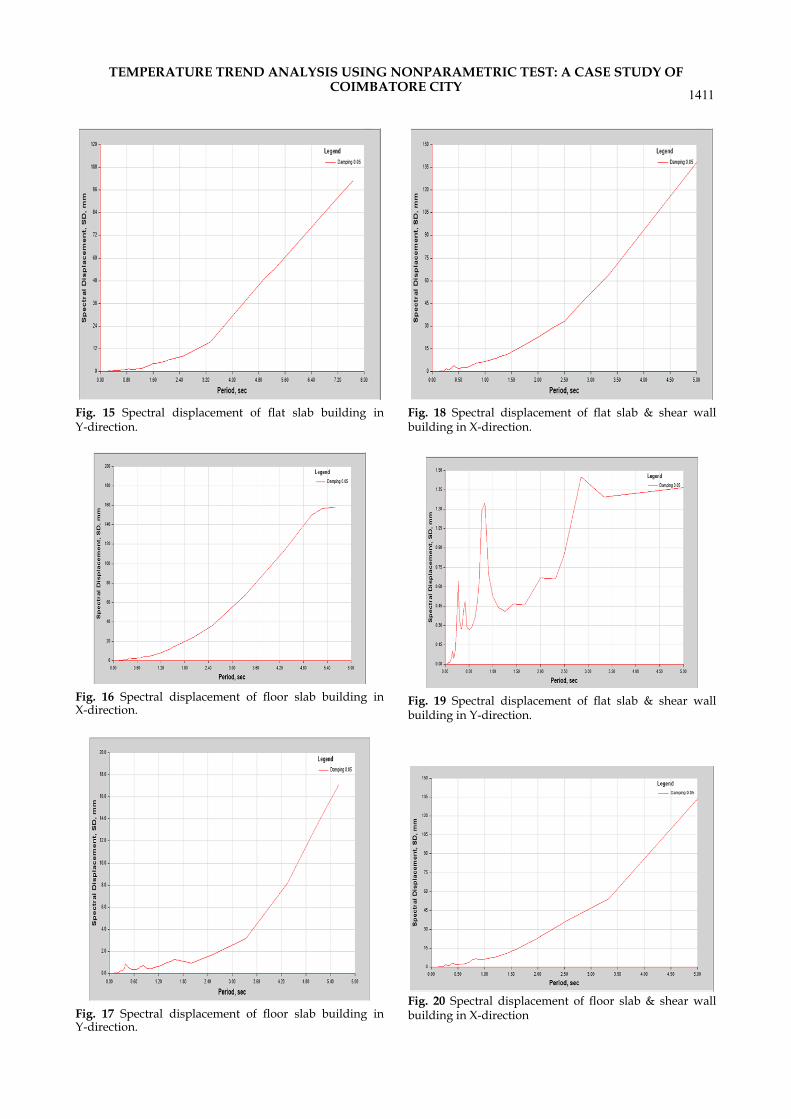
in different stories in both X and Y direction for response spectrum analysis is shown in (Fig. 10 and 11). The maximum centre of mass displacement of the buildings in different stories in both X and Y direction for response spectrum analysis is shown in (Fig. 12 and 13). The spectral displacement of the buildings in both X and Y direction for time history analysis is shown from (Fig. 14-21) and Tables 2-5.
In response spectrum analysis, displacement is higher in Y-direction, whereas, in time history analysis, displacement is higher in X-direction. From the maximum displacement values of all the buildings (with different structural elements), time history analysis has given the high variation between the values of X and Y directions when compared with response spectrum analysis X and Y directions values.
Fig. 10 Max. storey drift in X-direction.
Fig. 11 Max. storey drift in Y-direction.
Fig. 12 Max. centre of mass displacement in X-direction.
Fig. 13 Max. centre of mass displacement in Y-direction.
Fig. 14 Spectral displacement of flat slab building in X-direction.
1411
TEMPERATURE TREND ANALYSIS USING NONPARAMETRIC TEST: A CASE STUDY OF COIMBATORE CITY
Fig. 15 Spectral displacement of flat slab building in Y-direction.
Fig. 18 Spectral displacement of flat slab & shear wall building in X-direction.
Fig. 16 Spectral displacement of floor slab building in X-direction.
Fig. 17 Spectral displacement of floor slab building in Y-direction.
Fig. 19 Spectral displacement of flat slab & shear wall building in Y-direction.
Fig. 20 Spectral displacement of floor slab & shear wall building in X-direction
1412 BALA ET AL.
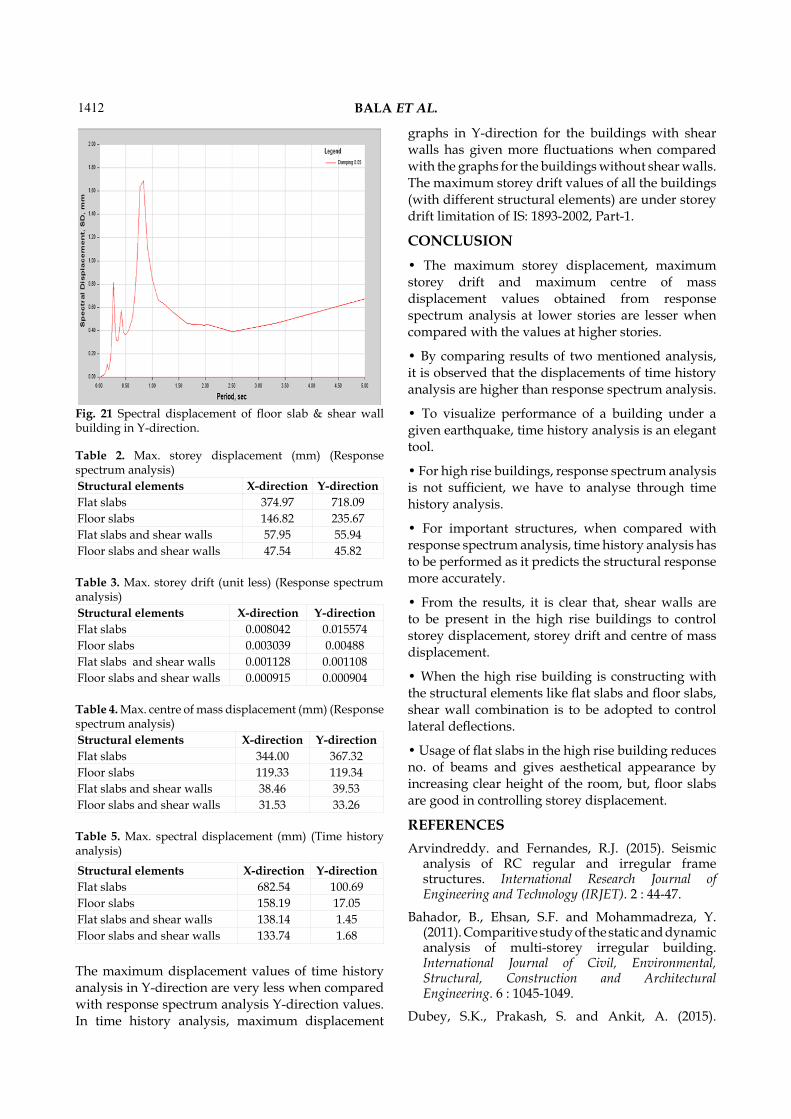
Fig. 21 Spectral displacement of floor slab & shear wall building in Y-direction.
Structural elements X-direction Y-directionFlat slabs 374.97 718.09Floor slabs 146.82 235.67Flat slabs and shear walls 57.95 55.94Floor slabs and shear walls 47.54 45.82
Table 2. Max. storey displacement (mm) (Response spectrum analysis)
Structural elements X-direction Y-directionFlat slabs 0.008042 0.015574Floor slabs 0.003039 0.00488Flat slabs and shear walls 0.001128 0.001108Floor slabs and shear walls 0.000915 0.000904
Table 3. Max. storey drift (unit less) (Response spectrum analysis)
Structural elements X-direction Y-directionFlat slabs 344.00 367.32Floor slabs 119.33 119.34Flat slabs and shear walls 38.46 39.53Floor slabs and shear walls 31.53 33.26
Table 4. Max. centre of mass displacement (mm) (Response spectrum analysis)
Structural elements X-direction Y-directionFlat slabs 682.54 100.69Floor slabs 158.19 17.05Flat slabs and shear walls 138.14 1.45Floor slabs and shear walls 133.74 1.68
Table 5. Max. spectral displacement (mm) (Time history analysis)
The maximum displacement values of time history analysis in Y-direction are very less when compared with response spectrum analysis Y-direction values. In time history analysis, maximum displacement
graphs in Y-direction for the buildings with shear walls has given more fluctuations when compared with the graphs for the buildings without shear walls. The maximum storey drift values of all the buildings (with different structural elements) are under storey drift limitation of IS: 1893-2002, Part-1.
CONCLUSION• The maximum storey displacement, maximum storey drift and maximum centre of mass displacement values obtained from response spectrum analysis at lower stories are lesser when compared with the values at higher stories.
• By comparing results of two mentioned analysis, it is observed that the displacements of time history analysis are higher than response spectrum analysis.
• To visualize performance of a building under a given earthquake, time history analysis is an elegant tool.
• For high rise buildings, response spectrum analysis is not sufficient, we have to analyse through time history analysis.
• For important structures, when compared with response spectrum analysis, time history analysis has to be performed as it predicts the structural response more accurately.
• From the results, it is clear that, shear walls are to be present in the high rise buildings to control storey displacement, storey drift and centre of mass displacement.
• When the high rise building is constructing with the structural elements like flat slabs and floor slabs, shear wall combination is to be adopted to control lateral deflections.
• Usage of flat slabs in the high rise building reduces no. of beams and gives aesthetical appearance by increasing clear height of the room, but, floor slabs are good in controlling storey displacement.
REFERENCESArvindreddy. and Fernandes, R.J. (2015). Seismic
analysis of RC regular and irregular frame structures. International Research Journal of Engineering and Technology (IRJET). 2 : 44-47.
Bahador, B., Ehsan, S.F. and Mohammadreza, Y. (2011). Comparitive study of the static and dynamic analysis of multi-storey irregular building. International Journal of Civil, Environmental, Structural, Construction and Architectural Engineering. 6 : 1045-1049.
Dubey, S.K., Prakash, S. and Ankit, A. (2015).
1413
TEMPERATURE TREND ANALYSIS USING NONPARAMETRIC TEST: A CASE STUDY OF COIMBATORE CITY
Dynamics analysis of structures subjected to earthquake load. International Journal of Advance Engineering and Research Development. 2 : 1-9.
ETABS User’s Manual. (2015). Integrated Building Design Software. Computer and Structures Inc. Berkeley, USA.
IS 1893(Part1):2002. (2002). Criteria for earthquake resistant design of structures, Part 1 General provisions and buildings, Bureau of Indian Standard.
IS: 13920. (1993). Ductile detailing of reinforced structures subjected to seismic force. code of practice Bureau of Indian Standards, New Delhi.
IS: 456-2000. (2000). Indian standard of code and practice for plain and reinforced concrete" Bureau of Indian Standards, New Delhi.
IS: 875 (Part 1). (1987). Code of practice for design loads (other than earthquake) for buildings and structures, dead loads, Bureau of Indian Standards, New Delhi.
IS: 875 (Part 2). (1987). Code of practice for design loads (other than earthquake) for buildings and
structures, live loads, Bureau of Indian Standards, New Delhi.
Mohammed, R.S. and Gouse, D.P. (2015). Dynamic analysis of multi-story building for different shapes. International Journal of Innovative Research in Advanced Engineering (IJIRAE). 2 : 85-91.
Mohit, S. and Savita, M. (2014). Dynamic analysis of multi-storied regular building. IOSR Journal of Mechanical and Civil Engineering (IOSR-JMCE). 11 : 37-42.
Ni, W. and Kyaw, L.H. (2014). Comparative study of static and dynamic analysis of irregular reinforced concrete building due to earthquake. International Journal of Scientific Engineering and Technology Research. 3 : 1205-1209.
SP-16-1980. Design Aids for Reinforced concrete to IS-456-1978-Bureau of Indian Standards, New Delhi.
Yousuf, M. and Shimpale, P.M. (2013). Dynamic analysis of reinforced concrete building with plan irregularities. International Journal of Emerging Technology and Advanced Engineering. 3 : 110-116.