Embed Size (px)
Citation preview

Durham E-Theses
Amyloidogenesis of a Type III-dependent Hpa1 and
Structural analysis of a drug-pump repressor DNA
complex
ZHANG, BING
How to cite:
ZHANG, BING (2010) Amyloidogenesis of a Type III-dependent Hpa1 and Structural analysis of a
drug-pump repressor DNA complex, Durham theses, Durham University. Available at Durham E-ThesesOnline: http://etheses.dur.ac.uk/260/
Use policy
The full-text may be used and/or reproduced, and given to third parties in any format or medium, without prior permission orcharge, for personal research or study, educational, or not-for-pro�t purposes provided that:
• a full bibliographic reference is made to the original source
• a link is made to the metadata record in Durham E-Theses
• the full-text is not changed in any way
The full-text must not be sold in any format or medium without the formal permission of the copyright holders.
Please consult the full Durham E-Theses policy for further details.

Academic Support O�ce, Durham University, University O�ce, Old Elvet, Durham DH1 3HPe-mail: [email protected] Tel: +44 0191 334 6107
http://etheses.dur.ac.uk
2

Amyloidogenesis of a Type III-dependent Hpa1 and
Structural analysis of a drug-pump repressor DNA complex
By
Bing Zhang B.Sc. (Hons)
A thesis submitted for the degree of Doctor of Philosophy
In
The School of Biological and Biomedical Sciences
University of Durham
May 2010

2
Declaration
I declare that the work presented herein is my own, except where stated by citation or
statement, and has not been submitted for another degree in this or any other
university.
The copyright of this thesis rests with the author. No quotation or information
derived from it may be published in any format without the prior written consent of
the author. All consented information derived from this thesis must be acknowledged.
Bing Zhang 5th
May 2010

3
Acknowledgements
I would like to give my greatest thanks to Prof. Adrian R. Walmsley for his
supervision, constant support and encouragement throughout this project and for the
proof reading of this thesis; to Dr. M. Ines Borges-Walmsley for her discussion and
guidance of VceR project; to Dr. Ehmke Pohl for his help and guidance in
crystallization, structure analysis, crystal tests and data collection at SLS and DLS; to
Dr. Santina Russo for her crystal tests and data collection at SLS, and preliminary
data processing of the native data set; to Dr. Li Zhang for her discussion on
crystallization methods and encouragement; to Dr. Hong Tin Lin for sharing of
methods in liposome preparation; to Dr. Paul Yeo for the sharing of methods in
sucrose gradient centrifugation; and to all my colleagues, Dr. Daliang Chen,
Dr.Dijun Du, Mr. Jongwu Yang, Dr. Teresa Massam-Wu, Dr. Victoria Money and
Dr. Thamarai Janganan, for their help in my Ph D study.
I would like to thank Prof. Rick Lewis at the University of Newcastle upon Tyne for
his help in crystal tests at his lab and at the ESRF synchrotron source; to Prof.
Gongyou Chen at the School of Agriculture and Biology, Shanghai Jiao Tong
University, Shanghai, China, for his discussion of the Hpa1 project, encouragement
from the beginning to the end of my Ph D study and for one year financial supporting
for my experiments; to Dr. Baishi Hu in the Plant Pathology Department, Nanjing
Agricultural University, Nanjing, China, for his encouragement.
This work would not be finished without a Wolfson Research Institute studentship
and one year Welcome Trust studentship (awarded to Prof. Adrian R. Walmsley) that
assisted me to undertake this project.
Further thanks to Diane Hart, Simon Padbury and Ian Edwards for their
indispensable technical assistance.
Finally, I express my sincere thanks to all my family and friends in China.

4
Abbreviations
ABA Abscisic acid
ABC ATP binding cassette transporter
Avr Avirulent
Aβ Alzheimer‘s β-amyloid
Be Berberine
CCCP Carbonyl cyanide m-chlorophenyl-hydrazone
CD Circular dichroism
CR Congo red
CV crystal violet
DDM n-dodecyl-β-D maltoside
Dq dequalinium
DLS Diamond Light Source
DME drug/metabolite efflux
DSP eithiobis (succinimidyl propionate)
DTT eithiothreitol
Et ethidium
EGS ethylglycol bis (succinimidyl succinate)
EPEC enteropathogenic Escherichia coli
EM electron micrograph
FAO Food and Agriculture Organizationn
HR hypersensitive response
HTH helix-turn-helix
IAPP islet amyloid polypeptide
IMP inner-membrane protein
IR inverted repeat
MAD multiple-wavelength anomalous dispersion
MATE multidrug and toxic compound extrusion family
MDR multi-drug resistant
MF major facilitator superfamily
MFP membrane fusion protein
MG malachite green

5
MIR multiple isomorphous replacement
MIRAS multiple isomorphous replacement with anomalous scattering
MR molecular replacement
OMP outer-membrane protein
PCR polymerase chain reaction
R6G rhodamine 6G
RND resistance nodulation division family
R protein resistence protein
RT room temperature
SA salicylic acid
SAD single-wavelength anomalous dispersion
SDS-PAGE sodium dodecyl sulfate polyacrylamide gel electrophoresis
SEC size-exclusion chromatography
SIR single isomorphous replacement
SIRAS single isomorphous replacement with anomalous scattering
SLS Swiss Light Source
SMR small multidrug resistance
Tc tetracycline
TEM transmission electron microscopy
THP Tris hydroxypropyl phosphine
Tip transcription inducing peptide
TTSS type III secretion system
Xoo Xanthomonas oryzae pv. oryzae
Xoc Xanthomonas oryzae pv. oryzicola

6
Abstract
Part I Amyloidogenesis of Type III-dependent Hpa1 from Xanthomonas oryzae
pv. oryzicola
The first harpin, HrpN from Erwinia amylovora, the bacterium that causes fire blight
of pear, apple and other rosaceous plants, was reported as an HR (hypersensitive
response) elicitor in 1992. Similar harpins were found in Pseudomonas syringae,
Ralstonia solanacearum, Xanthomonas campestris, X. axopnpodis and X. oryzae, and
secreted through a Type III secretion system (TTSS), which is utilized by bacterial
pathogens to invade the host. The wide presence and secretion pathway of harpins in
plant pathogens indicate the important function of harpins in plant pathogenicity.
Herein, I report that Hpa1, the harpin of X. oryzae pv. oryzicola, assembles into
fibrils at acidic pHs. As determined by analytical gel filtration chromatography,
purified Hpa1 is a decamer. Hpa1 has two predicted helical domains, located
towards its N- and C-terminus, respectively. The C-terminal helix domain is
responsible for the fibril assembly, since the synthesized polypeptide
(ASPLTQMLMNIVGEILQAQ), corresponding to the C-terminal helix domain of
Hpa1, could form fibrils. The mature fibrils of this peptide consist of three strands of
protofibrils. We propose that the fibril formation by full length Hpa1 involves a
conformational transition from -helix to β-sheet structure, which exposes the C-
terminal helix domain for fibril assembly. In contrast to the assembly of fibrils by
full length Hpa1 at acidic pH, that of synthesized polypeptide
(ASPLTQMLMNIVGEILQAQ) is at acidic and basic pH, which may be an inherent
characteristic of the sequence component. Interestingly, the N-terminal helix
domain (ISEKQLDQLLCQLIQALL) of Hpa1 inhibits the assembly of fibrils by the
C-terminal domain polypeptide, suggesting that the intramolecular interaction of
Hpa1 between the two helix domains keeps Hpa1 in a non-fibrillar state.
In addition, the fibrils formed by full length Hpa1, the N-terminal truncated Hpa1
(55-138) and synthesized polypeptide (ASPLTQMLMNIVGEILQAQ) disrupted the

7
membrane of liposomes prepared from extracted lipids from E. coli, which suggests
a new function for Hpa1- targeting and damaging the cell membrane.
Part II Crystallization and structure analysis of the Vibrio cholerae VceR drug-
pump repressor with bound DNA
The VceR protein, from Vibrio cholerae, which is encoded by the vceR gene,
represses transcription of the vceCAB operon, which encodes a multidrug efflux
pump in this microorganism. This type of pump, composed of a tripartite protein
complex that spans the inner and outer membranes, resembles type I secretion
systems. VceR, which is a member of the TetR family of transcriptional repressors,
binds specifically to a 28 bp inverted repeat (IR) located in the 107 bp vceR-vceCAB
intergenic region.
In order to completely understand the structural basis and functional mechanism by
which VceR binds DNA, we performed crystallization trials on the VceR/DNA
complex, with the aim of determining its crystal structure. A number of oligos were
screened, including 30 bp, 28 bp, 27 bp, 26 bp and 24 bp duplex, depending on the
published operator sequence bound by VceR, to obtain X-ray quality VceR/DNA
complex crystals for structure analysis. These crystals have space group I 4122, with
a=b=90.2 Å, c=298.1 Å, α=β=γ=90°.
To retrieve phase information, Se-Met substituted VceR and Br labelled DNA
oligonucleotides were prepared and crystallized with unlabelled DNA and native
VceR, respectively. Several three-wavelength MAD data sets from these crystals
were collected and analyzed. A merged Se-Met data set, obtained from 2 data sets of
three wavelengths and one peak data set, yielded the correct positions of 12 Se by
ShelxD. Sharp/Autosharp was used to refine these 12 Se positions and for calculating
phases. A preliminary electron density map shows, after solvent flattening, clear
helical characteristics in the VceR dimer and a partial DNA backbone. A model with
one VceR dimer and an 11 base pair duplex was built in the preliminary electron
density map.

8
Contents
Declaration
Acknowledgements
Abbreviations
Abstract
Chapter 1 Introduction
Part I TTSS and harpin 15
1.1 Type III secretion system 15
1.2 TTSSs and bacterial flagella 15
1.3 Component of TTSS 17
1.4 TTSS of Xanthomonas oryzae 18
1.4.1 Xanthomonas oryzae 18
1.4.2 TTSS of Xanthomonas oryzae pv. oryzicola 18
1.4.3 TTSS effectors of Xoo and Xoc 20
1.5 Harpins 22
1.5.1 Harpins and HR 22
1.5.2 Harpin‘s beneficial function on plants 22
1.5.3 Harpin binding sites in plant 24
1.5.4 Harpin-like proteins 25
1.5.5 Harpin forming fibrils 26
1.6 Amyloid fibrils 27
1.6.1 Common structure of amyloid fibrils 28

9
1.6.1.1 Structure models of Aβ1-40 fibrils and amylin 29
1.6.1.2 Atomic structure of fibril forming segments 30
1.6.2 Mechanisms of amyloid fibril formation 32
1.6.3 Pathogenicity of amyloid fibrils 32
1.7 Hpa1 33
Part II Regulators of MDR transporter 35
1.8 Multi-drug resistance (MDR) 35
1.9 Transcriptional regulation of multidrug transport systems 36
1.10 TetR family of transcriptional repressors 37
1.10.1 TetR 38
1.10.1.1 TetR and [Mg-Tc]+ complex structure 38
1.10.1.2 TetR and its bound DNA 41
1.10.1.3 The induction mechanism of TetR 43
1.10.1.4 TetR peptide inducer 44
1.10.2 QacR 46
1.10.2.1 DNA binding mechanism of QacR 46
1.10.2.2 Drug binding sites of QacR 48
1.10.3 AcrR 50
1.10.4 CmeR 51
1.10.5 SmeT 53
1.10.6 EthR 54
1.10.7 MtrR 55
1.10.8 VceR 55
Chapter 2 Material and Method

10
2.1 Computational methods 58
2.2 Media, antibiotics and reagents 58
2.2.1 Bacterial medium 58
2.2.2 Antibiotics 59
2.2.3 Reagents 60
2.3 Bacterial strains and plasmids 60
2.4 Cloning genes to pGEM-T easy vector 61
2.4.1 DNA amplification by PCR (Polymerase chain reaction) 61
2.4.2 Gel electrophoresis 62
2.4.3 Gel extraction of DNA 63
2.4.4 Ligation into pGEM-T easy vector (Promega) 63
2.4.5 Preparation of chemically competent E. coli 64
2.4.6 E. coli strain NovaBlue transformation 64
2.4.7 Purification of plasmid DNA [pGEM-T-easy-gene] 65
2.5 Subcloning of desired genes into pET21a(+) for protein expression 65
2.5.1 Restriction enzymes digestion of pGEM-T-easy-gene and pET21a(+) 65
2.5.2 Identification and purification of DNA and linear pET21a(+) 66
2.5.3 Ligation of pET21a(+) and desired DNA 66
2.5.4 E. coli strain NovaBlue transformation with pET21a(+)-gene 66
2.5.5 Analysis of putative pET21a(+)-gene colonies by PCR 67
2.6 Site directed mutagenesis 67
2.7 Protein expression, purification and visualization 68
2.7.1 Expression of cloned genes in E. coli BL21 (DE3) 68
2.7.2 Purification of His6-tagged proteins by Ni-NTA affinity chromatography 69

11
2.7.3 Purification of recombinant proteins by gel filtration chromatography 69
2.7.4 Ion-exchange chromatography 70
2.7.5 SDS-PAGE 70
2.7.6 Western blotting 71
2.7.7 Protein dialysis 72
2.7.8 Protein concentrating 72
2.7.9 Protein concentration determination 73
2.8 Analytical gel filtration chromatography 73
2.9 Peptide synthesis 74
2.10 Transmission electron microscopy 74
2.11 Circular dichroism spectroscopy 74
2.12 Congo red (CR) binding and chemical cross-linking 74
2.13 Liposome disruption assay 75
2.14 Protein crystallization 75
2.14.1 Selenomethionine protein over-expression and purification for phasing 77
2.14.2 Oligonucleotides for VceR co-crystallization 78
2.14.3 Data collection 79
2.14.4 Data processing 80
2.14.5 Structure solution 81
Chapter 3 Amyloid fibril formation of Hpa1 from
Xanthomonas oryzae pv. oryzicola
3.1 Cloning, overexpression and purification of Hpa1 82

12
3.1.1 Cloning of hpa1 into pET21a expression vector 82
3.1.2 Over-expression of Hpa1-His6 83
3.1.3 Purification of soluble and membrane faction Hpa1-His6 83
3. 2 Analytical size exclusion chromatography of soluble Hpa1-His6 87
3.3 Overexpression and purification of Hpa1 derivative C47S 90
3.4 Amyloid fibril formation of Hpa1-His6 at acidic pHs 90
3.5 Chemical cross-linking of Hpa1-His6 95
3.6 Circular dichroism (CD) spectroscopy of Hpa1-His6 98
3.7 Membrane disrupted by Hpa1-His6 99
3.8 Crystallization of Hpa1 102
3.9 Discussion. 103
3.9.1 Over-expression and purification of Hpa1 104
3.9.2 Function of cysteine in Hpa1 104
3.9.3 Oligomerization of Hpa1 104
3.9.4 Amyloid fibril formation of Hpa1 105
3.9.5 Membrane binding and disruption of Hpa1 106
3.9.6 Crystallization of Hpa1 and harpin proteins 106
Chapter 4 Fibril formation domain study of Hpa1
4.1 Amino acid sequence alignment of Hpa1 and HpaG, and secondary structure
prediction 108
4.2 Cloning, over-expression and purification of N-terminal truncated Hpa1 from
pET21a 110
4.2.1 Cloning of truncated hpa1 into pET21a expression vector 110

13
4.2.2 Over-expression and purification of N-terminal truncated Hpa1-His6 111
4.3 Amyloid fibrils formed by Hpa1 (55-138) 113
4.4 Membrane lysis by Hpa1 (55-138) 114
4.5 Amyloid fibrils formed by peptides 115
4.6 Membrane lysis by peptides 117
4.7 Circular dichroism spectroscopy 118
4.8 Intramolecular interaction of Hpa1-His6 119
4.9 Discussion 120
4.9.1 Domains of Hpa1 121
4.9.2 Fibril-forming peptide of Hpa1 121
4.9.3 Membrane disrupted by fibrils 122
4.9.4 Intramolecular interaction of Hpa1 123
Chapter 5 Crystallization and preliminary structure
analysis of the Vibrio cholerae VceR drug-pump repressor
in complex with bound DNA
5. 1 VceR and QacR sequence alignment 124
5. 2 Oligodeoxynucleotide preparation 125
5.3 VceR purification 126
5.4 Crystallization of VceR/dsDNA 128
5.5 Crystallization of VceR-CCCH/dsDNA 131
5.6 Crystal freezing and X-ray diffraction tests 133
5.7 Oligodeoxynucleotide screening for diffraction quality improvement 134
5.7.1 Purification of the VceR-CCCH/DNA complex 135
5.7.2 Crystallization of purified VceR-CCCH/DNA complex 136

14
5.8 Br-labelled crystals 140
5.9 Substructure solution of Br position 144
5.10 Preparation of selenomethionine-containing proteins 145
5.11 Data collection and processing 146
5.12 Substructure solution of Se position 149
5.13 Phasing and model building 151
5.14 Discussion 153
5.14.1 Oligo design for protein/DNA co-crystallization 153
5.14.2 Simple mixture or purification of protein/DNA complex for co-
crystallization 154
5.14.3 Palindromic or nonpalindromic sequence in protein /DNA co-crystallization
154
5.14.4 Substructure solution and phasing 155
Chapter 6 Final discussion and future work
6.1 Hpa1 157
6.1.1 Fibril formation mechanism of Hpa1 157
6.1.2 Secretion of Hpa1 through TTSS and its function in Xanthomonas 159
6.2 Crystallization of VceR in complex with its cognate DNA 160
6.2.1 DNA binding domain of VceR 160
6.2.2 Drug binding domain of VceR 160
6.2.3 Induction mechanism of VceR 161
References 162

15
Chapter 1 Introduction
Part I TTSS and harpin
1.1 Type III secretion system
The type III secretion system (TTSS) or type III secretion injectisome (different
nomenclatures for the same system in various bacteria) is utilized by Gram-negative
bacterial pathogens of animals and plants to deliver effectors (the substrate proteins
of TTSS) to their host (Alfano and Collmer, 2004; Ghosh, 2004; Gurlebeck et al.,
2006). To date, TTSSs have been found in the plant pathogens Pseudomonas
syringae, Xanthomonas, Ralstonia, Erwinia, and Pantoea (Alfano and Collmer, 2004)
and animal pathogens Yersinia, Salmonella, Pseudomonas aeruginosa, Shigella,
Bordetella and enteropathogenic Escherichia coli (EPEC) (Cornelis and Van
Gijsegem, 2000).
TTSSs consist of a basal body, which is embedded in the inner and outer membranes
of the bacterium, and a needle in animal pathogens or a pilus in plant pathogens,
through which contact is made with the host cell (Figure 1.1 a, b &c) (Alfano and
Collmer, 2004; Cornelis, 2006; Ghosh, 2004; Tampakaki et al., 2004). TTSSs have
been divided into seven different families, after the phylogenetic analyses of four
conserved proteins, the cytoplasmic ATPase and the other three proteins from the
inner membrane (Cornelis, 2006; Gophna et al., 2003). The seven families are
Chlamydiales, Hrp1, Hrp2, SPI-1, SPI-2, Rhizobium and Ysc family. TTSSs of plant
pathogens belong to two families, Hrp1 and Hrp2 family, whereas those of animal
pathogens locate to three families, SPI-1, SPI-2 and Ysc family (Cornelis, 2006). The
other two families, Chlamydiales and Rhizobium are limited to the Chlamydiae
phylum and the Rhizobiales order, respectively (Cornelis, 2006).
1.2 TTSSs and bacterial flagella
Components of the TTSS share sequence and structural similarities with those of the
bacterial flagellum, which is a motility organelle (Tampakaki et al., 2004). Flagella

16
consist of a rotating long filament and a rotary motor, which correspond to the pilus
or needle, and basal body in TTSS, respectively (Figure 1.1). Before effector export,
TTSSs secrete the external components, including the needle (or pilus in plant
pathogens) and translocator (or translocon in plant pathogens), which is similar to the
flagellar system in secretion its own hook and filament subunits for the flagellum
assembly (Cornelis, 2006; He and Jin, 2003; Ferris and Minamino, 2006; Macnab,
2003; Tampakaki et al., 2004). The TTSS is thought to have evolved from the
flagellum, or that the TTSS and the flagellum share a common ancestor (Gophna et
al., 2003; He and Jin, 2003).
Figure 1.1 Structure of the TTSSs. Schematic representation of Ysc TTSS (a),
TTSS from EPECs (b) and the TTSS from plant pathogens (c) (Cornelis, 2006).
a b c
C ring
YscQ
Needle
Complex

17
Plant pathogen
Xanthomonas
oryzae proteins
Animal pathogen
Yersinia pestis
proteins
Sequence
identity (%)
Function/ location
HrcC YscC 27.9 Secretin
Outer membrane
protein
HrcJ YscJ 37.2 MS ring
Lipoprotein
HrcN YscN 57.3 ATPase
Ring with 6-fold
symmetry
HrcQ YscQ 21.4 Putative C ring
HrcR YscR 49.5 Basal structure
Inner membrane
protein
HrcS YscS 38.3 Basal structure
Inner membrane
protein
HrcT YscT 27.6 Basal structure
Inner membrane
protein
HrcU YscU 32.3 Basal structure
Inner membrane
protein
HrcV YscV 41.5 Basal structure
Inner membrane
protein
Table 1.1 Nine core components of TTSS in plant and animal pathogen.
Sequence alignment was performed by SIM at Expasy. (Alfano and Collmer, 1997;
Cornelis, 2006; Macnab, 2003).
1.3 Components of TTSS
The TTSS has two components, the basal structure and the needle or pilus (Figure
1.1 a, b & c). The basal structure spans the outer and inner membrane of the
bacterium. There are approximately 25 proteins required to assemble the TTSS, nine
of which form a core, including one outer membrane protein (secretin), 6 inner
membrane proteins, one ATPase and one possible C-ring forming protein (Table 1.1)
(Cornelis, 2006; Ghosh, 2004).

18
1.4 TTSS of Xanthomonas oryzae
1.4.1 Xanthomonas oryzae
X. oryzae pv. oryzae (Xoo) and X. oryzae pv. oryzicola (Xoc) are bacterial pathogens
of rice, which result in bacterial leaf blight and bacterial leaf streak, respectively
(Gnanamanickam et al., 1999; Seo et al., 2008; Zou et al., 2006). Bacterial leaf
blight and bacterial leaf streak are widely distributed in tropical and subtropical Asia,
West Africa, South America, and Australia (Seo et al., 2008). Leaf streak can cause
grain weight losses of up to 32% and leaf blight induces crop loss of up to 50%
(Gnanamanickam et al., 1999). The main differences between Xoo and Xoc are in the
invasion entry point and colonization location (Seo et al., 2008). Xoo gains access to
the xylem through wounds or natural openings such as hydathodes and invades rice
vascular tissue (Seo et al., 2008). Xoc enters the leaf mainly through stomata and
colonizes the mesophyll parenchyma tissue (Seo et al., 2008). The genomes of Xoo
and Xoc are similar with respect to size, G+C percent, and gene content (Seo et al.,
2008). The pathogenicity in susceptible host rice and the hypersensitive response in
nonhost tobacco of Xoo and Xoc are dependent on TTSSs, which translocate
effectors to host or nonhost (Alfano and Collmer, 2004; Gurlebeck et al., 2006; Zou
et al., 2006). An understanding of the molecular mechanism of the pathogenicity of
Xoo and Xoc on the basis of TTSS could provide new strategies for their
management and the means to decrease the loss in rice yield.
1.4.2 TTSS of Xanthomonas oryzae pv. oryzicola
TTSSs of Xoo and Xoc are encoded by hrp (hypersensitive response and
pathogenesis) genes cluster, including hrp, hpa (hrp-assoicated) and hrc (hrp
conserved) genes (Alfano and Collmer, 2004; Zou et al., 2006). The nine hrp genes
(encoded proteins are shown in Table 1.1) of Xanthomonas oryzae, which are highly
conserved in plant and animal bacterial pathogens, are designated as the hrc genes
(Bogdanove et al., 1996).
The expression of the hrp gene cluster is induced by contact with the plant or in
minimal media that mimics the condition of the plant apoplast (Alfano and Collmer,
2004).

19
Substrates of TTSSs of Xoo and Xoc are the extracellular components (pilus,
translocon and other uncharacterized parts) of the secretion apparatus, effectors
(Section 1.4.3) and harpins (Section 1.5 for harpins) (Alfano and Collmer, 2004).
Interactions between effectors of the TTSS and the plant result in resistance or
susceptibility in pathogenesis (Bent and Mackey, 2007; Chisholm et al., 2006; Jones
and Dangl, 2006). The phenotype of TTSS is hypersensitive response in nonhost
plant and pathogenesis in host plant (Alfano and Collmer, 2004; Zou et al., 2006).
Although Xoo and Xoc are important rice pathogens, little work is published about
hrp and hrc genes from these two bacteria. Studies of X. campestris species would
help us understand the TTSSs of Xoo and Xoc. Well studied proteins of TTSS in X.
campestris are HrpE, HrpF, HrcN, HpaA, HpaB and HpaC.
HrpE (9.7 kDa) was found to be the major component of X. campestris pv.
vesicatoria Hrp pilus by the N-terminal sequencing of all the proteins purified from
the Hrp pili and further HrpE-specific antibody labelling of the pilus (Weber et al.,
2005).
HrpF in X. campestris, secreted by the TTSS, forms the translocon, which is a pore-
like structure that inserts into the host cell membrane for the translation of effectors.
The N-terminus of HrpF has a signal sequence for secretion and its C-terminal
hydrophobic region is the functional domain. In vitro, HrpF forms pores in planar
lipid bilayers (Buttner et al., 2002).
HrcN in X. campestris is the ATPase of TTSS, which is thought to provide the
energy for the secretion process (Lorenz and Buttner, 2009). However, in flagellar
type III secretion, the proton motive force is recognized as the energy source for
TTSS secretion (Paul et al., 2008). The ATPase of the TTSS, which forms a ring
structure, is located in the cytoplasm and associates with inner membrane protein
HrcU from the TTSS (Pozidis et al., 2003; Lorenz and Buttner, 2009). Another
function of the ATPase in the TTSS is to dissociate the effector and chaperone
complex (Akeda and Galan, 2005; Lorenz and Buttner, 2009). HrcL in X. campestris
interacts with and stabilizes HrpN; its homolog YscL in Yersinia is a negative
regulator of the ATPase (Blaylock et al., 2006; Lorenz and Buttner, 2009).

20
HpaB in X. campestris is thought to be a general TTSS chaperone (Buttner et al.,
2004). Generally, chaperones of the TTSS have a low molecular weight (about 15
kDa), low isoelectric points (<6) and a predicted amphipathic region in the C-termini
(Alfano and Collmer, 2004). These chaperones interact with effectors and maintain
them in a nonglobular state before secretion via passage through the narrow TTSS
(Alfano and Collmer, 2004). HpaB interacts with several effectors, and promotes
their secretion, but prevents the delivery of HrpF (translocon) (Buttner et al., 2004).
HpaC, which interacts with HrcU, acts as a substrate specificity switch protein of
Xanthomonas TTSS (Lorenz et al, 2008 b). The substrate specificity switch of TTSS,
which is the mechanism used by TTSS to secrete the pilus, translocon and effector
sequentially, is well characterized in animal pathogenic bacteria. This mechanism is
achieved through a conformational change of a cytoplasmic part of the inner
membrane protein, Spa40 of Shigella (Deane et al., 2008), YscU of Yersinia (Edqvist
et al., 2003; Sorg et al., 2007) and EscU of EPEC (Zarivach et al., 2008), which have
an autocleavage property. In X. campestris, HrcU has a similar autocleavage property
(Lorenz et al, 2008 b). HpaC inhibits the secretion of HrpB2, which is required for
pilus assembly (Lorenz et al, 2008 b). In addition, both HpaC and HrpB2 interact
with the C-terminal domain of HrcU, but not with the full length protein (Lorenz et
al, 2008 b). Given that HpaC promotes secretion of the translocon and effector,
HpaC presumably switches the secretion of HrpB2 to that of translocon and effector
(Lorenz et al, 2008 b).
In addition, HpaA interacts with the C-terminal domain of HpaB. To achieve
stepwise secretion of effector and pilus, binding of HpaA to HpaB was thought to
prevent secretion of effectors during pilus assembly (Lorenz et al, 2008 a).
1.4.3 TTSS effectors of Xoo and Xoc
The effectors of phytopathogenic TTSSs are the Avr (avirulent) proteins, which are
thus designated because they were detected through gain-of-function avirulence
phenotypes (Alfano and Collmer, 2004), and the other class of proteins, including
Hop (Hrp outer protein) in Pseudomonas (Alfano and Collmer, 2004), Xop
(Xanthomonas outer protein) in Xanthomonas (Gurlebeck et al., 2006), and Pop

21
(Pseudomonas outer protein, as based on a previous genus designation) in Ralstonia
(Arlat et al., 1994).
Effectors of phytopathogenic TTSS are important virulence factors and suppress
plant defenses (Alfano and Collmer, 2004; Kay and Bonas, 2009). Effectors of Xoo
and Xoc include Avr proteins and Xops (Alfano and Collmer, 2004; Gurlebeck et al.,
2006; Kay and Bonas, 2009). The molecular function of most effectors from Xoo and
Xoc is still unknown (Kay and Bonas, 2009).
Pathogens secrete Avr proteins into hosts that carry cognate R (resistence) proteins,
and results in the resistance interaction, hypersensitive cell death response (HR)
(section 1.5.1 for HR) (Alfano and Collmer, 2004; Cornelis and Van Gijsegem, 2000;
Gabriel, 1999). However, if the host is without the cognate R gene, the secretion of
Avr proteins into the host results in susceptibility and the pathogen invades the host
successfully (Alfano and Collmer, 2004; Cornelis and Van Gijsegem, 2000). There is
another kind of resistance, nonhost resistance (Heath, 2000b), in which the pathogen
secretes an Avr protein into the nonhost and the Avr protein is perceived by an R
protein from nonhost that induces nonhost resistance. An example of nonhost
resistance is that of the avrRxo1 gene from the rice pathogen Xoc that confers the
nonhost defense reaction on maize with the resistance gene Rxo1 (Zhao et al., 2004;
Zhao et al., 2005).
AvrXa7, AvrXa10 and AvrXa21 are well studied effectors of Xoo. AvrXa7 and
AvrXa10 are members of AvrBs3 family, which are targeted to the nucleus of the
plant cell, where they modulate plant gene expression (Gurlebeck et al., 2006; Yang
et al., 2000; Yang and White, 2004; Zhu et al., 1998). Different members of the
avrBs3 family have diverse repeat numbers of 102–bp in the central repeat domain.
avrXa10 and avrXa7 have 15.5 and 25.5 copies of this repeat domain, respectively
(Zhu et al., 1998).
AvrXa7 shows avirulence after injection into rice carrying Xa7 and virulence in rice
lacking Xa7 (Yang and White, 2004). AvrXa7 has a C-terminal nuclear localization
signal and acidic transcriptional activation domain, and central codon repeated
domain (Yang and White, 2004). The central codon repeated domains of avrXa7 and

22
avrXa10 determine their avirulence specificity to Xa7 and Xa10, respectively (Zhu et
al., 1998). The binding of AvrXa7 to double stranded DNA was confirmed, which
indicates AvrXa7 may interact with host DNA (Yang et al., 2000).
1.5 Harpins
1.5.1 Harpins and HR
Harpins are secreted by TTSS of bacterial pathogens of plants but are different from
the other effectors of TTSS (Alfano and Collmer, 2004). Harpins are heat-stable,
glycine-rich proteins that induce a hypersensitive response (HR) when infiltrated into
the intercellular space of nonhost leaves (Alfano and Collmer, 2004; Gurlebeck et al.,
2006; Zou et al., 2006).
Several harpins have been reported: HrpN of Erwinia amylovora (Wei et al., 1992),
HrpZ of P. syringae (He et al., 1993; Lee et al., 2001), PopA of Ralstonia
solanacearum (Racape et al., 2005), HpaG of Xanthomonas axopnpodis pv. glycines
(Kim et al., 2004), Hpa1 of X. oryzae pv. oryzae (Zhu et al., 2000) and XopA of X.
campestris pv. vesicatoria (Noel et al., 2002). These harpins have low sequence
identity between each others. An example is HrpN, which has 13.6% sequence
identity with HrpZ, 10.6% with PopA, 4.8% with HpaG, 5.8% with Hpa1 and 5.6%
with XopA (Sequence alignment was performed by SIM at Expasy).
The importance of harpins lies in that it is the first protein reported to be an HR
elicitor (Wei et al., 1992). HR, analogous to the innate immune system found in
animals, is a mechanism used by plants to prevent the spread of infection by
microbial pathogens. The HR manifests as patches of localized cell death at the
infection site, which limits the pathogen to the infection site (Greenberg, 1996; Heath,
2000a).
1.5.2 Harpin’s beneficial function on plants
Harpins can activate ethylene, salicylic acid (SA) and abscisic acid (ABA) signal
transduction, which are plant defense pathways, and thus have some beneficial

23
effects on the plant, such as increasing disease resistance, insect defense and plant
growth (Dong et al., 2005; Shao et al., 2008).
Harpins induce the disease resistance after being sprayed on or expressed in the plant
(Dong et al., 1999; Shao et al., 2008). HrpN, the harpin from E. amylovora, induces
resistance to P. syringae pv. tomato DC3000 and Peronospora parasitica in
Arabidopsis, after spraying on the plant (Dong et al., 1999). In this induction, harpin
acts through an endogenous plant defence SA (salicylic acid) signal transduction
pathway (Dong et al., 1999).
HrpN also activates the ethylene signalling pathway and thus inhibits aphid
reproduction after spraying onto Arabidopsis and enhances Arabidopsis growth
(Dong et al., 2004). These two effects are dependent on the ethylene receptor gene
and inhibition of ethylene perception also abolishes these two effects (Dong et al.,
2004).
In the other research, HrpN was found to induce drought tolerance in Arabidopsis
through initiating the ABA signalling relevant gene expression and promoting
stomatal closure (Dong et al., 2005).
Harpins are widely used to engineer pathogen-resistance and in crop improvement.
Expression of Hrf1, the harpin from X. oryzae pv. oryzae, in rice confers resistance
to Magnaporthe grisea (Shao et al., 2008) and in tobacco increases the resistance to
tobacco mosaic virus, to the bacterial pathogen Ralstonia solanacearum and to the
fungal pathogen Alternaria alternata (Peng et al., 2004). The transgenic tobacco
plants expressing hrpN have accelerated growth and develop enhanced resistance to
Botrytis cinerea, which is a necrotrophic fungal pathogen (Jang et al., 2006). HpaG,
a harpin protein from X. oryzae pv. oryzicola, was found to increase yield and quality
of green tea (Wu et al., 2007).

24
1.5.3 Harpin binding sites in plant
Considering the important function of harpins in plants, there are a number of studies
that indicate the target of harpin in plants, plant cell wall or plasma membrane and
the target proteins of harpin were identified.
Plant cell wall or plasma membrane
HrpZPsph, the harpin of P. syringae pv. phaseolicola, was reported to bind to lipid
membranes and induce ion-current fluctuations in planar lipid bilayers at
concentrations as low as 2 nM, which indicates pore-forming acitivity of HrpZPsph
(Lee et al., 2001). As a result, HrpZPsph was thought to target plasma membranes.
PopA, the harpin of Ralstonia solanacearum, also binds to membrane lipids in a
Ca2+
-dependent manner in vitro and forms Na+-conducting pores (Racape et al.,
2005). In vivo, immunogold labelling of PopA locates this harpin to the plasma
membrane of plants (Racape et al., 2005).
In other research, harpinPss, the harpin of P. syringae pv. syringae, was localized in
the plant cell wall by fluorescent signal. Extraction of Ca2+
and pectins from cell
walls by a chelating agent, EGTA, blocked the binding of harpin to the cell walls
(Hoyos et al., 1996).
Harpin interacting proteins
A protein binding site located in HrpZ, the harpin of P. syringae, was reported (Li et
al., 2005). A library of random peptides was used to screen for HrpZ interacting
peptides, which confirmed a consensus amino acid motif to be bound by HrpZ (Li et
al., 2005). This peptide binding domain was localized to the central region of HrpZ
(Li et al., 2005). Further study using antiserum raised against this HrpZ binding
peptide recognize acidic proteins in bean, tomato, parsley and Arabidopsis, and HrpZ
shows affinity for the protein from bean (Li et al., 2005). However, the sequences of
these proteins were not confirmed in this study.

25
Proteins from Arabidopsis (Arabidopsis thaliana), rice (Oryza sativa), and apple
(Malus) have been identified that interact with HrpN, the harpin from Erwinia
amylovora (Oh and Beer, 2007). HIPM (HrpN-interacting protein from Malus) was
first identified through yeast two-hybrid screens using the gene for the HrpN protein
as bait to screen a cDNA prey library from Gala apple (Oh and Beer, 2007). In
addition, AtHIPM (Arabidopsis thaliana HIPM) and OsHIPM (Oryza sativa HIPM)
were found in the genome databases of Arabidopsis and rice according to sequence
of HIPM (Oh and Beer, 2007). HIPM, AtHIPM and OsHIPM are all small proteins,
about 60 amino acids in length (Oh and Beer, 2007). They have a putative signal
peptide at the N-termini and one transmembrane domain, which would locate them to
the plasma membrane (Oh and Beer, 2007). In accordance with this prediction,
HIPM and AtHIPM GFP fusion proteins were found to be localized to the plasma
membrane (Oh and Beer, 2007). The N-terminus 198 amino acids of HrpN were
found to be the functional domain for the interaction with HIPM (Oh and Beer, 2007).
AtHIPM was found to be a negative regulator of plant growth, as the AtHIPM
knockout mutation in Arabidopsis exerts a positive effect on the growth of the aerial
parts (top growth) (Oh and Beer, 2007). HrpN also loses its effect on the growth of
Arabidopsis with AtHIPM knockout mutation (Oh and Beer, 2007). In addition,
overexpression of AtHIPM reduces Arabidopsis growth (Oh and Beer, 2007). These
findings indicate that HrpN inhibits the function of AtHIPM and thus enhances plant
growth (Oh and Beer, 2007).
1.5.4 Harpin-like proteins
There is another class of harpin-like proteins, which have a harpin domain and
another domain that has an alternate function (Kvitko et al., 2007). HrpW of P.
syringae pv. tomato and E. amylovora have an N-terminal domain that is similar to
harpins, which is glycine rich and able to elicit the HR when the purified domain
fragment is infiltrated into tobacco leaf, and a C-terminal domain homologous to
pectate lyases from E. carotovora, E. chrysanthemi and Bacillus subtilis
(Charkowski et al., 1998; Kim and Beer, 1998). The pectate lyase domain (32.5%
sequence identity with fungal pectate lyase PelC from Nectria haematococca) of
HrpW of P. syringae pv. tomato has no pectate lyase activity, but could bind to

26
pectate which suggests that the target of HrpW could be in the plant cell wall
(Charkowski et al., 1998).
HopAK1 and HopP1 of P. syringae pv. tomato DC 3000 have a C-terminal enzyme-
like domain, pectate lyase (56.1% sequence similarity to Bacillus licheniformis
pectate lyase PelB) and lytic transglycosylase (HopP1 has three conserved sequence
motifs which are predicted to be required for lytic transglycosylase activity),
respectively, and an N-terminal harpin domain (HrpW-like domain, 45% similarity
to HrpW from P. syringae pv. tomato) (Kvitko et al., 2007). Together with HrpZ1 of
P. syringae pv. tomato DC 3000, there are four harpins in this strain (Charkowski et
al., 1998; Kvitko et al., 2007).
1.5.5 Harpin forming fibrils
The ability of harpin to form amyloid fibrils was initially reported in 2007 (Oh et al.,
2007). HpaG, the harpin of X. axonopodis pv. gylcines, was found to form β-sheet-
rich fibrils in hrp induction minimal medium XVM2 (XVM2: 20 mM NaCl, 10 mM
(NH4)2SO4, 5 mM MgSO4, 1 mM CaCl2, 0,16 mM KH2PO4, 0.32 mM K2HPO4, 0,01
mM FeSO4, 10 mM sucrose, 10 mM fructose and 0.03% casamino acid, at pH 6.7) or
apoplastic fluid (Oh et al., 2007). Fibrils formed by HpaG produce green
birefringence after staining with Congo red (Oh et al., 2007). Circular dichroism (CD)
spectroscopic analysis of spherical oilgomers of HpaG shows an α-helix structure
which transforms into a β-sheet after the fibrils form (Oh et al., 2007). In addition,
amyloidogenesis has been taken as the cause of HR, after the finding that HR-null
mutants lack the ability to form fibrils (Oh et al., 2007).
Other harpins, XopA from X. campestris pv. vesicatoria, HrpZ of P. syringae pv.
syringae and HrpN of E. amylovora, also formed fibrils in XVM2 (Oh et al., 2007).

27
1.6 Amyloid fibrils
Amyloid fibrils are formed during the process of fibrillar protein aggregation, in
which the protein adopts an ordered-β structure (Chiti and Dobson, 2006; Fändrich,
2007).
In vivo, amyloid fibril aggregation induces human neurodegenerative diseases, e.g.,
Alzheimer‘s and Parkinson‘s disease (Petkova et al., 2002) and nonneuropathic
systemic amyloidoses, e.g., type II diabetes (Chiti and Dobson, 2006; Kajava et al.,
2005). It is thought that more than 100 different human pathological conditions are
associated with amyloid fibril formation (Fändrich, 2007). Table 1.2 shows the main
diseases and proteins or peptides involved.
Main fibril constituent protein or fragment Disease
Aβ40 peptide Alzheimer‘s disease
huntingtin Huntington‘s disease
α-synuclein Parkinson‘s disease
human amylin Type II diabetes
Table 1.2 A summary of the main diseases and the proteins or peptides involved
(Stefani and Dobson, 2003).
Nonpathological amyloid fibrils have specific functional roles, e.g., curli from E. coli
facilitates binding to host proteins; prion from Saccharomyces cerevisiae terminates
mRNA translation; and spidroin from Nephila edulis forms the silk fibers of the web
(Chiti and Dobson, 2006). Nature uses the high elasticity and persistence of amyloid
fibrils to build natural materials (Kelly and Balch, 2003).
In vitro, several partially unfolded soluble proteins can form amyloid fibrils when
they undergo a transition from a helix to β sheet under conditions of high
temperature, e.g. transthyretin (Ferrao-Gonzales et al., 2000); high pressure, e.g.
truncated form of hamster prion protein (SHaPrP90–231) (Torrent et al., 2004; Torrent
et al., 2006); low pH, e.g. human prion protein and calcium-binding equine lysozyme
(Gerber et al., 2008; Kumar et al., 2007; Malisauskas et al., 2003); or moderate

28
concentrations of organic solvents, e.g. α-synuclein and beta2-microglobulin
(Chaudhary et al., 2008; Chiti and Dobson, 2006; Lee et al., 2008).
Besides these full-length proteins, there are several polypeptide segments of these
fibril-forming proteins involved in amyloid fibril formation, e.g. Aβ40 peptide
associated with Alzheimer‘s disease, and human amylin relevant to type II diabetes.
Amyloid fibril forming polypeptide chains are dramatically diverse in their sizes and
sequences. The poly-amino acids from myoglobin that form amyloid fibrils in vitro
are α helical in their native state (Fändrich et al., 2001). Some poly-amino acids and
short designed peptides are intrinsically unable to fold into globular conformations
and revert into the alternative structural state, amyloid fibrils (Fändrich and Dobson,
2002; Lopez De La Paz et al., 2002; Tjernberg et al., 2002).
1.6.1 Common structure of amyloid fibrils
Several studies suggest that amyloid fibrillization is a multistep process that involves
various intermediate forms, including spherical oligomers, protofibrils and mature
amyloid fibrils (Glabe, 2006).
Spherical oligomers are an intermediate state in the pathway of fibril formation,
which ranges from dimers up to particles of a million Dalton (Glabe, 2006), that have
been observed by EM. These spherical oligomers, also called micelles, have a
diameter of approximately 3-10 nm (Glabe, 2006). Protofibrils are thought to be
curly and wormlike, have a thin diameter about 2-5 nm and consist of flat β-sheets
with an overall long-range twist, which has minimal rotations (about 1-3°) between
successive peptide strands (Jimenez et al., 1999; Jimenez et al., 2002; Uversky and
Fink, 2004). Figure 1.2a shows the EM of apomyoglobin protofibrils. Mature fibrils
consist of more than one protofibril wound around a core that may in some cases be
hollow, which have a diameter 6-12 nm and a linear, straight and regular appearance
(Uversky and Fink, 2004). A 3D reconstruction of an insulin amyloid mature fibrils
is shown in Figure 1.2b.

29
Figure 1.2 Electron micrograph of fibrils (a) Electron micrograph of
apomyoglobin protofibrils (Fändrich et al., 2003). (b) 3-D reconstruction of insulin
mature fibrils twisted from protofilaments. Left is twisted by a pair of protofilaments.
Middle is twisted by four protofilaments. Right is twisted by six protofilaments.
(Jimenez et al., 2002)
1.6.1.1 Structure models of Aβ1-40 fibrils and amylin
Figure 1.3 A structural model for Aβ1-40 fibrils. (a) Schematic representation of a
single molecular laryer. The yellow arrow indicates the direction of the long axis of
the fibril. (Petkova et al., 2002) (b) A cross section of two laterally displaced
molecular layers of the Aβ1-40 fibrils. The long axis of the fibril is perpendicular to
the page. (Petkova et al., 2002)
The Alzheimer‘s β-amyloid (Aβ) peptides are derived from partial proteolysis of the
larger transmembrane protein, the β-amyloid precursor protein (Benzinger et al.,
2000). The Aβ fibril is a hydrogen-bonded, parallel β-sheet (Figure 1.3a) (Benzinger
et al., 1998). A structural model for Aβ1-40 has been suggested, based on solid-state
NMR, that a single protofilament is composed of two fundamental units (Figure 1.3b)
(Petkova et al., 2002). Every fundamental unit is a double-layered β-sheet structure,
a
b

30
which is formed by residue 12-24 and 30-40 (Petkova et al., 2002). The mature
amyloid fibril formed by Aβ1-40 peptide consists of two protofilaments (Sachse et al.,
2008).
Human amylin, a 37 amino acid long peptide, produced by cleavage from a pro-
amylin precursor protein, forms amyloid fibrils and is associated with type 2 diabetes
(Kajava et al., 2005). An amylin structural model has been proposed by Kajava, et al.
(Figure 1.4) (Kajava et al., 2005). In this model, three β-strands consisting of
residues 12-17, 22-27 and 31-37 form a serpentine core and the first eight residues
form a disulfide-bonded loop (Kajava et al., 2005). Three amylin protofilaments
(Figure 1.4b) coil to form fibrils with a left-handed coiling (Kajava et al., 2005).
Figure 1.4 Amylin structure model. (a) Diagram of the proposed β-serpentine fold
for human amylin. The model has three β-strands. (b) The protofilament model of
human amylin. The three β-strands of the serpentine are marked by arrows with
different colors (blue, yellow and purple). Ladders formed by H-bonding of Asn22, -
31 and -35, Ser19 and Tyr37 are shown by red broken lines. (Kajava et al., 2005)
1.6.1.2 Atomic structure of fibril forming segments
The availability of microfocus beamlines at the European Synchrotron Radiation
Facility and Swiss Light Source allowed the crystal structure analysis of
microcrystals formed by fibril forming segments, which range from 4 to 7 residues in
length (Nelson et al., 2005; Sawaya et al., 2007).

31
The atomic structure of GNNQQNY, a fibril-forming segment from the yeast Sup35,
presents that its fundamental unit is a pair of β-sheets, which are formed by
unspecific van der Waals interactions of interdigitating side chains from each β-sheet,
named ‗steric zipper‘ by the authors (Figure 1.5) (Nelson et al., 2005). Each pair of
β-sheets is formed from parallel β-strands by hydrogen-bonds (Nelson et al., 2005).
The interface between two sheets of a β-sheet pair only involves van der Waals
interaction without water and thus is a dry interface. In contrast to the dry interfaces,
the wet interfaces between pairs of β-sheets are lined with water molecules, which
hydrate the polar side chains (Figure 1.5b).
Figure 1.5 Structure of GNNQQNY. (a) The pair-of-sheets structure, showing the
backbone of each -strand as an arrow, with side chains protruding. The dry
interface is between the two sheets, with the wet interfaces on the outside surfaces. (b)
The GNNQQNY crystal packing viewed down the sheets (from the top of panel a,
along the b axis). Red crosses indicate the water molecule. The dry interface is
shown in grey and the wet interface is shown in pink. (Nelson et al., 2005)
Further studies of atomic structures of fibril-forming segments, NNQQ from yeast
prion Sup35, VQIVYK from tau (a microtubule binding protein in Alzheimer‘s
disease), GGVVIA and MVGGVV from amyloid-β, LYQLEN and VEALYL from
insulin, SSTSSA from RNase, and SNQNNF from PrP, reveal similar β-sheet pairs
and steric zippers formed by the interactions between the residue side chains of
mating β-sheets, which might be a general characteristic in amyloid structures
(Sawaya et al., 2007).

32
1.6.2 Mechanisms of amyloid fibril formation
A possible mechanism for amyloid fibril formation, nucleation and growth, has been
proposed (Chiti and Dobson, 2006; Collins et al., 2004; Serio et al., 2000;
Vestergaard et al., 2007). The intermolecular contacts of specific segments of the
protein form a nucleus, which is a slow reaction and the least stable intermediate
(Chiti and Dobson, 2006; Vestergaard et al., 2007). Following a lag phase for
nucleation, there is a rapid exponential growth phase in which there is further
association of either monomers or oligomers within the nucleus (Chiti and Dobson,
2006; Collins et al., 2004; Vestergaard et al., 2007). Fragmentation of already
formed fibrils, taken as seeds, increases the reaction of nucleation by circumventing
the beginning of nucleus formation (Stohr et al., 2008).
1.6.3 Pathogenicity of amyloid fibrils
Initally, amyloid fibrils were taken as the species responsible for cell toxicity and
death. However, recent studies provide evidences that the intermediate state, the
soluble amyloid oligomers, is the main cytotoxic species (Chiti and Dobson, 2006).
Soluble amyloid oligomers of different amyloidogenic proteins and peptides were
reported to have a common structural motif (Kayed et al., 2003). In this publication,
the antibody produced by rabbit vaccination with Aβ peptides not only specifically
recognizes the oligomeric state of Aβ, but the soluble oligomers among all other
types of amyloidogenic proteins and peptides, regardless of sequence, such as islet
amyloid peptide, ployglutamine, lysozyme and human insulin (Kayed et al., 2003).
Since the protein function is determined by the three-dimensional structure, the
common structure of different amyloidogenic proteins and peptides implies that they
also share a common pathological function and act on the same primary target of
cells (Kayed et al., 2003). The plasma membrane is assumed to be the primary target
of the amyloid oligomer (Kayed et al., 2003).
In explanation of the pathogenicity or toxicity of soluble oligomers or fibrils, several
mechanisms, including membrane disruption, ion channel forming and

33
permeabilization of membrane, have been proposed (Engel et al., 2008; Kayed et al.,
2004; Quist et al., 2005).
Kayed et al., 2004 found that soluble oligomers from diverse amyloids (Abeta40 of
Alzheimer disease, α-synuclein of Parkinson disease, IAPP of type II diabetes,
polyglutamine of Huntington disease and prion [106-206] of prion disease) that
increase lipid bilayer conductance independent of the sequence (Kayed et al., 2004).
In their study, the increasing conductance is conformation-specific and no channel or
pore is formed.
Quist et al., 2005, showed that amyloid molecules form the ion channels, including
Aβ of Alzheimer disease, α-synuclein of Parkinson disease, amylin of Type II
diabetes, in membrane by AFM (Quist et al., 2005).
However, Engel et al., 2008 reported the human islet amyloid polypeptide (IAPP)
damaged the membrane through the fibril growing on the membrane (Engel et al.,
2008). In this study, the kinetic profile of IAPP-induced membrane leakage matches
that of IAPP fibril formation, which correlates the membrane damage with fibril
growth. Furthermore, seeding increased fibril formation and also membrane damage.
Insulin, the inhibitor of IAPP fibril growth, protects against IAPP-induced membrane
damage.
In summary, the pathogenicity of amyloid fibrils, or their precursor oligmers, might
lie in their effect on the plasma membrane, either disrupting the membrane or via the
formation of ion channels in the membrane.
1.7 Hpa1
The Food and Agriculture Organization (FAO) of the United Nations pointed out that
there are still 77 food-deficit countries all over the world (Crop prospects and food
situation, No. 4, November 2009, FAO). Rice is the most important food for a large
part of the world‘s human population and its bacterial pathogen Xoc induces rice loss
of up to 50% (Gnanamanickam et al., 1999). Thus, the management of Xoc to
improve the rice yield is one practical way to provide more food.

34
A TTSS is used by Xoc to translocate effector proteins into host rice and is thus
responsible for its pathogenicity (Alfano and Collmer, 2004; Zou et al., 2006). An
understanding of the molecular mechanism of the TTSS of Xoc and its role in
pathogenicity could provide a basis for the management of Xoc to bring about a
decrease in the loss in rice yield. Hpa1, the harpin of Xoc, is secreted by the TTSS
and induces HR in nonhost tobacco (Zou et al., 2006). Although Hpa1 is a substrate
of the TTSS, the pathogenicity of Hpa1 in host is still enigmatic. We sought to
elucidate the structure and function of Hpa1 in order to further our understanding of
its pathogenic role.
Recently, HpaG, the harpin of X. axonopodis pv. glycines, was reported to form
amyloid fibrils (Oh et al., 2007). The aggregation of amyloid fibrils in vivo is
associated with about 100 human pathological conditions (Fändrich, 2007). Hpa1 has
high sequence identity (59.7%) with HpaG; and so we sought to test whether Hpa1
assembles into amyloid fibrils as does HpaG? Assuming Hpa1 formed amyloid
fibrils, we aim to address the following questions: (i) what are the conditions for
amyloid fibril assembly of Hpa1; (ii) is there a segment or motif present within Hpa1
responsible for fibril assembly; (iii) what is the function of Hpa1 fibrils in conferring
pathogenicity?

35
Part II Regulators of MDR transporter
1.8 Multi-drug resistance (MDR)
Although the development of resistance against antimicrobials is due to natural
selection in response to naturally occurring environmental sources, the abuse of
antibiotics in the clinic has resulted in an immense selective pressure and emergence
of antibiotic resistance (Harrison and Svec, 1998). Multi-drug resistant (MDR)
bacteria can survive in the presence of potentially lethal doses of structurally diverse
drugs that now threaten to compromise effective chemotherapy. The emerging global
crisis of MDR has led to an urgency in the development of new therapeutic
approaches to circumvent resistance mechanisms (Harrison and Svec, 1998;
McKeegan et al., 2004). Extensive study and understanding of the molecular
mechanisms underlying the development of MDR could provide clues in developing
new inhibitors to combat resistant bacteria.
The mechanisms used by MDR bacteria to acquire resistance to antimicrobial agents
are summarized in the following three types (Walsh, 2000).
1) Drug modification, e.g. production of β-lactamases for hydrolysis of the β-lactam
ring.
2) Modification of the cellular target, e.g. changes in fluoroquinolone binding sites of
DNA gyrase resulting in resitance to ciprofloxacin.
3) Pumping out the antibiotic e.g. drug efflux pumps.
Generally, drug efflux pumps consist of an inner membrane protein and a
cytoplasmic membrane fusion protein, acting with an outer membrane protein to
extrude drugs from cells (Borges-Walmsley et al., 2003; Zgurskaya and Nikaido,
2000). MDR transporters can be divided into six families: the ATP binding cassette
(ABC) transporters, which couple the hydrolysis of ATP to drug efflux; the major
facilitator superfamily (MF); resistance nodulation division (RND) family; the
drug/metabolite efflux (DME); small multidrug resistance transporters (SMR) family;

36
and multidrug and toxic compound extrusion (MATE) family (Borges-Walmsley et
al., 2003; Kumar and Schweizer, 2005). MF, SMR, RND and DME family are
proton-driven antiporters and MATE tranporters are Na+-driven transporters
(Borges-Walmsley et al., 2003; Kumar and Schweizer, 2005). Figure 1.6 shows five
well-characterised families of multidrug efflux pump.
Figure 1.6 Five well-characterised families of multidrug efflux pump SMR
family transports are proton-driven antiporters and have 4 TMS (transmembrane
spanning helices); MATE family transports are Na+-driven transporters; RND family
transports are proton-driven antiporters and have 12 TMS and MF family transports
are proton-driven antiporters and have 12 TMS. ABC transporters are powered by
ATP hydrolysis. (McKeegan et al., 2004).
1.9 Transcriptional regulation of multidrug transport systems
Excessive expression of bacterial MDR transporters could be deleterious, because
this could cause the physical disruption of the membrane integrity or unwanted
export of essential metabolites (Schumacher et al., 2001; Schumacher and Brennan,
2002). The transcriptional regulation of MDR genes has been found in proton-motive
force dependent efflux pumps, the major facilitator superfamily (MF) and resistance
nodulation division (RND) family (Schumacher et al., 2001; Schumacher and
Brennan, 2002). However, SMR family and partial RND and MF family pump genes
express constitutively, which reflects unknown physiological roles for the
unregulated pumps in normal cellular metabolism (Schumacher and Brennan, 2002).

37
In addition, two-component regulatory systems have also been characterized in
regulation of MDR genes, in which a membrane-linked kinase senses the signal, and
a corresponding response regulator affects the outcome (Schumacher et al., 2001;
Schumacher and Brennan, 2002).
The regulators of bacterial multidrug transport systems belong to one of four
regulatory protein families, the AraC, MarR, MerR, and TetR families, the
assignment of which is based on the similarities detected within the DNA-binding
domains of the regulator (Schumacher and Brennan, 2002). The transcriptional
regulation of MDR transporter acts at a local or global level (Schumacher and
Brennan, 2002). Extensively studied local regulators of drug transporter are E. coli
TetR, repressor of tetracycline efflux; Bacillus subtilis BmrR, activator of Bmr pump;
and Staphylococcus aureus QacR, repressor of QacAB pump. Well characterized
global regulators are E. coli MarA, the global activator of the AcrAB-TolC pump;
and N. gonorrhoeae MtrA, the global activator of the MtrCDE pump.
Considering that transcriptional regulatory proteins bind many of the diverse
antimicrobials that are also substrates of the pumps they regulate, the study of
cytosolic regulatory proteins will not only provide understanding of the regulation
mechanism of MDR transportion, and thus provide a strategy in overcoming MDR,
but could also reveal the drug recognition and binding of regulators, which could be
targets for drug design to overcome antibiotic-resistant bacteria.
1.10 TetR family of transcriptional repressors
TetR family transcriptional repressors are widely distributed among bacteria and
involved in the regulation of multidrug resistance pumps, catabolic pathways, the
biosynthesis of antibiotics, osmotic stress, and the pathogenicity of Gram-negative
and Gram-positive bacteria (Ramos et al., 2005). They are also involved in the
adaptation to complex and changing environments (Ramos et al., 2005).
Members of the TetR family exhibit a high degree of sequence similarity at the helix-
turn-helix (HTH) DNA binding domain, but low sequence similarity in the signal
sensing domain, which indicates the differences in the function of this family (Ramos
et al., 2005). It is proposed that members of the TetR family function in a similar

38
manner: the binding of an inducer molecule to the C-terminal signal sensing domain
induces a conformational change in the conserved DNA-binding domain, resulting in
the release of the repressor from the operator, allowing transcription of the regulated
downstream genes (Grkovic et al., 2001; Ramos et al., 2005)
1.10.1 TetR
The broad-spectrum antibiotic Tc (tetracycline) binds to the small ribosomal subunit
and thus interrupts polypeptide chain elongation (Buck and Cooperman, 1990). The
tetracycline repressor TetR, regulates the expression of TetA, which acts to export
the tetracycline-magnesium complex, [MgTc]+, and itself, by binding to specific
DNA operators (Grkovic et al., 2001; Hinrichs et al., 1994; Kisker et al., 1995; Orth
et al., 1998a). There are two adjacent inverted repeats, named tet operators O2 and O1,
which overlap the tetA and tetR promoters. The binding of TetR to operator O2
represses tetA alone and to operator O1 represses both the tetA and tetR genes. TetR
has a fourfold-higher affinity to operator O2 than to operator O1 (Grkovic et al., 2001;
Kisker et al., 1995; Orth et al., 1998a).
Upon binding of [MgTc]+, TetR changes its conformation and dissociates from the
operators, which results in the expression of TetR and TetA and subsequently the
export of [MgTc]+ by TetA (Hinrichs et al., 1995). The affinity of TetR for [MgTc]
+
is greater than that of [MgTc]+ to ribosomes, subsequently ensuring tetA expression
and [MgTc]+ export before the inhibition of protein synthesis (Orth et al., 1998b).
TetR monomer has 10 -helices. Helices 2 and 3 constitute the helix-turn-helix
(HTH) motif for DNA binding, which is connected to the regulatory domain, helices
5- 10, through helix 4 (Ramos et al., 2005; Hinrichs et al., 1994; Orth et al.,
2000). The dimerization of TetR is achieved by the interaction of 8 and 10 with
the symmetry-related 8‘ and 10‘ (Hinrichs et al., 1994; Kisker et al., 1995).
1.10.1.1 TetR and [Mg-Tc]+ complex structure
The crystal structures of the class D TetR in complex with [Mg-7HTc]+ (tetracycline)
and [Mg-7ClTc]+ (7-chlorotetracycline, the hydrogen atom at C-7 is replaced by Cl)
were determined (Hinrichs et al., 1994; Kisker et al., 1995). The TetR homodimer

39
binds two tetracycline-Mg2+
complexes in binding tunnels within the regulatory
domains of TetR. helices 4 to 8 and 8‘ and 9‘ (a prime refers to the second
subunit of the dimer) form the first Tc binding pocket, and helices 4‘ to 8‘ and 8
and 9 form the second site (Orth et al., 1999).
The interactions between TetR and Tc-Mg include hydrogen bonding, hydrophobic
interactions and Mg2+
coordination (Hinrichs et al., 1994; Kisker et al., 1995; Orth et
al., 1999). The functional groups of Tc involved in hydrogen bonding and Mg2+
coordination determine the antibiotic activity of Tc, as modifications of them abolish
the antibiotic activity (Hinrichs et al., 1994). In detail, Mg2+
is octahedrally
coordinated by the chelating ketoenolate group O-11/O-12 of Tc, Nεof His-100, and
by three water molecules. Two of these water molecules are hydrogen bonded to the
carboxylate of Glu-147‘ (Figure 1.7) and the other one forms a hydrogen bond to the
hydroxyl group Oγ of Thr103. In addition, the Nε of His-64 and NH of Gln-116 form
hydrogen bonds with Tc amide oxygen in position 2 and negatively charged oxygen
in position 3. The O-3 and N-4 of the Tc are bridged to the amide side chain of Asn-
82 by hydrogen bonds. The phenyl ring of Phe-86 forms an aromatic hydrogen bond
with hydroxyl group O-121 of Tc. (Hinrichs et al., 1994; Orth et al., 1999).

40
Figure 1.7 Structure of TetR in complex with [Mg-Tc]+ (a) Ribbon drawing of the
TetR/Mg-7ClTc dimer (PDB code: 2TRT), one complex in green, the other in red
(Kisker et al., 1995). The figure was prepared using PyMOL (DeLano, 2002). (b)
Chemical structure of tetracycline and schematic representation of the interaction
between tetracycline and TetR. Hydrogen bonds are represented by dashed lines;
hydrophobic interactions are shown by hashed lines. W1, W2 and W3 are water
molecules in the octahedral coordination shell of Mg2+
and Me represent methyl.
Charges are marked (+) and (-). (Hinrichs et al., 1994)
a
b
N
C
α1
α2
α3 α4
α5
α6
α7
α8
α9
α10

41
In the interaction with [Mg-Tc]+, the side chains of TetR were divided into three
categories (Orth et al., 1999). Group I consists of His64, Asn82, Phe86 and Gln116,
which are located at the far end of the binding tunnel. Functional groups of Tc ring A
form hydrogen bonds with the side chains of these residues. Group II comprises
Val113, Leu131, Ile134, Leu170‘, Leu174‘ and Met177‘, which form nonpolar van
der Waals contacts to the hydrophobic part of [Mg-Tc]+. Group III consists of
His100, Thr103 and Glu147‘, which are involved in direct or water-mediated Mg2+
coordination (Orth et al., 1999).
The comparison of structures of [TetR]2 (TetR dimer, inducer-free), [TetR-7ClTc]2
(TetR dimer complexed with two 7ClTc without Mg), [TetR-7ClTc]·[TetR-Mg7ClTc]
(TetR dimer complexed with one 7ClTc and one Mg7ClTc) and [TetR-Mg7ClTc]2
(TetR dimer complexed with two Mg7ClTc) shows the binding of [Mg-Tc]+ to TetR
in sequential steps (Orth et al., 1999). The first step of [Mg-Tc]+ binding is the
insertion of [Mg-Tc]+ into the binding tunnel and results in hydrogen bonding
between ring A of Tc and group I residues. The second is the rotation of Tc around
ring A, which produces the hydrophobic contacts and positions the chelated Mg2+
appropriate for binding to His100. (Figure 1.7b) (Orth et al., 1999). There are two
other amino acid residues, Thr103 and Glu147‘, involved in binding Mg2+
. The
binding of Mg2+
to Thr103 (the first amino acid residue of 6 C-terminus) forces its
side chain to shift by 2.5 Å (Orth et al., 1999). Subsequently, 6 unwinds to adopt a
β turn conformation and 4 performs a pendulum-like motion. Therefore, it is Mg2+
that initiates helix unwinding in TetR induction (Orth et al., 1999).
1.10.1.2 TetR and its bound DNA
The crystal structure of the class D TetR bound with its 15 bp operator DNA, which
overlaps the promoters for tetA and tetR, shows the HTH motifs of TetR in contact
with two major grooves in B-form DNA (Figure 1.8) (Orth et al., 2000; Grkovic et
al., 2001). These two major grooves are widened to 14-14.5 Å, compared with the
canonical B-DNA 11.7 Å (Figure 1.8) (Orth, et al., 2000). Another characteristic of
TetR bound with its operator DNA is the bend of each half operator DNA, which is
caused by kinking at base pair 2 from TetR and compensating by bending of base

42
pairs 3-6 to TetR , which results in the almost parallel ends of the 15-mer DNA (Orth,
et al., 2000).
Figure 1.8 Structure of the TetR-tetO complex. (a) Ribbon representation of the
overall structure of the TetR-tetO complex. -helices of the homodimeric TetR are
labelled in one monomer. The helices that form the DNA binding domain are colored
blue; the helices that form the rigid scaffold are colored yellow, the rest of the helices
that undergo conformational changes after the binding of inducer are colored green.
(b) Schematic representation of the interactions of TetR dimer with its 15 bp operator.
The interactions between specific nucleotides and polypeptides shown by arrows and
those between phosphate backbones and polypeptides indicated by blue lines.
(Grkovic et al., 2001; Orth et al., 2000)
The interaction of TetR with operator DNA is shown in Figure 1.8. The central three
pairs are taken as the spacer and do not contribute to the protein-DNA interaction.
The TetR monomer A binds the main strand from positions –4 to –7 and contacts
the
complementary strand from operator positions +4 to +2. The symmetric monomer A'
binds the main strand from positions +2 to +4 and the complementary strand from
positions –4 to –7. The specific contacts between the side chains of TetR and bases in
the operator DNA are A3-Gln38 and G2-Arg28 by bidentate hydrogen bonding, and

43
T4-Pro39 and T5-Tyr42 by van der Waals interactions. Helix 3 (from Gln38 to
His44) is the main element responsible for sequence-specific recognition. Lys48
from 4, out of the HTH motif, also establishes contacts with the target DNA region.
1.10.1.3 The induction mechanism of TetR
A structural comparison of induced (Mg-Tc bound) and non-induced TetR (DNA
bound) found the center-to-center separation of recognition helices 3 and 3‘ in the
operator complex changes from 36.6 Å to 39.6 Å after Mg-Tc binding. In
explanation of the induction mechanism of TetR, signal transduction between the
operator-binding interface and Mg-Tc binding site was proposed. This process is
initiated from the shift of helix 6 in its C-terminal direction by 1.5 Å and the
conformational change of its C-terminal turn to a type II β-turn (Orth et al., 2000). In
concert, 8 is extended by one turn in its C-terminus and the N-terminal turn of 7
adopts a 310-helical conformation on induction (Orth et al., 1998b).
These changes force the central part of 4 to shift in the same direction, as the van
der Waals contact between 4 and 6. Figure 1.9 shows the insertion of Mg-Tc into
the binding tunnel to initiate the pendulum like motion of the N-terminus of4. This
motion of 4 and 4‘ (a prime refers to the second unit of the dimer) shifts the N-
terminal DNA-binding domain apart, increases the separation of the recognition
helices 3, 3‘ and causes the dissociation of the TetR/operator complex (Orth et al.,
2000).

44
Figure 1.9 The conformational changes of TetR associated with [Mg-Tc]+
binding Comparison of TetR in induced (yellow) and DNA-bound form (blue). The
DNA phosphate-ribose backbone is shown in red, base in grey, Tc in orange and
Mg2+
in red, the water molecules that constitute the water zipper in the induced
conformation as blue spheres, which locks the DNA binding domain in a
conformation unable to bind to the operator. (Grkovic et al., 2001; Orth et al., 2000)
1.10.1.4 TetR peptide inducer
Besides Tc and its derivatives, a 16-residue peptide (WTWNAYAFAAPSGGGS),
called Tip (transcription inducing peptide), was found to mimic Tc, to induce TetR in
E. coli, when fused to the N or C terminus of thioredoxin (Klotzsche et al., 2005;
Luckner et al., 2007). Tip was identified from a phage display library. Tc could
displace the peptide Tip from the TetR-Tip complex, indicating that there is
competition between Tip and Tc for TetR binding (Klotzsche et al., 2005).
The crystal structure of the Tip-TetR complex revealed that four residues (Trp1, Thr2,
Trp3 and Asn4) of Tip occupy the Tc binding pocket (Figure 1.7b and Figure 1.10a),
eight amino acids interact with residues to the surface of TetR and the other four
residues are not visible in the electron density maps (Luckner et al., 2007). As there
is an absence of Mg2+
in the structure of Tip-TetR, the indole nitrogen of Trp1 from
Tip forms a hydrogen bond with the carbonyl oxygen of Thr103 of TetR. Tip

45
residues Thr2 and Asn4 form polar interactions with TetR residues Glu147‘,
Asp148‘ and His 151‘ (Luckner et al., 2007) (Figure 1.10a).
Figure 1.10 The structure of the Tip-TetR complex (a) Interactions occurring
between TetR and Tip. Ionic interactions (dashed line) and van der Waals
interactions (parallel lines) are marked. Tip residues are labeled with the single-letter
code; the three-letter code is used for TetR residues. (b) Superposition of Tip-
induced TetR and uninduced TetR. Tip-induced TetR is shown in gray and red, while
uninduced TetR in yollow and brown. The parallel lines hight intersubunit
interactions that are unique to the Tip-TetR complex. (Luckner et al., 2007).
The binding of Tip to TetR also repositions its DNA-binding domain in analogy to
that of Tc by the pendulum-like motion of helix α4 (Section 1.10.1.3). However, the
a
b

46
repositioning of helix 4 is achieved by direct intersubunit interaction between loop
8‘ to 9‘ and the beginning of helix 4, different to the conformational changes of
the C-terminal turn of 6 and the N-terminal turn of 7 in the induction by Tc
(Luckner et al., 2007) (Figure 1.10b).
1.10.2 QacR
The Staphylococcus aureus QacR binds to an operator DNA and negatively regulates
qacA transcription (Grkovic et al., 1998). QacA is a multidrug transporter and
confers resistance to a broad range of antimicrobial agents. QacR is a member of the
TetR family but shows a very low overall sequence identity (13.8%) with TetR
(Sequence alignment was performed by SIM at Expasy). In contrast to ten helices of
TetR, QacR is 23 residues shorter than TetR (these 23 residues are corresponding to
10 in TetR), and has nine helices: 1(3-18), 2(25-32), 3(36-42), 4(46-71),
5(75-88), 6(96-108), 7(110-136), 8(145-162) and 9(168-185), which play
different functions during the binding of DNA and drugs (Schumacher et al., 2001
and 2002).
1.10.2.1 DNA binding mechanism of QacR
The first three helices act as a three-helix bundle DNA-binding domain (helix-turn-
helix motif) and helices 4 through 9 are responsible for drug binding and
dimerization (Schumacher et al., 2002). Although QacR and TetR are members of
TetR family, they bind DNA in different modes. The QacR/dsDNA complex consists
of two QacR dimers and one 28 bp operator, and the two dimers are found to dock
onto the two successive major grooves of the cognate DNA (Figure 1.11)
(Schumacher et al., 2002).

47
Figure 1.11 Structure of QacR bound to its cognate DNA duplex. (a) Ribbon
representation of the two QacR homodimers bound to target DNA. The monomers of
each dimer are designated as distal (blue) or proximal (red). (b) Schematic showing
QacR-DNA half-site contacts. The yellow and purple subunits are from different
dimers. Nucleotide G7 is the location of the qacA transcription start site and this GC
pair is shaded in purple (Grkovic et al., 2001; Schumacher et al., 2002).
QacR binds its operator cooperatively, which is mediated by unwinding of the DNA.
The unwinding of operator DNA bound by QacR is reflected by two characteristics.
The DNA oligonucleotide bound by QacR has a twist of 32.1° and 11.2 bp per turn
a
b

48
pitch, which are 34.3° and 10.5 bp per turn in canonical B-DNA. In addition, the
center-to-center distances between the recognition helices of each QacR dimer (the
distance between amide nitrogens of Gly37) expands to 37 Å, in contrast to 34 Å for
proteins that bind the consecutive major grooves of B-DNA. It is proposed that the
binding of the first dimer, an energetically costly step, locks the 28 bp operator DNA
into an unwound conformation, which is ready for the binding of the second QacR
dimer (Schumacher et al., 2002).
The two monomers of QacR dimer at each side of the operator DNA recognize
different bases and have been taken as distal and proximal monomers, depending on
the distances to the dyad (Schumacher et al., 2002) (Figure 1.11a). Proximal
monomers make base-sepecific interactions with the 28 bp operator, while distal
monomers make several base and phosphate contacts (Figure 1.11) (Schumacher et
al., 2002). Two QacR dimers have 16 base and 44 phosphate contacts with the 28 bp
dsDNA. The central six base pairs provide the appropriate spacing for QacR and the
addition to or removal of two base pairs from this 6 bp spacer abolishes QacR
binding. In addition, the four base pairs at the two ends of the DNA duplex could
function as over hang bases for the crystal package, as there is no contact between
them and QacR.
1.10.2.2 Drug binding sites of QacR
QacR binds different monovalent and bivalent cationic lipophilic compounds, which
are also substrates of the efflux pump QacA (Murray et al., 2004; Schumacher et al.,
2001; Schumacher et al., 2004). According to the structures of QacR bound to six
drugs individually (Rhodamine 6G, R6G; Ethidium Et; Dequalinium, Dq; Crystal
Violet, CV; Malachite Green, MG; and Berberine, Be), the drug-binding pocket of
QacR was divided into two sites: the Et pocket and the R6G pocket (Schumacher et
al., 2001).
Drug binding induces a coil-to-helix transition of residues Thr89-Tyr93 that results
in the expulsion of Tyr92 and Tyr93 from the hydrophobic interior of the protein to
the solvent and the formation of the expansive drug-binding pocket, which plays an
important function in drug binding (Schumacher et al., 2001). Tyr92 and Tyr93 also
stabilize the drug-binding pocket of QacR when no drugs are bound to QacR

49
(Schumacher et al., 2001). These functions of Tyr92 and Tyr93 are in agreement
with the concept that aromatic residues are critical in drug binding and essential for
the construction of the drug binding pocket (Schumacher et al., 2004).
The coil-to-helix transition triggered by drug binding elongates the C-terminus of 5
by a turn, and thus relocates 6 and its tethered DNA-binding domain. Similar to
TetR drug induction, upon drug binding, 4 has a pendulum motion and the center-
to-center distance of the recognition helices increases to 48 Å from 37 Å of the
DNA-bound form.
The positively charged ethyl ammonium groups of drugs are neutralized by
negatively charged glutamate: Glu90 in the QacR-R6G complex; Glu57, Glu58 and
Glu120 in the QacR-Dq complex; Glu90 and Glu120 in QacR-CV complex and
QacR-MG complex; Glu57 and Glu58 in QacR-Be complex; and Glu120 in QacR-Et
complex serves this function (Schumacher et al., 2001).
In the crystals of the QacR-diamidine complex, a novel drug charge neutralization
was proposed (Murray et al., 2004): not only is glutamate involved in the
neutralization of positively charged drugs, but the oxygen atoms of a carbonyl and
side chain also serve the same function (Murray et al., 2004).
In the ternary QacR-Pf-Et compex, Pf is still bound in the R6G pocket, and protein-
drug contacts are similar to those in QacR-Pf binary complex, with stacking against
the aromatic side chains of residue Trp61 and Tyr103, hydrogen bonding with Gln96
and Thr89, and ionic interactions with the side chains of residues Glu57 and Glu58.
However, Et slides into a new position, close to the binding sites of QacR-Et binary
complex. In the new location, Et interacts with Pf through van der Waals interactions.
Figure 1.12 shows the structures of QacR-Pf-Et and QacR-R6G.

50
Figure 1.12 The structure of the ternary QacR-pf-Et and QacR-R6G a: A ribbon diagram of the QacR-pf-Et ternary complex; the nine helices are
numbered and the pf and Et are presented as yellow and red sticks respectively. b:
The superimposition of QacR DNA-bound conformation (yellow) and QacR drug
binding conformation (blue). The coil-to-helix transition is illustrated. The location
of rhodamine 6G (red) in the drug-bound structure is indicated, as are 4 to 9, the
HTH recognition helix (Hr), and the N and C termini of the protein (Schumacher and
Brennan, 2002; Schumacher et al., 2002).
In the TetR family repressors of multidrug efflux pumps, besides the structures of
QacR and TetR, the crystal structures of AcrR, CmeR and SmeT have been
determined. Furthermore, EthR is a well studied regulator in the TetR family and its
structure provides a new clue to develop drugs for the therapy of tuberculosis
(Frenois et al., 2004); MtrR is a regulator of the MtrCDE efflux pump in Neisseria
gonorrhoeae, but could act as a global regulator (Folster and Shafer, 2005; Folster et
al., 2007).
1.10.3 AcrR
AcrR, the transcriptional repressor of AcrAB multidrug efflux pump in E. coli, has a
three helix DNA-binding domain, and a diverse C-terminal drug binding domain,
forming the ligand-binding sites (Li et al., 2007). The AcrAB pump, which belongs
to the RND efflux pump family, acts with the outer membrane protein TolC, to
assemble a tripartite drug efflux pump and thus expels antibacterial agents (Touze et
al., 2004). The 2 and 3 of AcrR form a typical helix-turn-helix motif, which is
well conserved among members of the TetR family (Li et al., 2007). The
a b

51
dimerization of AcrR involes mainly 8 and 9. The C-terminal drug binding
domain of AcrR forms a large internal cavity for drug binding located at the center of
the binding pocket (Li et al., 2007). Figure 1.13 shows a ribbon diagram of the AcrR
homodimer.
Figure 1.13 Ribbon diagram of the AcrR homodimer (PDB code: 2QOP) generated
by crystallographic symmetry (Li et al., 2007). The nine helices are numbered. The
figure was prepared using PyMOL (DeLano, 2002).
1.10.4 CmeR
CmeR, a member of TetR transcriptional regulator family, represses the
transcriptional expression of CmeABC in Campylobacter jejuni (Cagliero et al.,
2007; Gu et al., 2007; Lin et al., 2005a and b). The CmeABC pump, a RND type
efflux pump, functions in the export of antimicrobial agents and bile resistance,
which is essential for Campylobacter colonization of the animal intestinal tract (Lin
et al., 2005a and b). The cyrstal structure of CmeR revealed that the N-terminal DNA
α1
α2
α3
α4a
α4b
α5
α6
α7 α8
α9

52
binding domain and C-terminal drug binding domain are similar to other members of
the TetR family (Gu et al., 2007). However, one of the critical characteristics for
DNA binding in this family, the HTH motif usually consists of 2 and 3, is found
to be deficient in 3 in CmeR (Gu et al., 2007). The expected 3 region forms a
random coil, rather than an helix (Gu et al., 2007). The C-terminal drug binding
domain of CmeR encompasses helices 4-10 (Gu et al., 2007). Helices 6, 8, 9 and 10
contribute to the dimerization of CmeR. There is a large tunnel-like cavity in the C-
terminal drug binding domain of CmeR, which is about 20 Ǻ long (Gu et al., 2007).
Figure 1.14 shows a ribbon diagram of the AcrR homodimer.
Figure 1.14 Ribbon diagram of the CmeR dimer (PDB code: 2QCO) generated by
crystallographic symmetry (Gu et al., 2007). The ten helices are numbered. The
figure was prepared using PyMOL (DeLano, 2002).
α1
α2
α4
α5
α6
α7
α8
α10 α9

53
1.10.5 SmeT
SmeT is the repressor of the multidrug efflux pump SmeDEF in Stenotrophomonas
maltophilia (Hernandez et al., 2009; Sanchez et al., 2002). Similar to other members
of TetR family, SmeT has an N-terminal HTH DNA binding domain and a C-
terminal dimerization and ligand binding domain (Hernandez et al., 2009). The two
subunits of the SmeT dimer in the crystal are different (Hernandez et al., 2009).
There is an unknown ligand occupying the ligand pocket in subunit A but no putative
ligand for subunit B (Hernandez et al., 2009). The binding of the unknown ligand in
subunit A stabilizes its N-terminus, whereas in subunit B the DNA-binding domain is
almost completely disordered (Hernandez et al., 2009). Figure 1.15 shows a ribbon
diagram of the SmeT dimer. DNase I footpringting assays show SmeT binds to a 28-
bp pseudopalindromic region, which overlap the promoters of smeT and smeDEF,
indicating the function of SmeT in simultaneously regulating smeT and smeDEF
transcription (Hernandez et al., 2009).
Figure 1.15 Ribbon diagram of the SmeT dimer (Hernandez et al., 2009; PDB code:
2W53). The nine helices are numbered. The figure was prepared using PyMOL
(DeLano, 2002).
α1
α2
α3 α4
α5
α6
α7
α8 α9

54
1.10.6 EthR
EthR, a member of TetR transcriptional regulator family, binds the ethA promoter
region and inhibits the expression of ethA in Mycobacterium tuberculosis (Dover et
al., 2004). EthA is a FAD-containing enzyme that catalyses two steps in the
activation of ethionamide (ETH), which is the major antituberculosis drug, and thus
the repression of ethA expression by EthR affects the therapy of tuberculosis by ETH
(Dover et al., 2004; Engohang-Ndong et al., 2004; Frenois et al., 2004). EthR exists
as a dimer in solution. Unlike QacR, TetR and other regulators in TetR family, EthR
binds cooperatively to the 55bp operator as octamer (Engohang-Ndong et al., 2004).
The octamerization of EthR requires the presence of the operator DNA (Engohang-
Ndong et al., 2004). The crystal structure of EthR expressed and purified from E.
coli shows EthR is unexpectedly bound with hexadecyl octanoate (HexOc), which
provides a new clue to develop drugs for the therapy of tuberculosis (Frenois et al.,
2004). Figure 1.16 shows a ribbon diagram of the EthR dimer.
Figure 1.16 Ribbon drawing of the EthR dimer (Frenois et al., 2004; PDB code:
1U9N) generated by crystallographic symmetry. The nine helices are numbered and
the ligand HexOc is shown in a stick model. The figure was prepared using PyMOL
(DeLano, 2002).
α1
α2
α3 α4
α7
α5
α6 α9
α8

55
1.10.7 MtrR
MtrR, a member of TetR transcriptional regulator family, represses the transcription
of the MtrCDE efflux pump in Neisseria gonorrhoeae (Hoffmann et al., 2005; Lucas
et al., 1997). The MtrCDE pump, an RND family export pump, confers the
resistance of gonococci to several antimicrobials. The intergenic sequence between
the mtrR and mtrC genes is bound by MtrR was confirmed by gel mobility shift and
DNase I footprint assays (Lucas et al., 1997). In the DNA binding assay, higher salt
(200 mM NaCl) affected the binding affinity, compared with lower salt 100 mM
NaCl (Hoffmann et al., 2005).
MtrR also indirectly regulates the farAB-encoded efflux pump, which confers N.
gonorrhoeae resistance to fatty acids (Lee et al., 2003). The FarAB pump consists of
the FarA membrane fusion protein and the FarB cytoplasmic membrane transporter
protein, which act with the outer membrane channel MtrE (Lee et al., 2003). The
FarAB pump is regulated by the transcriptional repressor FarR, a member of the
MarR family (Lee et al., 2003). MtrR was reported to bind to the FarR promoter and
repress the expression of FarR (Lee et al., 2003). Thus, MtrR would positively
regulate the FarAB pump through inhibition of the expression of the FarR repressor
(Lee et al., 2003).
In addition, MtrR was reported to regulate ponA, which encodes penicillin-binding
protein 1, the pilMNOPQ operon, which encodes components of the type IV pilus
secretion system, and mtrF, which encodes MtrF that acts in conjunction with the
MtrCDE pump to confer gonococci resistance to certain drugs, indicating MtrR
could act as a global regulator (Folster and Shafer, 2005; Folster et al., 2007).
1.10.8 VceR
Vibrio cholerae is the causative agent of cholera, which is characterized by a severe
watery diarrhea, through colonizing the small intestine and producing cholera toxin
(Faruque et al., 1998). Multi-drug resistant V. cholerae, which were first reported in
1980, has been a leading cause of cholera outbreak in the following two decades
(Glass et al., 1980; Faruque et al., 1998). The active expulsion of antibiotics,
catalyzed by efflux pumps, is an important resistance mechanism in V. cholera

56
(Faruque and Nair, 2008) and consequently the study of these efflux pumps and their
regulation could contribute to combating multidrug resistant V. cholerae.
The vceCAB genes of V. cholerae encode a tripartite drug pump that consists of an
inner-membrane protein (IMP) VceB, a periplasmic membrane fusion protein (MFP)
VceA and an outer-membrane protein (OMP) VceC, which is a homologue of the
EmrAB/TolC multiple-drug resistance transporter found in E. coli (Borges-Walmsley
et al., 2005; Federici et al., 2005; Woolley et al., 2005).
VceR, which belongs to the TetR family of transcriptional regulators, negatively
regulates the vceCAB operon, by binding to a 28 bp inverted-repeat within the vceR-
vceC intergenic region (Borges-Walmsley et al., 2003). Using size-exclusion
chromatography (SEC) and dynamic light-scattering, VceR was shown to bind the
vce promoter as a tetramer. It is thought that VceR binds the vce promoter in a
similar manner to the binding of QacR to the qacA promoter, which binds a pair of
homodimers to a 28 bp inverted repeat within the promoter.
The role of the vceR-vceABC operon in conferring antibiotic resistance has been
established from several studies. Knocking-out vceR in V. cholerae increased the
resistance of the cells to CCCP (carbonyl cyanide m-chlorophenyl-hydrazone) and
deoxycholate (Alatoom, et al., 2007). On the other hand, a plasmid carrying the
vceAB genes conferred resistance to CCCP, DOC, rifampicin, erythromycin,
nalidixic acid and chloramphenicol in E. coli. The repressor VceR also binds CCCP
that is the substrate of the VceCAB pump, inducing its release from the vceCAB
promoter and allowing expression of the VceABC pump (Borges-Walmsley et al.,
2005). Figure 1.17 shows the the vceCAB operon and the vceR-vceC intergenic
region.

57
Figure 1.17 Schematic representation of the vceRCAB operon. The 120 bp
intergenic region is shown with vceR and vceC genes italicised. Predicted
transcription signals are underlined and marker -35 and -10 with transcript initiation.
28bp duplex bound by VceR is indicated in bold (Borges-Walmsley et al., 2005).
Our knowledge of the repression and derepression mechanism of TetR family has
largely come from structural studies of individual proteins and the TetR/DNA and
QacR/DNA complexes (described in Section 1.20). In spite of the overall structural
similarity of TetR and QacR, the induction mechanism and the mode of DNA
recognition varies greatly in the TetR family. TetR binds as a dimer to a 15 bp
inverted repeat, whilst QacR binds as a pair of dimers to a 28 bp inverted repeat.
There would be value in determining the structure for additional members of the
family, to obtain further information on the mechanism of operation. VceR shares
low sequence identity with QacR (17.7%) and TetR (14.7%); and consequently the
determination of the VceR/DNA complex structure could expand our understanding
of the transcriptional repression mechanism in the TetR family. In addition, this
complex structure could also reveal the drug binding domain of VceR, which has not
been determined. Furthermore, the structure of the VceR/DNA complex might be
useful in the design of small molecules to switch-off the expression of the drug pump
as a strategy in combating drug resistance in V. cholerae.

58
Chapter 2 Material and Method
2.1 Computational methods
Adobe Photoshop was used for modification of diagrams/illustrations. Vector NTI
Advance 10 (Invitrogen), was used for the analysis, and design of oligonucleotides
and for the construction of alignments of DNA and protein sequences for comparison.
The National Center for Biotechnology Information (NCBI,
http://www.ncbi.nlm.nih.gov) was used as a resource for structural, functional and
comparative analysis of genomes. The Protein Data Bank (http://www.RCSB.org)
was used as a resource for protein structures.
A secondary structure prediction server, NPS@ HNN secondary structure prediction
(http://npsa-pbil.ibcp.fr/cgi-bin/npsa_automat.pl?page=/NPSA/npsa_hnn.html) was
used to predict the secondary structure.
2.2 Media, antibiotics and reagents
General chemical reagents such as salts with analytical purity grade were acquired
from Sigma (UK). Detergents n-dodecyl-β-D maltoside (DDM) and 10% Triton were
purchased from Calbiochem. Reductive reagents Tris hydroxypropyl phosphine
(THP) was purchased from Novagen and dithiothreitol (DTT) was purchased from
Melford.
2.2.1 Bacterial medium

59
The following bacterial media were prepared as described below and sterilised by
autoclaving at 121oC for 20 min.
Luria-Bertani medium
Tryptone (Oxoid) 10 g
Yeast extract (Oxoid) 5 g
NaCl 10 g
dH2O To 1000 ml
Luria-Bertani agar
LB medium 1 litre
Agar (Merck) 15 g
2X YT broth
Tryptone (Oxoid) 16 g
Yeast extract (Oxoid) 10 g
NaCl 5 g
dH2O To 1000 ml
SOC medium
Tryptone (Oxoid) 4 g
Yeast extract (Oxoid) 1 g
NaCl 0.117 g
KCl 0.0373 g
dH2O To 200 ml
After autoclaving, the following components were added:
1 M MgCl2•6H2O 2 ml
1 M MgSO4 2 ml
2.2.2 Antibiotics
Antibiotic stock solutions
Antibiotic Concentration Working
concentration Manufacturer
Carbenicillin
disodium 100 mg/ml in dH2O 100 µg/ml
Melford
laboratories
All antibiotics were filter-sterilised, with a 0.2 µm filter, and stored in 1 ml aliquots
at -20oC

60
2.2.3 Reagents
Reagent stock solutions
Reagent Concentration Manufacturer
IPTG 1 M in dH2O Melford laboratories
IPTG 200 mg/ml in dH2O Melford laboratories
X-gal 20 mg/ml in N,N‘ –
dimethylformamide (DMF) Melford laboratories
L-arabinose 20% in dH2O Sigma
IPTG and L-arabinose were filter-sterilised, with a 0.2 µm filter, and stored
in 1 ml aliquots at -20oC
2.3 Bacterial strains and plasmids
The bacterial strains and plasmids used in this study are listed in Table 2.1.
Cryogenic stocks were generated by mixing 800 l of an overnight culture with 200
l of sterile 80% glycerol in sterile 2 ml cryogenic vials and stored at -80oC. Samples
were retrieved by scraping and streaking a small amount of the frozen stock, with a
sterile loop, and then plating onto solid growth medium for incubation at 37oC
overnight.
Table 2.1 Bacterial strains
Strain Key feature(s) Source/Reference
E. coli NovaBlue (DE3)
endA1 hsdR17 (rk12-mk12+)
supE44 thi-1 recA1
gyrA96 relA1 lac
[F‘proA+B
+
lacIqZΔM15::Tn10(tet
R)];
for cloning, plasmid preps
Novagen
E. coli BL21 (DE3) F- ompT hsdSB(rB
-mB) gal
dcm met (DE3); for protein
expression
Novagen
XL10-Gold TetR Δ (mcrA) 183 Δ
(mcrCB-hsdSMR-mrr)
173 endA1 supE44 thi-1
recA1 gyrA96 relA1 lac
Hte [F‘ proAB
laclqZΔM15 Tn10 (Tet
R)
Amy CamR]
a
Stratagene

61
Table 2.2 Plasmids
Plasmid Key feature(s) Source/Reference
pGEM-T easy Ampicillin resistance; for
TA cloning
Promega
pET21a(+) N-terminal T7-tag and C-
terminal His6-tag; For
protein expression;
Ampicillin resistance.
Novagen
VceR-His6-pET21a(+) vceR ligated with
pET21a(+) using NdeI and
XhoI restriction
endonuclease sites with C-
terminal His6-Tag, for
VceR-His6 expression
Borges-Walmsley et al.,
2005
2.4 Cloning genes to pGEM-T easy vector
2.4.1 DNA amplification by PCR (polymerase chain reaction)
PCR (polymerase chain reaction) was used to amplify genes from genomic DNA or
to certify inserted genes in plasmids used in this study. Primers (Table 2.2) were
designed with restriction endonuclease sites and synthesized by Invitrogen. Usually,
primers were reconstituted in distilled water to a concentration of 50 pmol/µl.
Table 2.3 The oligonucleotides for PCR used in this study.
Oligonucleotide Sequence
NdeI- hpa1
Forward* CAT ATG AAT TCT TTG AAC ACA CAA TTC GGC
XhoI- hpa1
Reverse CTC GAG CTG CAT CGA TCC GCT GTC GTT CG
NdeI-163-414-
hpa1 Forward CAT ATG CAG CCG AAC AAA AAT GCT GAG GAA GG
XhoI-1-158-hpa1
Reverse CTC GAG GCC ATT CTC CTT CCC GGC CTG CTG
*Note: Sequences in bold indicate restriction endonuclease sites.
PCR was carried out according to the manual of the product providers. A typical
reaction composition is given below.

62
Master mix Component Volume (μl) Final concentration
10xPCR Buffer
(containing 15 mM
MgCl2)
5 1x
dNTP mix (10 mM of
each)
1.5 200 μM of each dNTP
F primer 1 50 pmol/μl
R primer 1 50 pmol/μl
HotStar Taq DNA
Polymerase (Qiagen)
0.5 2.5 units/reaction
Distilled water (dH2O) 41 -
Colony DNA Variable ≤1 μg/reaction
Total volume 50 -
A thermal cycler (Eppendorf mastercycler gradient) was programmed for the PCR
reaction as follows:
Cycle Temperature Time
Activation of HotStar Taq
DNA polymerase
95oC 15 min
Denaturation 94oC 1 min
Annealing 58oC 1 min
Extension 72oC 50 sec
Number of cycles 34
Final extension 72oC 10 min
Hold 4oC Indefinitely
The amplified DNA samples were stored at -20oC.
2.4.2 Gel electrophoresis
For positive identification of the DNA, 10 μl of the amplified DNA plus 2 μl of a 6x
DNA loading buffer, together with a 1 kb DNA marker (Invitrogen) was loaded on a
1% agarose gel containing ethidium bromide and electrophoresed for 35 minutes at
120 volts. The gel was visualised on a UV transilluminator (Gene, BioImaging
System, Syngene) equipped with a camera to capture an image of the gel.

63
DNA Gels
1% Agarose gel
Laboratory grade agarose 1%
Ethidium bromide 0.004%
1x TAE buffer 100%
DNA Buffers
1x TAE buffer
Tris-HCl 4.84 g
Acetic acid 1.142 ml
0.5 mM EDTA 2 ml
dH2O To 1000 ml
6x DNA loading buffer
Bromophenol blue 0.025 g
100% Glycerol 3 ml
dH2O 7 ml
2.4.3 Gel extraction of DNA
The DNA was excised from the gel and 300 μl buffer QG from QIA quick gel
extraction kit was mixed with it. After 10 min incubation at 50oC, dissolved gel was
loaded to QIAquick spin column and centrifuged for 1 min. 0.75 ml buffer PE was
added to QIAquick column and centrifuged for 1 min. Finally, 50 μl buffer EB (10
mM Tris-Cl, pH 8.5) was used to elute the DNA from the column.
2.4.4 Ligation into pGEM-T easy vector (Promega)
All components were added, in order as listed below, to a 0.5 ml microcentrifuge
tube. The ligation mixture was stored at 4oC overnight (for maximum transformants)
for transformation the following day.

64
Component Volume (μl)
2 x Ligation buffer 7.5
pGEM-T easy vector 1.5
PCR product 4.5
T4 DNA ligase 1.5
Total Volume = 15 μl
2.4.5 Preparation of chemically competent E. coli
A chemical method for the induction of competence in E. coli is described as follows.
A single colony was used to inoculate 5ml liquid LB medium and incubated
overnight at 37oC with 225 rpm rotary agitation. A millilitre of overnight culture was
used to inoculate 50 ml of pre-warmed liquid LB medium in a 250 ml flask. The cells
were incubated at 37oC with 220 rpm rotary agitation until an optical density at 600
nm (OD600) of 0.5 was reached. The culture was cooled on ice for 5 minutes,
harvested at 4,000×g for 5 minutes at 4oC and the supernatant carefully discarded.
The bacterial cell pellet was resuspended in 30 ml cold, sterile TFB1 buffer and the
suspension kept on ice for 90 minutes. The cells were harvested at 4,000×g for 5
minutes at 4oC, and the supernatant discarded. The cell pellet was resuspended in 2
ml cold TFB2 buffer and kept on ice for a further 45 minutes. Following this
incubation period, competent cells were harvested furthermore as described
previously and resuspended in 2 ml cold TFB2 buffer. Aliquots of 50 l were
transferred to 1.5 ml microcentrifuge tubes and flash frozen in a dry ice/ ethanol bath.
Chemically competent cells were stored at -80oC.
TFB1 buffer – 100 mM rubidium chloride, 50 mM manganese chloride, 30 mM
potassium acetate, 10 mM calcium chloride, 15% glycerol, pH 5.8.
TFB2 buffer- 10 mM MOPS, 10 mM rubidium chloride, 75 mM calcium chloride,
15% glycerol, pH 6.8.
2.4.6 E. coli strain NovaBlue transformation
4 μl of the pGEM-T-gene ligation mixture was added to a 50 μl aliquot of NovaBlue
competent cells (prepared as section 2.4.5). The transformation mixture was
incubated on ice for 30 min, a 42oC water bath for 50 seconds, and incubated on ice

65
for a further 2 min. 250 μl of SOC medium was added to the cells and incubated at
37oC with 250 rpm shaking for 90 minutes. 100 μl of cells were spread onto
LB/carbenicillin (LB/Carb) medium (plus IPTG [200 mg/ml] and X-gal [20 mg/ml])
and incubated at 37oC overnight.
Plates from the above transformation were stored at 4oC for 3 hours to allow the
blue/white colour in the colonies to fully develop. Blue colonies contained active
galactosidase whilst the white colonies were thought to harbour the recombinant
plasmids. Nine white colonies were re-streaked onto an LB/Carb plate and incubated
at 37oC overnight for PCR identification of positive recombinants the following day.
2.4.7 Purification of plasmid DNA [pGEM-T-easy-gene]
Overnight cultures of E. coli NovaBlue were harvested by centrifugation (Jouan
CR3i centrifuge) at 4,000 rpm for 10 minutes at 4oC. Plasmid DNA was prepared as
instructed in the QIA prep®
Miniprep Handbook. The eluted plasmid DNA was
stored on ice or at -20oC.
10 μl of the pGEM-T-easy-gene plasmid was sent to the University of Durham (DBS
Genomics) to ensure sequence integrity. The sequencing result was aligned with the
original gene sequence using Vector NTI Advance 10 (Invitrogen).
2.5 Subcloning of desired genes into pET21a(+) for protein expression
2.5.1 Restriction enzymes digestion of pGEM-T-easy-gene and pET21a (+)
The components, as listed below, were added to a 0.5 ml microcentrifuge tube and
incubated at 37oC for 3 hours. The restriction endonuclease I and restriction
endonuclease II (Promega) were then heat inactivated at 65oC for 15 min. The
samples were stored at 4oC.

66
pGEM-T-easy-gene
Component Volume (μl)
dH2O 4.5
10x Buffer 5
Bovine serum albumin (BSA) 0.5
Restriction endonuclease I 2.5
Restriction endonuclease II 2.5
pGEM-T-gene 25
Total volume = 40 μl
pET21a(+)
Component Volume (μl)
dH2O 15.5
10x Buffer 5
BSA 0.5
Restriction endonuclease I 2
Restriction endonuclease II 2
pET21a(+) 25
Total volume = 50 μl
2.5.2 Identification and purification of DNA and linear pET21a (+)
Performed as described in sections 2.4.2 and 2.4.3.
2.5.3 Ligation of pET21a(+) and desired DNA
All components were added, in order as listed below, to a 0.5 ml microcentrifuge
tube. The ligation mixture was stored at 4oC for 12 hours (for maximum
transformants) for transformation the following day.
Component Volume (μl)
10 x Ligation buffer 1.5
pGEM-T easy vector 1.5
PCR product 4.5
T4 DNA ligase 1.5
Total volume = 15 μl
2.5.4 E. coli strain NovaBlue transformation with pET21a (+)-gene
Performed as described in section 2.4.6 with the following changes:

67
5 μl of pET21a(+)-gene was added to 150 μl of competent E. coli NovaBlue cells
(prepared as section 2.4.5); 1 ml of SOC medium was added following heat shock
and no blue/white selection was required.
2.5.5 Analysis of putative pET21a (+)-gene colonies by PCR
Performed as described in sections 2.4.1 and 2.4.2
2.6 Site directed mutagenesis
The in vitro site directed mutagenesis experiments in this thesis were performed as
described using the QuikChange site-directed and multi site-directed mutagenesis
system (Stratgene). The mutagenic primers were designed to incorporate a centrally
located desired point mutation in specific amino acid sites (Table 2.4).
Table 2.4 Mutagenic oligonucleotides used for site directed mutagenesis.
Oligonucleotide Sequence
hpa1-C47S
Forward* 5‘-CTGGACCAGTTGCTGAGCCAGCTCATCCAGGCCCTG -3‘
hpa1-C47S
Reverse 5‘-CAGGGCCTGGATGAGCTGGCTCAGCAACTGGTCCAG-3‘
vceR-C148S-
Forward 5‘-TGTGGTTCATTGAAAGAGAGCGATCCTTGGATCGCC-3‘
vceR-C148S-
Reverse 5‘GGCGATCCAAGGATCGCTCTCTTTCAATGAACCACA-3‘
vceR-C138S-
C142S-Forward
5‘-GTCGCTACATTACGTCGCAAATTGAAAGCGGTTCAC
TGAAAGAG-3‘
vceR-C138S-
C142S-Reverse
5‘-CTCTTTCAGTGAACCGCTTTCAATTTGCGACGTAATGT
AGCGAC-3‘
vceR-H156R-
Forward 5‘-CCTTGGATCGCCGCCATGAGATTCAAAGCGTTGCTA-3‘
vceR-H156R-
Reverse 5‘-TAGCAACGCTTTGAATCTCATGGCGGCGATCCAAGG-3‘
*Note: Sequences in bold indicate mutation sites.

68
Mutant strand synthesis reaction was carried out according to the manual of the kit.
A typical reaction composition is given below.
Master mix Component Volume (μl) Final concentration
10x reaction buffer 5 1x
dNTP mix 1 200 μM of each dNTP
F primer 1.25 2.5 ng/μl
R primer 1.25 2.5 ng/μl
PfuTurbo DNA
polymerase
1 0.05 units/reaction
dsDNA template X μl (5-50 ng) -
Distilled water (dH2O) Variable
Total volume 50 -
A thermal cycler (Eppendorf mastercycler gradient) was programmed for
mutagenesis reaction as follows:
Cycles Temperature Time
1 95 oC 30 seconds
12-18 95oC 30 seconds
55oC 1 min
68oC 1 minute/kb of plasmid
length
Dpn I restriction enzyme was added to the mutagenesis reaction to digest the parental
supercoiled dsDNA. The Dpn I-treated DNA was transformed into XL1-Blue
supercompetent cells for site-directed mutagenesis or XL1-Gold supercompetent
cells for multi site-directed mutagenesis. The desired mutation was sequenced for the
final usage.
2.7 Protein expression, purification and visualization
2.7.1 Expression of cloned genes in E. coli BL21 (DE3)
A single colony from a freshly streaked plate was picked and inoculated into 100 ml
LB broth containing the appropriate antibiotic(s) in a 250 ml flask. The cells were
grown in an orbital shaker at 37 o
C, 220 r.p.m. overnight. One litre of prewarmed
2×YT broth (with antibiotic) in a 2 litre baffled flask was inoculated with 5 ml of the
overnight cultures. 6 litres of the cells were grown in an orbital shaker at 37 oC, 220

69
rpm. The cells were induced at mid log phase (approx. A600=0.5-0.6) with 0.5 mM
IPTG. The temperature was dropped to 30 o
C and the growth was continued with
shaking at 200 rpm for 5 hours for soluble proteins or overnight for membrane
proteins. The cells were harvested by centrifugation and stored as a frozen pellet at -
80 oC or continued with purification.
2.7.2 Purification of His6-tagged proteins by Ni-NTA affinity chromatography
Frozen cell pellets were typically resuspended with 200 ml buffer (25 mM Tris-HCl,
300 mM NaCl, pH7.5). One EDTA-free protease inhibitor tablet (Roche Molecular
Biochemicals) was added to inhibit protease activity. The cells were lysed by
mechanical disruption in a constant cell disruption system (Constant Systems Ltd) at
a pressure of 27 kpsi two times. The cell lysate was fractionated into membrane and
soluble components by high-speed ultracentrifugation at 43,000 rpm for 1 hour
(Beckman Ti-50 rotor). For membrane proteins, the membrane pellet was
resuspended in buffer A and solubilised using 1% DDM. High-speed
ultracentrifugation at 43,000 rpm for 1 hour (Beckman Ti-50 rotor) was performed to
separate the soluble protein-detergent complex from membrane lipids.
The soluble component or soluble protein-detergent complex was, after high-speed
ultracentriguation, loaded onto a Ni-NTA column (GE Healthcare). The column was
washed with buffer containing 50 mM imidazole to remove contaminant proteins.
The protein was eluted with buffer containing 500 mM imidazole.
2.7.3 Purification of recombinant proteins by gel filtration chromatography
Gel filtration chromatography was used to purify the proteins, initially purified by
Ni-NTA affinity chromatography. HiLoad 16/60 Superdex 200 prep grade and
HiLoad 16/60 Superdex 75 prep grade columns (GE Healthcare) were used in this
study.
The column was equilibrated with three column volumes of dH2O at 30 cm/h (1
ml/min), and three column volumes of buffer at 30 cm/h (1 ml/min). The sample was
injected into the column and eluted with 1.5 column volumes of buffer. Purified
samples were collected on a fraction collector (GE Healthcare) for SDS-PAGE

70
analysis. After purification, the column was washed with 2 column volumes of dH2O
and then with 2 column volumes of 20% ethanol for long storage. All buffers and
water were filter-sterilised, with a 0.22 µm filter, and degassed.
2.7.4 Ion-exchange chromatography
Ion-exchange chromatography was also used to purify proteins and performed using
an AKTA purifier (GE Healthcare). A HiTrap Q HP 5 ml column (GE Healthcare)
was utilised in this study. The column was stored with 20% ethanol. Firstly, the
column was rinsed with five column volumes of dH2O and then equilibrated with
start buffer to change sample buffer into start buffer. Samples were pumped into the
column and washed with 3 column volumes of start buffer. A NaCl gradient elution
was performed with start buffer and elution buffer. Proteins were monitored by UV
280 nm and collected for SDS-PAGE analysis. All buffers and water were filter-
sterilised, with a 0.22 µm filter and degassed.
2.7.5 SDS-PAGE
All SDS-PAGE (Sodium dodecyl sulfate polyacrylamide gel electrophoresis)
experiments were performed using the NuPAGE® Novex pre-cast gels and XCell
SureLock mini-cell (Invitrogen). The NuPAGE® LDS sample buffer (4X) (Invitrogen)
was used for preparing samples for denaturing gel electrophoresis with the
NuPAGE®
gels. SeeBlue®
prestained standard (Invitrogen) was added to the gels to
indicate the molecular weight of the proteins. After electrophoresis in MES buffer,
gels were incubated in a staining container containing 100 ml of staining buffer and
gently shaken for 30 minutes at room temperature on an orbital shaker. The stain
buffer was decanted and the gel was rinsed once with deionized water. Then the gel
was placed in a staining container with 100 ml of destain buffer and gently shaken at
room temperature on an orbital shaker until the desired background was achieved.

71
MES buffer
MES 9.76 g
Tris-base 6.05 g
SDS 1 g
EDTA 0.29 g
Add dH2O to 1 L
Protein staining solutions
Coomassie blue stain buffer
Acetic acid 33%
Methanol 33%
dH2O 33%
Coomassie brilliant blue R-250 0.1%
Destain buffer
Acetic acid 10%
Methanol 10%
dH2O 80%
2.7.6 Western blotting
Transfer buffer Wash buffer
Glycine 2.9 g 1 M Tris-HCl, pH 7.5 10 ml
Tris base 5.8 g 5 M NaCl 30 ml
Methanol 200 ml Tween 20 1 ml
SDS 0.37 g dH2O to 1000 ml
dH2O to 1000 ml
The protein samples were run with SeeBlue markers (Invitrogen) on NuPAGE®
Novex pre-cast gels. The gel was soaked in the methanol-transfer buffer for 15-30
minutes. The blotting cassette holds the gel and the PVDF membrane
(Polyvinylidene fluoride, 0.2 µm, Bio-Rad) while a nylon sponge and of the
Whatman chromatography paper (3 MM) on both sides provide complete contact
within the gel sandwich. The cassette was inserted vertically into the blotting tank.
The blotting tank was topped up with transfer buffer and electroblotted at 170 mA
for 1 hour. Then the blotted gel was stained with coomassie blue stain buffer (section
2.7.5) to confirm successful transfer. The PVDF membrane was transferred to 25 ml
of blocking buffer (wash buffer plus 3% BSA) in a square Petri dish, the PVDF

72
membrane was blocked for 90 minutes at room temperature with gentle agitation,
and then was stored at a 4 oC overnight. The PVDF membrane was washed three
times with wash buffer at room temperature, for five minutes each time. The PVDF
membrane was incubated with the first antibody (1:3000 dilution) in 25 ml fresh
blocking buffer (wash buffer plus 0.5% BSA and 8 μl monoclonal antipolyhistidine
antibody, Sigma) at room temperature for 1 hour. The PVDF membrane was rinsed
in wash buffer three times, for 10 minutes each time, and incubated with the second
antibody (1:3000 dilution) in 25 ml fresh blocking buffer (wash buffer plus 0.5%
BSA and 8 μl goat anti-mouse IgG- AP [Alkaline Phosphatase conjugate], Sigma) at
room temperature for 1 hour. The PVDF membrane was rinsed in wash buffer three
times, for 10 minutes each time. The PVDF membrane was transferred to a sheet of
cling film and 2 ml substrate (Immun-StarTM
AP substrate, Bio-Rad) was added. The
PVDF membrane was wrapped with the film and left on bench for 5 minutes. The
PVDF membrane was transferred to between two sheets of plastic and taped around
four sides in an autorad cassette. In the dark room, a sheet of X-ray film was inserted
and left for 1 minute. An XO Graph imaging systems compact X4 film processor was
used to fix and develop the X-ray film.
2.7.7 Protein dialysis
Slide-A-Lyzer®
dialysis cassettes (Pierce) were utilized in this study to change the
protein buffer. Different cassette volumes of 0.1-0.5 ml, 0.5-3 ml or 3-15 ml were
selected according to the sample volume. The protein samples were collected with a
syringe and injected into hydrated cassettes, which were left in dialysis buffer with
gentle stirring at 4 o
C for 2 hours. This procedure was repeated after changing the
buffer once. Finally, the samples were recovered from the dialysis cassettes.
2.7.8 Protein concentrating
The protein samples were concentrated using the disposable ultrafiltration device
Vivaspin concentrators (Viva Science). The samples were pipetted into the
concentrators and spun (Beckman, Avanti™ J-20 XP, JA-10 rotator, 15 ml tube
adaptor) at low speed (usually 3000 g). Then the samples were recovered from the

73
bottom of the concentrating pocket with a pipette, once the desired concentration was
achieved.
2.7.9 Protein concentration determination
The BCA™ protein assay kit (Pierce) was used to determine the protein
concentration. The ‗test tube procedure‘ for this kit (Pierce) was adopted according
to the instructions, which was summarized as follows. 0.1 ml of each standard and
unknown protein sample and 2 ml of the reagent were added to each tube and mixed
well. The tubes were incubated at 37°C for 30 minutes and the 562 nm absorbance
measurement of each standard and protein sample was performed. A standard curve
was prepared by plotting the average 562 nm measurement for each BSA standard vs.
its concentration in μg/ml. Then the standard curve was used to determine the protein
concentration of each unknown sample.
2.8 Analytical gel filtration chromatography
The analytical gel filtration chromatography column Superdex 200 PC 3.2/30 column
(GE Healthcare), and high and low molecular weight gel filtration kits (GE
Healthcare) were used to determine the molecular weight of proteins. To determine
the Mr of proteins, a calibration curve was constructed (Microsoft Office Excel 2003),
using bovine serum albumin (62.9 kDa), ovalbumin (46.7 kDa), catalase (213 kDa)
and adolase (182 kDa) as standards for a plot of the log of the Mr of the standards
versus Kav. The Kav values of the protein standards were calculated as follows:
Kav= (Ve-Vo)/(Vt-Vo),
Ve = elution volume for the protein
Vo = column void volume
= elution volume for blue dextran 200 (From high and low molecular weight gel
filtration kits)
Vt = total bed volume, 2.4 ml for Superdex 200 PC 3.2/30 column

74
After purification, the column was rinsed with 3 column volumes of dH2O and then
with 2 column volumes of 20% ethanol for long storage. All buffers and water were
filter-sterilised, with a 0.22 µm filter, and degassed.
2.9 Peptide synthesis
Peptide 1 (H2N-ISEKQLDQLLCQLIQALL-COOH) and peptide 2 (H2N-
ASPLTQMLMNIVGEILQAQ-COOH) used in the study were synthesized, purified
and analysed by mass spectrometry by Genscript corporation (China).
2.10 Transmission electron microscopy
Transmission electron microscopy (TEM) was used to study fibril formation.
Purified protein or synthesized peptides were diluted to a low concentration; 10 µl
samples were loaded onto a carbon-coated grid (Agar scientific, UK) and incubated
at RT for 1 min. After drying, 1% uranyl acetate solution was used as stain, and
loaded to carbon-coated grids for 30 sec. Prepared samples were displayed under a
transmission electron microscope (TEM-H7600, Hitachi) at an accelerating voltage
of 100 keV.
2.11 Circular dichroism spectroscopy
Circular dichroism (CD) spectroscopy was used to study the secondary structure of
proteins. The spectra of prepared samples and the corresponding blanks were
recorded between 190 and 260 nm on a spectropolarimerter (Jasco J-810) using
quartz cells with a 2 mm path length at 27 oC. After the subtraction of the appropriate
blank, binominal smoothing was carried out within the Jasco Spectra analysis
program. The resulted spectra were analysized by program Selcon3 via Dichroweb
(Whitmore and Wallace, 2004). The protein reference set (dataset 4 from Dichroweb)
was used.
2.12 Congo red (CR) binding and chemical cross-linking

75
A Congo red binding assay was carried out as described previously (Oh et al., 2007).
Congo red (Sigma) was prepared in a buffer of 20 mM Tris-HCl pH 8.5, and 20 mM
NaCl. Absorbance spectra in the region between 400 and 700 nm were recorded for a
100 µM Hpa1 fibril and 20 µM Congo red mixture and for Cong red using a Jasco V-
550 spectrophotometer.
Proteins were dialyzed against the cross-linking buffer (20 mM Na2HPO4, pH 8.5,
100 mM NaCl) for 6 h. DSP (Dithiobis [succinimidyl propionate]) or EGS
(EthylGlycol bis [succinimidyl succinate]) was added to a final concentration of 0.5
mM. After incubation for 30 min at 37 o
C, 1 M Tris pH 8.5 was added to a
concentration of 20 mM to stop the reaction. The effect of Ca2+
and E. coli liposomes
on the oligomerization of Hpa1-His6 was tested, in the presence of 2 mM CaCl2 and
0.1 mg E. coli liposome, respectively and together. The samples were loaded onto a
12% SDS-PAGE gel and stained with coomassie brilliant blue.
2.13 Liposome disruption assay
1 ml of 10mg/ml E. coli polar lipid extract (Avanti®, component:
phosphatidylethanolamine, phosphatidylglycerol, cariolipin) was dried under the
steam of nitrogen to form a thin film. The dried lipid was rehydrated in 1ml of MES
buffers (20 mM MES, 20 mM NaCl, pH 6.5) by vortexing. The lipid was heated to
50 o
C for complete rehydration. The lipid was further passed through the extruder
(Avanti®) with 400 nM polycarbonate membrane filter (Whatman
®) at 50
oC to
produce unilamellar vesicles. 100 µM purified soluble Hpa1, N-terminal truncated
Hpa1 and peptide 2 were incubated with 500 µl 5 mg/ml liposomes, respectively, for
6 h at room temperature.
For membrane protein reconstitution into membrane, 10% Triton X-100
(Calbiochem®
) was added to the liposome with a final molarity of 1.5 mM. 100 µl of
0.4 mg/ml protein sample was added to 1 ml of 2 mg/ml destabilized liposomes to
give a final lipid to protein ratio of 50:1 (w/w) and incubated with shaking at 25 o
C
for 15 min. 40 mg Bio-bead SM-2 absorbent (Bio-Rad®) was added to the protein
and liposome solution and shook at 25 oC for 30 min. The solution was removed and
transferred to a 1.5 ml micro-centrifuge tube containing 80 mg Bio-beads and

76
incubated at 25 o
C for 60 min with shaking. This step was repeated and incubated at
4 oC overnight. The proteoliposomes were pelleted by centrifugation at 43000 rpm at
4 oC for 1 hour and resuspended in 0.5 ml phosphate buffer.
Liposomes disrupted by soluble Hpa1, N-terminal truncated Hpa1 and peptide 2, and
the resuspended proteoliposome of Hpa1 and C47S were displayed under a
transmission electron microscope (TEM-H7600, Hitachi) at an accelerating voltage
of 100 keV by the negative staining with a 1% uranyl acetate solution on carbon-
coated grids (Agar scientific, UK) (section 2.10).
For sucrose gradient centrifugation, a 500 µL sample (protein-liposome mixture) was
mixed with 3.5 ml 70% (w/w) sucrose and subsequently by overlaying 6.5 ml 55%
and 2 ml 10% sucrose solution onto the protein-liposme-sucrose mixture.
Centrifugation was performed in a Beckman SW55 rotor at 32 000 r.p.m. for 16 h at
4 o
C. Fractions were collected from the 70% and 10% sucrose layers and aliquots
were separated by 12.5% SDS/PAGE. The bands were detected with coomassie blue
staining.
2.14 Protein crystallization
The purified, concentrated and quantified protein was submitted to crystallization
trials. The screening was performed by Screenmaker from Innovadyne. 85 µl
crystallization buffer was transferred into a reservoir and two sitting drops were set
up, 200 nl complex plus 100 nl precipitating solution and 100 nl complex plus 100 nl
precipitating solution.
Kits used for VceR/dsDNA co-crystallization screen:
(1) Cryo I & II from Emerald
(2) JCSG-plus from Molecular Dimensions
(3) The PEGs suite from Qiagen
(4) Clear strategy screen from Molecular Dimensions
For crystallization condition optimization, the experiments were set up manually
according to the hanging drop vapour diffusion method, using a 24 well plate (24

77
crystallization buffer wells) with 24 crystallization supports (six protein wells for
holding crystallization buffers and proteins), or the sitting drop vapour diffusion
method using a 24 well plate with bridge and cover slip. All the buffers and
precipitants were purchased from Sigma, Fluka and Hampton. An additive kit was
obtained from Hampton.
Crystallization solution (0.5ml) was pipetted to the bottom of the plate well. 1µl
protein sample and 2 µl crystallization buffer were mixed and the mixture was
transferred to the protein well of the crystallization support. The crystallization
support was screwed into place above the well from which the crystallization buffer
was taken. The crystallization trial plates were incubated at 20 o
C, 18 o
C or 4 o
C
(Cooled Incubators, Rumed®) for two weeks or longer, depending on the growth rate
of crystals. Stereo zoom microscope (Leica, MZ125) was used in this study to
observe the crystals. A digital camera (Nikon, coolpix 4500) was used to take photos
of crystals.
An additive screen kit (Hampton Research) was utilized to search for additives to
improve the crystal shape and/or quality. This kit evaluates the factors of multivalent
cations, salts, amino acids, dissociating agents, linkers, polyamines, chaotropes, co-
factors, reducing agents, polymers, chelating agent, carbohydrates, polyols, non-
detergents, amphiphiles, detergents, osmolyte and organic agents (Hampton
Research). 0.3 µl of each additive from the kit was added into the crystallization
drops, consisting of 1 µl protein and dsDNA mixture and 2 µl reservoir buffer. After
incubation at 4 o
C for 4 weeks, all 96 drops with 96 additives from the kit were
compared to find out the suitable additives for the VceR/dsDNA crystallization.
2.14.1 Selenomethionine protein over-expression and purification for phasing
The medium (medium base, nutrient mix, methionine solution and selenomethinone
solution) was purchased from Molecular Dimensions and prepared as described in
the instructions from the product.
One colony was inoculated into a 100 ml culture containing L-methionine and
incubated at 37 oC in a shaking incubator over night. The cells were pelleted, washed

78
3 times in 100 ml of sterile water and resuspended in 1 ml sterile water. 1 L medium
containing selenomethionine was inoculated with 1 ml resuspended cells and
incubated with shaking until an OD600 of 0.5 was reached. IPTG was added and
cells were incubated for a further 6 hours before cell harvest. The purification of
selenomethionine VceR follows the protocol in section 2.7.2 and 2.7.3.
2.14.2 Oligonucleotides for VceR co-crystallization
The oligonucleotides (Table 2.5) used for VceR co-crystallization were ordered from
MWG and Sigma. Oligonucleotides were delivered as lyophilised powder. Before
use, oligonucleotides were dissolved in annealing buffer (10 mM Tris-HCl, pH 7.5,
50 mM NaCl, 1 mM EDTA, 10 mM MgCl2). Complementary pairs of
oligonucleotides were mixed, heated to 95 o
C for 5 minutes and cooled down
overnight in a heat block. All oligonucleotide duplexes used in VceR co-
crystallization are summarized in Table 2.5.

79
Table 2.5 The oligonucleotide duplexes used for VceR/DNA co-crystallization
P56 5‘-AGTATAACTGTACGGTACGGTTTAGTTATA-3‘
3‘-TCATATTGACATGCCATGCCAAATCAATAT-5‘
P56-1 5‘- TATAACTAAACGGTACGGTTTAGTTATA-3‘
3‘- ATATTGATTTGCCATGCCAAATCAATAT-5‘
P56-2 5‘- TATAACTGTACGGTACGGTACAGTTATA-3‘
3‘- ATATTGACATGCCATGCCATGTCAATAT-5‘
P56-3 5‘- TATAACTGTACGGTACGGTTTAGTTATA-3‘
3‘- ATATTGACATGCCATGCCAAATCAATAT-3‘
P56-4 5‘- AGTATAACTGTACGGTACGGTTTAGTTATAA-3‘
3‘- TTCATATTGACATGCCATGCCAAATCAATAT -5‘
P56-5 5‘- AGTATAACTGTACGGTACGGTTTAGTTATA -3‘
3‘-TTCATATTGACATGCCATGCCAAATCAATATT-5‘
P56-6 5‘- TATAACTGTACGGTACGGTTTAGTTATAAG-3‘
3‘-CTATATTGACATGCCATGCCAAATCAATAT -5‘
P56-7 5‘-AGTATAACTGTACGGTACGGTTTAGTTATAA -3‘
3‘ TCATATTGACATGCCATGCCAAATCAATATT-5‘
P56-28 5'- TATAACTAAACGGTACCGTTTAGTTATA-3'
3'- ATATTGATTTGCCATGGCAAATCAATAT-5'
P56-27 5'-TATAACTAAACGGTACCGTTTAGTTAT-3‘
3'-ATATTGATTTGCCATGGCAAATCAATA-5'
P56-26 5‘-ATAACTAAACGGTACCGTTTAGTTAT-3‘
3‘-TATTGATTTGCCATGGCAAATCAATA-5‘
P56-24 5‘-TAACTAAACGGTACCGTTTAGTTA-3‘
3‘-ATTGATTTGCCATGGCAAATCAAT-5‘
2.14.3 Data collection
At the beginning of this work, crystals were tested at the laboratory of Professor Rick
Lewis, Institute for Cell and Molecular Bioscience, the Medical School, Newcastle
University, using the in-house diffractometer. All data sets were collected by Dr.
Santina Russo (SLS) and Dr. Ehmke Pohl (Department of Chemistry, Durham
University) at the Swiss Light Source (SLS) using X10SA (Pohl et al., 2006), X06D
and X06SA; and Diamond Light Source using beamline 102.
Several cryo-solutions (glycerol, saturated salt, PEG and sucrose) were screened to
find the appropriate cryo-condition for crystal freezing in liquid nitrogen. To
optimize the soaking time, seconds to minutes or sequential transfer of crystals from

80
low concentration of cryo-solution to a high one were tested. The rotation method
was used in data collection. A typical data collection had a 1-2 second exposure time
at the SLS or 10 second at the DLS, 0.5° or 1° per frame which is dependent on the
survival of crystals from radiation damage.
2.14.4 Data processing
The HKL2000 program package (Denzo, Scala) (Otwinowski and Minor, 1997) was
used to process data. The site definition containing the X-ray detector and camera
information (the detector name, the goniostat misalignment, direction of rotation,
detector orientation, X-ray beam properties) was obtained from the DLS or SLS
beamlines. The autoindexing in Denzo was used to find the lattice system and refine
the unit cell, beam and detector parameters. Each set of frames was integrated to
obtain the intensity of each reflection. The diffraction intensities were scaled and
symmetry-related reflections were merged to a reduced dataset of unique reflections.
The fluorescence emission spectrum of the Se-VceR/DNA crystals or VceR/Br-DNA
crystals was used to show the presence of Se or Br in the crystals and to select the
wavelengths for MAD experiments. The f’ and f’’ values for Se and Br at peak,
inflection point and high energy remote were obtained from
http://skuld.bmsc.washington.edu/scatter/AS_form.html. Xprep (Bruker AXS,
Madison, USA) was used to assess the anomalous signal of MAD (Multiple-
wavelength anomalous diffraction) or SAD (single-wavelength anomalous
diffraction) data sets, and produce the input files for substructure determination.
ShelxD (Schneider and Sheldrick, 2002; Sheldrick, 2008) was used to locate the
heavy atom positions. The resolution cutoff in ShelxD is determined by finding
where the correlation coefficient between the signed anomalous differences for two
wavelengths falls below about 30%. Several parameters in ShelxD were used to
indicate a good solution, most importantly CC (correlation coefficient between
observed and calculated E values). Usually, for MAD, a CC of 40 to 50% indicates a
good solution.

81
2.14.5 Structure solution
The .sca files from HKL2000 were converted to mtz format in ccp4i by
Scalepack2mtz, which were merged into one .mtz file by CAD in ccp4i
(Collaborative computational project, Number4, 1994) with columns containing
native and three wavelength data sets. The phases were calculated by Sharp
(Bricogne et al., 2003), using 12 Se atom sites from ShelxD as input. The high
energy remote data set was used as the reference for scaling, and the default setting
of Sharp was used. Solvent flattening (54%) was run after phasing by DM (Cowtan,
1994). Coot (Emsley and Cowtan, 2004) was used to show the electron density map
and build the model manually. To obtain an initial poly-alanine model, the
combination of position of Se sites within the secondary structures (predicted by the
HNN secondary structure prediction method; Whitmore and Wallace, 2004) was
used to fit each helix into the obtained electron density manually. For the DNA
model, 11 bp duplex of B-DNA from Coot was manually modelled on the electron
density map.

82
Chapter 3 Amyloid fibril formation by Hpa1 from
Xanthomonas oryzae pv. oryzicola
In this chapter, I report the construction, expression and purification of Hpa1, harpin
of X. oryzae pv. oryzicola. The ability of Hpa1 to form fibrils at different pHs was
tested. The secondary structure transition during the fibril assembly was studied by
CD spectroscopy. The fibrils formed by Hpa1 were found to damage the liposomes
made from extracted E. coli lipids.
3.1 Cloning, overexpression and purification of Hpa1
3.1.1 Cloning of hpa1 into pET21a expression vector
The hpa1 gene was amplified by PCR from genomic DNA of the X. oryzae pv.
oryzicola (provided by Prof. Gongyou Chen, Nanjing agricultural University,
Nanjing, China) with primers NdeI-hpa1 Forward and XhoI-hpa1 Reverse (Table
2.2). Figure 3.1 shows the successful amplification of hpa1 (Lane 1), which is
consistent with the predicted size of 414 bp. The amplified hpa1 gene was extracted
and purified from the agarose gel and ligated into the commercial T-A propagation
vector, pGEM-T Easy (section 2.4.3 and 2.4.4). The ligation mixture was
transformed into chemically competent E. coli NovaBlue (section 2.4.6). Positively
identified recombinant clones were used in the following expression vector sub-
cloning procedure. Plasmid DNA purified from recombinant colonies was digested
with NdeI and XhoI to confirm the presence of inserted DNA. After restriction
enzyme digestion of the vector with NdeI and XhoI, the resulting hpa1 fragment was
ligated into pET21a generating a construct to express the hpa1 gene with a C-
terminal His6-tag. The successful constructs were sequenced and aligned with
sequence of hpa1 from Genebank (ACCESSION AY875714 REGION: 940-1353).
The construct was transformed into E. coli strain BL21(DE3) for Hpa1
overexpression.

83
Figure 3.1 PCR amplification of hpa1 gene from X. oryzae pv. oryzicola strain
RS105. Lane 2 shows a molecular weight (Mr) marker. Lanes 1 shows individual
PCR amplification reaction.
3.1.2 Over-expression of Hpa1-His6
Expression of Hpa1 from pET21a results in a fusion of the Hpa1 protein to a His6-tag
at the C-terminus and is referred to as Hpa1-His6.
Bacterial cultures were prepared as described in section 2.2.1, incorporating 100
g/ml carbenicillin. The protocols for protein expression were as described in section
2.7. At an OD600 of 0.5-0.6, Hpa1- His6 from BL21(DE3) was induced with 0.5 mM
IPTG at 25oC with 120 rpm rotary agitation for 5 hours. The cells were harvested,
resuspended in buffer A (20 mM Tris-HCl pH 8.5, 300 mM NaCl, 10% glycerol) and
stored at -80 oC for purification.
3.1.3 Purification of soluble and membrane faction Hpa1-His6
The soluble fraction containing Hpa1-His6 from 4 litres of culture was obtained by
differential centrifugation (Section 2.7.2) and purified by metal affinity
chromatography using Ni2+
agarose (Section 2.7.2). The packed column was washed
with 10 ml of 20 mM Tris-HCl pH 8.5, 300 mM NaCl, 10% glycerol, 50 mM

84
imidazole. Hpa1-His6 was eluted from the column using buffer A containing 500
mM imidazole.
Hpa1-His6 purified by metal affinity chromatography was loaded onto a gel filtration
column, Hiload 16/60 superdex 200 column (GE Healthcare), pre-equilibrated with 3
column volumes (CV) of buffer A, for further purification. Figure 3.2 shows the
elution chromatogram of Hpa1-His6 on a Hiload 16/60 superdex 200 prep grade size-
exclusion column. Hpa1 has low UV280 absorbance as there is no Trp or Tyr in
Hpa1 (Calculated extinction coefficient of Hpa1 at 280 nm is 120 cm-1
M-1
). Figure
3.3 shows the efficiency of expression and purification of Hpa1-His6 on an SDS-
PAGE gel. The calculated molecular weight of Hpa1-His6 is 14682.45 Da (Vector
NTI, Invitrogen). However, on the SDS-PAGE gel, the migration of the protein band
(Figure 3.3A 2-3 lanes) is around the 20 kDa standard of the SeeBlue protein marker
(Lane 1). His6-tag western blot (Section 2.7.6) was used to confirm the identification
of expressed Hpa1-His6. Figure 3.3B lanes 1 and 2 show the western blot signals of
Hpa1-His6 and its dimer.
The mass spectrum was determined by positive ion electrospray with up-front liquid
chromatographic separation in the Chemistry Department, Durham University. The
experimental mass is 14698 Da and the theoretical mass is 14682 Da calculated from
the empirical formula of Hpa1-His6. The difference of 16 Da between these two
values might originate from the gaining of protons in ionization, or other adduct
(possibly an oxygen atom), or the average mass from isotopic C12
and C13
.

85
Figure 3.2 The elution chromatography profile of Hpa1-His6 from a Hiload
16/60 superdex 200 gel filtration column. The peak with about 40 ml elution
volume is the aggregation of Hpa1 or the contaminated proteins.
Figure 3.3 SDS-PAGE and Western blot of Hpa1-His6. (A) Lane 1 is a protein
molecular weight (Mr) marker. Lanes 2 and 3 show Hpa1-His6 on a SDS-PAGE gel.
(B) Lanes 1 and 2 are the signals for Hpa1- His6 in a western blot corresponding to
lane 2 and 3 in A, respectively.
A
B
1 2 3
1 2

86
To test whether over-expressed Hpa1-His6 could bind to E. coli membrane in, the
membrane pellet was resuspended in buffer A (20 mM Tris-HCl, pH 8.5, 300 mM
NaCl, 10% glycerol) and solubilised using 1% DDM (n-dodecyl-β-D maltoside,
Calbiochem, UK). High-speed ultracentrifugation at 220,000 g for 60 min was
performed to separate soluble protein-detergent complex from membrane lipids. The
soluble protein-detergent complex was further purified by affinity chromatography
using a 1-ml HiTrap chelating column (GE Healthcare) immobilized with Ni2+
equilibrated with buffer B (20 mM Tris-HCl, pH 8.5, 300 mM NaCl, 10% glycerol,
0.1% DDM). The column was washed with 50 mM imidazole added to buffer B, and
the bound protein was eluted with 500 mM imidazole in buffer B.
Ion-exchange chromatography (Section 2.7.4) was used to further purify the
membrane fraction Hpa1-His6. The buffer of Hpa1-His6 was changed into starting
buffer (20 mM Tris-HCl, pH 8.5, 50 mM NaCl, 10% glycerol, 0.1% DDM) using a
desalting column (GE Healthcare). The HiTrap Q HP 5 ml column (GE Healthcare)
stored in 20% ethanol was washed with 5 CVs of degassed water, and then
equilibrated with starting buffer. Hpa1-His6 was loaded onto the HiTrap Q HP 5ml
column and washed with 3 CV of starting buffer. A NaCl gradient elution was
performed with start buffer and elution buffer (20 mM Tris-HCl, pH 8.5, 500 mM
NaCl, 10% glycerol, 0.1% DDM). The protein peaks were collected and analyzed by
on an SDS-PAGE gel. Figure 3.4A lane 3 shows the membrane fraction Hpa1-His6
after the ion-exchange chromatography. A His6-tag western blot (Section 2.7.6) was
used to confirm the identity of the expressed membrane fraction Hpa1-His6 (Figure
3.4B lane 2)
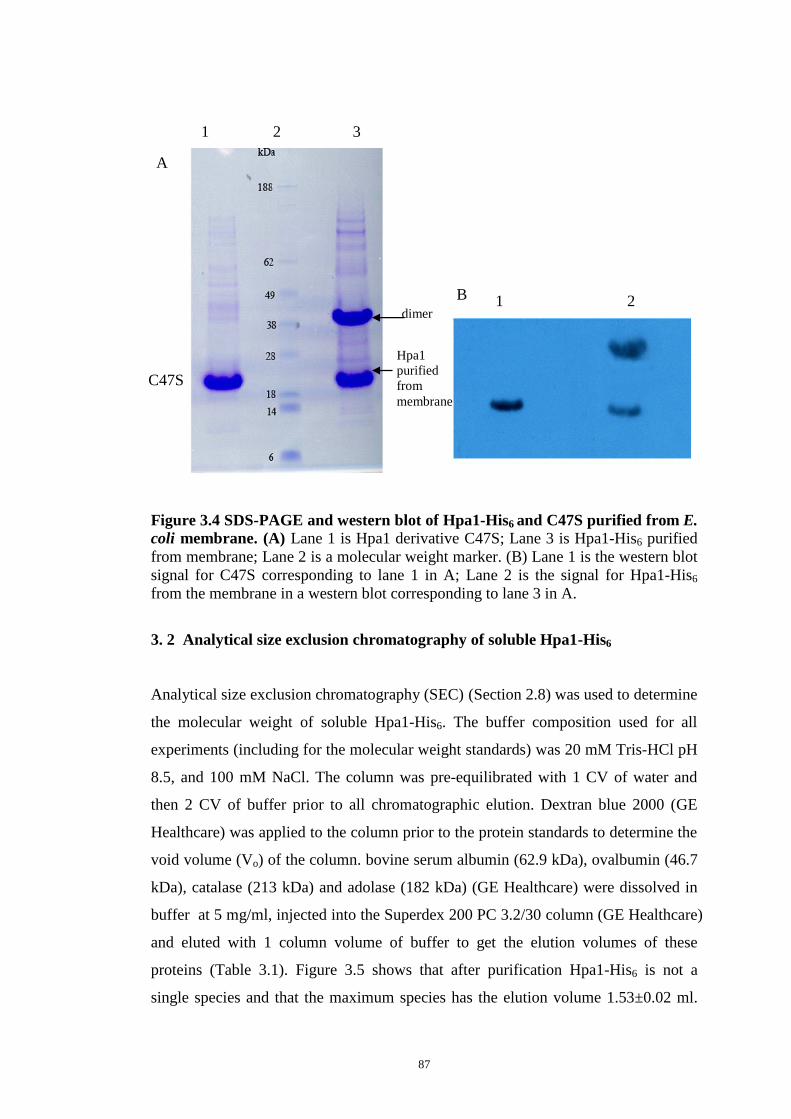
87
Figure 3.4 SDS-PAGE and western blot of Hpa1-His6 and C47S purified from E.
coli membrane. (A) Lane 1 is Hpa1 derivative C47S; Lane 3 is Hpa1-His6 purified
from membrane; Lane 2 is a molecular weight marker. (B) Lane 1 is the western blot
signal for C47S corresponding to lane 1 in A; Lane 2 is the signal for Hpa1-His6
from the membrane in a western blot corresponding to lane 3 in A.
3. 2 Analytical size exclusion chromatography of soluble Hpa1-His6
Analytical size exclusion chromatography (SEC) (Section 2.8) was used to determine
the molecular weight of soluble Hpa1-His6. The buffer composition used for all
experiments (including for the molecular weight standards) was 20 mM Tris-HCl pH
8.5, and 100 mM NaCl. The column was pre-equilibrated with 1 CV of water and
then 2 CV of buffer prior to all chromatographic elution. Dextran blue 2000 (GE
Healthcare) was applied to the column prior to the protein standards to determine the
void volume (Vo) of the column. bovine serum albumin (62.9 kDa), ovalbumin (46.7
kDa), catalase (213 kDa) and adolase (182 kDa) (GE Healthcare) were dissolved in
buffer at 5 mg/ml, injected into the Superdex 200 PC 3.2/30 column (GE Healthcare)
and eluted with 1 column volume of buffer to get the elution volumes of these
proteins (Table 3.1). Figure 3.5 shows that after purification Hpa1-His6 is not a
single species and that the maximum species has the elution volume 1.53±0.02 ml.
1 2 3
dimer
Hpa1
purified
from
membrane
C47S
A
B 1 2

88
The Kav of Hpa1-His6 and each protein standard were calculated as in Section 2.8.
The Kav values for the protein standards were plotted on a logarithmic scale against
the corresponding Mr and a line of best fit was drawn (Figure 3.6). The molecular
weight of Hpa1-His6 was calculated according to this curve, which is 142.3 kDa
(Table 3.1), suggesting that Hpa1-His6 could be a decamer.
Figure 3.5 The elution chromatography of Hpa1-His6 from a superdex 200 PC
3.2/30 gel filtration column (Molecular weight determination of Hpa1-His6)
A=aldolase (182 kDa), B= bovine serum albumin (62.9 kDa), C= catalase (213 kDa),
O= ovalbumin (46.7 kDa).

89
Protein Molecular Weight Elution Volume* Kav
Aldolase 182 kDa 1.49±0.02 ml 0.3228
Catalase 213 kDa 1.44±0.02 ml 0.2861
Bovine Serum Albumin 62.9 kDa 1.59±0.02 ml 0.3962
Ovalbumin 46.7 kDa 1.69 ±0.02 ml 0.4695
Hpa1-His6 142.3 kDa 1.53±0.02 ml 0.3521
Blue Dextran More than 2000 kDa 1.05±0.02 ml 0
Table 3.1 Molecular weights and elution volumes of standard proteins and
Hpa1-His6 . * errors estimated from the calibration curve (data not shown), 0.02 ml=
6 kDa.
y = -3.5356x + 6.4231
R2 = 0.9826
4.5
4.6
4.7
4.8
4.9
5
5.1
5.2
5.3
5.4
0 0.2 0.4 0.6
Series1
Linear(Series1)
Figure 3.6 The log of the Mr of the standards versus Kav calibration curve.
Log
Mr
Kav

90
3.3 Overexpression and purification of Hpa1 derivative C47S
Harpins share several characteristics, such as a low isoelectric point, enrichment for
glycines, and a lack of cysteine residues (Charkowski et al., 1998). Hpa1, similar to
other harpins, has a low isoelectric point of 4.06, and high percent of glycines of
13.5% (calculated by Vector NTI). However, there is one cysteine residue in Hpa1.
To study the function of this residue, the mutation of the cysteine to serine (C47S)
was performed to determine if cysteine cross linking was essential for correct protein
folding in Hpa1. The QuikChange multi site-directed mutagenesis system (Stratgene)
was employed for in vitro site directed mutagenesis experiments.
Site directed mutagensis of Hpa1-His6 was performed as described in Section 2.6.
The mutagenic primers hpa1-C47S Forward and hpa1-C47S Reverse were used as
detailed in Table 2.4. The pET21a-hpa1 ds-DNA was used as the template. Mutant
strand synthesis using PCR was achieved with an extension time of 6 minutes. The
clones were sequenced to confirm the desired mutant. The correct clones were
transformed into BL21(DE3) for overexpression.
We attempted to purify Hpa1 C47S from the soluble fraction; however, no C47S was
found in the soluble fraction. The membrane fraction of C47S was purified as
membrane fraction Hpa1-His6 in section 3.1.3. His6-tag western blot (Section 2.7.6)
was used to confirm the correct expression of the membrane fraction C47S. Figure
3.4A lane 1 shows the purification of C47S from E. coli membranes. Figure 3.4B
lane 1 shows the western blot of C47S. The discussion of Hpa1 derivative C47S is
given in section 3.9.2.
3.4 Amyloid fibrils formation of Hpa1-His6 at acidic pHs
The Type III-dependent harpins from plant pathogenic bacteria, HpaG from X.
axonopodis, HrpN from E. amylovora and HrpZ from P. syringae pv. syringae were
found to form amyloid fibrils in XVM2, the hrp induction minimal medium (Oh et
al., 2007). Hpa1 has 59.7% sequence identity with HpaG, 17.2 % with HrpN, and
14.5 % with HrpZ.

91
In this study, the amyloid fibril formation of soluble Hpa1-His6 was tested at
different pHs. The purified Hpa1-His6 in buffer (20 mM Tris-HCl pH 8.5, 300 mM
NaCl), was concentrated and diluted into buffers at pH 8.5 (20 mM Tris-HCl, 50 mM
NaCl), pH 8.0 (20 mM Tris-HCl, 50 mM NaCl), pH 7.5 (20 mM Tris-HCl, 50 mM
NaCl), pH 7.0 (20 mM MES, 50 mM NaCl), pH 6.5 (20 mM MES, 50 mM NaCl),
and pH 6.0 (20 mM MES, 50 mM NaCl) in 40 µM, respectively. Samples were
screened by TEM immediately after dilution for the Hpa1-His6 fibrils in each buffer
(Figure 3.7 A and D, 3.8 A and D, 3.9 A and D).
Our TEM studies revealed that purified Hpa1-His6 is prone to aggregate in buffers at
pH 8.5 and 8.0 (Figure 3.9 A and D). After incubation of Hpa-His6 at each buffer for
1 day at room temperature (RT), the morphology of Hpa1-His6 in each buffer was
observed under TEM. Hpa1-His6 forms ribbon fibrils with a 10 nm width at pH 6.0
and pH 6.5 after 1 day incubation at RT (Figure 3.7 B and E); however, at pH 7.0,
7.5, 8.0 and 8.5 (Figure 3.8 B and E, 3.9 B and E) no fibrils formed .
After a 12 day incubation at RT, the Hpa1-His6 at each pH was observed again under
TEM. Ribbon fibrils formed by Hpa1-His6 after 1 day incubation in pH 6.0 and pH
6.5 were expected to form twisted fibrils after the long incubation time. However,
there was no difference found between fibrils of 1day incubation at pH 6.0 and 6.5
and those after 12 days incubation (Figure 3.7 C and F).
After 12 days incubation at RT, Hpa1-His6 aggregated at pH 7.5 (Figure 3.8 F) and
pH 8.0 (Figure 3.9 C).

92
Figure 3.7 Amyloid fibrils formed by Hpa1 at pH 6.0 and 6.5. (A), (B) and (C)
show 40 µM of Hpa1-His6 in buffer 20 mM MES, pH 6.0, 50 mM NaCl, 0 day, 1 day
and 12 days respectively. (D), (E) and (F) show 40 µM of Hpa1-His6 in buffer 20
mM MES, pH 6.5, 50 mM NaCl, 0 day, 1day and 12 days respectively. The time
point 0 day is defined as the moment immediately following dilution of the protein in
each buffer. (Scale bar = 100 nm)

93
Figure 3.8 TEM analysis of Hpa1 at pH 7.0 and 7.5. (A), (B) and (C) show 40
µM of Hpa1-His6 in buffer 20 mM Tris-HCl, pH 7.0, 50 mM NaCl, 0 day, 1 day and
12 days respectively. (D), (E) and (F) show 40 µM of Hpa1-His6 in buffer 20 mM
Tris-HCl, pH 7.5, 50 mM NaCl, 0 day, 1day and 12 days respectively. The time point
0 day is defined as the moment immediately following dilution of the protein in each
buffer. (Scale bar = 100 nm)

94
Figure 3.9 TEM analysis of Hpa1 at pH 8.0 and 8.5. (A), (B) and (C) show 40
µM of Hpa1-His6 in buffer 20 mM Tris-HCl, pH 8.0, 50 mM NaCl, 0 day, 1 day and
12 days respectively. (D), (E) and (F) show 40 µM of Hpa1-His6 in buffer 20 mM
Tris-HCl, pH 8.5, 50 mM NaCl, 0 day, 1 day and 12 days respectively. The time
point 0 day is defined as the moment immediately following dilution of the protein in
each buffer. Arrows show the aggregation of Hpa1. (Scale bar = 100 nm)

95
To determine whether the fibrillar form of Hpa1 is amyloid, a Congo red binding
assay was performed: 40 µM Hpa1-His6 was diluted in buffer 20 mM MES, pH 6.5,
50 mM NaCl and incubated at RT for 1 day to form fibrils. 20 µM Congo red was
dissolved in the same buffer. The absorbance spectrum of Congo red from 400 to 700
nm was recorded as a control (Figure 3.10 dotted line). 20 µM Congo red was then
mixed with 40 µM fibrils formed by Hpa1-His6 and the absorbance spectrum of
Congo red from 400 to 700 nm was recorded again (Figure 3.10 solid line). The
binding of Hpa1 fibrils to Congo red causes a maximum absorbance shift of Congo
red from 495 nm to 516 nm (Figure 3.10), which indicates that the Hpa1 fibrils are
amyloid fibrils.
0.2
0.44
0.3
0.4
400 700500 600
Abs
W av eleng th [nm ]
Figure 3.10 Congo red binding of Hpa1-His6 fibrils. Absorbance spectrum of the
CR solution in the absence (dotted line) and presence (solid line) of Hpa1-His6 fibrils.
3.5 Chemical cross-linking of Hpa1-His6
In order to show the oligomeric state of Hpa1-His6, cross-linking experiments were
undertaken. Cross-linkers are chemical reagents used to conjugate molecules
together by a covalent bound. Hpa1-His6 crosslinking in vitro was performed using
DSP and EGS, with 12 Å and 16.1 Å spacer arms, and analyzed by gel
electrophoresis.

96
The buffer of purified Hpa1-His6 was exchanged into 20 mM Na2HPO4, 100 mM
NaCl, pH 8.5, prior to crosslinking. An EGS solution was freshly prepared in DMSO.
The protein sample and EGS solution were mixed and left at room temperature for 1
hour. The reactions were terminated by adding 1M Tris buffer. The samples were
then analysed on a 4-12% SDS-PAGE gel. Figure 3.11 shows approximately seven
bands, corresponding to the different oligomeric states of Hpa1.
Figure 3.11 Chemical cross-linking of Hpa1-His6
Lane 1: A protein molecular weight (Mr) marker
Lane 2: 1 mg/ml Hpa1-His6 in buffer 20 mM NaHPO4, 100 mM NaCl, pH 8.5
Lane 3-5: 1 mg/ml Hpa1-His6 in buffer 20 mM NaHPO4, 100 mM NaCl, pH 8.5,
crosslinked with 8 mM, 16 mM and 30 mM EGS, respectively, at 37 oC, for 30 mins.
PopA, a harpin-like protein from the bacterial plant pathogen R. solanacearum, was
thought to be a Ca2+
-dependent lipid binding protein, for which Ca2+
could promote
Hpa1 monomer
Hpa1 trimer
Hpa1 dimer
Hpa1 tetramer
Hpa1 pentamer
Hpa1 hexamer
Hpa1 heptamer
1 2 3 4 5
18
38
28
49
62
188
kDa

97
oligomerization (Racape et al., 2005). 2 mM CaCl2 and 0.1 mg E. coli lipsomes
(Section 2.13 for liposomes preparation) were mixed in the crosslinking buffer
respectively or simultaneously to show their effects in the oligomerization of Hpa1.
However, no significant difference was found in the presence of 2 mM CaCl2, or 0.1
mg E. coli liposome, or both of them simultaneously, compared with Hpa1 only
(Figure 3.12).
Figure 3.12 Chemical cross-linking of Hpa1-His6 in the presence of CaCl2 and
liposomes. Lane 1: 1 mg/ml Hpa1-His6 mixed with 0.5 mM DSP, 2 mM CaCl2 and
0.1 mg E. coli lipsomes, 37 oC, 0.5 hour. Lane 2: 1 mg/ml Hpa1-His6, mixed with 0.1
mg E. coli liposomes and 2 mM CaCl2, 37 oC, 0.5 hour. Lane 3: 1 mg/ml Hpa1-His6,
mixed with 0.5 mM DSP and 0.1 mg E. coli liposomes, 37 o
C, 0.5 hour. Lane 4: 1
mg/ml Hpa1-His6, mixed with 0.5 mM DSP and 2 mM CaCl2, 37 oC, 0.5 hour Lane 5:
1 mg/ml Hpa1-His6, mixed with 0.1mg E. coli liposomes, 37 oC, 0.5 hour. Lane 6: 1
mg/ml Hpa1-His6, mixed with 2 mM CaCl2, 37 oC, 0.5 hour. Lane 7: 1 mg/ml Hpa1-
His6, mixed with 0.5 mM DSP, 37 oC, 0.5 hour. Lane 8: 1 mg/ml Hpa1-His6.
In conclusion, our cross-linking data indicates that the maximal oligomer state of
Hpa1 is a heptamer, which is inconsistent with the decamer from SEC (Section 3.2).
This difference might be explained by the spacer arm being sub-optimal for cross-
linking the active site in the Hpa1 oligomers. In addition, although Ca2+
and
liposomes were reported to promote oligomerization of harpin (Racape et al., 2005);
in this study, such effects could not be detected in our experiments. A detailed
discussion of these findings is given in Section 3.9.3.

98
3.6 Circular dichroism (CD) spectroscopy of Hpa1-His6
The formation of amyloid fibrils accompanies a secondary structure change and
amyloid fibrils are β-sheet rich structures (Chiti and Dobson, 2006). In order to study
the secondary structure transition of Hpa1-His6 during fibril formation, CD
spectroscopy was used. In order to minimize the strong absorbance from Cl- in the
far UV region, the Hpa1-His6 buffer was changed to Tris-base or NaH2PO4, with
NaF as salt.
4 µM Hpa1-His6 in 20 mM Tris-base pH 8.5 (pH adjusted by H2SO4), 20 mM NaF,
generated a CD spectrum from 260-190 nm. Meanwhile, Hpa1-His6 was diluted into
20 mM NaH2PO4 pH 6.5, 20 mM NaF to have a final concentration 5 µM and
incubated at room temperature for 1 day. The CD spectrum of this 5 µM Hpa1-His6
at pH 6.5 was recorded. All CD spectra were analyzed using the software Dichroweb
online (Section 2.11, Whitmore and Wallace, 2004 and 2008).
Our CD analyses indicated that Hpa1-His6 at pH 8.5 has a structural content of
34.8% helix, 7.5% sheet, 27.9% turn, and 29.9% unordered (Figure 3.13). After
incubation of Hpa1 at pH 6.5 for 1 day, the spherical oligomer Hpa1 formed
curvilinear fibrils under TEM (Figure 3.7 E), and the percentage of helix decreased
to 14.5%, whereas the sheet content increased to 29.2%, with 23.4% turn, and 32.9%
unordered structure (Figure 3.13). In conclusion, the formation of fibrils of Hpa1
increases the sheet content, but not all the secondary structure of the Hpa1 fibrils is
β-sheet structure.

99
Figure 3.13 CD spectroscopic analysis of soluble Hpa1-His6 at pH 8.5 and pH
6.5. 5 µM soluble Hpa1 at pH 8.5 (solid line), 5 µM soluble Hpa1 at pH 6.5, 1 day
incubation (dotted line).
3.7 Membrane disrupted by Hpa1-His6
Liposomes were prepared from E. coli extracted lipids as described in Section 2.13
and incubated with 5 mg Hpa1 at different pHs (pH 6.0, 6.5, 7.0, 7.5, 8.0 and 8.5).
After 1 day incubation, the bound Hpa1 with liposomes and unbound Hpa1 were
separated using sucrose gradient centrifugation (Section 2.13). The liposome
fractions were pipetted and loaded onto a SDS/PAGE gel to show bound Hpa1. Only
at pH 6.0 and 6.5, Hpa1 could bind to liposomes (Figure 3.14). In addition, these
liposomes bound with Hpa1 were observed under TEM (Figure 3.15 D, E and F),
revealing that these liposomes were broken by the Hpa1 at pH 6.0 and pH 6.5.

100
Figure 3.14 A SDS/PAGE gel shows the Hpa1-His6 bound with liposome after
sucrose gradient centrifugation Lane 1: 1 mg/ml Hpa1-His6. Lane 2, 3, 4: Hpa1-
His6 from 10% sucrose fraction of liposome, at pH 6.5. Lane 5, 6, 7: Hpa1-His6
from10% sucrose fraction of liposome, at pH 6.0
To test the function of membrane fraction Hpa1-His6 and the C47S derivative on the
membrane, we reconstituted the detergent solubilised Hpa1-His6 and C47S into
membranes as described in Section 2.13. The liposomes were prepared and mixed
with detergent solubilised Hpa1-His6 and C47S. The detergents in the system were
moved by Bio-bead SM-2 absorbent (Bio-Rad®) and integrated membranes were
spun down. TEM observations show both the membrane fraction Hpa1-His6 and
C47S disrupt membranes (Figure 3.15 B and C).

101
Figure 3.15 Negative-staining electron microscopy analysis shows that Hpa1-
His6 purified from soluble and membrane fraction of E. coli disrupt liposomes
(A) Intact liposomes. (B) Liposomes lysed by membrane fraction Hpa1-His6. (C)
Liposomes lysed by membrane fraction C47S. (D) and (E) Liposomes lysed by
soluble Hpa1-His6 at pH 6.5 (F) Liposomes lysed by soluble Hpa1-His6 at pH 6.0.
The black arrow points to the lysed liposomes (scale bar = 100 nm)

102
3.8 Crystallization of Hpa1
Hpa1-His6 (20 mM Tris-HCl buffer at pH 8.5, 100 mM NaCl, and 4 μM DTT), was
purified as described in section 3.1.2 and 3.1.3, and concentrated to 10 mg/ml for
crystallization trials.
The following crystallization suites were used:
1 The classics suites (Nextal Biotech)
2 The classics Lite suites (Nextal Biotech)
3 Structure Screen 1, 2 (Molecular Dimensions)
4 Random sparse matrix crystallization screen Wizard I, Wizard II (Emerald
Biosystems.)
1ml crystallization buffer from each crystallization suite was transferred into the
wells of crystallization plates. 2 µl 10 mg/ml Hpa1-His6 was mixed with 2 µl
reservoir buffer from the kits, and loaded on the cover slip of each well, to form the
hanging drops at 18 oC.
The crystallization of the above screening conditions did not yield any crystals or
even needles. Self-prepared buffer conditions were used to screen for buffers suitable
for crystallization of Hpa1. PEG4000 and PEG400 were taken as precipitants,
concentration from 5% to 25%, in 100 mM Tris-HCl at different pHs from 7.0 to 8.5.
Fortunately, some small needles or spherulites could be found in buffer containing
15% PEG4000, 100 mM Tris-HCl at pH 7.8 (Figure 3.16). However, these needle-
like spherulites or crystallines were too small to obtain any diffraction and not
reproducible. Further trials did not get any promising result than these needle-like
crystals.

103
Figure 3.16 Needle-like crystallines or aggregation formed by Hpa1-His6 at 100
mM Tris-HCl buffer at pH 7.8 and 15% PEG4000.
3.9 Discussion
Harpins play an important function between the plant and plant pathogen (Alfano
and Collmer, 2004). They act by eliciting a complex natural defence mechanism in
plants, analogous to a broad spectrum immune response in animals (Alfano and
Collmer, 2004). The harpin-like protein PopA, from the bacterial plant pathogen
Ralstonia solanacearum, has a high affinity for sterols and sphingolipids in vitro and
requires Ca2+
for lipid binding and oligomerization (Racape et al., 2005). Recently,
HpaG was found to form amyloid fibrils (Oh et al., 2007). In order to investigate the
biochemical characteristic of Hpa1, we over-expressed and purified it from E. coli
and found fibril forming conditions for Hpa1.

104
3.9.1 Over-expression and purification of Hpa1
The low mobility of harpins on an SDS-PAGE gel is reported in several publications
and could be a general characteristic of harpins (Charkowski et al., 1998). In this
study, Hpa1 has a similar low mobility on SDS-PAGE gels, shifting from 14 kDa to
around a 20 kDa position (Figure 3.3). Western blot and mass spectra confirmed the
correct expression of Hpa1 (Section 3.1.3), and eliminated the unexpected
contamination of proteins. This characteristic of harpins could reflect the special
amino acid composition of harpins, or unique structure of harpins, which has to be
determined in future work.
3.9.2 Function of cysteine in Hpa1
Although the lack of cysteine is considered as a general characteristic of harpins
(Charkowski et al., 1998), Hpa1 has one cysteine residue. To investigate the function
of this residue, we mutated Cys to Ser (C47S) and purified this derivative from E.
coli. In contrast to the WT Hpa1, only the membrane fraction of C47S was purified
successfully. As expected, the lack of cysteine in Hpa1 led to the dissociation of
dimer to monomer (Figure 3.4). In addition, the formation of intermolecular disulfide
bonds could also stabilize Hpa1 in the soluble state, as the derivative C47S was
absent in the soluble fraction in its purification (Section 3.3).
3.9.3 Oligomerization of Hpa1
The oligomeric state of harpin was reported for HpaG, which forms a tetramer (Oh et
al., 2007). PopA was thought to be a Ca2+
-dependent lipid binding protein, for
which Ca2+
could promote oligomerization (Racape et al., 2005). In this study, in
vitro cross-linking of Hpa1 was performed with SEC used to analyse the oligomeric
state of Hpa1. Analytical SEC shows Hpa1 is not a single species in buffer and the
major species has a molecular weight 142.3 kDa (Table 3.1), which indicates that
this species of Hpa1-His6 may be a decamer in solution.
To understand the effect of Ca2+
and lipids on oligomerization of Hpa1, liposomes
and Ca2+
were mixed with Hpa1 and cross-linking was performed. In contrast to

105
PopA, Ca2+
and lipids had no effect on the oligomerization of Hpa1 (Figure 3.12).
However, the possibility of an effect of Ca2+
and lipids on the oligomerization of
Hpa1 can not be ruled out, since the purified Hpa1 is already in its oligomeric state, a
decamer rather than a monomer. The equilibrium between monomeric and
oligomeric state of fibril forming proteins was reported and some parameters are
found to shift this equilibrium, e.g. anionic strength in the buffer (Cruz et al., 2005).
The possible shift between monomer and oligomer of Hpa1 could be studied in
future work.
3.9.4 Amyloid fibril formation of Hpa1
A pH-dependent folding transition has been widely reported in amyloid forming
proteins (Cruz et al., 2005; Lai et al., 1996; Morozova-Roche et al., 2000; Smith et
al., 2003; Uversky and Fink, 2004). The Type III-dependent harpins from plant
pathogenic bacteria, HpaG from X.axonopodis, HrpN from E. amylovora and HrpZ
from P. syringae pv. syringae were found to form amyloid fibrils in XVM2, the hrp
induction minimal medium (Oh et al., 2007). However, the effect of pH on fibril
formation by harpins is still enigmatic. In this study, a series of buffers with different
pHs (6.0, 6.5, 7.0, 7.5, 8.0 and 8.5) were prepared to determine their influence on
fibril formation of Hpa1. As observed by TEM, short curved fibrils formed by
soluble Hpa1 at pH 6.0 and 6.5 after 1day incubation at RT (Figure 3.7 B, C, E and
F). A Congo red binding assay indicated that these fibrils are amyloid-like, similar to
the fibrils formed by HpaG of X. axonopodis (Oh et al., 2007). The CD spectrum
shows that the formation of fibrils by Hpa1 at acidic pH involves the transition of
secondary structure from helix to strand (Section 3.6), similar to those observed in
the fibrils formed by HpaG (Oh et al., 2007).
Hpa1 and the C47S derivative purified from membrane cannot form fibrils. The
possible explanation is that the detergents bound to the protein, used in the
purification of protein from the membrane, mask the surface for fibril-assembly.
Although decreasing the net charge of proteins was thought to be the reason for the
formation and stabilization of fibrils (Chiti et al., 2002; Schmitts and Scholtz, 2003);
in this study, a lower pH of 4-5 around the pI (4.06, calculated by Vector NTI) of

106
Hpa1, were found to induce the precipitation of Hpa1 (data not shown), which
indicates that the formation of fibrils needs electrostatic conditions to allow folding
of Hpa1.
The possible mechanism for fibril formation of Hpa1 at acidic pHs is that the shift of
pH changes conformation of Hpa1 and thus exposes the protein surface for fibril-
assembly. Further work will be required to support this hypothesis or find out
another mechanism by which fibril-assembly occurs at acidic pH of Hpa1.
3.9.5 Membrane binding and disruption of Hpa1
The membrane binding characteristic of PopA, an harpin-like protein, was reported
(Racape et al., 2005). In this study, successful purification of Hpa1 from the
membrane of E. coli (Figure 3.4) indicates that membrane binding is a characteristic
of Hpa1 in vivo. Sucrose gradient centrifugation revealed that Hpa1 can bind
liposomes at pH 6.0 and 6.5 in vitro (Figure 3.14). TEM observation also indicated
that liposomes are disrupted by Hpa1 at these pHs (Figure 3.15 D, E and F). These
results together with fluoresce studies that revealed the location of Hpa1-GFP
(localized Hpa1 at the plasma membrane, communication with Prof. Gongyou Chen,
Nanjing Agricultural University, China) suggest Hpa1 localizes to and disrupts the
membrane. More discussion about function of Hpa1 in TTSS of Xanthomonas will
be given in Section 6.1.2.
3.9.6 Crystallization of Hpa1 and harpin proteins
Harpin protein crystallography is still a challenge, as no harpin structure has been
determined until now after their discovery in 1992 (Wei et al., 1992). In this work,
only 1000 commercial screening conditions have been screened in the Hpa1
crystallography, but no crystal were formed from these conditions. Although needles
or spherulites of Hpa1 (Figure 3.16) were successfully grown in self-prepared buffer,
it was not reproducible and could not be optimized further.
More buffer conditions need to be screened for Hpa1 crystallization. In addition,
other commonly employed tactics, such as crystallization additives, small molecules

107
known to bind harpin and limited proteolysis, could be tried for harpin
crystallography. The higher percent of unordered structure of Hpa1 (Section 3.6)
could be a reason for the difficulties in the crystallization and the method to improve
the folding of Hpa1 could be beneficial in crystallization. The other factor in Hpa1
crystallization is the pH-dependent fibril formation of Hpa1 (Figure 3.7), which
makes the selection of pH range critical to get the crystals.

108
Chapter 4 Fibril formation domain study of Hpa1
HpaG, the harpin of X. axonopodis pv glycines, was reported to have two predicted
-helical domains in the N- and C-terminal regions, and a Gln and Gly repeated
sequence (QGQGQGQGG) (Figure 4.1), which is located between the two helices
and homologous to the prion-forming domain (PrD) of yeast prion protein (Oh et al.,
2007). The N-terminal -helix region was found to be essential for inducing HR and
fibril formation (Oh et al., 2007). A single amino acid change of this region from
leucine to proline abolished HR induction and fibril formation (Oh et al., 2007).
In this chapter, I report the N-terminal -helix region truncated Hpa1 (55-138) is
sufficient for amyloid fibril formation, different from HpaG. The synthesized poly-
peptide (ASPLTQMLMNIVGEILQAQ), corresponding to the C-terminal -helix
region, is responsible for fibril formation. The fibrils formed by the N-terminal -
helix region of truncated Hpa1 and a synthesized poly-peptide could damage
membranes by analogy to full length Hpa1. The N-terminal -helix region interacts
with the C-terminal one and inhibits its fibril formation.
4.1 Amino acid sequence alignment of Hpa1 and HpaG, and secondary
structure prediction
In order to study the domains of Hpa1, sequences of Hpa1 and HpaG were aligned
using Vector NTI advance 10 (Invitrogen) and secondary structures of Hpa1 and
HpaG were predicted by HNN secondary structure prediction method (Whitmore and
Wallace, 2004 and 2008).
Hpa1 and HpaG show 59.7% identity. Hpa1 has N- and C-terminal -helices and one
GGGQGGNQQ domain between them (Figure 4.1 and 4.2). Hpa1 has one cysteine
amino acid located in the N-terminal -helix domain (Figure 4.1).

109
1 50
cccccccccc cccceeeccc cccccccccc cccccchhhh hhhhhhhhhh
Hpa1 MNSLNTQFGG SASNFQVDQS QNAQSDSSQG SNGSQGISEK QLDQLLCQLI
HpaG MNSLNTQLGA NSSFFQVDPG QNTQSSPNQG N...QGISEK QLDQLLTQLI
Cccccccecc cceeeeeccc cccccccccc c ccchhh hhhhhhhhhh
51 100
hhhhcccccc cccccccccc cccccccccc cccccchhh hhhhhhhhh
Hpa1 QALLQPNKNA EEGKGQQGGE NGGGQGGNQQ AGKENGASP. .LTQMLMNIV
HpaG MALLQQSNNA EQGQGQGQGG DSGGQGGNPR QAGQSNGSPS QYTQALMNIV
hhhhhhcccc cccccccccc cccccccccc cccccccccc hhhhhhhhhh
101 139
hhhhhhhccc cccccccccc cccccchhhc ccccccccc
Hpa1 GEILQAQNGG GAGGAGGSSG GDFGGSFASS FSNDSGSMQ
HpaG GDILQAQNGG GFG...GGFG GGFGGILVTS LASDTGSMQ
hhhhhhhccc ccc cccc cccceeeeee ecccccccc
Alpha helix(h),Extended strand (e),Random coil(c)
Figure 4.1 Amino acid sequence alignment between Hpa1 and HpaG, and their
protein secondary structure predictions. Hpa1 and HpaG display 59.7% identity,
and identical residues are underlined, while alpha helix indicated with h, extended
strand indicated with e, and random coil indicated with c; the alpha helix, extended
strand and radom coil content of prediction of Hpa1 and HpaG are h (29%), e (2%), c
(69%) and h (27%), e (10%), c (63%), respectively.

110
4.2 Cloning, over-expression and purification of N-terminal truncated Hpa1
In order to study the function of two helical domains in Hpa1, different constructs to
truncate the N-terminal and C-terminal helical domains (Figure 4.2) were made.
Figure 4.2 Schematic representation of Hpa1 domains and synthesized peptides.
4.2.1 Cloning of truncated hpa1 into pET21a expression vector
The truncated hpa1 genes (1-258 and 163-414) were amplified by PCR from
pET21a/hpa1 with primer pairs NdeI- hpa1 Forward and XhoI- 1-258-hpa1 Reverse,
NdeI-163-414-hpa1 Forward and XhoI- hpa1 Reverse, respectively (Table 2.3). The
amplified truncated hpa1 genes (1-258 and 163-414) were extracted and purified
from the agarose gel and ligated into the commercial T-A propagation vector,
pGEM-T Easy. The ligation mixture was transformed into chemically competent E.
coli NovaBlue. Positively identified recombinant clones were used in the following
expression vector sub-cloning procedure. Plasmid DNA purified from recombinant
colonies was digested with NdeI and XhoI to confirm the presence of inserted DNA.
After restriction enzyme digestion of the vector with NdeI and XhoI, the resulting
hpa1 fragments were ligated into pET21a generating constructs to express the hpa1
1 138
1 86
138 55
87 106 54 37
Hpa1
Hpa11-86
Hpa155-138
Peptide 1(domain of Hpa1): ISEKQLDQLLCQLIQALL
Peptide 2 (domain of Hpa1): ASPLTQMLMNIVGEILQAQ

111
1-258 and 163-414 genes with C-terminal His6 tags. The two constructs were
sequenced to guarantee the correct sequence as expected. The constructs were
transformed into E. coli strain BL21(DE3) for overexperssion.
4.2.2 Over-expression and purification of N-terminal truncated Hpa1-His6
2L Hpa1 (1-86) and (55-138) cells were grown and induced by 1 mM IPTG as
described in Section 2.7.1. Cells were harvested and resuspended in buffer (20 mM
Tris-HCl, 300 mM NaCl, 10% glycerol, pH 8.5). Cells were lysed by mechanical
disruption (Section 2.7.2).
The soluble fraction containing Hpa1 (1-86) and (55-138) from 2 litres of culture was
obtained by differential centrifugation (Section 2.7.2) and purified by metal affinity
chromatography using Ni2+
agarose (Section 2.7.2).
The packed column was washed with 10 ml of 20 mM Tris-HCl pH 8.5, 300 mM
NaCl, 10% glycerol, 50 mM imidazole. Protein was eluted from the column using
buffer A containing 500 mM imidazole. We failed to purify Hpa1 (1-86), as it
aggregated and blocked the column during purification. In addition, there was no
Hpa1(1-86) purified from E. coli membrane. Soluble Hpa1(55-138) (N-terminal 54
residue truncated) was purified successfully by the following procedure.
Hpa1 (55-138) purified by metal affinity chromatography was loaded onto a gel
filtration Hiload 16/60 superdex 200 column (GE Healthcare), preequilibrated with 3
column volumes of buffer, for further purification. Figure 4.3 shows the elution
profile of Hpa1-His6 on a Hiload 16/60 superdex 200 prep grade size-exclusion
column. Hpa1 (55-138) has low UV280 absorbance as there is no Trp or Tyr in
truncated Hpa1 (55-138). Figure 4.4 lane 1 shows the efficiency of expression and
purification of Hpa1-His6 on an SDS-PAGE gel. The predicted molecular weight of
Hpa1 (55-138) is 8343.51 Da (Vector NTI advance 10, Invitrogen). A His6-tag
western blot (Section 2.7.6) was carried out to confirm the correct expression and
purification of Hpa1 (55-138). Figure 4.4 lane 3 shows the western blot of Hpa1 (55-
138).

112
Figure 4.3 The elution chromatography profile of Hpa1 (55-138) from a
Hiload 16/60 superdex 200 prep grade size-exclusion column.
Figure 4.4 SDS-PAGE and western blot of Hpa1 (55-138). (A) Lane 1 shows the
purified Hpa1 (55-138); Lane 2 Mr marker; (B) Lane 1 is the western blot signal of
Hpa1 (55-138) corresponding to lane 1 in A.
Hpa1
(55-138)
Hpa1 (55-138)
A B
1

113
4.3 Amyloid fibrils formed by Hpa1 (55-138)
In order to study the fibril forming ability of Hpa1 (55-138), the purified protein was
diluted into pH 8.0 buffer containing 20 mM Tris-HCl, 50 mM NaCl, and pH 6.5
buffer containing 20 mM MES, 50 mM NaCl to give a final protein concentration of
40 µM, respectively. Samples were immediately observed by TEM after dilution of
the Hpa1 (55-138) in each buffer. Purified Hpa1 (55-138) formed fibrils at pH 8.0
and pH 6.5. Hpa1 (55-138) might form fibrils in the process of protein preparation or
TEM sample preparation. After incubation of Hpa1 (55-138) at each buffer for 1 day
at room temperature (RT), the morphologies of the Hpa1 (55-138) fibrils were
observed under TEM again. The Hpa1 (55-138) fibrils had about 10 nm width at pH
6.5. In conclusion, Hpa1 (55-138) forms fibrils at acidic and basic pHs (Figure 4.5).
Figure 4.5 Negative-staining electron microscopy of fibrils forming of N-
terminal truncated Hpa1 (55-138). (A) Fibril formation of 40 µM Hpa1 (55-138) in
20 mM MES (pH 6.5) and 20 mM NaCl, 0 day and 1 day, repectively. (B) Fibril
formation of 40 µM Hpa1 (55-138) in 20 mM Tris-HCl (pH 8.5) and 20 mM NaCl, 0
day and 1 day, respectively. The time point 0 h is defined as the moment
immediately following dilution of the protein in each buffer. (Scale bar = 100 nm).
A
B

114
4.4 Membrane lysis by Hpa1 (55-138)
Full length Hpa1 could damage the membranes prepared from E. coli lipid extraction
(Section 3.7). Membrane disruption might be an important characteristic of amyloid
fibrils that contributes to the toxicity of these fibrils. Liposomes were prepared as
described in section 2.13. Purified Hpa1 (55-138) was mixed with the liposomes and
incubated at RT for 1 day. The mixture of liposome and purified Hpa1 (55-138) were
loaded onto carbon coated grids and stained with 1% uranyl acetate. TEM
observation shows Hpa1 (55-138) could lyse the liposomes as did full length Hpa1
(Figure 4.6).
Figure 4.6 Liposomes lysed by Hpa1 (55-138). A and B, Liposomes lysed by
Hpa1(55-138); C, the intact liposome control. Scale bar = 100 nm. Black arrows
point to the disrupted liposomes.
C

115
4.5 Amyloid fibrils formed by peptides
In the study of HpaG, the N-terminal α-helix domain was synthesized and found to
be the domain responsible for fibril formation (Oh et al., 2007). One site located in
this N-terminal α-helix was thought to be the functional site, the mutation of which
blocked fibril formation (Oh et al., 2007). Similar fibril forming peptides have been
found in Alzeimer‘s β-amyloid peptides, Human amylin, and yeast prion sup35.
Hpa1 has two -helix domains located at the N- and C-terminus. In this study, the N-
terminal and C-terminal -helix domains were synthesized and nominated as peptide
1 and 2, respectively (Figure 4.2).
The ability of peptide 1 and peptide 2 to form amyloid fibrils at different pHs was
tested. Peptide 1 and peptide 2 were dissolved in different buffers at pH 6.5, 7.0 and
8.0. The TEM observation was performed immediately after dilution to show the
morphology of the peptide 1 and 2 in each buffer condition, or after 1 day incubation
at room temperature (Figure 4.7). Peptide 1 could not form fibrils at any pH (Figure
4.7A). In contrast, peptide 2 formed fibrils at pH 6.5, 7.0 and 8.5 (Figure 4.7 B and
C). These fibrils are straight with about a 12nm width, different from those formed
by Hpa1-His6 (Figure 3.7 B, C, E and F) and Hpa1-His6 (55-138) (Figure 4.5). They
clearly have 3 stands of protofibrils twisted together to form a mature fibril, as shown
in Figure 4.7 B.

116
Figure 4.7 Negative-staining electron microscopy of fibril formation of peptide
1 and peptide2 of Hpa1. (A) 40 µM peptide 1 of Hpa1 in buffer (20 mM MES, pH
6.5 and 20 mM NaCl), at 0 day and 1 day, respectively. (B) The fibril formation of
40 µM peptide 2 of Hpa1 in 20 mM MES (pH 6.5) and 20 mM NaCl at 0 day and 1
day. The mature fibrils twisted by 3 strands of protofibrils shown in the amplified
figure. (C) The fibril formation of 40 µM peptide 2 of Hpa1 in 20 mM MES (pH 7.0),
20 mM NaCl, and 20 mM Tris-HCl (pH 8.0), 20 mM NaCl. The time point 0 h is
defined as the moment immediately following dilution of the protein in each buffer.
(Scale bar = 100 nm)
0 day 1 day
0 day 1 day
pH 7.0 pH 8.0
Peptide1
Peptide2
Peptide2
A
B
A
C
A

117
4.6 Membrane lysis by peptides
Full length Hpa1 and Hpa1 (55-138) assemble into fibrils and damage the liposomes
prepared from E. coli lipids (Section 3.7 and 4.4). Membrane disruption could be an
important characteristics of amyloid fibrils that contributes to the toxicity of these
fibrils. Liposomes were prepared as described in section 2.13. 50 µM peptide 2 was
mixed with 5 mg liposomes and incubated at RT for 1 day. The mixture of liposome
and peptide 2 were loaded onto carbon coated grids and stained with 1% uranyl
acetate. Compared with the control, intact liposomes (Figure 4.6 C), TEM
observation shows peptide 2 could lyse liposomes as did full length Hpa1 and Hpa1
(55-138) (Figure 4.8). Fibrils formed by peptide 2 were also visible (white arrows
point to fibrils in Figure 4.8).
Figure 4.8 Liposomes lysed by fibrils formed by peptide 2 A, B, C and D,
Liposomes lysed by fibrils formed by peptide 2 of Hpa1 at 20 mM MES (pH 6.0) and
20 mM NaCl, the white arrows point to the fibrils and the black arrows point to the
broken liposome. (Scale bar = 100 nm)

118
4.7 Circular dichroism spectroscopy
Amyloid fibrils have a β-sheet rich structure. In order to study the secondary
structure of Hpa1 (55-138) and peptide 2 during fibril formation, CD spectroscopy
was performed. In order to minimize the strong absorbance from Cl- in the far UV
region, the buffer of Hpa1 (55-138) and peptide 2 was changed to Tris-base or
NaH2PO4, with NaF as salt. All CD spectra were analyzed using the software
Dichroweb online (Whitmore and Wallace, 2004 and 2008).
Truncated Hpa1 (55-138) has a high percentage of sheet structure at both pH 8.0 and
6.5, of 28.3% and 38.3%, respectively (Figure 4.9 A), which are fibrils under TEM
(Figure 4.5). These CD spectra data combined with TEM results suggest that the
fibril formed by Hpa1 (55-138) are beta sheet rich structures.
In the CD study of peptide 2, at pH 8.5, peptide2 has 15.5% helix, 43.6% sheet, 12%
turn, and 28.9% unordered structure (Figure 4.9 B). After 30 min incubation at
pH6.5, peptide 2 has 40.6% helix structure, 16.9% sheet structure, 22.2% turn
structure and 21.3% disordered structure (Figure 4.9 C).
In conclusion, both the fibrils formed by Hpa1 (55-138) and by peptide 2 have sheet
rich structures, but, in each case, not all the secondary structure is β-sheet structure.
Considering that peptides as short as 4 residues can form amyloid fibrils and their
atomic structures only have β-sheet structure (Nelson et al., 2005; Kajava et al.,
2007), peptide 2 is unlikely to be the minimal sequence in Hpa1 for fibril assembly.

119
Figure 4.9 CD spectroscopic analysis of Hpa1 (55-138) at pH 8.0 and pH 6.5,
peptide 2 at pH 8.0 and 6.5. (A) 5 µM Hpa1 (55-138) at pH 8.0 after 1 day
incubation (solid line), 5 µM Hpa1 (55-138) at pH 6.5 after 1 day incubation (dotted
line). (B) 10 µM peptide 2 at pH 8.0 (solid line), 10 µM peptide 2 at pH 6.5, 30 min
(dotted line).
4.8 Intramolecular interaction of Hpa1
To study the possible intramolecular interaction of Hpa1, the effect of peptide 1 on
peptide 2‘s fibril formation was tested. 40 µM peptide 1 and 40 µM peptide 2 were
diluted into pH 6.5 buffer (20 mM MES, 50 mM NaCl), and co-incubated at room
temperature for 1 day, after which the mixture was loaded onto carbon coated grids
and observed under TEM (Figure 4.10A). Compared with Figure 4.7 B and C,
peptide 2 cannot form fibrils in the presence of peptide 1. To rule out the low
concentration of samples resulting in the absence of fibrils during observation, the
concentrations of peptide 1 and peptide 2 were increased to 400 µM. After 1 day
incubation at RT in pH 6.5 buffer (20 mM MES, 50 mM NaCl), the mixture was
observed under TEM (Figure 4.10 B): no fibrils were observed, which indicates that
peptide 2 cannot form fibrils in the presence of peptide 1.
A
B

120
The ability of peptide 1 to block fibril formation by the full length and N-terminal
truncated Hpa1 was also tested. We found the fibrils formed by the full length and N-
terminal truncated Hpa1 survived in the presence of peptide 1 under EM.
Figure 4.10 Intramolecular interaction of Hpa1 (A) 40 µM peptide 1 inhibited the
fibrils formed by 40 µM peptide 2 in 20 mM MES (pH 6.5) and 20 mM NaCl. (B)
400 µM peptide 1 inhibited the fibrils formed by 400 µM peptide 2 in 20 mM MES
(pH 6.5) and 20mM NaCl.
4.9 Discussion
Polypeptides from fibril formation precursor proteins are widely reported to be the
segment responsible for the amyloid fibril formation (Table 1.2). They are the
products after the protease digestion of full length protein, e.g. Aβ40 and Aβ42 peptide
associated with Alzheimer‘s disease (Benzinger et al., 2000), or the predicted helix
domains of full length precursors of amyloid fibril formation, e.g. the poly-amino
acids from myoglobin (Fandrich et al., 2001) and amyloid forming peptide of HpaG
(Oh et al., 2007). To obtain the segment of Hpa1 involved in amyloid fibril
formation, we firstly truncated the N-terminus (1-54) of Hpa1 and then synthesized
two predicted -helical domains to localize the fibril forming segment.
A B

121
4.9.1 Domains of Hpa1
To study the function of the two predicted helix domains located at the N-terminus
(37-54) and C-terminus (87-105) of Hpa1, truncated Hpa1 (1-86 and 55-138) was
constructed and over-expressed (Figure 4.1 and 4.2). Hpa1 (1-86) failed to purify
because of the blockage of the Ni-column, which is probably due to the aggregation
of protein in vitro. In vivo fluorescence localization of Hpa1 (1-86) shows this
domain is responsible for binding to plant plasma membranes (communication with
Prof. Gongyou Chen, Nanjing Agricultural University). Hpa1 (55-138) functions as
the domain for fibril formation (Figure 4.5). In contrast to the full length Hpa1, this
segment forms fibrils at acidic and basic pH (Figure 4.5).
Even though HpaG and Hpa1 share 59.7% identity and similar secondary structures
(Figure 4.1), they have different domains for fibril formation. The N-terminal helix
domain of HpaG forms fibrils (Oh et al., 2007), in contrast with the C-terminal
helix domain of Hpa1. This difference might indicate the evolution of harpins in X.
oryzae pv. oryzicola and X. axonopodis pv glycines to fulfil their function in
different hosts.
4.9.2 Fibril-forming peptide of Hpa1
Polypeptides, derived from the segment of precursor proteins for amyloid fibril
formation have been widely studied to understand the mechanism for amyloid fibril
formation, as the basis for designing new inhibitors in amyloid fibril associated
diseases. The minimal length for amyloid fibril formation is a tetrapeptide, e.g.
NNQQ of yeast prion protein Sup35 (Sawaya et al., 2007). The C-terminal helix
domain, 19 amino acids (ASPLTQMLMNIVGEILQAQ), of Hpa1 forms fibrils at all
pHs tested (Figure 4.7), which indicates that the fibrils formed by peptide 2 is pH-
independent and an inherent characteristic of the sequence component.
CD spectrum analyses show fibrils formed by peptide 2 are a mixture of helix and
β sheet (Section 4.7). The secondary structure transition of peptide 2, recorded by
CD, found high percentage of sheet (43.6%) at pH 8.5, but a high percentage of helix

122
structure (40.6%) at pH 6.5. A possible explanation is that the precipitation of mature
fibrils at pH 6.5, which decreases the sheet structure content in the soluble state for
CD spectrum. Further work will be required to re-construct the 3-D structure of the
mature fibrils of peptide 2 by cryo-EM, and to establish the interaction between the 3
strands of protofibrils in the mature fibril assembly.
In addition, considering that the minimal segment for fibril formation is a
tetrapeptide (Sawaya et al., 2007; Tjernberg et al., 2002) and that the peptide Aβ(1-
42) lacking residues 14-23 is not fibrillogenic (Tjernberg et al., 1999), the minimal
segment of peptide 2 of Hpa1 for fibril formation could be determined in future work.
4.9.3 Membrane disrupted by fibrils
Several mechanisms have been proposed to explain the pathogenicity of amyloid
fibrils, e.g. membrane disruption, ion channel formation and permeabilization of
membranes (Engel et al., 2008; Kayed et al., 2004; Quist et al., 2005). The
intermediate state, soluble amyloid oligomers, has been assumed as the main
cytotoxic species. The function of fibril formation of Hpa1 in the pathogenicity of
Xoc on plants is still unclear.
In this study, the fibrils formed by the segment or polypeptide of Hpa1 could damage
the membranes directly after mixing them (Figure 4.6 and 4.8). Engel et al., 2008
reported that the human islet amyloid polypeptide (IAPP) damaged the membrane
through fibril growth on the membrane (Engel et al., 2008). However, in this study, it
is fibrils that damage the membrane, since the fibrils had already formed by Hpa1
(55-138) and peptide 2 of Hpa1 before mixing with liposomes (Figure 4.5, 4.5, 4.7
and 4.8). This direct function of membrane damage by the fibrils formed by Hpa1
raises the possibility that harpins not only trigger signal transduction to induce cell
death (Alfano and Collmer, 2004) but also damage the cell membrane directly after
being infiltrated into the intercellular space of nonhost leaves. Further work is
required to support this hypothesis in vivo.

123
4.9.4 Intramolecular interaction of Hpa1
Peptide 2 (C-terminal helix domain) of Hpa1 forms fibrils, whereas peptide 1 (N-
terminal helix domain) of Hpa1 can not assemble into fibrils (Figure 4.7). However,
fibrils formed by peptide 2 of Hpa1 were disassembled by peptide 1 (Figure 4.10 A
and B). These results suggest that the assembly of fibrils by Hpa1 requires the
separation of the fibril forming domain (peptide 2 segment) from the N-terminal
domain (peptide 1), which is consistent with the report that the intermolecular
contacts and separation of regions from the N-terminal region of Sup35 are both
required for fibril assembly (Krishnan and Lindquist, 2005). In addition, the presence
of such domains in preventing fibril assembly provides clues to developing methods
to prevent fibril assembly or dissemble preformed fibrils.

124
Chapter 5 Crystallization and preliminary structure analysis of the
Vibrio cholerae VceR drug-pump repressor in complex with bound
DNA
In this chapter, I report on the crystallization and structure analysis of VceR in
complex with bound DNA. In optimizing the crystallization process, I have used
different lengths and end designs of synthetic DNA oligonucleotides whilst
purification of the protein/DNA complex was carried out to improve the diffraction
power of the native VceR/DNA crystals. A native data set was processed to 3.15 Å.
In phasing, anomalous scattering from Br labelled DNA and Se-Met substituted
VceR was used. The positions of Se were located successfully by ShelxD and an
interpretable electron density map was obtained. A preliminary model with one
VceR dimer and an 11 bp base pair DNA duplex was built.
5. 1 VceR and QacR sequence alignment
VceR and QacR are both members of the TetR family of repressors (Borges-
Walmsley et al., 2005). It has been suggested that two dimers of VceR bind the 28 bp
region of vceCAB operon, similar to the interaction of QacR with its cognate DNA
(Borges-Walmsley et al., 2005). To determine the sequence similarity of VceR and
QacR, the VceR and QacR sequences were aligned with Vector NTI. QacR and
VceR display 17.7% overall identity, but higher identity, 29.8%, in the DNA binding
domain (1-3). Compared with QacR, VceR has an 8 amino acid insertion in the
drug binding domain between helix 7 and helix 8 (Figure 5.1), which could reflect
differences in the ligands bound. VceR also has 5 extra amino acids at the beginning
of the N-terminus (Figure 5.1).

125
1 50
VceR (1) MRVKSEEKRQAILEIAKDSFTKQGFEQTSMSHIAKMLGGSKATLYNYFSS
QacR (1) -----MNLKDKILGVAKELFIKNGYNATTTGEIVKLSESSKGNLYYHFKT
hhhhhhhhhhhhhhhh hhhhhhhh hhhhhhh
51 100
VceR (51) KEEIFTAVM---ESSATEQIALSFLSLDHNRELKPALLEFGYNFLNSVLT
QacR (46) KENLFLEILNIEESKWQEQWKKEQIKCKTNREKFYLYNELSLTTEYYYPL
hhhhhhhhhhhhhhhhhhhhhhhhhh hhhhhhhhhhhhhh
101 150
VceR (98) QDAMSIYRMAIHEADRSAIGRHFYENGPKRGWARLSRYITCQIECGSLKE
QacR (96) QNAIIEFCTEYYKTNSINEKMNKLENKYIDAYHVIFKEGNLNGEW-----
hhhhhhhhhhhhh hhhhhhhhhhhhhhhhhhhhhhhhhhh
151 200
VceR (148) CDPWIAAMHFKALLSAQYFEPFSLGAIEKPTSSELKATTQRAVEAFLCLY
QacR (141) ---CINDVNAVSKIAANAVNGIVTFTHEQNINERIKLMNKFSQIFLNGLS
hhhhhhhhhhhhhhhhhh hhhhhhhhhhhhhhhhhh
201
VceR (198) AAD
QacR (188) K--
Figure 5.1 VceR and QacR sequence alignment and secondary structures.
VceR and QacR display 17.7% identity, and identical residues are underlined. h
shows -helix structure of QacR (Schumacher et al., 2002; PDB code: 1JT0).
5. 2 Oligodeoxynucleotide preparation
To obtain VceR/DNA complex crystals, the operator sequence bound by VceR was
studied (Borges-Walmsley et al., 2005) and the oligodeoxynucleotides from this
study were ordered from MWG purified by HPSF (high purity salt free) purification.
Purified P5 and P6 oligodeoxynucleotides were dissolved to a final concentration 1
mM in 10 mM MgCl2, respectively. Equal volumes of these two corresponding
oligodeoxynucleotides were mixed, placed in a heating block at 95oC for two
minutes and then allowed to cool to ambient temperature for annealing, which
formed the duplex (Figure 5.2) at a concentration of 500 µM for crystallization.

126
Figure 5.2 P56 duplex used for VceR/dsDNA co-crystallization. The inverted
repeats (IR) are shown in bold letters. (Borges-Walmsley et al., 2005).
5.3 VceR purification
VceR-His6-pET21a(+) (Table 2.1) was transformed into BL21(DE3) for over-
expression (Section 2.4.8). The over-expression of VceR-His6 was achieved as
described in Section 2.7.1 and purification was carried out as described in Section
2.7.2. The column was washed with buffer (50 mM Tris-HCl, 300 mM NaCl, 10%
glycerol, 100 mM imidazole, 0.5 mM THP, pH 7.0) to remove contaminating
proteins. The protein was eluted with buffer (50 mM Tris-HCl, 300 mM NaCl, 10%
glycerol, 500 mM imidazole, 0.5 mM THP, pH 7.0). 20 µl aliquots of the VceR-His6
protein (23.4 kDa) were run out on a 12% SDS-PAGE gel (Figure 5.3).
Figure 5.3 A Coomassie blue stained SDS-PAGE gel of VceR-His6 (23.4 kDa)
purified by Ni2+
affinity chromatography. Lane 1-9: VceR-His6. Lane 10: See blue
marker (Invitrogen) in MES buffer
5‘-AGTATAACTGTACGGTACGGTTTAGTTATA-3’
3‘-TCATATTGACATGCCATGCCAAATCAATAT-5‘
30-mer with blunt end (P56):
28 kDa
18 kDa VceR
1 2 3 4 5 6 7 8 9 10

127
VceR-His6 was further purified using a Hi-load 16/60 Superdex 200 prep grad
column (GE Healthcare) according to the protocol described in Section 2.5.3 (Figure
5.4). 20 µl aliquots of the VceR purified from the gel filtration chromatography were
run out on a 12% SDS-PAGE gel (Figure 5.5).
Figure 5.4 The elution chromatography of VceR-His6 from a Hi-load 16/60
Superdex 200 prep grad column.
Peak 1
VceR

128
Figure 5.5 A Coomassie blue stained SDS-PAGE gel showing VceR-His6 protein
purified by size-exclusion chromatography. Lane 1-5 correspond to fractions from
peak 1 in Figure 5.4. Lane 6: See blue marker (Invitrogen) in MES buffer
5.4 Crystallization of VceR/dsDNA
Initial crystallization trials of VceR/dsDNA complex were performed by Dr. David
Albesa-Jove and Beth Ashbridge (Department of Chemistry, University of Durham).
The P56 duplex (Figure 5.2) was used in their study. In their experiments, 2 M
ammonium phosphate, 100 mM Tris-HCl at pH 8.5 (The Classics Suite, 27, Qiagen),
was used to obtain crystals, which were taken as seeds in 1 M ammonium phosphate,
100 mM Tris-HCl at pH 8.5 (The Classics Lite Suite, 27, Qiagen) to grow larger-
sized crystals. Figure 5.6 shows the optimization procedure used in this study to
obtain a 3.15 Å native data set.
1 2 3 4 5 6
VceR
28 kDa
18 kDa

129
Figure 5.6 The optimization procedure to obtain a 3.15 Å native data set.
According to a crystallization product report (Qiagen), the pH of the crystallization
buffer used by Dr. David Albesa-Jove (2 M ammonium phosphate, 100 mM Tris-
HCl at pH 8.5) is 4.01 and that of 1 M ammonium phosphate, 100 mM Tris-HCl at
pH 8.5 is 4.7. In my work, the crystallization conditions around these were screened
(Table 5.1 and 5.2). Tris-HCl was used as the buffer to adjust the pH of the
crystallization condition. However, in this condition, 1-2 M of ammonium hydrogen
phosphate changes the final pH dramatically and 0.1 M Tris-HCl loses its control
over the pH. In ammonium phosphate and pH screen II, Tris-HCl was not used.
Under buffer conditions B1, B2, B3, B4, C1, C2 and C3 of Table 5.1, and E1, E2, E3,
F1, F2, F3, G1and G2 of Table 5.2, the VceR/dsDNA complex could form crystals.
As a control, VceR cannot form crystals in these conditions (Figure 5.7 A). For the
best diffracting crystals with this pair of oligos, the drop consisted of 1μl 10 mg/ml
VceR/dsDNA (the molar ratio of VceR monomer : dsDNA= 2:1 for mixing before
crystallization) in 50 mM MES, 200 mM KCl, 4 μM DTT at pH 7.0, plus 2μl of well
solution, which was 1 M ammonium phosphate, at pH 4.05.

130
Table 5.1 Ammonium phosphate and pH screen I
Table 5.2 Ammonium phosphate and pH screen II
In order to optimize the crystallization conditions, different methods, such as low
temperature, adding silicon oil to the drop and decreasing the concentration of
protein, were tried to decrease the evaporation speed and nucleation forming in drops.
The incubation at 4oC was chosen after comparison with drops from 20
oC (Figure 5.7
B and 5.7 C). The low temperature not only decreases the evaporation speed, but also
increases the stability of protein in the drops, resulting in larger crystals (Figure 5.7
B and 5.7 C).
Micro-seeding was also used to grow bigger crystals in this study. The crystals in
Figure 5.7 B were taken as the seeds and transferred into new drops containing 2 μl
10 mg/ml VceR/dsDNA (the molar ratio of VceR monomer: dsDNA = 2:1) in 50
mM MES, 300 mM KCl, 4 μM DTT at pH 7.0, plus 4 μl of well solution, which was
a solution of 100 mM Tris-HCl, 1 M ammonium phosphate, at pH 4.05. However,
the diffraction power of the resulting crystals was not improved by seeding.
A1 A2 A3 A4 A5 A6
B1 B2 B3 B4 B5 B6
C1 C2 C3 C4 C5 C6
D1 D2 D3 D4 D5 D6
1 M
ammonium
phosphate
2 M
ammonium
phosphate
pH 3.8
pH 4.4
A1 A2 A3 A4 A5 A6
B1 B2 B3 B4 B5 B6
C1 C2 C3 C4 C5 C6
D1 D2 D3 D4 D5 D6
0.75 M
ammonium
phosphate
1 M
ammonium
phosphate
pH 4.0
pH 4.3

131
For the additive screening (Section 2.15), additive 10, (0.1 M ZnCl2) (Figure 5.7 D)
and 53 (10% PEG3350) (Figure 5.7 E) gave much larger crystals and were selected
for the subsequent crystallization optimization.
5.5 Crystallization of VceR-CCCH/dsDNA
In the crystallization of QacR, cysteines were mutated to serines to prevent serious
cross-linking and oxidation problems observed in the wild-type protein (Schumacher,
et al., 2002). In this study, cysteine 138, 142, 148 and histidine 156 were mutated to
serine, serine, serine, and arginine, for crystallization and structure analysis. The site
directed mutagenesis of pET21a-VceR was performed as described in Section 2.6.
The mutagenic primers vceR-C148S-Forward and vceR-C148S-Reverse were used as
detailed in Table 2.4. The pET21a-vceR ds-DNA was used as the template. Mutant
strand synthesis using PCR was achieved with an extension time of 6 minutes. The
clones were sequenced to ensure the correct was selected mutant. Then, VceR-C148S
was used as the template and the primers vceR-C138S-C142S-Forward and vceR-
C138S-C142S-Reverse (Table 2.6, primers designed by Dr. M. Ines Borges-
Walmsley) were utilized to get VceR-C138, 142, 148S. Finally, the correct VceR-
C138, 142, 148S was used as the template and the primers vceR-H156R-Forward and
vceR-H156R-Reverse (Table 2.6, primers designed by Dr. M. Ines Borges-Walmsley)
were utilized to get the VceR-CCCH derivative. After sequencing, the correct clones
were transformed into BL21(DE3) for over-expression.
Purification of the VceR-CCCH derivative was performed as for VceR in Section 5.3.
The VceR-CCCH/DNA crystallization was performed as for VceR/DNA. Figure 5.7
F shows crystals formed by VceR-CCCH/dsDNA (P56) in the presence of PEG3350
at 4 oC.

132
Figure 5.7 Crystals formed by VceR or VceR-CCCH in complex with the DNA
duplex P56 (A) VceR-His6 precipitated in crystallization buffer (1 M ammonium
phosphate, pH 4.0). (B) Crystals of VceR/dsDNA (P56) from the condition (1 M
ammonium phosphate, pH 4.0), at 20oC. (C) Crystals of VceR/dsDNA (P56) from
the condition (1 M ammonium phosphate, pH 4.0), at 4oC. (D) Crystals of
VceR/dsDNA (P56) formed in the presence of Zn2+
at 4oC. (E) Crystals of
VceR/dsDNA (P56) formed in the presence of PEG3350 at 4oC. (F) Crystals of
VceR-CCCH/dsDNA (P56) formed in the presence of PEG3350 at 4 oC.
A B
C D
E F
200 µm
300 µm
250 µm

133
5.6 Crystal freezing and X-ray diffraction tests
To freeze the crystals for X-ray diffraction at 100 K, 30% MPD, 30% PEG400, 30%
sucrose, 30% PEG3350, saturated ammonium phosphate and 30% glycerol were
tested to find out if they provided suitable cryo-protection. However, according to
diffraction tests, no significant differences were found in these cryo-protectants. 30%
glycerol was chosen as the cryo-protectant. A typical diffraction pattern from the
SLS is shown in Figure 5.8. The diffraction data are summarized in Table 5.3.
Figure 5.8 Diffraction pattern of VceR-CCCH/P56 at SLS beamline X06DA.

134
Proteins dsDNA Crystals Diffraction limits
VceR P56 150 μm in length,
No additive
4 Å
VceR P56 150 μm in lenth,
additive ZnCl2,
(Figure 5.7D)
Crystals
disappeared in the
30% glycerol as
cryo-protectant.
VceR-CCCH
derivative
P56 200 μm in length
(Figure 5.7F), with
additive PEG3350
3.7 Å
VceR-CCCH
derivative
P56 280 μm in length,
with additive
ZnCl2
4.3-6 Å
Table 5.3 Summaries of the diffraction limits for VceR/DNA crystals from P56
30 bp duplex DNA.
5.7 Oligodeoxynucleotide screening for diffraction quality improvement.
In protein/DNA complex crystallization, the length and construction of the DNA
fragment and the nature of the terminal nucleotides should be considered in
establishing conditions to form crystals of protein/DNA complexes and for
improving the diffraction of protein/DNA complex (Aggarwal, 1990; Pohl et al.,
1999).
The oligodeoxynucleotides used for VceR/dsDNA complex crystallization were the
original from Borges-Walmsley et al., 2005 and further oligonucleotide screening
was on the basis of P56 duplex (Figure 5.2). To improve the diffraction quality,
different pairs of oligodeoxynucleotides were designed (Table 2.5).
P56-1 and P56-2 were designed to form 28 bp duplexes with a high order palindrome
for VceR binding; P56-3 was designed as the 28 bp duplexes without site mutation
from the original promoter sequence (P56); P56-4 was designed to form a 30-mer
with one overhang; P56-5 was designed to form a 29-mer with one overhang; P56-6
was designed to form a 28-mer with two overhangs; P56-7 was designed to form a

135
31-mer with blunt ends. P56-24, P56-26, P56-27, were designed to form 24 bp, 26 bp
and 27 bp length duplexes on the basis of P56-1. All these oligo pairs were shown in
Table 2.5.
5.7.1 Purification of the VceR-CCCH/DNA complex
VceR-CCCH was purified as described previously (Section 5.3). Gel filtration
purified VceR-CCCH was mixed with DNA (Table 2.5), and incubated at 4 oC for 1
hour. The mixture of VceR-CCCH and oligos were loaded onto a Hiload 16/60
superdex 200 gel filtration column, pre-equilibrated with buffer (25 mM MES, 200
mM NaCl, 6 mM DTT, pH 7.0) for protein/dsDNA complex purification. The
VceR/DNA complex has an elution volume of 68.02 ml, in contrast to 80 ml for the
VceR dimer on the same column (Figure 5.9). In addition, the 260/280 nm ratio, 1.7,
for VceR/DNA complex, indicated the formation of VceR/DNA complex, which is 2
for pure DNA and 1.2 for VceR. The purified complex was concentrated to 10 mg/ml
for crystallization screening.

136
Figure 5.9 The elution chromatography of VceR-CCCH/DNA complex from a Hi-load 16/60 Superdex 200 prep grad column. The curve of UV 260 nm is shown
in red and UV 280 nm in blue.
5.7.2 Crystallization of purified VceR-CCCH/DNA complex
As described in Section 2.14, the crystallization screening of purified VceR-
CCCH/DNA complex was performed. After 3 week incubation at 20oC, crystals of
purified VceR-CCCH/P56 (30 bp oligos) were obtained in the following conditions:
(1) A8 (0.1 M sodium acetate, pH 5.5, 1.8 M lithium sulphate) of the Clear strategy
screen from Molecular Dimensions
(2) B1 (0.1 M sodium citrate, pH 4.0, 0.8 M ammonium sulphate) of the JCSG-plus
from Molecular Dimensions (Page et al., 2003).
Crystals of purified VceR-CCCH/P56-1 (28 bp oligos) were obtained in the
following conditions:
VceR/DNA
complex
Unbound
DNA

137
(1) C11 (0.1 M sodium acetate pH 4.6, 2 M ammonium sulphate) of JCSG-plus from
Molecular Dimensions
(2) B1 (0.1 M sodium citrate, pH 4.0, 0.8 M ammonium sulphate) of JCSG-plus from
Molecular Dimensions
The optimization was based on these crystallization conditions. A gradient of pH and
concentration of precipitant was set up as shown in Table 5.4, 5.5 and 5.6. The
crystals from these conditions are shown in Figure 5.10. Different DNA pairs (Table
2.5) in complex with VceR-CCCH were purified by gel filtration and used in the
crystallization conditions in Tables 5.4, 5.5 and 5.6. The VceR-CCCH/P56-24 and
VceR-CCCH/P56-26 complexes were not stable. The crystals were frozen in liquid
nitrogen and taken to the SLS for diffraction analysis. Crystals could be formed from
VceR-CCCH/P56-3, VceR-CCCH/P56-5, VceR-CCCH/P56- 6, VceR-CCCH/P56-27
and VceR-CCCH/P56-28, but the diffraction from them did not exceed 3.2 Å. The
best diffraction was 3.15 Å from the VceR-CCCH/P56-1 crystal in 0.1 M Na citrate
pH 4.0, 0.85 M ammonium sulphate) with 30% glycerol as cryo-solution. Table 5.7
shows data collection statistics of a VceR-CCCH/P56-1 crystal.
Table 5.4 Lithium sulphate and pH gradient screen
Table 5.5 Ammonium sulphate and pH gradient screen I
A1 A2 A3 A4 A5 A6
B1 B2 B3 B4 B5 B6
C1 C2 C3 C4 C5 C6
D1 D2 D3 D4 D5 D6
pH 5.2
pH 5.7
1.6 M
lithium
sulphate
1.9 M
lithium
sulphate
A1 A2 A3 A4 A5 A6
B1 B2 B3 B4 B5 B6
C1 C2 C3 C4 C5 C6
D1 D2 D3 D4 D5 D6
pH 3.8
pH 4.3
0.75 M
ammonium
sulphate
0.9 M
ammonium
sulphate

138
Table 5.6 Ammonium sulphate and pH gradient screen II
Figure 5.10 Crystals formed from the purified protein/DNA complex.
(A) VceR-CCCH/dsDNA (P56) crystals formed in the crystallization buffer (0.1 M
Na acetate, pH 4.8, 1.6 M lithium sulphate) at 20oC. (B) VceR-CCCH/dsDNA (P56-
1) crystals formed in the crystallization buffer (0.1 M Na citrate, pH 4.0, 0.85 M
ammonium sulphate) at 20oC. (C) VceR-CCCH/dsDNA (P56-1) crystals formed in
the crystallization buffer (0.1M Na acetate pH 5.4, 1.8 M ammonium sulphate) at
20oC (D) VceR-CCCH/dsDNA (P56-1) crystals in cryo-solution under the flow of
cold nitrogen (ice formed around the loop)
A1 A2 A3 A4 A5 A6
B1 B2 B3 B4 B5 B6
C1 C2 C3 C4 C5 C6
D1 D2 D3 D4 D5 D6
1.8 M
ammonium
sulphate
2.1 M
ammonium
sulphate
pH 4.4 pH 4.9
A B
C D
300 µm

139
Native
Beamline SLS X06DA
Wavelength (Å) 1.000
Resolution (Å) 43.17-3.15
(last shell) 3.25-3.15
Rmerge a b
0.086(0.665)
Total/Unique
reflections
72717/10918
Completeness 97.8(96.3)
Multiplicity 4.2
I/σ(I) 19.3(1.8)
Cell dimensions a= b=90.2 Å, c=298.0 Å, α=β=γ=90°
Space group I 41/322
Table 5.7 Data collection statistics of a VceR-CCCH/P56-1 crystal.
a The values in parentheses of Rmerge, completeness, and I/σ(I) correspond to the
outermost resolution shell. b Rmerge = ΣhΣj |I(h;j)- <I(h)>| /ΣhΣjI(h), where I(h;j) is the jth measurement of the
intensity of the unique reflection h, and <I(h)> is the mean overall symmetry-related
measurements.

140
5.8 Br-labelled crystals
To provide phasing information, the QacR/DNA model was used in molecular
replacement. However, the low identity (17.7%) between QacR and VceR hampered
successful structure solution. Thus, brominated DNA oligonucleotides were designed
and crystallized in complex with VceR.
Brominated DNA P5-1-BrP6-1 (Table 5.8), in which thymines were substituted with
5-Br-uracil, was synthesized from Operon, and co-crystallized with VceR-CCCH.
Three wavelength MAD data sets were collected from a crystal of VceR-CCCH/P5-
1-BrP6-1 at the DLS. A typical diffraction pattern for a VceR-CCCH/P5-1-Br
crystal at the DLS is shown in Figure 5.11. Table 5.9 shows data collection statistics
of a VceR-CCCH/P5-1-BrP6-1 crystal.
P5-1-BrP6-1:
5‘-TATAACTAAACGGTACGGTTTAGTTATA-3‘
3‘-ATATTGATTTGCCATGCCAAATCAATAT-5‘
Duplex-PLS1 (DPLS1) :
5‘-TATAACTAAACGGTACGGTTTAGTTATA-3‘
3‘-ATATTGATTTGCCATGCCAAATCAATAT-5‘ Duplex-PLS2 (DPLS2) :
5‘-TATAACTAAACGGTACGGTTTAGTTATA-3‘
3‘-ATATTGATTTGCCATGCCAAATCAATAT-5‘
Table 5.8 Brominated DNA duplexes for phasing calculation. Bold thymines
were substituted with 5-Br-uracil.

141
Figure 5.12 A diffraction pattern for a VceR-CCCH/ P5-1-BrP6-1 crystal
recorded at the Diamond Light Source.
Palindromic sequences labelled with Br (DPLS1 and DPLS2, Table 5.8) were
designed (explanation in Section 5.9). Purification of VceR-CCCH in complex with
DPLS1 and DPLS2 were performed as for the VceR-CCCH/P56-1 complex and
similar crystallization conditions were used. Crystals of VceR-CCCH/DPLS2 were
obtained and a three wavelength MAD data set was collected. Table 5.10 shows data
collection statistics of a VceR-CCCH /DPLS2 crystal.

142
Br (nonpalindromic)
Peak Inflection point Remote
Beamline DLS I04 DLS I04 DLS I04
Wavelength (Å) 0.9200 0.9202 0.9132
Resolution (Å) 48.83-3.25 48.91-3.48 48.86-3.48
(last shell) 3.35-3.25 3.58-3.48 3.58-3.48
Rmerge a b
0.096(0.623) 0.084(0.484) 0.087(0.516)
Total/Unique
reflections
220277/9903 187621/7980 180026/7831
Completeness 94.7(74.8) 92.6 (60.7) 91.3 (60.4)
I/σ(I) 18.6(1.6) 19.1(4.5) 21.9(4.5)
Cell dimensions a=b=91.0, c= 299.9
Å, α=β=γ=90°
a=b=91.0, c= 299.9
Å, α=β=γ=90°
a=b=91.0,c= 299.9
Å, α= β= γ=90°
Space group I 41/322 I 41/322 I 41/322
Table 5.9 Data collection statistics of a VceR-CCCH/P5-1-BrP6-1 crystal.
a The values in parentheses of Rmerge, completeness, and I/σ(I) correspond to the
outermost resolution shell. b Rmerge = ΣhΣj |I(h;j)- <I(h)>| /ΣhΣjI(h), where I(h;j) is the jth measurement of the
intensity of the unique reflection h, and <I(h)> is the mean overall symmetry-related
measurements.

143
Br (palindromic)
Peak Inflection Remote
Beamline DLS I04 DLS I04 DLS I04
Wavelength (Å) 0.9198* 0.9204* 0.9050*
Resolution (Å) 49.96-3.6 49.96-3.5 48.67-3.71
(last shell) 3.69-3.6 3.6-3.5 3.80-3.71
Rmerge a b
0.103(0.586) 0.087(0.647) 0.121(0.645)
Total/Unique
reflections
80590/7584 40124/8325 52413 /6986
Completeness 98.6 (89.0) 93.0 (66.2) 98.9 (93.3)
I/σ(I) 12.31(4.0) 10.81(2.6) 9.07(2.9)
Cell dimensions a=b=90.6, c= 299.4
Å, α=β=γ=90°
a=b=90. 6, c=299.4
Å, α= β=γ=90°
a=b=90. 6, c= 299.4
Å, α= β= γ=90°
Space group I 41/322 I 41/322 I 41/322
Table 5.10 Data collection statistics of a VceR-CCCH /DPLS2 crystal
a The values in parentheses of Rmerge, completeness, and I/σ(I) correspond to the
outermost resolution shell. b Rmerge = ΣhΣj |I(h;j)- <I(h)>| /ΣhΣjI(h), where I(h;j) is the jth measurement of the
intensity of the unique reflection h, and <I(h)> is the mean overall symmetry-related
measurements.
* These values are estimated of true energy only because no fluorescence emission
scanning device is available.

144
5.9 Substructure solution of Br
As described in 2.14.4, Xprep (Bruker AXS, Madison, USA) was used to produce
input files for running on ShelxD (Schneider and Sheldrick, 2002; Sheldrick, 2008)
in order to determine the Br positions. The anomalous signals of Br from a VceR-
CCCH/P5-1-BrP6-1 crystal are shown in Table 5.11. Even though the anomalous
signal from Br scatterers is not poor, the correct position of Br could not be located.
The possible explanation is that the pseudo-symmetry of the Br sites breaks the
crystal symmetry (only half of 28 bp duplex in the asymmetric unit). Two pairs of
brominated DNA duplex with palindromic Br sites were thus designed and tried
(DPLS1 and DPLS2 in Table 5.8). However, the device for fluorescence emission
scanning was not available at DLS when we tested these crystals. Consequently, the
theoretical values were used. Thus, the anomalous signal of Br from these crystals
(VceR-CCCH/DPLS2) is weak (Table 5.12) and the CC between the 3 wavelength
data sets is low (Table 5.13). The correct positions of Br sites cannot be determined
for phasing.
Resolution
(Å)
8.0 6.0 5.0 4.8 4.6 4.4 4.2 4.0 3.8 3.6 3.4
Anomalous
signal/noise
ratios
(peak )
1.89 1.50 1.31 1.27 1.18 1.1 1.19 1.12 1.06 1.06 0.99
Table 5.11 Anomalous signal/noise ratios of VceR-CCCH/P5-1-BrP6-1 data set. The values are based on variances of F
+ and F
-, calculated by Xprep. The cutoff of
significant anomalous signals is shown in bold.

145
Resolution
(Å)
8 6 5.4 5.2 5.0 4.8 4.6 4.4 4.2 4.0 3.8
Anomalous
signal/noise
ratios (Peak)
1.34 1.30 1.24 1.20 1.15 1.14 0.95 1.07 1.15 1.03 0.92
Anomalous
signal/noise
ratios
(Inflection)
1.07 1.18 1.2 1.05 1.17 1.16 1.07 1.17 1.12 1.00 1.01
Anomalous
signal/noise
ratios(Remote)
1.25 1.04 1.13 1.29 1.38 1.26 1.31 1.17 1.17 1.09 1.01
Table 5.12 Anomalous signal/noise ratios of VceR-CCCH/DPAL2 data set. The
values are based on variances of F+ and F
-, calculated by Xprep. The cutoff of
significant anomalous signals of each data set is shown in bold.
Resolution
(Å)
8 6 5.4 5.2 5.0 4.8 4.6 4.4 4.2 4.0 3.8
Peak
Against
Remote
(%)
7.6 39.1 28.7 18.1 10.9 6.8 6.6 -8 2 10.6 4
Inflection
Against
Remote
(%)
8.5 28.8 20.2 8.7 -15.9 -7.4 -4.0 2.4 1.7 -1.9 0.6
Inflection
Against
Peak (%)
20.3 30.4 23.5 1.7 3.9 4.5 14.3 -4.5 1.3 9.3 5.3
Table 5.13 Low anomalous correlation coefficients (%) between peak, remote
and inflection of VceR-CCCH/DPAL2 data set, calculated by Xprep.
5.10 Preparation of selenomethionine-containing proteins
As described in Section 2.14.2, selenomethionine substituted VceR-CCCH was
prepared and purified. The crystallization of the Se-VceR-CCCH/DNA was
performed as for VceR-CCCH/DNA (Section 5.7.1 and 5.7.2).
5.11 Data collection and processing

146
Scanning the fluorescence emission spectrum of crystals of the Se-VceR/DNA at the
SLS clearly showed the presence of Se in the crystals and was used in selecting the
wavelengths for MAD. The data collection statistics of a Se peak data set is
summarized in Table 5.14 and those of two Se-MAD data sets are summarized in
Table 5.15 and 5.16.
Se peak
Beamline SLS X06SA
Wavelength (Å) 0.9793
Resolution (Å) 49.95-3.50
(last shell) 3.60 - 3.50
Rmerge a b
18.3(76.4)
Total/unique
reflections
84400/8350
Completeness 99.6(97.0)
I/σ(I) 8.5(3.0)
Cell dimensions a= b=90.8, c=299.0 Å, α=β=γ=90°
Space group I 41/322
Table 5.14 Data collection statistics of a Se-VceR-CCCH/P56-1 crystal (Se data
set I).
a The values in parentheses of Rmerge, completeness, and I/σ(I) correspond to the
outermost resolution shell. b Rmerge = ΣhΣj |I(h;j)- <I(h)>| /ΣhΣjI(h), where I(h;j) is the jth measurement of the
intensity of the unique reflection h, and <I(h)> is the mean overall symmetry-related
measurements.

147
Se
Peak Inflection Remote
Beamline SLS X06SA SLS X06SA SLS X06SA
Wavelength (Å) 0.9795 0.9797 0.9686
Resolution (Å) 48.86-3.75 50.05-3.76 48.86-3.71
(last shell) 3.85-3.75 3.86-3.76 3.81-3.71
Rmerge a b
11.4(49.1) 12.4(51.4) 11.4(55.7)
Total/Unique
reflections
47061/6788 59929/6743 65011/6979
Completeness 98.1 (91.2) 98.1 (89.9) 97.8(86.2)
I/σ(I) 10.1(3.2) 10.6(4.3) 12.2(4.4)
Cell dimensions a=b=91.2, c=299.3
Å, α=β=γ=90°
a=b=91.0, c=299.0
Å, α=β=γ=90°
a=b=91.2, c=299.3
Å, α=β=γ=90°
Space group I 41/322 I 41/322 I 41/322
Table 5.15 Data collection statistics of a Se-VceR-CCCH/P56-1 crystal (Se data
set II)
a The values in parentheses of Rmerge, completeness, and I/σ(I) correspond to the
outermost resolution shell.
b Rmerge = ΣhΣj |I(h;j)- <I(h)>| /ΣhΣjI(h), where I(h;j) is the jth measurement of the
intensity of the unique reflection h, and <I(h)> is the mean overall symmetry-related
measurements.

148
Se
Peak Inflection point Remote
Beamline SLS X06SA SLS X06SA SLS X06SA
Wavelength (Å) 0.9795 0.9797 0.9686
Resolution (Å) 49.88-3.6 49.77-3.78 49.77-3.75
(last shell) 3.70-3.60 3.87-3.78 3.85-3.75
Rmerge (%)a b
14.1(63.5) 17.5(48.4) 14.4(51.4)
Total/unique
reflections
53691/7653 58934/6555 53756/6755
Completeness 99.4(96.3) 98.3(84.7) 98.9(92.4)
I/σ(I) 7.14 (2.2)
5.35(2.5) 7.16(3.3)
Cell dimensions a=b=90.6, c= 298.4
Å, α=β=γ=90°
a=b=90.6, c=298.4
Å, α= β=γ=90°
a=b= 90.6, c= 298.4
Å, α= β=γ=90°
Space group I 41/322 I 41/322 I 41/322
Table 5.16 Data collection statistics of a Se-VceR-CCCH/P56-1 crystal (Se data
set III)
a The values in parentheses of Rmerge, completeness, and I/σ(I) correspond to the
outermost resolution shell. b Rmerge = ΣhΣj |I(h;j)- <I(h)>| /ΣhΣjI(h), where I(h;j) is the jth measurement of the
intensity of the unique reflection h, and <I(h)> is the mean overall symmetry-related
measurements.

149
5.12 Substructure solution of Se
For Se substructure determination, the f’ and f’’ values for Se at peak, inflection
point and high energy remote were obtained from
http://skuld.bmsc.washington.edu/scatter/AS_form.html. Xprep (Bruker AXS,
Madison, USA) was used to produce input files for running on ShelxD (Schneider
and Sheldrick, 2002; Sheldrick, 2008) in order to determine the Se positions.
However, the correct Se positions could not be determined from the Se data sets I, II
or III (Table 5.14, 5.15 and 5.16) singly. Finally, two data sets (Se data set II and III)
of three wavelengths (Table 5.15 and 5.16) and one peak data (Se data set I) (Table
5.14) were scaled and merged together with Xprep (Bruker AXS, Madison, USA).
Table 5.17 shows the anomalous signal/noise ratios of the merged Se-MAD data set
and Table 5.18 shows the anomalous correlation coefficient between peak, inflection
and high energy remote data of the merged Se-MAD data set. Using this merged data
set, the 12 selenium positions in the asymmetric unit were located from a three-
wavelength anomalous dispersion experiment with ShelxD (Schneider and Sheldrick,
2002; Sheldrick, 2008). Figure 5.12 shows the clear cutoff of occupancy between the
12th and 13th sites and the statistics for CC (correlation coefficient between
observed and calculated E values) and CC (weak) are consistent with the correct
positions of the 12 Se.

150
Resolution
(Å)
8 6 5.3 5.1 4.9 4.7 4.5 4.3 4.1 3.9 3.7
Anomalous
signal/noise
ratios
(Peak)
3.33 2.58 2.04 1.61 1.52 1.46 1.42 1.22 1.21 1.14 1.02
Anomalous
signal/noise
ratios
(Inflection)
4.4 2.33 1.84 1.48 1.51 1.35 1.32 1.3 1.2 1.07 1.01
Anomalous
signal/noise
ratios
(Remote)
3.31 1.81 1.39 1.29 1.38 1.26 1.31 1.17 1.17 1.09 1.01
Table 5.17 Anomalous signal/noise ratios of merged Se data sets. The values are
based on variances of F+ and F
-, calculated by Xprep. The cutoff of significant
anomalous signals of each data set is shown in bold.
Resolution
(Å)
8 6 5.3 5.1 4.9 4.7 4.5 4.3 4.1 3.9 3.7
Peak
against
remote
(%)
68 80.0 68.5 49.9 48.7 40.5 30.9 26.7 25.1 15 9.1
Inflection
against
remote
(%)
72.8 76.9 52.4 48.6 38.3 41.0 24.7 27.2 20.8 13.4 27.5
Inflection
against
peak (%)
57.7 85.8 63.2 56.0 56.4 43.4 37.9 29.0 22.8 16.7 25.4
Table 5.18 Anomalous correlation coefficients (%) betweens peak, remote and
inflection of Se merged data sets, calculated by Xprep. The cutoff of significant
anomalous correlation coefficients between each data set is shown in bold.

151
Figure 5.12 The occupancies for selenium positions with CC 63.84% and
CC(weak) 51.36%. There is the clear cutoff of occupancy between the 12th and
13th sites.
5.13 Phasing and model building
As described in Section 2.14.5, mtz files were produced for Sharp (Bricogne et al.,
2003) with columns containing native and three wavelength data sets. The high
energy remote data set was used as the reference for scaling, and the default setting
of Sharp was used. The 12 Se atom sites from ShelxD and their inversed sites were
used as the input site in Sharp. In addition, the space group I4122 and I4322 were
tested in Sharp. After the solvent flattening (54%) by DM, the map with space group
I4122 was interpretable. Figure 5.14 shows the electron density map after solvent
flattening in Sharp, which clearly reveals helical features.
To build a polyalanine model, the connected helix 5 and helix 6 of the QacR
monomer from the QacR model (PDB code 1JT0) was superimposed on the electron
density map manually in Coot. More helices were superimposed on the electron
density map and the model was extended to the whole dimer manually (Figure 5.13
and 5.14). The electron density for the last 3 bp at the end of duplex is missed in the
map after solvent flattening. For the DNA model, 11 bp duplex of B-DNA from Coot
were manually superimposed on the electron density map. The crystallographic
occupancy
Se sites

152
symmetry operation of space group I 4122 was used to produce the preliminary
model for two VceR dimers bound to a 22 bp duplex, which is shown in Figure 5.13.
Figure 5.13 The ribbon representation of two VceR dimers bound to a 22 bp
duplex.
Figure 5.14 A 3.2 Å Se-MAD electron-density map at 1.0 σ superimposed with
two VceR dimers bound to a 22 bp duplex.
HTH DNA binding domain

153
5.14 Discussion
5.14.1 Oligo design for protein/DNA co-crystallization
The interactions between DNA molecules often generate crystal packing contacts,
which make the choice of DNA fragments critical for the formation of X-ray quality
protein/DNA co-crystals (Tan et al., 2000). However, there is no method to predict
the correct DNA fragment to obtain X-ray quality complex crystals. The empirical
search for fragments of different lengths and ends is the main strategy for selecting
DNA fragments in protein/DNA co-crystallization.
The 30 bp P56 DNA duplex (Figure 5.2), bound with VceR, was chosen as the
starting point to generate the crystals of the VceR/dsDNA complex. However, the
diffraction power of the crystals formed by VceR/P56 could not be improved
(Section 5.4 and 5.5, and Table 5.3). Different pairs of oligodeoxynucleotides (Table
2.5) were designed and used into co-crystallization trials. The complex crystals
formed from 28 bp P56-1 gave the best diffraction. These results suggest that there
was no better method to determine the length and the end of the DNA for
protein/DNA co-crystallization, and that all possibilities for the DNA design to
improve diffraction resolution should be put into trials.
Although there is no method to predict the best DNA fragment for protein/DNA co-
crystallization, DNase I footprinting assays are important for defining the starting
DNA sequence for protein/DNA co-crystallization. Any base bound to protein could
be protected from the digestion by DNase I, which produces the DNA sequence for
co-crystallization. This method has been widely used in protein/DNA co-
crystallization successfully, e.g. DtxR bound with the tox operator (White et al.,
1998). Interestingly, in the DtxR example, three structures of the DtxR/DNA
complex were solved from three pairs of duplex DNA of 43 bp, 33 bp and 21 bp
(Chen et al., 2000; White et al., 1998; Pohl et al., 1999), which indicates that
different designs of the oligonucleotide can produce X-ray quality crystals.

154
5.14.2 Simple mixture or purification of protein/DNA complex for co-
crystallization
The stoichiometry of the components of the protein/DNA complex should be
considered in preparing the complex for co-crystallization. One method is the
examination of the complex over a series of protein:DNA ratios using EMSA to
determine the ratio for maximal complex formation. Alternatively, analytical gel
filtration or dynamic light-scattering could be used to calculate the molecular weight
of the protein/DNA complex, from which the ratio of protein to DNA in the complex
can be known. The ratio of VceR monomer to DNA in the VceR/DNA complex is
4:1, two dimers of VceR bound to DNA, indicated from analytical gel filtration and
dynamic light-scattering.
Usually, in the preparation of the protein DNA complex, an excess of DNA is used,
because the efficiency of DNA annealing is less than 100%. In this study, the ratio of
VceR to DNA was increased to 2:1 for co-crystallization, rather than 4:1 for complex
formation. In addition, the purification of the protein/DNA complex for co-
crystallization was also tried. The advantage of this method is the high purity of the
complex and the elimination of any unbound protein or DNA. However, before
purifying the protein/DNA complex its stability should be considered, as the
presence of an excess amount of unbound DNA could force the equilibrium (the
equilibrium between free protein and DNA and the protein/DNA complex) to the
protein/DNA complex forming and stabilize the protein/DNA complex, when there is
a low protein-DNA binding affinity.
5.14.3 Palindromic or nonpalindromic sequence in protein /DNA co-
crystallization
A palindromic sequence has an identical sequence with its complementary sequence.
The recognition sites of many restriction enzymes are palindromic. In TetR, the
DNA sequence used in TetR/DNA complex crystallization was derived from the
natural promoter with a perfect palindrome (Orth et al., 2000) In QacR/DNA
complex crystals, the DNA used was mutated to form the complete inverted repeat
(Schumacher et al., 2002). In this study, both palindromic and non-palindromic

155
sequences (Table 2.5) formed crystals with VceR. However, DNA with high
palindromic order formed complex crystals more easily than the natural one with an
imperfect palindrome (data not shown). This phenomenon could be explained by the
fact that the optimization of the palindrome in the operator sequence increases the
binding of the second dimer to the operator. This behaviour was found for TtgR, a
TetR family repressor (Krell et al., 2007). Further studies will be needed to
determine the effect of the palindromic sequence in the binding of VceR to the
operator sequence.
5.14.4 Substructure and phasing
The phase problem is an inevitable challenge in protein crystallography (Taylor,
2003). Because of the presence of homology models and the availability of
synchrotron beamlines, several methods, including MR (Molecular Replacement),
SIR (Single isomorphous replacement), SIRAS (single isomorphous replacement
with anomalous scattering), MIR (multiple isomorphous replacement), MIRAS
(multiple isomorphous replacement with anomalous scattering), MAD (Multiple-
wavelength anomalous dispersion) and SAD (single-wavelength anomalous
dispersion) are widely used to solve the phase problem (Taylor, 2003). For solving
the phase problem for protein/DNA complexes, the incorporation of
selenomethionine into the protein, the labelling of DNA and the soaking of heavy
atoms into crystals have been utilized to obtain phasing, if there is no homology
model available (Konig et al., 2009; Schumacher et al., 2002).
In this study, because of the low sequence identity of VceR in comparison to QacR
17.7% (generally, 25% or higher sequence identity is required for successful
molecular replacement, Taylor, 2003), the use of the QacR/DNA model to solve the
VceR/DNA structure was unsuccessful. Instead, bromines incorporated into the DNA
and later selenomethionine in the protein were taken as anomalous scatterers to
perform MAD or SAD experiments. Initially, the phasing experiments started with
the brominated DNA pair P5-1-BrP6-1(Table 5.8). However, the location of the Br in
this DNA duplex could not be determined, possibly due to the pseudo-symmetry of
the Br sites, which breaks the crystal symmetry.

156
Further efforts were carried out using both symmetric brominated DNA (Table 5.8)
and selenomethionine substituted VceR. However, the VceR-CCCH/DPAL2 crystals
had a very weak anomalous signal (Table 5.12and 5.13), because of the incorrect
wavelengths used in peak, inflection and remote data collection.
Interestingly, merging of two three-wavelength Se data sets and one peak Se data set
produced the correct substructure, as indicated by CC/low CC in ShelxD (Table 5.18)
and following refinement of the Se positions in Sharp. This merging of several data
sets could increase the anomalous signals for Se substructure calculation (Table 5.17),
and will be a good method in solving the substructure of low resolution data sets.

157
Chapter 6 Final discussion and future work
6.1 Hpa1
6.1.1 Fibril formation mechanism of Hpa1
We found that full length Hpa1 was able to assemble into fibrils at acidic pH (Figure
3.8) Similar pH-dependent fibril assembly has been widely reported (Cruz et al.,
2005; Lai et al., 1996; Morozova-Roche et al., 2000; Smith et al., 2003; Uversky and
Fink, 2004). One explanation of this phenomenon is that the fibril forming precursors
have low net charge or even zero at acidic pH, which accelerates fibril assembly
(Chiti et al., 2002; Schmittschmitt and Scholtz, 2003). However, pHs around the pI
of Hpa1 only induce precipitation of Hpa1 in this study (data not shown). The fact
that the C-terminal helical domain is the fibril forming domain of Hpa1, but cannot
assemble into fibrils in the presence of the N-terminal helical domain suggests that
the assembly of fibrils by Hpa1 requires separation of the C-terminal helical
domain from the N-terminal helical domain. Similar domains acting to prevent
fibril formation were reported for lysozyme (Mishima et al., 2007). A mechanism
for fibril assembly was proposed that the fibril formed by full length Sup35 involves
the intermolecular interaction of one region of Sup35 (Krishnan and Lindquist, 2005).
Acidification of the pH might change the conformation of Hpa1 and promote the
association of the C-terminal helical domain with itself for fibril assembly.
In addition, the fibril assembly of the C-terminal helical domain of Hpa1 seems to
be an inherent characteristic of the sequence component, which is independent of pH
(Figure 4.5). Several characteristics of the amino acid sequence have been thought to
facilitate fibril assembly. For example, aromatic moieties could be recognition
interfaces, which mediate the early stage of amyloid formation, and the stacking
interactions of these aromatic moieties provides an energetic contribution in the self-
assembly of amyloid structure (Azriel and Gazit, 2001; Gazit, 2002; Gazit, 2005;
Gazit, 2007). However, there is no aromatic moiety in peptide 2
(ASPLTQMLMNIVGEILQAQ) of Hpa1, which could facilitate the assembly into
fibrils.

158
The other characteristic of the amino acid sequence required for fibrillogenesis is
attractive electrostatic interactions. For example, K-E interactions seem to be
essential for the fibril assembly, since the peptides KFFK or EFFE did not form
fibrils when incubated alone, but did so when co-incubated (Tjernberg et al., 2002).
The sequence of peptide 2 (ASPLTQMLMNIVGEILQAQ) has one negatively
charged E, but no positively charged residues (K or R).
On the other hand, the inherent aggregation propensity, which is dependent on the
intrinsic physiochemical properties of the amino acids in the sequence, is thought to
be one reason for fibril assembly (Chiti and Dobson, 2006; Routledge et al., 2009).
Predictions of the aggregation-prone regions of whole length Hpa1 identified
residues (Hpa1 90-101, LTQMLMNIVGEI) as the most aggregation-prone region
(Conchillo-Sole et al., 2007) is in agreement with the experimental data that peptide
2 is the segment of Hpa1 for fibril assembly. This result suggests the inherent
aggregation propensity of peptide2 in this study is important for its fibril assembly.
The determinants for fibril formation are not fully understood and there is no
common motif among fibril forming proteins. The inherent aggregation propensity
might be important for fibril assembly and more cases are needed to demonstrate this
hypothesis in the future.

159
6.1.2 Secretion of Hpa1 through TTSS and its function in Xanthomonas
Hpa1, the harpin of Xanthomonas, is secreted via TTSS (Zou et al., 2006). However,
the in vivo state of Hpa1 and how Hpa1 is secreted through the narrow Hrp pilus of
TTSS remain unknown. One possible explanation is that most effectors would be
translocated or secreted in an unfolded state and TTSS chaperones maintain effectors
in this state (Alfano and Collmer, 2004). However, such chaperones of the TTSS in
Xanthomonas have not been reported. Further work could be performed using Hpa1
as the bait in two hybrid screens with a library of Xanthomonas proteins to find this
kind of chaperone. In addition, heat shock proteins (HSP) stabilize partially unfolded
proteins, help in protein folding and prevent the unwanted protein aggregation
(Ohtsuka and Hata, 2000). HSP was also found to disassemble the fibrils (Shorter
and Lindquist, 2008; Shorter, 2008). The possible interaction between Hpa1 and HSP,
and stabilization of Hpa1 by HSP, could be studied in future work.
The data presented here have expanded the view for the function of harpins. Our
finding of direct membrane damaging by fibrils of Hpa1 and its derivatives indicates
their possible toxicity to the biological membrane, which has never been reported.
However, the in vivo data are required to show this toxicity in its host plant rice and
the biological function of fibril assembly of Hpa1 in the pathogenicity of
Xanthomonas orzyae pv. oryzicola.

160
6.2 Crystallization of VceR in complex with its cognate DNA
6.2.1 DNA binding domain of VceR
Three protein/DNA structures from the TetR family have been determined: one
dimer of TetR bound to a 15 bp operator DNA (Orth et al., 2000), two dimers of
QacR bound to a 28 bp operator DNA (Schumacher et al., 2002) and two dimers of
CgmR bound to a 28 bp operator DNA (unpublished, PDB code 2yvh). As a
conserved signature of the TetR family, TetR repressors use a helix-turn-helix (HTH)
motif to bind the operator DNA (Ramos et al., 2005). VceR share 29.8% sequence
identity with QacR in the DNA binding domain (Figure 5.1) and binds the 28 bp
promoter DNA as a pair of dimers, as determined by SEC and dynamic light
scanning (Borges-Walmsley et al., 2005). The model of VceR/DNA complex in this
study shows VceR uses the same DNA binding style with QacR, two dimers bound
with an operator DNA. Future work has to refine model and improve phasing to
show the interaction between VceR and DNA.
6.2.2 Drug binding domain of VceR
VceR, a TetR repressor, binds to a 28 bp sequence within the vceR-vceCAB
intergenic region and thus repress the expression of the VceCAB drug efflux pump
through steric hindrance of RNA polymerase binding to the operator (Borges-
Walmsley et al., 2005). A pump substrate, CCCP (carbonyl cyanide m-chlorophenyl-
hydrazone) binds to VceR and dissociates it from the binding site (Borges-Walmsley
et al., 2005). As determined by stopped-flow fluorescence spectroscopy, the VceR
monomer possesses two binding-sites that can be occupied by CCCP simultaneously
(Borges-Walmsley et al., 2005). However, the drug binding pocket of VceR could
not be located in this study. The determination of the VceR/DNA complex structure
could provide clues about the drug binding pocket of VceR.
In the QacR drug binding pocket, Glu is widely used in the neutralization of the
positively charged drug. Interestingly, Glu120 in the QacR-Et complex, Glu58 in
QacR-Dq and QacR-Be complex have their counterparts in VceR Glu122 and Glu60

161
(Figure 5.1), which indicates their possible function in drug binding, considering that
CCCP has a positive charge.
In addition, different to QacR, VceR has an 8 amino acid insertion in the drug
binding domain between helix 7 and helix 8 and a CCCH (Cys-Cys-Cys-His) motif
(Figure 5.1). Future work has to determine the function of the CCCH motif, which
may be involved in metal binding, and of this 8-residue insertion.
6.2.3 Induction mechanism of VceR
Upon binding of ligands, TetR and QacR undertake similar induction mechanisms
(Section 1.10.1.3 and 1.10.2.2). Essentially, a conformational change in their C-
terminal drug binding domains is propagated to the DNA-binding domain by helix
connecting the two domains and this increases the distance between the midpoints of
the two DNA recognition helices, which then do not fit in the major groove of the
DNA, causing TetR and QacR to dissociate from their cognate DNA (Orth et al.,
1998b; Orth et al., 2000; Schumacher et al., 2002). In addition, there is another
species of TetR, revTetR, which is a derivative of TetR with a single site mutation
and reverse activity, in that the binding of ligand increases its DNA-binding.
RevTetR employs the disorder-order mechanism, which is that ligand-free revTetR
has an unfolded DNA-binding domain, and the binding of ligand increases the
folding of DNA-binding domain of revTetR that subsequently benefits DNA binding
(Scholz et al., 2004; Resch et al., 2008). The induction mechanism of VceR is still
unclear. Future work has to determine the crystal structures of VceR and the
VceR/ligand complex to compare with that of VceR/DNA, which could show the
induction mechanism of VceR.

162
References:
Aggarwal, A.K. (1990) Crystallization of DNA binding proteins with
oligodeoxynucletides. Methods: A companion to methods in Enzymology 1:
83-90
Akeda, Y., and Galan, J.E. (2005) Chaperone release and unfolding of substrates in
type III secretion. Nature 437: 911-915
Alfano, J.R., and Collmer, A. (1997) The Type III (Hrp) secretion pathway of plant
pathogenic baceteria: Trafficking Harpins, Avr proteins, and Death. Journal
of Bacteriology 179: 5655-5662
Alfano, J.R., and Collmer, A. (2004) Type III secretion system effector proteins:
double agents in bacterial disease and plant defense. Annu Rev Phytopathol
42: 385-414
Alatoom, A.A., Aburto, R., Hamood, A.N. and Colmer-Hamood J.A. (2007) vceR
negatively regulates the vceCAB MDR efflux operon and positively regulates
its own synthesis in Vibrio cholerae 569B. Can J. Microbiol. 53(7): 888-900
Anderson, J., Ptashne, M. and Harrison, S.C. (1984) Cocrystals of the DNA-binding
domain of phage 434 repressor and a synthetic phage 434 operator. Proc.
Natl Acad. Sci. USA 81, 1307-1311
Arlat, M., Van Gijsegem, F., Huet, J.C., Pernollet, J.C. and Boucher, C.A. (1994)
PopA1, a protein which induces a hypersensitive-like response on specific
Petunia genotypes, is secreted via the Hrp pathway of Pseudomonas
solanacearum. EMBO J. 13: 543-53
Azriel, R., and Gazit, E. (2001) Analysis of the minimal amyloid-forming fragment
of the islet amyloid polypeptide. An experimental support for the key role of
the phenylalanine residue in amyloid formation. J Biol Chem 276: 34156-
34161
Bent, A.F., and Mackey, D. (2007) Elicitors, effectors, and R genes: the new
paradigm and a lifetime supply of questions. Annu Rev Phytopathol 45: 399-
436
Benzinger, T.L., Gregory, D.M., Burkoth, T.S., Miller-Auer, H., Lynn, D.G., Botto,
R.E., and Meredith, S.C. (1998) Propagating structure of Alzheimer's beta-
amyloid(10-35) is parallel beta-sheet with residues in exact register. Proc
Natl Acad Sci U S A 95: 13407-13412
Benzinger, T.L., Gregory, D.M., Burkoth, T.S., Miller-Auer, H., Lynn, D.G., Botto,
R.E., and Meredith, S.C. (2000) Two-dimensional structure of beta-
amyloid(10-35) fibrils. Biochemistry 39: 3491-3499

163
Blaylock, B., Riordan, K.E., Missiakas, D.M., and Schneewind, O. (2006)
Characterization of the Yersinia enterocolitica type III secretion ATPase
YscN and its regulator YscL. J Bacteriol 188: 3525-3534
Bogdanove, A.J., Wei, Z.M., Zhao, L., and Beer, S.V. (1996) Erwinia amylovora
secretes harpin via a type III pathway and contains a homolog of yopN of
Yersinia spp. J Bacteriol 178: 1720-1730
Borges-Walmsley, M.I., McKeegan, K.S., and Walmsley, A.R. (2003) Structure and
function of efflux pumps that confer resistance to drugs. Biochem J 376: 313-
338
Borges-Walmsley, M.I., Du, D., McKeegan, K.S., Sharples, G.J., and Walmsley, A.R.
(2005) VceR regulates the vceCAB drug efflux pump operon of Vibrio
cholerae by alternating between mutually exclusive conformations that bind
either drugs or promoter DNA. J Mol Biol 349: 387-400
Brennan, R.G. (2001) Introduction: multidrug resistance. Seminars in Cell &
Developmental Biology 12: 201-204
Bricogne, G., Vonrhein, C., Flensburg, C., Schiltz, M. and Paciorek, W. (2003)
Generation, representation and flow of phase information in structure
determination: recent developments in and around SHARP 2.0. Acta Cryst.
D59: 2023-2030
Buck, M.A. and Cooperman, B.S. (1990) Single protein omission reconstitution
studies of tetracycline binding to the 30S subunit of Escherichia coli
ribosomes. Biochemistry 29: 5374-9
Buttner, D., Nennstiel, D., Klusener, B., and Bonas, U. (2002) Functional analysis of
HrpF, a putative type III translocon protein from Xanthomonas campestris pv.
vesicatoria. J Bacteriol 184: 2389-2398
Cagliero, C., Maurel, M.C., Cloeckaert, A., and Payot, S. (2007) Regulation of the
expression of the CmeABC efflux pump in Campylobacter jejuni:
identification of a point mutation abolishing the binding of the CmeR
repressor in an in vitro-selected multidrug-resistant mutant. FEMS Microbiol
Lett 267: 89-94
Charkowski, A.O., Alfano, J.R., Preston, G., Yuan, J., He, S.Y., and Collmer, A.
(1998) The Pseudomonas syringae pv. tomato HrpW protein has domains
similar to harpins and pectate lyases and can elicit the plant hypersensitive
response and bind to pectate. J Bacteriol 180: 5211-5217
Chaudhary, N., Singh, S. and Nagarai, R. (2008) Organic solvent mediated self-
association of an amyloid forming peptide from beta2-microglobulin: an
atomic force microscopy study. Biopolymers 90: 783-91

164
Chen, C.S., White, A., Love, J., Murphy, J. R. and Ringe, D. (2000) Methyl groups
of thymine bases are important for nucleic acid recognition by DtxR.
Biochemistry 39, 10397-10407
Chisholm, S.T., Coaker, G., Day, B., and Staskawicz, B.J. (2006) Host-microbe
interactions: shaping the evolution of the plant immune response. Cell 124:
803-814
Chiti, F., Calamai, M., Taddei, N., Stefani, M., Ramponi, G and Dobson, C. M.
(2002) Studies of the aggregation of mutant proteins in vitro provide insights
into the genetics of amyloid diseases. Proc. Natl Acad. Sci. USA 99, 16419-
16426
Chiti, F., and Dobson, C.M. (2006) Protein misfolding, functional amyloid, and
human disease. Annu Rev Biochem 75: 333-366
Collaborative computational project, Number4, 1994, The CCP4 suite: programs for
protein crystallography. Acta Cryst. D50: 760-763
Collins, S.R., Douglass, A., Vale, R.D., and Weissman, J.S. (2004) Mechanism of
prion propagation: amyloid growth occurs by monomer addition. PLoS Biol 2:
e321
Conchillo-Sole, O., de Groot, N. S., Aviles, F.X., Vendrell, J., Daura, X. and Ventura,
S. (2007). AGGRESCAN: a server for the prediction and evaluation of ―hot
spots‖ of aggregation in polypeptides. BMC Bioinformatics 8: 65
Cornelis, G.R., and Van Gijsegem, F. (2000) Assembly and function of type III
secretory systems. Annu Rev Microbiol 54: 735-774
Cornelis, G.R. (2006) The type III secretion injectisome. Nat Rev Microbiol 4: 811-
825
Cowtan, K. (1994), Joint CCP4 and ESF-EACBM Newsletter on Protein
Crystallography, 31, p34-38.
Crop prospects and food situation, No. 4, November 2009, Food and Agriculture
organization (FAO)
Cruz, L., Urbanc, B., Borreguero, J.M., Lazo, N.D., Teplow, D.B., and Stanley, H.E.
(2005) Solvent and mutation effects on the nucleation of amyloid beta-protein
folding. Proc Natl Acad Sci U S A 102: 18258-18263
Deane, J.E., Graham, S.C., Mitchell, E.P., Flot, D., Johnson, S., and Lea, S.M. (2008)
Crystal structure of Spa40, the specificity switch for the Shigella flexneri type
III secretion system. Molecular Microbiology 69: 267-76
DeLano, W.L. The PyMOL Molecular Graphics System (2002) DeLano Scientific,
San Carlos, CA, USA. http://www.pymol.org

165
Dong, H., Delaney, T.P., Bauer, D.W., and Beer, S.V. (1999) Harpin induces disease
resistance in Arabidopsis through the systemic acquired resistance pathway
mediated by salicylic acid and the NIM1 gene. Plant J 20: 207-215
Dong, H.P., Peng, J., Bao, Z., Meng, X., Bonasera, J.M., Chen, G., Beer, S.V., and
Dong, H. (2004) Downstream divergence of the ethylene signaling pathway
for harpin-stimulated Arabidopsis growth and insect defense. Plant Physiol
136: 3628-3638
Dong, H.P., Yu, H., Bao, Z., Guo, X., Peng, J., Yao, Z., Chen, G., Qu, S., and Dong,
H. (2005) The ABI2-dependent abscisic acid signalling controls HrpN-
induced drought tolerance in Arabidopsis. Planta 221: 313-327
Dover, L.G., Corsino, P.E., Daniels, I.R., Cocklin, S.L., Tatituri, V., Besra, G.S., and
Futterer, K. (2004) Crystal structure of the TetR/CamR family repressor
Mycobacterium tuberculosis EthR implicated in ethionamide resistance. J
Mol Biol 340: 1095-1105
Edqvist, P.J., Olsson, J., Lavander, M., Sundberg, L., Forsberg, A., Wolf-Watz, H.,
and Lloyd, S.A. (2003) YscP and YscU regulate substrate specificity of the
Yersinia type III secretion system. J Bacteriol 185: 2259-2266
Emsley, P. and Cowtan, K. (2004) Coot: model-building tools for molecular graphics.
Acta Cryst. D60: 2126-2132
Engel, M.F., Khemtemourian, L., Kleijer, C.C., Meeldijk, H.J., Jacobs, J., Verkleij,
A.J., de Kruijff, B., Killian, J.A., and Hoppener, J.W. (2008) Membrane
damage by human islet amyloid polypeptide through fibril growth at the
membrane. Proc Natl Acad Sci U S A 105: 6033-6038
Engohang-Ndong, J., Baillat, D., Aumercier, M., Bellefontaine, F., Besra, G.S.,
Locht, C., and Baulard, A.R. (2004) EthR, a repressor of the TetR/CamR
family implicated in ethionamide resistance in mycobacteria, octamerizes
cooperatively on its operator. Molecular Microbiology 51: 175-188
Fändrich, M., Fletcher, M.A., and Dobson, C.M. (2001) Amyloid fibrils from muscle
myoglobin. Nature 410: 165-166
Fändrich, M., and Dobson, C.M. (2002) The behaviour of polyamino acids reveals an
inverse side chain effect in amyloid structure formation. EMBO J. 21: 5682-
5690
Fändrich, M. (2007) On the structural definition of amyloid fibrils and other
polypeptide aggregates Cell. Mol. Life Sci. 64: 2066-2078
Fändrich, M., Forge, V., Buder, K., Kittler, M., Dobson, C.M. and Diekmann, S.
(2003). Myoglobin forms amyloid fibrils by association of unfolded
polypeptide segments. PNAS 100 (26): 15463-15468
Faruque, S.M., Albert, M.J. and Mekalanos, J.J. (1998) Epidemiology, genetics and

166
ecology of toxigenic Vibrio cholera Microbiology and Molecular Biology
Reveiws, 1301-1314
Faruque, S.M. and Nair, G.B. (2008) Vibrio cholera: genomics and molecular
biology. Caister Academic Press
Federici, L., Du, D., Walas, F., Matsumura, H., Fernandez-Recio, J., McKeegan,
K.S., Borges-Walmsley, M.I., Luisi, B.F., and Walmsley, A.R. (2005) The
crystal structure of the outer membrane protein VceC from the bacterial
pathogen Vibrio cholerae at 1.8 Å resolution. J Biol Chem 280: 15307-15314
Ferrao-Gonzales, A.D., Souto, S.O., Silva, J.L. and Foguel, D. (2000) The
preaggregated state of an amyloidogenic protein: Hydrostatic pressure
converts native transthyretin into the amyloidogenic state. Proc. Natl. Acad.
Sci. USA 97: 6445-50
Ferris, H.U., and Minamino, T. (2006) Flipping the switch: bringing order to
flagellar assembly. Trends Microbiol 14: 519-526
Folster, J.P., and Shafer, W.M. (2005) Regulation of mtrF expression in Neisseria
gonorrhoeae and its role in high-level antimicrobial resistance. J Bacteriol
187: 3713-3720
Folster, J.P., Dhulipala, V., Nicholas, R.A., and Shafer, W.M. (2007) Differential
regulation of ponA and pilMNOPQ expression by the MtrR transcriptional
regulatory protein in Neisseria gonorrhoeae. J Bacteriol 189: 4569-4577
Frenois, F., Engohang-Ndong, J., Locht, C., Baulard, A.R., and Villeret, V. (2004)
Structure of EthR in a ligand bound conformation reveals therapeutic
perspectives against tuberculosis. Mol Cell 16: 301-307
Gabriel, D.W. (1999) Why do pathogens carry avirulence genes? Physiological and
Molecular plant pathology 55: 205-214
Gazit, E. (2002) A possible role for pi-stacking in the self-assembly of amyloid
fibrils. Faseb J 16: 77-83
Gazit, E. (2005) Mechanisms of amyloid fibril self-assembly and inhibition. Model
short peptides as a key research tool. Febs J 272: 5971-5978
Gazit, E. (2007) Self assembly of short aromatic peptides into amyloid fibrils and
related nanostructures. Prion 1: 32-35
Gerber, R., Tahiri-Alaoui, A., Hore, P.J. and James, W. (2008) Conformational pH
dependence of intermediate states during oligomerization of the human prion
protein. Protein Science 17: 537-544
Ghosh, P. (2004) Process of protein transport by the type III secretion system.
Microbiol Mol Biol Rev 68: 771-795

167
Glabe, C.G. (2006) Common mechanisms of amyloid oligomer pathogenesis in
degenerative disease. Neurobiol Aging 27: 570-575
Glass, R.I., I. Huq, A.R.M.A. Alim, and Yunus, M. (1980) Emergence of multiple
antibiotic-resistant Vibrio cholera in Bangladesh. J. Infect. Dis. 142: 939-942
Gnanamanickam, S.S., Priyadarisini, V.B., Narayanan, N.N., Vasudevan, P. and
Kavitha, S. (1999) An overview of bacterial blight disease of rice and
strategies for management. Current Science 77: 1435-1443
Gophna, U., Ron, E.Z., and Graur, D. (2003) Bacterial type III secretion systems are
ancient and evolved by multiple horizontal-transfer events. Gene 312: 151-
163
Green, D.R., and Reed, J.C. (1998) Mitochondria and apoptosis. Science 281: 1309-
1312
Greenberg, J.T. (1996) Programmed cell death: a way of life for plants. Proc Natl
Acad Sci U S A 93: 12094-12097
Grkovic, S., Brown, M.H., Roberts, N.J., Paulsen, I.T., and Skurray, R.A. (1998)
QacR is a repressor protein that regulates expression of the Staphylococcus
aureus multidrug efflux pump QacA. J Biol Chem 273: 18665-18673
Grkovic, S., Brown, M.H., and Skurray, R.A. (2001) Transcriptional regulation of
multidrug efflux pumps in bacteria. Semin Cell Dev Biol 12: 225-237
Gu, R., Su, C.C., Shi, F., Li, M., McDermott, G., Zhang, Q., and Yu, E.W. (2007)
Crystal structure of the transcriptional regulator CmeR from Campylobacter
jejuni. J Mol Biol 372: 583-593
Gurlebeck, D., Thieme, F., and Bonas, U. (2006) Type III effector proteins from the
plant pathogen Xanthomonas and their role in the interaction with the host
plant. J Plant Physiol 163: 233-255
Hagman, K.E., Pan, W., Spratt, B.G., Balthazar, J.T., Judd, R.C., and Shafer, W.M.
(1995) Resistance of Neisseria gonorrhoeae to antimicrobial hydrophobic
agents is modulated by the MtrRCDE efflux system. Microbiology 141 ( Pt 3):
611-622
Harrison, J.W. and Svec, T.A. (1998) The beginning of the end of the antibiotic era?
Part I. The problem: abuse of the ‗miracle drugs‘ Quintessence Int. 29: 151-
62
He, S.Y., Huang, H.C., and Collmer, A. (1993) Pseudomonas syringae pv. syringae
harpinPss: a protein that is secreted via the Hrp pathway and elicits the
hypersensitive response in plants. Cell 73: 1255-1266

168
He, S.Y., and Jin, Q. (2003) The Hrp pilus: learning from flagella. Curr Opin
Microbiol 6: 15-19
Heath, M.C. (2000a) Hypersensitive response-related death. Plant Mol Biol. 44(3):
321-34
Heath, M.C. (2000b) Nonhost resistance and nonspecific plant defenses. Curr Opin
Plant Biol 3: 315-319
Hernandez, A., Mate, M.J., Sanchez-Diaz, P.C., Romero, A., Rojo, F., and Martinez,
J.L. (2009) Structural and functional analysis of SmeT, the repressor of the
Stenotrophomonas maltophilia multidrug efflux pump SmeDEF. J Biol Chem
284: 14428-14438
Hinrichs, W., Kisker, C., Duvel, M., Muller, A., Tovar, K., Hillen, W., and Saenger,
W. (1994) Structure of the Tet repressor-tetracycline complex and regulation
of antibiotic resistance. Science 264: 418-420
Hoffmann, K.M., Williams, D., Shafer, W.M., and Brennan, R.G. (2005)
Characterization of the multiple transferable resistance repressor, MtrR, from
Neisseria gonorrhoeae. J Bacteriol 187: 5008-5012
Hoyos, M.E., Stanley, C.M., He, S.Y., Pike, S., Pu, X-A. and Novacky, A. (1996)
The interaction of HarpinPss, with plant cell walls. MPMI 9: 608-616
Jang, Y.S., Sohn, S.I., and Wang, M.H. (2006) The hrpN gene of Erwinia amylovora
stimulates tobacco growth and enhances resistance to Botrytis cinerea. Planta
223: 449-456
Jimenez, J.L., Guijarro, J.I., Orlova, E., Zurdo, J., Dobson, C.M., Sunde, M., and
Saibil, H.R. (1999) Cryo-electron microscopy structure of an SH3 amyloid
fibril and model of the molecular packing. EMBO J. 18: 815-821
Jimenez, J.L., Nettleton, E.J., Bouchard, M., Robinson, C.V., Dobson, C.M., and
Saibil, H.R. (2002) The protofilament structure of insulin amyloid fibrils.
Proc Natl Acad Sci U S A 99: 9196-9201
Jones, J.D., and Dangl, J.L. (2006) The plant immune system. Nature 444: 323-329
Kabsch, W. (1988) Evaluation of single-crystal X-ray diffraction data from a
postion-sensitive detector. J. Appl. Cryst. 21, 916-924
Kajava, A.V., Aebi, U., and Steven, A.C. (2005) The parallel superpleated beta-
structure as a model for amyloid fibrils of human amylin. J Mol Biol 348:
247-252
Kayed, R., Head, E., Thompson, J.L., Mclntire, T.M., Milton, S.C., Cotman, C.W.
and Glabe, C.G. (2003) Common structure of soluble amyloid oligomers
implies common mechanism of pathogenesis Science 300: 486-489

169
Kayed, R., Sokolov, Y., Edmonds, B., McIntire, T.M., Milton, S.C., Hall, J.E., and
Glabe, C.G. (2004) Permeabilization of lipid bilayers is a common
conformation-dependent activity of soluble amyloid oligomers in protein
misfolding diseases. J Biol Chem 279: 46363-46366.
Kay, S. and Bonas, U. (2009) How Xanthomonas type III effectors manipulate the
host plant. Current opinion in Microbiology 12: 37-43
Kelly, J.W., and Balch, W.E. (2003) Amyloid as a natural product. J Cell Biol 161:
461-462
Kim, J.F., and Beer, S.V. (1998) HrpW of Erwinia amylovora, a new harpin that
contains a domain homologous to pectate lyases of a distinct class. J
Bacteriol 180: 5203-5210
Kim, J.G., Jeon, E., Oh, J., Moon, J.S., and Hwang, I. (2004) Mutational analysis of
Xanthomonas harpin HpaG identifies a key functional region that elicits the
hypersensitive response in nonhost plants. J Bacteriol 186: 6239-6247
Kisker, C., Hinrichs, W., Tovar, K., Hillen, W., and Saenger, W. (1995) The
complex formed between Tet repressor and tetracycline-Mg2+
reveals
mechanism of antibiotic resistance. J Mol Biol 247: 260-280
Klotzsche, M., Berens, C., and Hillen, W. (2005) A peptide triggers allostery in tet
repressor by binding to a unique site. J Biol Chem 280: 24591-24599
Konig, B., Muller, J.J., Lanka, E. and Heinemann, U. (2009) Crystal structure of
KorA bound to operator DNA: insight into repressor cooperation in RP4 gene
regulation. Nucleic Acids Research. 37, 1915-1924
Krell, T., Teran, W., Mayorga, O. L., Rivas, G., Jimenez, M., Daniels, C., Molina-
Henares, A. Martinez-Bueno, M., Gallegos, M. and Ramos, J. (2007)
Optimization of the palindromic order of the TtgR operator enhances binding
cooperativity. J. Mol. Biol. 369, 1188-1199
Krishnan, R., and Lindquist, S.L. (2005) Structural insights into a yeast prion
illuminate nucleation and strain diversity. Nature 435: 765-772
Kumar, A., and Schweizer, H.P. (2005) Bacterial resistance to antibiotics: active
efflux and reduced uptake. Adv Drug Deliv Rev 57: 1486-1513
Kumar, S., Mohanty, S.K., and Udgaonkar, J.B. (2007) Mechanism of formation of
amyloid protofibrils of barstar from soluble oligomers: evidence for multiple
steps and lateral association coupled to conformational conversion. J Mol
Biol 367: 1186-1204
Kvitko, B.H., Ramos, A.R., Morello, J.E., Oh, H.S., and Collmer, A. (2007)
Identification of harpins in Pseudomonas syringae pv. tomato DC3000,
which are functionally similar to HrpK1 in promoting translocation of type III
secretion system effectors. J Bacteriol 189: 8059-8072

170
Lai, Z., Colon, W., and Kelly, J.W. (1996) The acid-mediated denaturation pathway
of transthyretin yields a conformational intermediate that can self-assemble
into amyloid. Biochemistry 35: 6470-6482
Lee, E.H., Rouquette-Loughlin, C., Folster, J.P., and Shafer, W.M. (2003) FarR
regulates the farAB-encoded efflux pump of Neisseria gonorrhoeae via an
MtrR regulatory mechanism. J Bacteriol 185: 7145-7152
Lee, J.H., Bhak, G., Lee, S.G. and Paik, S.R. (2008) Instantaneous amyloid fibril
formation of α-synuclein from the oligomeric granular structures in the
presence of hexane. Biophysical Journal: Biophysical letters 95(2): L16-L18
Lee, J., Klusener, B., Tsiamis, G., Stevens, C., Neyt, C., Tampakaki, A.P.,
Panopoulos, N.J., Noller, J., Weiler, E.W., Cornelis, G.R., Mansfield, J.W.,
and Nurnberger, T. (2001) HrpZPsph from the plant pathogen Pseudomonas
syringae pv. phaseolicola binds to lipid bilayers and forms an ion-conducting
pore in vitro. Proc. Natl. Acad. Sci. USA 98: 289-294
Li, C.M., Haapalainen, M., Lee, J., Nurnberger, T., Romantschuk, M., and Taira, S.
(2005) Harpin of Pseudomonas syringae pv. phaseolicola harbors a protein
binding site. Mol Plant Microbe Interact 18: 60-66
Li, M., Gu, R., Su, C.C., Routh, M.D., Harris, K.C., Jewell, E.S., McDermott, G.,
and Yu, E.W. (2007) Crystal structure of the transcriptional regulator AcrR
from Escherichia coli. J Mol Biol 374: 591-603
Lin, J., Akiba, M., Sahin, O., and Zhang, Q. (2005a) CmeR functions as a
transcriptional repressor for the multidrug efflux pump CmeABC in
Campylobacter jejuni. Antimicrob Agents Chemother 49: 1067-1075
Lin, J., Cagliero, C., Guo, B., Barton, Y.W., Maurel, M.C., Payot, S., and Zhang, Q.
(2005b) Bile salts modulate expression of the CmeABC multidrug efflux
pump in Campylobacter jejuni. J Bacteriol 187: 7417-7424
Lopez De La Paz, M., Goldie, K., Zurdo, J., Lacroix, E., Dobson, C.M., Hoenger, A.,
and Serrano, L. (2002) De novo designed peptide-based amyloid fibrils. Proc
Natl Acad Sci USA 99: 16052-16057
Lorenz, C., Kirchner, O., Egler, M., Stuttmann, J., Bonas, U. and Buttner, D. (2008a)
HpaA from Xanthomonas is a regulator of type III secretion. Molecular
Microbiology 69: 344-360
Lorenz, C., Schulz, S., Wolsch, T., Rossier, O., Bonas, U., and Buttner, D. (2008b)
HpaC controls substrate specificity of the Xanthomonas type III secretion
system. PLoS Pathog 4: e1000094
Lorenz, C., and Buttner, D. (2009) Functional characterization of the type III
secretion ATPase HrcN from the plant pathogen Xanthomonas campestris pv.
vesicatoria. J Bacteriol 191: 1414-1428

171
Lucas, C.E., Balthazar, J.T., Hagman, K.E., and Shafer, W.M. (1997) The MtrR
repressor binds the DNA sequence between the mtrR and mtrC genes of
Neisseria gonorrhoeae. J Bacteriol 179: 4123-4128
Luckner, S.R., Klotzsche, M., Berens, C., Hillen, W., and Muller, Y.A. (2007) How
an agonist peptide mimics the antibiotic tetracycline to induce Tet-repressor.
J Mol Biol 368: 780-790
Macnab, R.M. (2003) How bacteria assemble flagella. Annu Rev Microbiol 57: 77-
100
Malisauskas, M., Zamotin, V., Jass, J., Noppe, W., Dobson, C.M. and Morozova-
Roche L.A. (2003) Amyloid protofilaments from the calcium-binding protein
equine lysozyme: formation of ring and linear structures depends on pH and
metal ion concentration J. Mol. Biol. 330: 879-90
McKeegan, K.S., Borges-Walmsley, M.I., and Walmsley, A.R. (2004) Structural
understanding of efflux-mediated drug resistance: potential routes to efflux
inhibition. Curr Opin Pharmacol 4: 479-486
Mishima, T., Ohkuri, T., Monji, A. Imoto, T. and Ueda, T. (2007) A particular
hydrophobic cluster in the residual structure of reduced lysozyme drastically
affects the amyloid fibrils formation. Biochem. Biophys. Res. Commun. 356:
769-772
Morozova-Roche, L.A., Zurdo, J., Spencer, A., Noppe, W., Receveur, V., Archer,
D.B., Joniau, M., and Dobson, C.M. (2000) Amyloid fibril formation and
seeding by wild-type human lysozyme and its disease-related mutational
variants. J Struct Biol 130: 339-351
Murray, D.S., Schumacher, M.A., and Brennan, R.G. (2004) Crystal structures of
QacR-diamidine complexes reveal additional multidrug-binding modes and a
novel mechanism of drug charge neutralization. J Biol Chem 279: 14365-
14371
Nelson, R., Sawaya, M.R., Balbirnie, M., Madsen, A.O., Riekel, C., Grothe, R., and
Eisenberg, D. (2005) Structure of the cross-beta spine of amyloid-like fibrils.
Nature 435: 773-778
Noel, L., Thieme, F., Nennstiel, D., and Bonas, U. (2002) Two novel type III-
secreted proteins of Xanthomonas campestris pv. vesicatoria are encoded
within the hrp pathogenicity island. J Bacteriol 184: 1340-1348
Oh, C.S., and Beer, S.V. (2007) AtHIPM, an ortholog of the apple HrpN-interacting
protein, is a negative regulator of plant growth and mediates the growth-
enhancing effect of HrpN in Arabidopsis. Plant Physiol 145: 426-436

172
Oh, J., Kim, J.G., Jeon, E., Yoo, C.H., Moon, J.S., Rhee, S., and Hwang, I. (2007)
Amyloidogenesis of type III-dependent harpins from plant pathogenic
bacteria. J Biol Chem 282: 13601-13609
Ohtsuka, K. and Hata, M (2000) Molecular chaperone function of mammalian Hsp70
and Hsp40—a review. Int. J. Hyperthermia. 16(3): 231-45
Orth, P., Alings, C., Schnappinger, D., Saenger, W., and Hinrichs, W. (1998a)
Crystallization and preliminary X-ray analysis of the Tet-repressor/operator
complex. Acta Cryst. D54: 99-100
Orth, P., Cordes, F., Schnappinger, D., Hillen, W., Saenger, W., and Hinrichs, W.
(1998b) Conformational changes of the Tet repressor induced by tetracycline
trapping. J Mol Biol 279: 439-447
Orth, P., Saenger, W., and Hinrichs, W. (1999) Tetracycline-chelated Mg2+
ion
initiates helix unwinding in Tet repressor induction. Biochemistry 38: 191-
198
Orth, P., Schnappinger, D., Hillen, W., Saenger, W., and Hinrichs, W. (2000)
Structural basis of gene regulation by the tetracycline inducible Tet repressor-
operator system. Nat Struct Biol 7: 215-219
Otwinowski, Z. and Minor, W. (1997) Processing of X-ray diffraction data collected
in oscillation mode. Methods in Enzymology Volumne 276: Macromolecular
Crystallography, partA, p.307-326, C.W. Carter, Jr. and R.M. Sweet, Eds
Page, R., Grzechnik, S. K., Canaves, J. M., Spraggon, G., Kreusch, A., Kuhn, P.,
Stevens, R. C. & Lesley, S. A. (2003). Acta Cryst. D59, 1028-1037
Paul, K., Erhardt, M., Hirano, T., Blair, D.F., and Hughes, K.T. (2008) Energy
source of flagellar type III secretion. Nature 451: 489-492
Peng, J., Bao, Z., Ren, H., Wang, J. and Dong, H. (2004) Expression of HarpinXoo in
transgenic tobacco induces pathogen defense in the absence of hypersensitive
cell death. Phytopathology 94: 1048-1055
Petkova, A.T., Ishii, Y., Balbach, J.J., Antzutkin, O.N., Leapman, R.D., Delaglio, F.,
and Tycko, R. (2002) A structural model for Alzheimer's beta -amyloid fibrils
based on experimental constraints from solid state NMR. Proc Natl Acad Sci
USA 99: 16742-16747
Pohl, E., Holmes, R.K. and Hol, W.G.J. (1999) Crystal structure of a cobalt-activated
diphtheria toxin repressor-DNA complex reveals a metal-binding SH3-like
domain. J. Mol. Biol. 292, 653-667
Pohl, E., Pradervand, C., Schneider, R., Tomizaki, T., Pauluhn, A., Chen, Q., Ingold,
G., Zimoch, E. and Schulze-Briese, C. (2006) Facility update: the new protein
crystallography beamline X10SA at the Swiss Light Source. Synchrotron
Radiation News 19(1): 24-26

173
Pozidis, C., Chalkiadaki, A., Gomez-Serrano, A., Stahlberg, H., Brown, I.,
Tampakaki, A.P., Lustig, A., Sianidis, G., Politou, A.S., Engel, A.,
Panopoulos, N.J., Mansfield, J., Pugsley, A.P., Karamanou, S., and
Economou, A. (2003) Type III protein translocase: HrcN is a peripheral
ATPase that is activated by oligomerization. J Biol Chem 278: 25816-25824
Quist, A., Doudevski, I., Lin, H., Azimova, R., Ng, D., Frangione, B., Kagan, B.,
Ghiso, J., and Lal, R. (2005) Amyloid ion channels: a common structural link
for protein-misfolding disease. Proc Natl Acad Sci USA 102: 10427-10432
Racape, J., Belbahri, L., Engelhardt, S., Lacombe, B., Lee, J., Lochman, J., Marais,
A., Nicole, M., Nurnberger, T., Parlange, F., Puverel, S., and Keller, H. (2005)
Ca2+
-dependent lipid binding and membrane integration of PopA, a harpin-
like elicitor of the hypersensitive response in tobacco. Molecular
Microbiology 58: 1406-1420
Ramos, J.L., Martinez-Bueno, M., Molina-Henares, A.J., Teran, W., Watanabe, K.,
Zhang, X., Gallegos, M.T., Brennan, R., and Tobes, R. (2005) The TetR
family of transcriptional repressors. Microbiol Mol Biol Rev 69: 326-356
Resch, M., Striegl, H., Henssler, E.M., Sevvana, M., Egerer-Sieber, C., Schiltz, E.,
Hillen, W. and Muller, Y.A. (2008) A protein functional leap: how a single
mutation reverses the function of the transcription regulator TetR. Nucleic
Acids Research 36, 4390-4401
Routledge, K.E., Tartaglia, G.G., Platt, G.W., Vendruscolo, M. and Radford, S.E.
(2009) Competition between intramolecular and intermolecular interactions
in an amyloid-forming protein. J. Mol. Biol. 389: 776-786
Sachse, C., Fandrich, M., and Grigorieff, N. (2008) Paired beta-sheet structure of an
Abeta(1-40) amyloid fibril revealed by electron microscopy. Proc Natl Acad
Sci USA 105: 7462-7466
Sanchez, P., Alonso, A., and Martinez, J.L. (2002) Cloning and characterization of
SmeT, a repressor of the Stenotrophomonas maltophilia multidrug efflux
pump SmeDEF. Antimicrob Agents Chemother 46: 3386-3393
Sawaya, M.R., Sambashivan, S., Nelson, R., Ivanova, M.I., Sievers, S.A., Apostol,
M.I., Thompson, M.J., Balbirnie, M., Wiltzius, J.J., McFarlane, H.T., Madsen,
A.O., Riekel, C., and Eisenberg, D. (2007) Atomic structures of amyloid
cross-beta spines reveal varied steric zippers. Nature 447: 453-457
Schmitt, J.P. and Scholtz, J.M. (2003) The role of protein stability, solubility and net
charge in amyloid fibril formation. Protein Sci. 12, 2374-2378
Schneider, T.R. and Sheldrick, G.M. (2002) Substructure solution with ShelxD Acta
Cryst. D58: 1772-1779

174
Scholz, O., Henβler, E., Bail, J., Schubert, P., Bogdanska-Urbaniak, J., Sopp, S.,
Reich, M., Wisshak, S., Kostner, M., Bertram, R. and Hillen, W. (2004)
Activity reversal of Tet repressor caused by single amino acid exchanges.
Molecular Microbiology 53(3), 777-789
Schumacher, M.A., Miller, M.C., Grkovic, S., Brown, M.H., Skurray, R.A., and
Brennan, R.G. (2001) Structural mechanisms of QacR induction and
multidrug recognition. Science 294: 2158-2163
Schumacher, M.A., and Brennan, R.G. (2002) Structural mechanisms of multidrug
recognition and regulation by bacterial multidrug transcription factors.
Molecular Microbiology 45: 885-893
Schumacher, M.A., Miller, M.C., Grkovic, S., Brown, M.H., Skurray, R.A., and
Brennan, R.G. (2002) Structural basis for cooperative DNA binding by two
dimers of the multidrug-binding protein QacR. EMBO J. 21: 1210-1218
Schumacher, M.A., Miller, M.C., and Brennan, R.G. (2004) Structural mechanism of
the simultaneous binding of two drugs to a multidrug-binding protein. EMBO
J. 23: 2923-2930
Seo, Y.S., Sriariyanun, M., Wang, L., Pfeiff, J., Phetsom, J., Lin, Y., Jung, K.H.,
Chou, H.H., Bogdanove, A., and Ronald, P. (2008) A two-genome
microarray for the rice pathogens Xanthomonas oryzae pv. oryzae and X.
oryzae pv. oryzicola and its use in the discovery of a difference in their
regulation of hrp genes. BMC Microbiol 8: 99
Serio, T.R., Cashikar, A.G., Kowal, A.S., Sawicki, G.J., Moslehi, J.J., Serpell, L.,
Arnsdorf, M.F., and Lindquist, S.L. (2000) Nucleated conformational
conversion and the replication of conformational information by a prion
determinant. Science 289: 1317-1321
Shao, M., Wang, J., Dean, R.A., Lin, Y., Gao, X., and Hu, S. (2008) Expression of a
harpin-encoding gene in rice confers durable nonspecific resistance to
Magnaporthe grisea. Plant Biotechnol J 6: 73-81
Sheldrick, G.M. (2008) A short history of SHELX Acta Cryst. A64: 112-122
Shorter, J. (2008) Hsp104: a weapon to combat diverse neurodegenerative disorders.
Neurosignals. 16: 63-74
Shorter, J. and Lindquist, S. (2008) Hsp104, Hsp70 and Hsp40 interplay regulates
formation, growth and elimination of Sup35 prions. EMBO J. 27: 2712-2724
Smith, D.P., Jones, S., Serpell, L.C., Sunde, M., and Radford, S.E. (2003) A
systematic investigation into the effect of protein destabilisation on beta 2-
microglobulin amyloid formation. J Mol Biol 330: 943-954

175
Sorg, I., Wagner, S., Amstutz, M., Muller, S.A., Broz, P., Lussi, Y., Engel, A., and
Cornelis, G.R. (2007) YscU recognizes translocators as export substrates of
the Yersinia injectisome. EMBO J. 26: 3015-3024
Stefani, M., and Dobson, C.M. (2003) Protein aggregation and aggregate toxicity:
new insights into protein folding, misfolding diseases and biological
evolution. J Mol Med 81: 678-699
Stohr, J., Weinmann, N., Wille, H., Kaimann, T., Nagel-Steger, L., Birkmann, E.,
Panza, G., Prusiner, S.B., Eigen, M., and Riesner, D. (2008) Mechanisms of
prion protein assembly into amyloid. Proc Natl Acad Sci USA 105: 2409-
2414
Tampakaki, A.P., Fadouloglou, V.E., Gazi, A.D., Panopoulos, N.J., and Kokkinidis,
M. (2004) Conserved features of type III secretion. Cell Microbiol 6: 805-816
Tan, S., Hunziker, Y., Pellegrini, L. and Richmond, T.J. (2000) Crystallization of
the Yeast MATα2/MCM1/DNA ternary complex: general methods and
principles for protein/DNA cocrystallization. J. Mol. Biol. 297: 947-959
Tardy, F., Homble, F., Neyt, C., Wattiez, R., Cornelis, G.R., Ruysschaert, J.M., and
Cabiaux, V. (1999) Yersinia enterocolitica type III secretion-translocation
system: channel formation by secreted Yops. EMBO J. 18: 6793-6799
Taylor, G. (2003) The phase problem. Acta Cryst. D59: 1881-1890
Tjernberg, L., Hosia, W., Bark, N., Thyberg, J., and Johansson, J. (2002) Charge
attraction and beta propensity are necessary for amyloid fibril formation from
tetrapeptides. J Biol Chem 277: 43243-43246
Tjernberg, L.O., Callaway, D.J., Tjernberg, A., Hahne, S., Lilliehook, C., Terenius,
L., Thyberg, J., and Nordstedt, C. (1999) A molecular model of Alzheimer
amyloid beta-peptide fibril formation. J Biol Chem 274: 12619-12625
Torrent, J., Alvarez-Martinez, M.T., Harricane, M.C., Heitz, F., Liautard, J.P., Balny,
C., and Lange, R. (2004) High pressure induces scrapie-like prion protein
misfolding and amyloid fibril formation. Biochemistry 43: 7162-7170
Torrent, J., Alvarez-Martinez, M.T., Liautard, J.P., and Lange, R. (2006) Modulation
of prion protein structure by pressure and temperature. Biochim Biophys Acta
1764: 546-551
Touze, T., Eswaran, J., Bokma, E., Koronakis, E., Hughes, C., and Koronakis, V.
(2004) Interactions underlying assembly of the Escherichia coli AcrAB-TolC
multidrug efflux system. Molecular Microbiology 53: 697-706
Uversky, V.N., and Fink, A.L. (2004) Conformational constraints for amyloid
fibrillation: the importance of being unfolded. Biochim Biophys Acta 1698:
131-153

176
Vestergaard, B., Groenning, M., Roessle, M., Kastrup, J.S., van de Weert, M., Flink,
J.M., Frokjaer, S., Gajhede, M., and Svergun, D.I. (2007) A helical structural
nucleus is the primary elongating unit of insulin amyloid fibrils. PLoS Biol 5:
e134
Walsh, C. (2000) Molecular mechanisms that confer antibacterial drug resistance.
Nature 406: 775-781
Weber, E., Ojanen-Reuhs, T., Huguet, E., Hause, G., Romantschuk, M., Korhonen,
T.K., Bonas, U., and Koebnik, R. (2005) The type III-dependent Hrp pilus is
required for productive interaction of Xanthomonas campestris pv.
vesicatoria with pepper host plants. J Bacteriol 187: 2458-2468
Wei, Z.M., Laby, R.J., Zumoff, C.H., Bauer, D.W., He, S.Y., Collmer, A., and Beer,
S.V. (1992) Harpin, elicitor of the hypersensitive response produced by the
plant pathogen Erwinia amylovora. Science 257: 85-88
White, A., Ding, X., vanderSpek, J.C., Murphy, J.R. and Ringe, D. (1998) Structure
of the metal-ion-activated diphtheria toxin repressor/tox operator complex.
Nature 394: 502-506
Whitmore, L., and Wallace, B.A. (2004) DICHROWEB, an online server for protein
secondary structure analyses from circular dichroism spectroscopic data.
Nucleic Acids Res 32: W668-673
Whitmore, L., and Wallace, B.A. (2008) Protein secondary structure analyses from
circular dichroism spectroscopy: methods and reference databases.
Biopolymers 89: 392-400
Woolley, R.C., Vediyappan, G., Anderson, M., Lackey, M., Ramasubramanian, B.,
Jiangping, B., Borisova, T., Colmer, J.A., Hamood, A.N., McVay, C.S., and
Fralick, J.A. (2005) Characterization of the Vibrio cholerae vceCAB multiple-
drug resistance efflux operon in Escherichia coli. J Bacteriol 187: 5500-5503
Wu, X., Wu, T., Long, J., Yin, Q., Zhang, Y., Chen, L., Liu, R., Gao, T., and Dong,
H. (2007) Productivity and biochemical properties of green tea in response to
full-length and functional fragments of HpaG Xooc, a harpin protein from the
bacterial rice leaf streak pathogen Xanthomonas oryzae pv. oryzicola. J
Biosci 32: 1119-1131
Yang, B., Zhu, W., Johnson, L.B., and White, F.F. (2000) The virulence factor
AvrXa7 of Xanthomonas oryzae pv. oryzae is a type III secretion pathway-
dependent nuclear-localized double-stranded DNA-binding protein. Proc Natl
Acad Sci USA 97: 9807-9812
Yang, B., and White, F.F. (2004) Diverse members of the AvrBs3/PthA family of
type III effectors are major virulence determinants in bacterial blight disease
of rice. Mol Plant Microbe Interact 17: 1192-1200

177
Zarivach, R., Deng, W., Vuckovic, M., Felise, H.B., Nguyen, H.V., Miller, S.I.,
Finlay, B.B., and Strynadka, N.C. (2008) Structural analysis of the essential
self-cleaving type III secretion proteins EscU and SpaS. Nature 453: 124-127
Zgurskaya, H.I., and Nikaido, H. (2000) Multidrug resistance mechanisms: drug
efflux across two membranes. Molecular Microbiology 37: 219-225
Zhao, B., Ardales, E.Y., Raymundo, A., Bai, J., Trick, H.N., Leach, J.E., and Hulbert,
S.H. (2004) The avrRxo1 gene from the rice pathogen Xanthomonas oryzae
pv. oryzicola confers a nonhost defense reaction on maize with resistance
gene Rxo1. Mol Plant Microbe Interact 17: 771-779
Zhao, B., Lin, X., Poland, J., Trick, H., Leach, J., and Hulbert, S. (2005) A maize
resistance gene functions against bacterial streak disease in rice. Proc Natl
Acad Sci USA 102: 15383-15388
Zhu, W., Yang, B., Chittoor, J.M., Johnson, L.B., and White, F.F. (1998) AvrXa10
contains an acidic transcriptional activation domain in the functionally
conserved C terminus. Mol Plant Microbe Interact 11: 824-832
Zhu, W., MaGbanua, M.M., and White, F.F. (2000) Identification of two novel hrp-
associated genes in the hrp gene cluster of Xanthomonas oryzae pv. oryzae. J
Bacteriol 182: 1844-1853
Zou, L.F., Wang, X.P., Xiang, Y., Zhang, B., Li, Y.R., Xiao, Y.L., Wang, J.S.,
Walmsley, A.R., and Chen, G.Y. (2006) Elucidation of the hrp clusters of
Xanthomonas oryzae pv. oryzicola that control the hypersensitive response in
nonhost tobacco and pathogenicity in susceptible host rice. Appl Environ
Microbiol 72: 6212-6224