Embed Size (px)
Citation preview
8/7/2019 Dunning Study
http://slidepdf.com/reader/full/dunning-study 1/40

8/7/2019 Dunning Study
http://slidepdf.com/reader/full/dunning-study 2/40

8/7/2019 Dunning Study
http://slidepdf.com/reader/full/dunning-study 3/40
March 2011
Completed or:
RESCONBy:Will Dunning Inc.Telephone: 416-236-5115Email: [email protected]
Consequences of Government-Imposed
Costs Within theNew Housing Market
RESCON25 North Rivermede Road, Unit 13Vaughan, Ontario L4K 5V4Telephone: 905-760-7777 1-866-531-1608Fax: 905-760-7718Email: Richard Lyall at [email protected]
8/7/2019 Dunning Study
http://slidepdf.com/reader/full/dunning-study 4/40
Table of Contents
Introduction and Key Findings 6Introduction 6
Key Findings 7
Implications 9
About RESCON 10
About Will Dunning and Will Dunning Inc. 10
1.0 Growing Direct Government-Imposed Costs 11Costs as of 2006 11
Changes 2002 to 2006 14
Subsequent to 2006 17
2.0 Indirect Costs 21
3.0 Pass-Through of Government-Imposed Costs 23
4.0 Housing Affordability 28
5.0 Impacts on Housing Activity 30
Overview of the Methodology 30
The Simulations 30
6.0 Economic Consequences 32
Methodology 32Housing Starts 33
Impacts on Jobs and Incomes 34
Fiscal Impacts 36
Endnotes 38
4 www.rescon.ws
8/7/2019 Dunning Study
http://slidepdf.com/reader/full/dunning-study 5/40
Table 1: Summary of Simulations: Impacts of Changes in House Prices,2011 to 2013 (Annual Averages) 8
Figure 1-1: GICs and Their Components 11
Figure 1-2: Total GICs on Single-Detached Dwellings 12
Figure 1-3: Total GICs as Percent of Price on Single-Detached Dwellings 12
Table 2: Single Family Detached House Prices and GICs, 2002 versus 2006 14
Table 3: Components of Change for Government-Imposed Costs, 2002 to 2006 16
Table 4: Estimation of Sales Taxes Payable for New Single-Detached Homes
in the Greater Toronto Area, 2006 and 2010 18Table 5: Changes in Development Charges Versus Changes in Average Prices
for New Single-Detached Homes, 2001/02 to 2010 20
Figure 3-1: Relationship of Resale and New Home Prices 24
Figure 3-2: New Homes Low-Rise Market Share in the GTA 24
Table 6: MCAP Financial Estimates of Lot Prices, Fall 2000 and Fall 2010 25
Table 7: Average Annual Increases for Lot Prices (1), Development Charges,Sales Taxes, and House Prices 27
Figure 4-1: Average Price for New SFD Homes in Toronto CMA 28
Figure 4-2: Average Mortgage Interest Rate (5-Year Terms) 28
Figure 4-3: Monthly Interest Cost for New Homes in Toronto CMA 29
Table 8: Summary of Scenarios for Housing ActivityWithin the Greater Toronto Area 31
Table 9: Estimated Employment Multipliers Full-Time EquivalentJobs Created Per Housing Start, Ontario, 2007 32
Table 10: Simulations of Housing Starts by Dwelling Type 33
Table 11: Economic Impacts of Housing Starts in the Greater Toronto Area,Annual Averages, 2011 to 2013 34
Table 12: Economic Impacts of Housing Starts in the Greater Toronto Area,Annual Averages, 2011 to 2013 Differences Versus Baseline 35
Table 13: Fiscal Impacts, Due to Housing Starts in the GTA Activity(Millions of $s) Annual Averages, in 2010 Dollars, 2011 to 2013 36
Table 14: Fiscal Impacts, Due to Housing Starts in the GTA Activity(Millions of $s) Annual Averages, in 2010 Dollars,2011 to 2013 Differences Versus Baseline 37
Tables and Figures
Consequences of Government-Imposed Costs March 2011 5
8/7/2019 Dunning Study
http://slidepdf.com/reader/full/dunning-study 6/40
Introduction and Key Findings
IntroductionNew housing is a key component o the economy. During the past decade, construction o residential structures accounted or 6.3% o Ontario’s economic output. Moreover, becausethe demand or housing expanded during the decade, this activity contributed 8.5% o theprovince’s economic growth during the decade1. This report explores the consequences o rising government-imposed costs on new housing, which increasingly threaten this importanteconomic sector.
Development o new housing obviously entails signi cant investments by the builder andthen by the owner o the property. It also entails substantial investment by governments in:
• Infrastructure that will directly service the housing (such as water and sewer systems aswell as roads) plus
• Community facilities that have less direct bene ts, as they will serve the new residents aswell as prior members of the community (such as schools, libraries, transit systems, andparks).
In order to und those investments, governments increasingly rely on direct charges onnew residential development. As will soon be shown, in the rst major section o this report,those direct charges have become increasingly large and now represent a substantial shareo the price o new homes.
In addition to the direct government-imposed costs, there are also indirect costs thatbuilders incur:
• To comply with various government-mandated requirements (such as building codes,warranty programs, and environmental protection), as well as
• Costs of participating in processes that are required by government.
Those indirect costs have not been quanti ed, and to do so would require a Herculeane ort. It is known that these indirect costs have also been expanding rapidly. Rather thanattempt to estimate these costs, the second major section o the report briefy describes therange o the indirect costs.
To this author it is obvious that those costs will be refected in housing prices – not justnew housing but also existing housing – otherwise new housing would not be constructed.Since the logic will not be immediately apparent to all readers, the third section o the reportbriefy discusses the rationale or pass-through o the direct and indirect costs, and providesdata that illustrates the dynamic process o cost pass-through. As an introduction to thatdiscussion, it can be pointed out here that the new housing market is ercely competitive:a visit to new development areas or perusal o advertising media will quickly demonstratethat a large number of suppliers (home builders) are competing for buyers. It is easy forconsumers to be well-in ormed about prices. Competitive pressures assure that builderspro t margins are low, and more importantly or this discussion, that any increases in costs –including government-imposed costs – become refected in prices.
6 www.rescon.ws
8/7/2019 Dunning Study
http://slidepdf.com/reader/full/dunning-study 7/40
While housing prices have increased sharply, lower interest rates have largely o set theimpact on housing a ordability. Lower interest rates have created “a ordability space” thathas enabled governments to raise government-imposed costs. This is explored in the thsection o the report.
However, as a result o the housing price rises related to government-imposed costs,housing demand is lower than it would otherwise be. In the th section o the report a
orecasting model is used to simulate the impacts o various price increments on housingconstruction.
Then, in the sixth section o the report, an economic impacts model is used to estimate theconsequences or employment, incomes, and related government revenues.
Key FindingsThis report develops estimates o the impacts o current government-imposed costs on:
• New housing activity.
• Related impacts on employment and wages earned.
• Subsequent impacts on federal and provincial government revenues from personal incometaxes plus premiums or the Canada Pension Plan and Employment Insurance.
As of 2006 (the effective date for the most comprehensive estimates), direct government-imposed costs on housing account or a very signi cant share o the price o new homes.(These costs include development charges that are intended to fund public infrastructure,land dedications, sales taxes, and various ees levied by governments and quasi-governmentagencies.) For three municipalities within the Greater Toronto Area, the estimated shares (forsingle detached homes) are: Vaughan – 17.9%, Mississauga – 17.1%, and the City o Toronto –13.4%. With subsequent large increases or two o the major components – developmentcharges and sales tax – the shares are likely now approaching 20%.
Furthermore, costs o complying with government policies and processes, result in urthercosts, and total government-imposed costs must now exceed 25% o the values o homes.
These government-imposed costs must be passed onto home buyers, otherwise the homebuilding industry could not a ord to build the homes.
The resulting increased level o housing prices has consequences in terms o reducedhousing demand, which consequently reduces the level o employment within theconstruction industry as well as within other industries that provide goods and services thatare used in the construction process. In turn, government tax revenues are reduced.
The increased housing prices and reduced housing demand would also have social impacts:higher housing costs will reduce ability to pay for other necessities (and comforts), possibly including education; reduced housing demand would imply limitationson quality o li e andachievement o other li e objectives.
This report develops estimates o the economic impacts. Social impacts are not urtherdiscussed here, but surely must be borne in mind.
Consequences of Government-Imposed Costs March 2011 7
8/7/2019 Dunning Study
http://slidepdf.com/reader/full/dunning-study 8/40
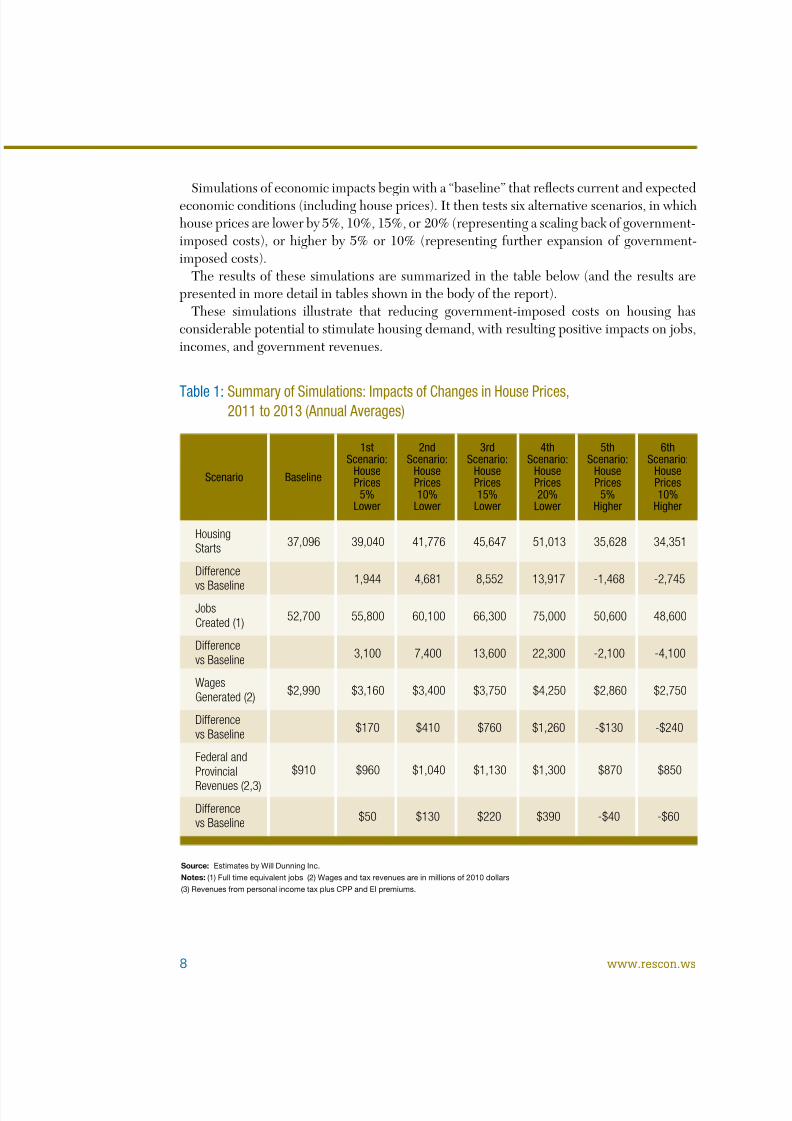
Simulations o economic impacts begin with a “baseline” that refects current and expectedeconomic conditions (including house prices). It then tests six alternative scenarios, in whichhouse prices are lower by 5%, 10%, 15%, or 20% (representing a scaling back of government-imposed costs), or higher by 5% or 10% (representing further expansion of government-imposed costs).
The results of these simulations are summarized in the table below (and the results arepresented in more detail in tables shown in the body o the report).
These simulations illustrate that reducing government-imposed costs on housing hasconsiderable potential to stimulate housing demand, with resulting positive impacts on jobs,incomes, and government revenues.
Source: Estimates by Will Dunning Inc.Notes: (1) Full time equivalent jobs (2) Wages and tax revenues are in millions of 2010 dollars(3) Revenues from personal income tax plus CPP and EI premiums.
Table 1:Summary of Simulations: Impacts of Changes in House Prices,2011 to 2013 (Annual Averages)
HousingStarts 37,096 39,040 41,776 45,647 51,013 35,628 34,351
Difference
vs Baseline1,944 4,681 8,552 13,917 -1,468 -2,745
JobsCreated (1) 52,700 55,800 60,100 66,300 75,000 50,600 48,600
Differencevs Baseline 3,100 7,400 13,600 22,300 -2,100 -4,100
WagesGenerated (2) $2,990 $3,160 $3,400 $3,750 $4,250 $2,860 $2,750
Differencevs Baseline $170 $410 $760 $1,260 -$130 -$240
Federal andProvincial
Revenues (2,3)
$910 $960 $1,040 $1,130 $1,300 $870 $850
Differencevs Baseline $50 $130 $220 $390 -$40 -$60
1stScenario:
HousePrices
5%Lower
Scenario Baseline
2ndScenario:
HousePrices10%
Lower
3rdScenario:
HousePrices15%
Lower
4thScenario:
HousePrices20%
Lower
5thScenario:
HousePrices
5%Higher
6thScenario:
HousePrices10%
Higher
8 www.rescon.ws
8/7/2019 Dunning Study
http://slidepdf.com/reader/full/dunning-study 9/40
ImplicationsWith regard to the direct government-imposed costs, it is time to consider whether theexisting unding model is appropriate:
• Given the magnitudes of current costs and the resulting substantial negative impacts,alternative models must be given care ul consideration.
• A model in which municipalities have long-term accountability for the costs they incur islikely to result in greater e ciency than the current model in which the costs are paid by a subset o the population who cannot control the costs. An alternative model that resultsin this shi ting o accountability would entail municipalities unding in rastructure costsvia grants from higher levels of government, tax revenues, user fees, or by borrowing (andthen retiring the borrowing out o tax revenues).
• Moreover, the house price increases that result from direct and indirect government-imposed costs a ect not just buyers o new homes – in order or new development to beviable in the market the government-imposed costs must also become refected in valuesacross the entire existing housing inventory. There ore, the attempt to shi t costs ontobuyers o new homes negatively a ects housing a ordability or the entire community.
With regard to indirect costs, a growing number o seemingly reasonable requirements havecumulated into a seemingly unreasonable total cost that is ultimately borne by buyers o newhomes, and again, ultimately a ects housing a ordability or the entire community. There isa need to look at these costs in totality and where possible to streamline requirements.
For the uture, when new requirements are contemplated that will have direct or indirectimpacts on house prices, there is a need to examine costs and bene ts: current decision-making processes are not adequately – and possible not at all – balancing costs and bene ts.
Consequences of Government-Imposed Costs March 2011 9
8/7/2019 Dunning Study
http://slidepdf.com/reader/full/dunning-study 10/40
About RESCONThe Residential Construction Council of Ontario (RESCON) is an association that caterssolely to builder interests and issues. Builders ace unique demands that require promptaction. RESCON has pioneered innovative contributions to the ollowing areas: Health& Sa ety and WSIB Issues, Labour Training and Apprenticeship, Building Code Re orm,Technical Standards and Procedures and Insurance.
RESCON and its a liated associations are the industry voice on all key construction-relatedbuilder issues and interests. RESCON includes the membership o three active groups: theMetropolitan Toronto Apartment Builders Association (MTABA), the Toronto ResidentialConstruction Labour Bureau (TRCLB) and the Durham Residential Construction LabourBureau (DRCLB) as well as various non-union builders. It has also aided with the inception
of the Ontario Residential Council of Construction Associations (ORCCA) which is acoordinating council o residential trade associations that addresses common concerns.The members o RESCON are based in southern Ontario, the heart o the building
industry, a region that generates approximately one-third o all housing starts in Canada.
About Will Dunning and Will Dunning Inc.Will Dunning has been studying housing markets since 1982. For 16 years he worked atCanada Mortgage and Housing Corporation in various market analysis positions, includingsix years as the manager o the market analysis department at the Toronto Branch, withresponsibility or all aspects o economic, demographic, and market analysis or the GreaterToronto Area.
Will has a Bachelor o Arts degree in Economics rom McGill University and a Master o Arts degree in Economics rom the University o British Columbia. In the all o 2000 heestablished Will Dunning Inc, which specializes in the economic and demographic analysiso housing markets.
For more in ormation or to view a variety o recent reports and presentations on housingmarket topics visit www.wdunning.com
10 www.rescon.ws

8/7/2019 Dunning Study
http://slidepdf.com/reader/full/dunning-study 11/40
Figure 1-1:GICs and Their ComponentsComponentsGIC Level
Infrastructurecharges
Land dedications
Development applicationand processing fees
Building permit fees
Home warranty fees
Registry/Land transfer fees
Provincial sales taxes
Provincial other
GST
Property taxes
Municipal/regional
Municipal/regional
Municipal/regional
Municipal/regional
Provincial
Provincial
Provincial
Provincial
Federal
Municipal/regional
Hard (sewer, water, road) and soft (parks, libraries, police station)
off-site infrastructure (either through subdivision agreement ordevelopment charges), and water and sewer connection fees.Engineering review fee. Sewer connection and other inspection fees.
Land dedications and cash in lieu
Subdivision application fees, condominium applicationfees, site plan approval, administration fees.
Building permit, plumbing, and mechanical or electrical permit fees.
New home warranty programs (both required and optional)
Land transfer taxes and title registration fees.
Provincial Sales Tax on construction materials, Quebec SalesTax on house sale, Harmonized Sales Tax on house sale.
Provincial plumbing and electrical inspection fees, provincialengineering review fees, home warranty licensing fees.
GST on house sale.
Property taxes, garbage collection surcharges, policesurcharges, re surcharges, education surcharges, etc.
Costs as of 2006A CMHC-sponsored research project quanti ed direct government-imposed costs as o 20062 .The gure below (taken verbatim from the report) identi es the cost elements that weremeasured. This listing appears to be quite comprehensive, although it is possible that some minorcost elements were not included. The authors state clearly that the estimates do not includeindirect costs that are “created by government regulations (such as zoning, building codes andapprovals processes) but not directly charged by a government or quasi-government agency”.
1.0 Growing Direct Government-Imposed Costs
The research study developed costs for government-imposed costs (hereafter “GICs”)for three dwelling types (median priced single-family detached homes, town homes, andapartments) or major urban centres across Canada.
Clearly, the greatest effort was devoted to the single-family detached dwelling type (which is reasonable
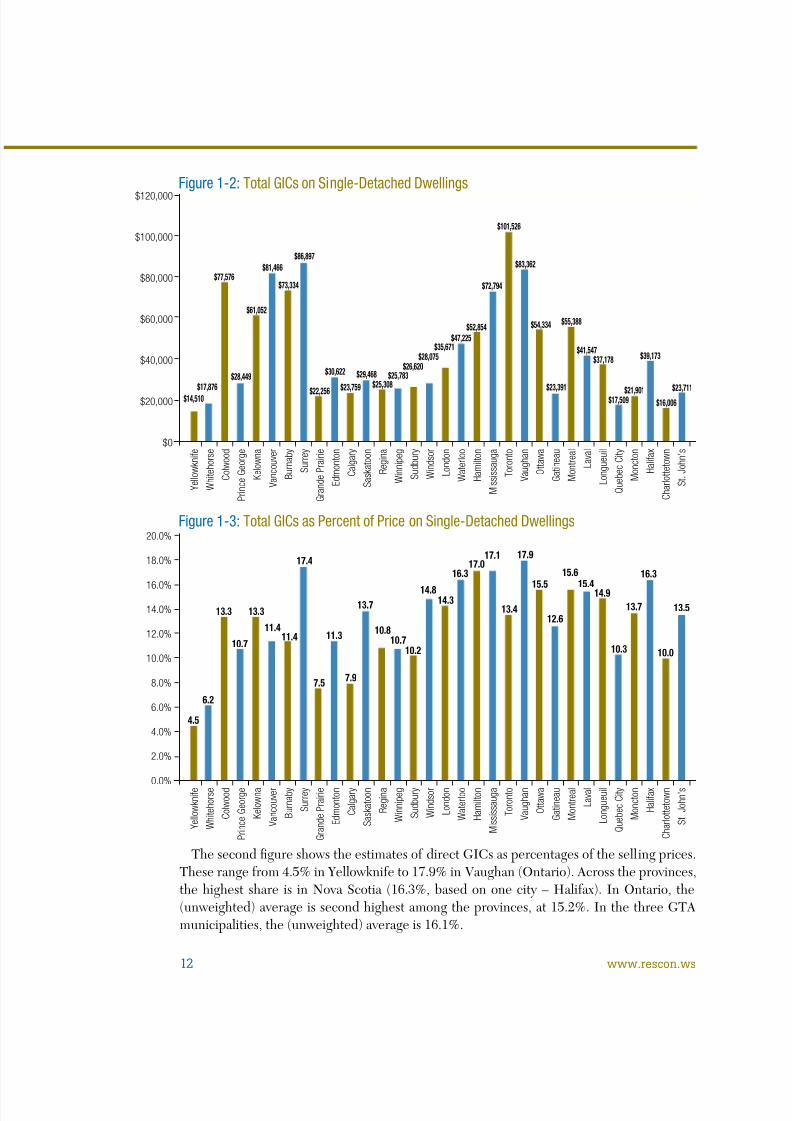
given that this type represents the largest share o new residential development). The estimatesare summarized within the report in a set o bar charts. Two o the charts are presented below.The rst gure on the next page shows the Tomalty/Skaburskis estimates o total costs or the
direct GICs as o 2006. As can be seen, the costs range rom a low o $14,510 in Yellowkni e toa high o $101,526 in the City o Toronto. In dollar terms, GICs are largest in British Columbia(for the six cities the average – not weighted by size – is about $68,000), followed by Ontario(unweighted average of about $56,000 across nine centres). Within the three municipalitieslocated in the Greater Toronto Area, the average is about $86,000 (again unweighted), including$101,526 or the City o Toronto, $83,362 or Vaughan, and $72,794 or Mississauga.
Consequences of Government-Imposed Costs March 2011 11
8/7/2019 Dunning Study
http://slidepdf.com/reader/full/dunning-study 12/40
The second gure shows the estimates o direct GICs as percentages o the selling prices.These range from 4.5% in Yellowknife to 17.9% in Vaughan (Ontario). Across the provinces,the highest share is in Nova Scotia (16.3%, based on one city – Halifax). In Ontario, the(unweighted) average is second highest among the provinces, at 15.2%. In the three GTAmunicipalities, the (unweighted) average is 16.1%.
Figure 1-2:Total GICs on Single-Detached Dwellings
Figure 1-3:Total GICs as Percent of Price on Single-Detached Dwellings
4.5
6.2
13.3 13.3
10.7
11.411.4
17.4
11.3
7.5 7.9
13.7
10.810.7
10.2
14.814.3
16.317.0
17.1
13.4
17.9
15.5
12.6
15.6
14.915.4
10.3 10.0
13.7
16.3
13.5
Yellowknife
Whitehorse
Colwood
Prince George
Kelowna
Vancouver
Burnaby
Surrey
Grande Prairie
Edmonton
Calgary
Saskatoon
Regina
Winnipeg
Sudbury
Windsor
London
Waterloo
Hamilton
Mississauga
Toronto
Vaughan
Ottawa
Gatineau
Montreal
Laval
Longueuil
Quebec City
Moncton
Halifax
Charlottetown
St. John’s
20.0%
18.0%
16.0%14.0%
12.0%
10.0%
8.0%
6.0%
4.0%
2.0%
0.0%
$14,510
Yellowknife
Whitehorse
Colwood
Prince George
Kelowna
Vancouver
Burnaby
Surrey
Grande Prairie
Edmonton
Calgary
Saskatoon
Regina
Winnipeg
Sudbury
Windsor
London
Waterloo
Hamilton
Mississauga
Toronto
Vaughan
Ottawa
Gatineau
Montreal
Laval
Longueuil
Quebec City
Moncton
Halifax
Charlottetown
St. John’s
$120,000
$100,000
$80,000
$60,000
$40,000
$20,000
$0
$17,876
$77,576
$28,449
$61,052
$81,466
$73,334
$86,897
$22,256
$30,622
$23,759$29,468
$25,308$25,783
$26,620$28,075
$35,671$47,225
$52,854
$72,794
$101,526
$83,362
$54,334
$23,391
$55,388
$41,547$37,178
$17,509$21,901
$39,173
$16,006
$23,711
12 www.rescon.ws
8/7/2019 Dunning Study
http://slidepdf.com/reader/full/dunning-study 13/40
8/7/2019 Dunning Study
http://slidepdf.com/reader/full/dunning-study 14/40
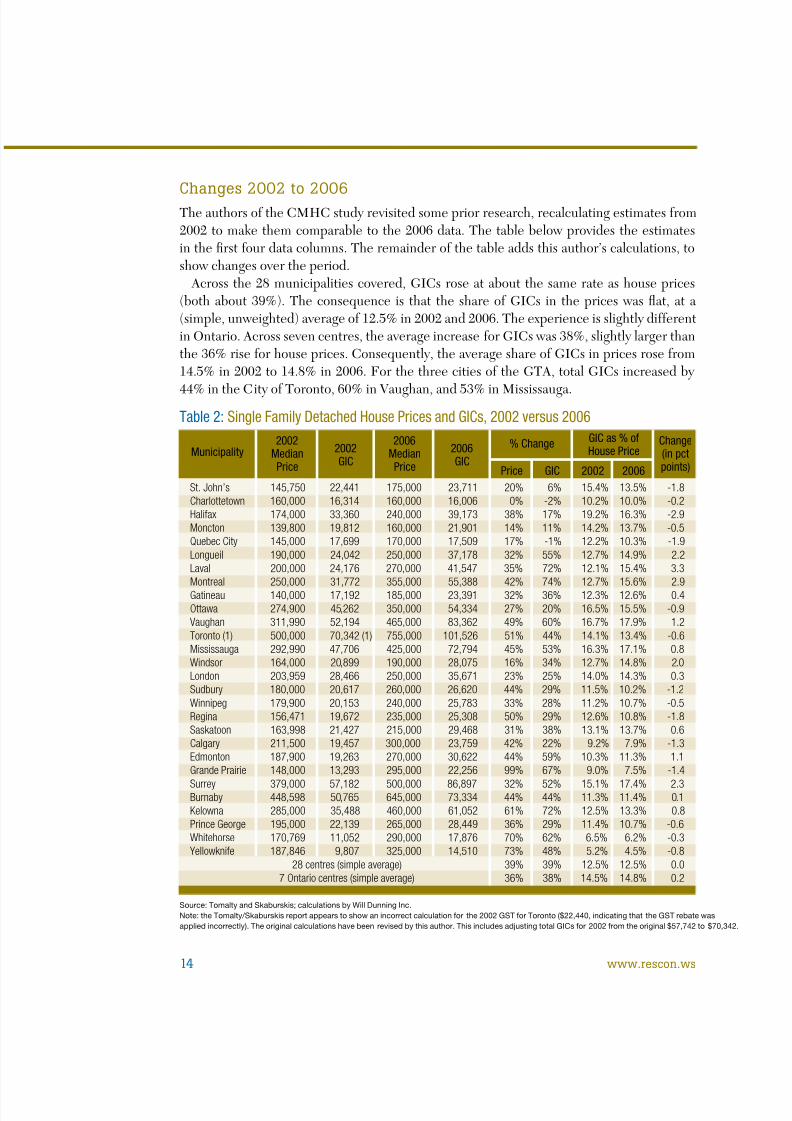
Source: Tomalty and Skaburskis; calculations by Will Dunning Inc.Note: the Tomalty/Skaburskis report appears to show an incorrect calculation for the 2002 GST for Toronto ($22,440, indicating that the GST rebate wasapplied incorrectly). The original calculations have been revised by this author. This includes adjusting total GICs for 2002 from the original $57,742 to $70,342.
Table 2:Single Family Detached House Prices and GICs, 2002 versus 2006
2002GIC
Municipality2002
MedianPrice
2006MedianPrice
2006GIC
% Change GIC as % ofHouse Price
Change(in pctpoints)Price GIC 2002 2006
St. John’s 145,750 22,441 175,000 23,711 20% 6% 15.4% 13.5% -1.8Charlottetown 160,000 16,314 160,000 16,006 0% -2% 10.2% 10.0% -0.2Halifax 174,000 33,360 240,000 39,173 38% 17% 19.2% 16.3% -2.9Moncton 139,800 19,812 160,000 21,901 14% 11% 14.2% 13.7% -0.5Quebec City 145,000 17,699 170,000 17,509 17% -1% 12.2% 10.3% -1.9Longueil 190,000 24,042 250,000 37,178 32% 55% 12.7% 14.9% 2.2Laval 200,000 24,176 270,000 41,547 35% 72% 12.1% 15.4% 3.3Montreal 250,000 31,772 355,000 55,388 42% 74% 12.7% 15.6% 2.9Gatineau 140,000 17,192 185,000 23,391 32% 36% 12.3% 12.6% 0.4Ottawa 274,900 45,262 350,000 54,334 27% 20% 16.5% 15.5% -0.9Vaughan 311,990 52,194 465,000 83,362 49% 60% 16.7% 17.9% 1.2Toronto (1) 500,000 70,342 (1) 755,000 101,526 51% 44% 14.1% 13.4% -0.6Mississauga 292,990 47,706 425,000 72,794 45% 53% 16.3% 17.1% 0.8Windsor 164,000 20,899 190,000 28,075 16% 34% 12.7% 14.8% 2.0London 203,959 28,466 250,000 35,671 23% 25% 14.0% 14.3% 0.3Sudbury 180,000 20,617 260,000 26,620 44% 29% 11.5% 10.2% -1.2Winnipeg 179,900 20,153 240,000 25,783 33% 28% 11.2% 10.7% -0.5Regina 156,471 19,672 235,000 25,308 50% 29% 12.6% 10.8% -1.8Saskatoon 163,998 21,427 215,000 29,468 31% 38% 13.1% 13.7% 0.6Calgary 211,500 19,457 300,000 23,759 42% 22% 9.2% 7.9% -1.3Edmonton 187,900 19,263 270,000 30,622 44% 59% 10.3% 11.3% 1.1Grande Prairie 148,000 13,293 295,000 22,256 99% 67% 9.0% 7.5% -1.4
Surrey 379,000 57,182 500,000 86,897 32% 52% 15.1% 17.4% 2.3Burnaby 448,598 50,765 645,000 73,334 44% 44% 11.3% 11.4% 0.1Kelowna 285,000 35,488 460,000 61,052 61% 72% 12.5% 13.3% 0.8Prince George 195,000 22,139 265,000 28,449 36% 29% 11.4% 10.7% -0.6Whitehorse 170,769 11,052 290,000 17,876 70% 62% 6.5% 6.2% -0.3Yellowknife 187,846 9,807 325,000 14,510 73% 48% 5.2% 4.5% -0.8
28 centres (simple average) 39% 39% 12.5% 12.5% 0.07 Ontario centres (simple average) 36% 38% 14.5% 14.8% 0.2
Changes 2002 to 2006The authors o the CMHC study revisited some prior research, recalculating estimates rom2002 to make them comparable to the 2006 data. The table below provides the estimatesin the rst our data columns. The remainder o the table adds this author’s calculations, toshow changes over the period.
Across the 28 municipalities covered, GICs rose at about the same rate as house prices(both about 39%). The consequence is that the share of GICs in the prices was at, at a(simple, unweighted) average of 12.5% in 2002 and 2006. The experience is slightly differentin Ontario. Across seven centres, the average increase or GICs was 38%, slightly larger thanthe 36% rise or house prices. Consequently, the average share o GICs in prices rose rom14.5% in 2002 to 14.8% in 2006. For the three cities o the GTA, total GICs increased by
44% in the City o Toronto, 60% in Vaughan, and 53% in Mississauga.
14 www.rescon.ws
8/7/2019 Dunning Study
http://slidepdf.com/reader/full/dunning-study 15/40
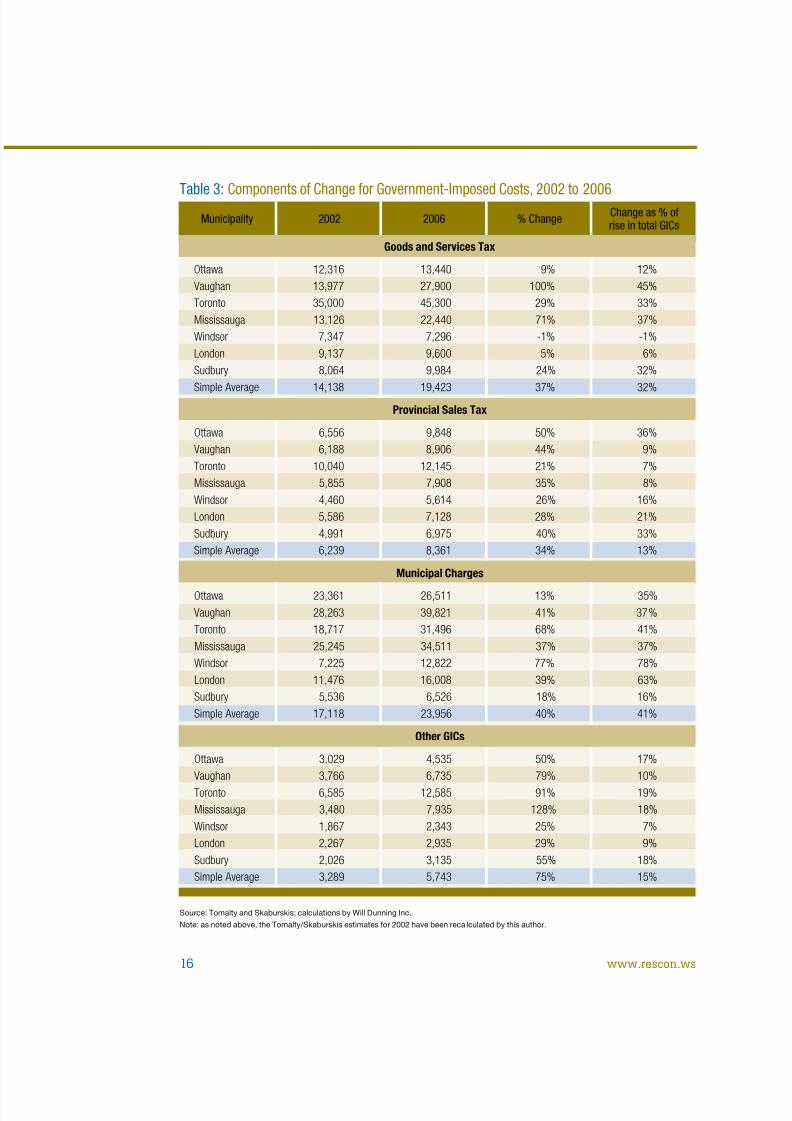
Looking in more detail at the seven Ontario cities included in the analysis, the table on thenext page shows the components o change.
The estimates indicate that Goods and Services Tax rose by 37% (based on a simpleunweighted average) and accounted or about one-third o the increase or GICs across theprovince (32% – as is shown in the right-most column of the table). Within two of the threemunicipalities located within the Greater Toronto Area, increases or GST were considerably larger, because by 2006 the house prices exceeded the $450,000 threshold or the GSTrebates: the e ective rates or GST increased, rom 4.48% as o 2002 to 6.0% as o 2006(in Vaughan) and 5.3% (Mississauga). In the City of Toronto, the rise for GST was belowaverage, because the $450,000 threshold was exceeded in both 2002 and 2006: the tax ratewas reduced rom 7% in 2002 to 6% in 2006.
For provincial sales tax, estimated increases were generally slightly lower than the rateo increase in house prices. This is likely due to the act that costs or the materials that aresubject to PST increased less rapidly than the costs or land and labour that were not subjectto PST.
Municipal charges (which includes development charges and various fees) rose by 40%and accounted for the largest share of the rise (41% – again, calculations are based on simpleunweighted averages). Within the three cities located in the GTA, the increases or municipalcharges were 41% in Vaughan, 68% in the City o Toronto, and 37% in Mississauga.
The remainder of the charges that are included in the calculations (land registry, newhome warranty, and other provincial charges) rose quite rapidly (by 75% on average forthe seven centres in Ontario, including 79% in Vaughan, 91% in the City o Toronto, and128% in Mississauga. The largest component o these increases is land trans er tax, which iscalculated using a steeply progressive scale.
Consequences of Government-Imposed Costs March 2011 15
8/7/2019 Dunning Study
http://slidepdf.com/reader/full/dunning-study 16/40
Source: Tomalty and Skaburskis; calculations by Will Dunning Inc.Note: as noted above, the Tomalty/Skaburskis estimates for 2002 have been reca lculated by this author.
Table 3:Components of Change for Government-Imposed Costs, 2002 to 20062006Municipality 2002 % Change Change as % of
rise in total GICs
Goods and Services Tax
Ottawa 12,316 13,440 9% 12%Vaughan 13,977 27,900 100% 45%Toronto 35,000 45,300 29% 33%Mississauga 13,126 22,440 71% 37%Windsor 7,347 7,296 -1% -1%London 9,137 9,600 5% 6%Sudbury 8,064 9,984 24% 32%
Simple Average 14,138 19,423 37% 32%Provincial Sales Tax
Ottawa 6,556 9,848 50% 36%Vaughan 6,188 8,906 44% 9%Toronto 10,040 12,145 21% 7%Mississauga 5,855 7,908 35% 8%Windsor 4,460 5,614 26% 16%London 5,586 7,128 28% 21%Sudbury 4,991 6,975 40% 33%Simple Average 6,239 8,361 34% 13%
Municipal Charges
Ottawa 23,361 26,511 13% 35%Vaughan 28,263 39,821 41% 37%Toronto 18,717 31,496 68% 41%Mississauga 25,245 34,511 37% 37%Windsor 7,225 12,822 77% 78%London 11,476 16,008 39% 63%Sudbury 5,536 6,526 18% 16%Simple Average 17,118 23,956 40% 41%
Other GICs
Ottawa 3,029 4,535 50% 17%Vaughan 3,766 6,735 79% 10%Toronto 6,585 12,585 91% 19%Mississauga 3,480 7,935 128% 18%Windsor 1,867 2,343 25% 7%London 2,267 2,935 29% 9%Sudbury 2,026 3,135 55% 18%Simple Average 3,289 5,743 75% 15%
16 www.rescon.ws

8/7/2019 Dunning Study
http://slidepdf.com/reader/full/dunning-study 17/40
8/7/2019 Dunning Study
http://slidepdf.com/reader/full/dunning-study 18/40
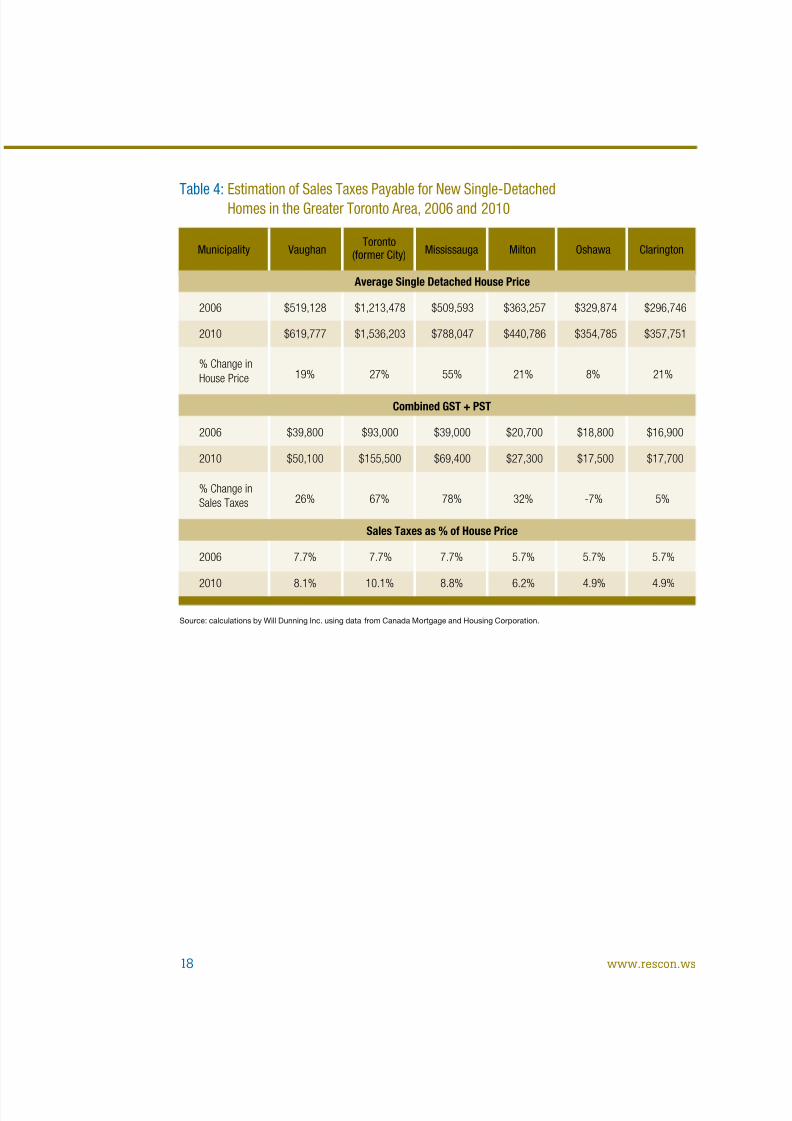
Source: calculations by Will Dunning Inc. using data from Canada Mortgage and Housing Corporation.
Table 4:Estimation of Sales Taxes Payable for New Single-DetachedHomes in the Greater Toronto Area, 2006 and 2010
Toronto(former City)Municipality Vaughan Mississauga Milton Oshawa Clarington
Average Single Detached House Price
2006 $519,128 $1,213,478 $509,593 $363,257 $329,874 $296,746
2010 $619,777 $1,536,203 $788,047 $440,786 $354,785 $357,751
% Change inHouse Price 19% 27% 55% 21% 8% 21%
Combined GST + PST
2006 $39,800 $93,000 $39,000 $20,700 $18,800 $16,900
2010 $50,100 $155,500 $69,400 $27,300 $17,500 $17,700
% Change inSales Taxes 26% 67% 78% 32% -7% 5%
Sales Taxes as % of House Price
2006 7.7% 7.7% 7.7% 5.7% 5.7% 5.7%
2010 8.1% 10.1% 8.8% 6.2% 4.9% 4.9%
18 www.rescon.ws
8/7/2019 Dunning Study
http://slidepdf.com/reader/full/dunning-study 19/40
In addition to the tax rises, there have been increases or municipal costs. This study hasnot attempted to update the municipal costs, but piecemeal in ormation shows that therehave been substantial increases.
A recent research report “Alternatives to Development Charges or Growth-RelatedCapital Costs”, completed by David Amborski or the Residential & Civil ConstructionAlliance o Ontario shows:
• For Vaughan, in 2010 development charges amounted to $41,245, a 43% rise versus the2006 amount o $28,825 estimated in the Tomalty/Skaburskis study. This ar exceeds the19% increase in house prices over the same our year period.
• For Mississauga, 2010 development charges are estimated as $34,611, 37% above the 2006estimate o $25,310. This increase is less than the 55% rise in house prices over the period,but it is far in excess of overall in ation (4.9%).
• For the City of Toronto, the 2009 development charge is estimated at $12,281, an 11%increase rom 2006. For this period, there was a moderate rate o increases, and it waslower than the 27% increase or house prices. In response to the recession, the City rozeits development charges, but it appears that the period o moderation is now over.
• For Mississauga (and even moreso for Toronto) the low-rise lot supply is essentially builtout: new activity is limited and the market is increasingly concentrated on luxury homes.Among these three municipalities, Vaughan provides the most substantive illustration o the relationship between development charges and house prices, and the extent to whichdevelopment charges are out-pacing house values.
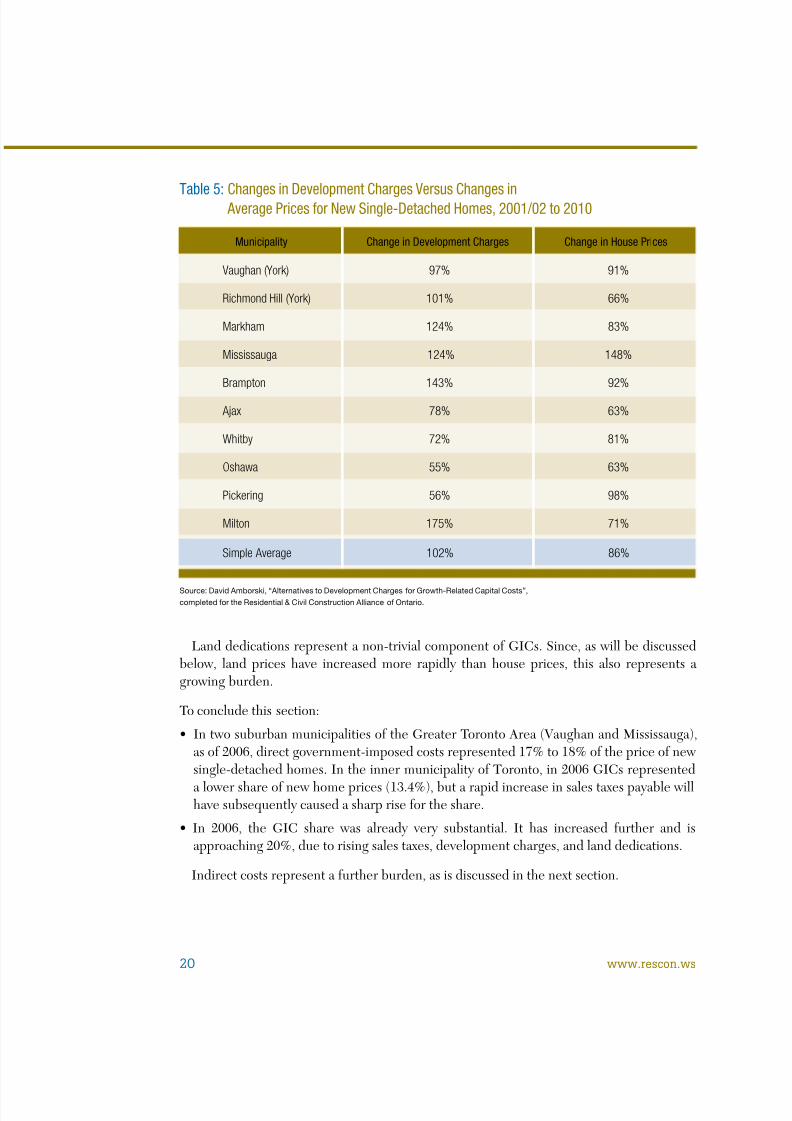
The estimates o development charges in the Tomalty/Skaburskis report cover just threemunicipalities within the Greater Toronto Area. However, estimates can be developed
or 2001/02 versus 2010 using data rom the Amborski report. The table on the next pageprovides data or ten municipalities with signi cant starts o single-detached homes and orwhich the Amborski research provides data on development charges. The gures (increasesin development charges and rises in average house prices) or 2001/02 to 2010 show thatin ve out o ten municipalities increases or development charges exceeded the rises oraverage house prices, and in ve out o ten the opposite was the case. Based on a simpleunweighted average, the increase for development charges (102%) was well in excess of thegrowth of house prices (86%), indicating a rising burden for this component of GICs during2001/02 to 2010.
Consequences of Government-Imposed Costs March 2011 19
8/7/2019 Dunning Study
http://slidepdf.com/reader/full/dunning-study 20/40
Land dedications represent a non-trivial component o GICs. Since, as will be discussedbelow, land prices have increased more rapidly than house prices, this also represents agrowing burden.
To conclude this section:
• In two suburban municipalities of the Greater Toronto Area (Vaughan and Mississauga),as o 2006, direct government-imposed costs represented 17% to 18% o the price o newsingle-detached homes. In the inner municipality o Toronto, in 2006 GICs representeda lower share of new home prices (13.4%), but a rapid increase in sales taxes payable willhave subsequently caused a sharp rise or the share.
• In 2006, the GIC share was already very substantial. It has increased further and isapproaching 20%, due to rising sales taxes, development charges, and land dedications.
Indirect costs represent a urther burden, as is discussed in the next section.
Source: David Amborski, “Alternatives to Development Charges for Growth-Related Capital Costs”,completed for the Residential & Civil Construction Alliance of Ontario.
Table 5:Changes in Development Charges Versus Changes inAverage Prices for New Single-Detached Homes, 2001/02 to 2010
Change in Development ChargesMunicipality Change in House Prices
Vaughan (York) 97% 91%
Richmond Hill (York) 101% 66%
Markham 124% 83%
Mississauga 124% 148%
Brampton 143% 92%
Ajax 78% 63%
Whitby 72% 81%
Oshawa 55% 63%
Pickering 56% 98%
Milton 175% 71%
Simple Average 102% 86%
20 www.rescon.ws
8/7/2019 Dunning Study
http://slidepdf.com/reader/full/dunning-study 21/40
The indirect costs that result rom government requirements have two broad elements: thecost of complying (such as the cost of building to prescribed standards, etc.) and the cost of participating in processes (such as staff costs and costs for consultants).
Considering costs o complying with standards:
• Building requirements (federal and provincial) were originally focused on health, safety,and structural integrity but have increasingly been used to address environmental issuesand social issues.
• Safety-related provisions of building standards have been expanded, such as actual andproposed requirements or sprinklers.
• Clearly improvement in environmental impacts and safety is desirable, but the buildingindustry opines that changes are being introduced without adequate consideration o theircosts or o cost-bene t trade-o s. Moreover, some changes have negative impacts, such asreduced indoor air quality that has resulted rom tightening o building envelopes, whichwill result in urther costs to improve indoor environments and/or will a ect the health o occupants.
Considering costs o participation – the industry aces high and rising costs or taking partin various approval processes.
These indirect costs are even more di cult to measure than the direct costs, and noattempt will be made here to provide estimates.
However, industry participants believe that the costs (for both compliance and participation)
are rising and that current proposals will add urther to costs.RESCON and its membership are attempting to compile in ormation on the costs resultingrom existing or new regulations a ecting housing, with a view to publishing a supplemental
report on indirect GICs. The preliminary indication is that over the past decade cost increaseshave been similar in magnitude to the substantial increases or development charges and
ees.It is noteworthy that there is no existing analysis o these indirect costs. This absence is
due to the fragmentation of regulation across many government interests (including landuse planning, environmental issues, social objectives, health and sa ety, and labour marketissues). The ragmentation o government interactions has prevented development o a “bigpicture” and has allowed total impacts to become extremely large.
2.0 Indirect Costs
Consequences of Government-Imposed Costs March 2011 21
8/7/2019 Dunning Study
http://slidepdf.com/reader/full/dunning-study 22/40
Furthermore, the pressure to address the cost issues was not evident so long as interestrates were alling and masking the impacts on a ordability. It now appears increasingly likely that the period o record low interest rates is at an end, and impacts on a ordability willbecome increasingly important, with negative impacts on the important economic activity o housing construction.
These concerns are not isolated to Canada. Consideration o the impacts o indirect GICshas already resulted in actions in other similar jurisdictions such as Australia and the UnitedKingdom.
In conclusion, the prior section o this report concluded that the direct e ect o government-imposed costs is in the range o 20% o the selling price o new homes, and is rising. Theseindirect costs are additional, and also appear to be rising. It is quite likely that combineddirect and indirect GICs are in the range o 25% to 30% o new home prices.
The in ormation provided here results in a call or urther research on indirect government-imposed costs, and more importantly, or discussions involving all levels o government andthe building industry on:
• Appropriate requirements.
• Future processes that will nd appropriate balances between costs and bene ts.
22 www.rescon.ws
8/7/2019 Dunning Study
http://slidepdf.com/reader/full/dunning-study 23/40
Some might believe that government-imposed costs are paid by land developers and homebuilders and there ore do not a ect home buyers. However, builders will construct homesonly i they can cover their costs and earn a return on their investments that is acceptableto them. The industry is very competitive, and prices are transparent to consumers. Thiscombination limits pro t margins and means that over the long run, prices or new homesmust increase by enough to recover rising government-imposed costs (in addition, of course,to recovering increases or other costs).
The mechanism by which cost increases are passed on to home prices is complex.New homes compete against each other, but even moreso they compete against options
that are available in the resale housing market. There ore, new home prices cannot beautomatically increased whenever costs change. In order or builders to sell their new homes,their prices must be in an attractive relationship to prices in the resale market.
Broadly-speaking, the mechanism is:
• New housing development becomes necessary when a rising population and an expandingnumber o households generate a need to expand the housing stock.
• The pressure from an expanding number of households causes the supply in the resalemarket to be insu cient relative to demand. This causes prices to rise to levels at whichnew construction becomes viable (suf ciently pro table to interest home builders).
• Prices (and supply) will tend to rise to a point at which overall supply and demand are inbalance, which will limit urther pressures or price increases.
• Another way to express this theory is that when the costs of new construction rise (due to
increased government-imposed costs, or due to other cost increases, or labour, materials,land, energy, or nancing costs) pro tability is reduced and there is less incentive to build.This reduces the suppIy o new homes. This creates pressure in the resale market, whichwill tend to result in rising prices – new construction can play its ull role in expandingthe housing inventory only when prices in the resale market have risen su ciently thatbuilders can sell at prices that cover their increased costs.
• A further part of the process is that rising house prices reduce total demand. There aretwo channels or this. Firstly, rising house prices within a community will tend to reducepopulation growth, by discouraging in-movement and encouraging movements away tolower-cost communities. Secondly, higher prices discourage household ormation. We areall aware o suggestions that younger people are staying in the parental homes or longer,and that rising house prices are signi cant actor or this change. Rising GICs and theresulting increases or housing prices have reduced the need to expand the housing stockwithin the GTA, and thereby reduced new housing starts.
Measuring the impacts o house prices on population growth rates and householdormation is quite challenging and there may be no de nitive estimates. This author has
made various attempts at the analysis. The research supports the idea that higher houseprices discourage in-movement and encourage out-movement. Other estimates indicate thata 10% rise in house prices would reduce household ormation rates enough that the total
3.0 Pass-Through of Government-Imposed Costs
Consequences of Government-Imposed Costs March 2011 23

8/7/2019 Dunning Study
http://slidepdf.com/reader/full/dunning-study 24/40
number o households would be 2.5% to 3% lower. I this impact was spread over a 10 yearperiod, household formation (and the required number of housing starts) in the GTA wouldbe reduced by 4,000 to 5,000 per year. The reduced population growth would urther reducehousing requirements.
During that period, there was arelative price advantage or newhomes, with the result that sales o new low-rise homes reached thehighest ever levels, both in termso unit sales and as a percentageo total demand. The chart to theright illustrates the share o newlow-rise home sales relative to totallow-rise sales (new homes plusresales). The record high share inthe middle o the chart coincideswith (and is the consequence of) a period when new homes were at a relative price advantagedue to excess supply. With the elimination o the surplus supply o new homes early in thepast decade, prices returned to a normal relationship and the share ell. Moreover, in the pastthree years, the share has allen to quite low levels, as there is now de cient supply in the newhomes market. This de cient supply can be related to two major actors: continued rapidrise in government-imposed costs which has discouraged investment by builders o low-risehomes and a shortage o building lots, which is attributed to provincial land-use policies.
The chart to the right illustratesthe relationship between prices
or resale and new homes. In bothcases the price data have beenconverted to an index (in whichthe average price during 1989 to1991 provides the base – a valueo 100.0). For the most part, thereis a close relationship, but there isa prolonged period starting about1998 and lasting or our or veyears, in which resale prices rosebut new home prices were slow to ollow. This does not invalidate the theory: the theory tellsus that there will be adjustment, but the adjustment does not need to be instantaneous. Inthis case, there was very substantial capacity to build new homes at the start o that period, inthe orm o ample supplies o development-ready building lots and a large number o homebuilders who were actively marketing.
Figure 3-1
Figure 3-2
24 www.rescon.ws
8/7/2019 Dunning Study
http://slidepdf.com/reader/full/dunning-study 25/40
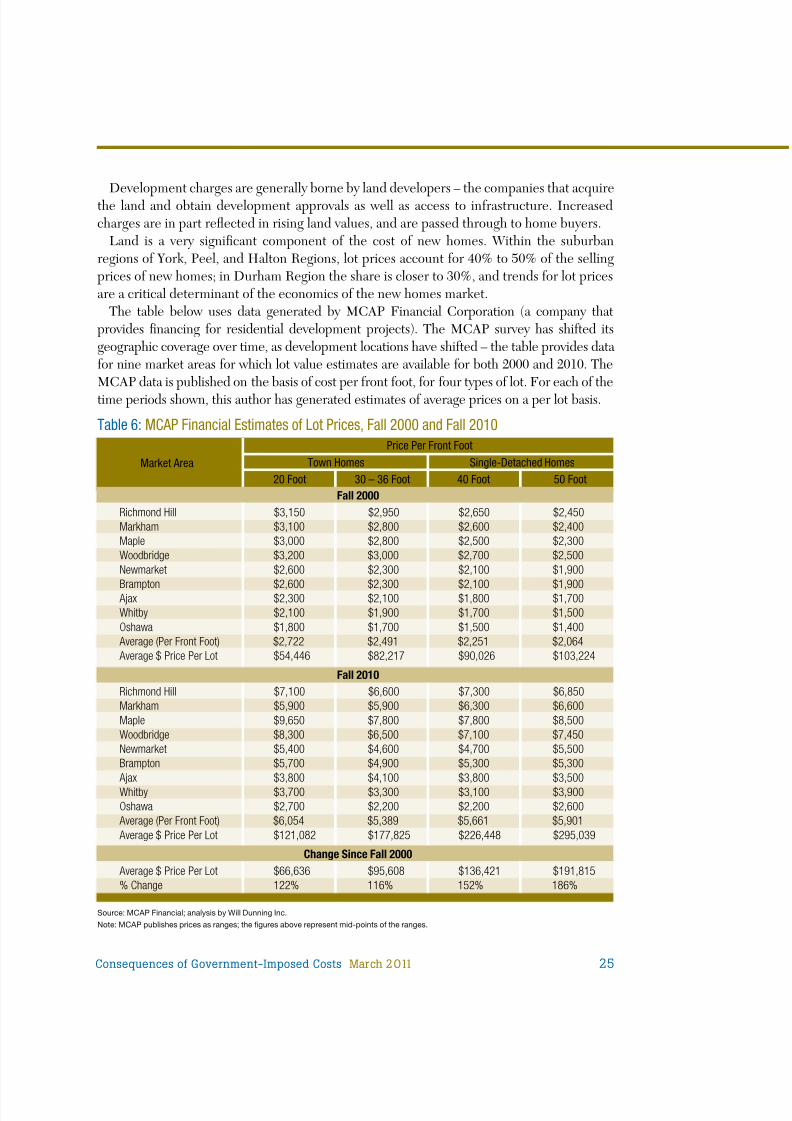
Development charges are generally borne by land developers – the companies that acquirethe land and obtain development approvals as well as access to in rastructure. Increasedcharges are in part refected in rising land values, and are passed through to home buyers.
Land is a very signi cant component o the cost o new homes. Within the suburbanregions o York, Peel, and Halton Regions, lot prices account or 40% to 50% o the sellingprices o new homes; in Durham Region the share is closer to 30%, and trends or lot pricesare a critical determinant o the economics o the new homes market.
The table below uses data generated by MCAP Financial Corporation (a company thatprovides nancing or residential development projects). The MCAP survey has shi ted itsgeographic coverage over time, as development locations have shi ted – the table provides data
or nine market areas or which lot value estimates are available or both 2000 and 2010. TheMCAP data is published on the basis o cost per ront oot, or our types o lot. For each o thetime periods shown, this author has generated estimates o average prices on a per lot basis.
Source: MCAP Financial; analysis by Will Dunning Inc.Note: MCAP publishes prices as ranges; the gures above represent mid-points of the ranges.
Table 6:MCAP Financial Estimates of Lot Prices, Fall 2000 and Fall 2010
Market Area
Price Per Front FootSingle-Detached HomesTown Homes
20 Foot 30 – 36 Foot 40 Foot 50 FootFall 2000
Richmond Hill $3,150 $2,950 $2,650 $2,450Markham $3,100 $2,800 $2,600 $2,400Maple $3,000 $2,800 $2,500 $2,300Woodbridge $3,200 $3,000 $2,700 $2,500Newmarket $2,600 $2,300 $2,100 $1,900
Brampton $2,600 $2,300 $2,100 $1,900Ajax $2,300 $2,100 $1,800 $1,700Whitby $2,100 $1,900 $1,700 $1,500Oshawa $1,800 $1,700 $1,500 $1,400Average (Per Front Foot) $2,722 $2,491 $2,251 $2,064Average $ Price Per Lot $54,446 $82,217 $90,026 $103,224
Fall 2010Richmond Hill $7,100 $6,600 $7,300 $6,850Markham $5,900 $5,900 $6,300 $6,600Maple $9,650 $7,800 $7,800 $8,500Woodbridge $8,300 $6,500 $7,100 $7,450Newmarket $5,400 $4,600 $4,700 $5,500Brampton $5,700 $4,900 $5,300 $5,300Ajax $3,800 $4,100 $3,800 $3,500Whitby $3,700 $3,300 $3,100 $3,900Oshawa $2,700 $2,200 $2,200 $2,600Average (Per Front Foot) $6,054 $5,389 $5,661 $5,901Average $ Price Per Lot $121,082 $177,825 $226,448 $295,039
Change Since Fall 2000Average $ Price Per Lot $66,636 $95,608 $136,421 $191,815% Change 122% 116% 152% 186%
Consequences of Government-Imposed Costs March 2011 25
8/7/2019 Dunning Study
http://slidepdf.com/reader/full/dunning-study 26/40
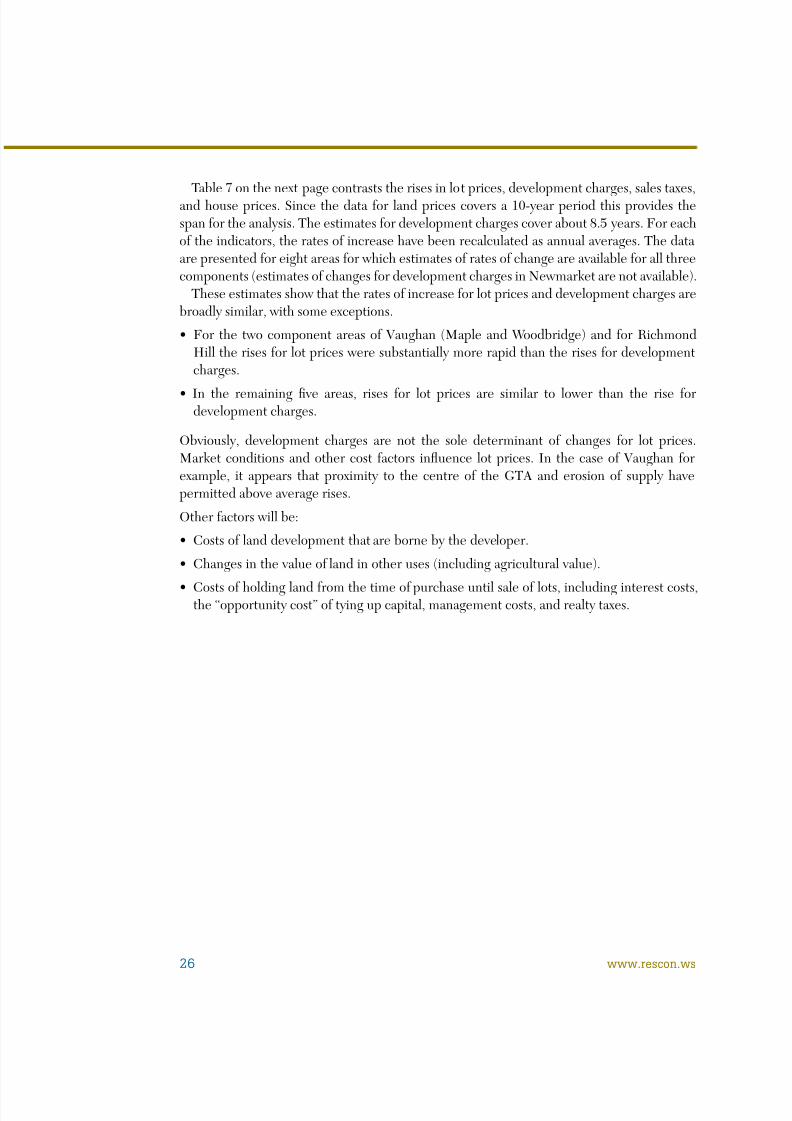
Table 7 on the next page contrasts the rises in lot prices, development charges, sales taxes,and house prices. Since the data or land prices covers a 10-year period this provides thespan or the analysis. The estimates or development charges cover about 8.5 years. For eacho the indicators, the rates o increase have been recalculated as annual averages. The dataare presented or eight areas or which estimates o rates o change are available or all threecomponents (estimates of changes for development charges in Newmarket are not available).
These estimates show that the rates o increase or lot prices and development charges arebroadly similar, with some exceptions.
• For the two component areas of Vaughan (Maple and Woodbridge) and for RichmondHill the rises or lot prices were substantially more rapid than the rises or developmentcharges.
• In the remaining ve areas, rises for lot prices are similar to lower than the rise fordevelopment charges.
Obviously, development charges are not the sole determinant o changes or lot prices.Market conditions and other cost actors infuence lot prices. In the case o Vaughan orexample, it appears that proximity to the centre o the GTA and erosion o supply havepermitted above average rises.
Other actors will be:
• Costs of land development that are borne by the developer.
• Changes in the value of land in other uses (including agricultural value).
• Costs of holding land from the time of purchase until sale of lots, including interest costs,the “opportunity cost” o tying up capital, management costs, and realty taxes.
26 www.rescon.ws
8/7/2019 Dunning Study
http://slidepdf.com/reader/full/dunning-study 27/40
The house price data show increases that are lower than the rates o land price increase insix of eight cases (excluding only Whitby and Oshawa). As a simple average, the annual rateof house price (6.5%) is 2.2 percentage points lower than the rate of land price increases(8.7%), as well as being 1.6 percentage point lower than the increase for developmentcharges (8.1%). Similarly, the data on sales taxes shows rates of increase that exceed houseprice growth. The clear implication o this data sequence is that the “net price” available tocover increased construction costs has increased by even less than the 6.5% rise or “grosshouse prices”.
Source: Will Dunning Inc. using data from MCAP and David Amborski, “Alternatives to Development Chargesfor Growth-Related Capital Costs”, completed for the Residential & Civil Construction Alliance of Ontario.
Notes (1): based on 40 foot lots.
Table 7:Average Annual Increases for Lot Prices (1),Development Charges, Sales Taxes, and House Prices
Lot Prices% Change(10 Years)
Municipality
Richmond Hill 10.7% 8.6% 8.0% 5.9%
Markham 9.3% 9.9% 9.2% 6.8%
Maple 12.1% 8.3% 10.5% 7.7%
Woodbridge 10.2% 8.3% 10.5% 7.7%
Brampton 9.7% 11.0% 8.2% 7.0%
Ajax 7.8% 7.0% 6.0% 4.9%
Whitby 6.2% 6.6% 6.0% 6.5%
Oshawa 3.9% 5.3% 2.8% 5.3%
Simple Average 8.7% 8.1% 7.7% 6.5%
DevelopmentCharges % Change
(8.5 Years)
Sales Tax% Change(10 Years)
Single-DetachedHouse Prices %
Change (10 Years)
Consequences of Government-Imposed Costs March 2011 27
8/7/2019 Dunning Study
http://slidepdf.com/reader/full/dunning-study 28/40
8/7/2019 Dunning Study
http://slidepdf.com/reader/full/dunning-study 29/40
The conclusion from this discussion of housing affordability (building on the discussionin the prior section on price dynamics) is that alling interest rates created room in whichhouse prices could increase i cost pressures generated a need or higher prices. This made itpossible or rapidly rising government-imposed costs to be passed-on in the market.
The fip side o this conclusion is that i not or the rapid rise in government-imposed costs,housing prices would be even lower than they are, a ordability would be even better, and inconsequence, activity in the new housing market would be stronger than it has been in recenttimes. This conclusion is pursued urther in the next section.
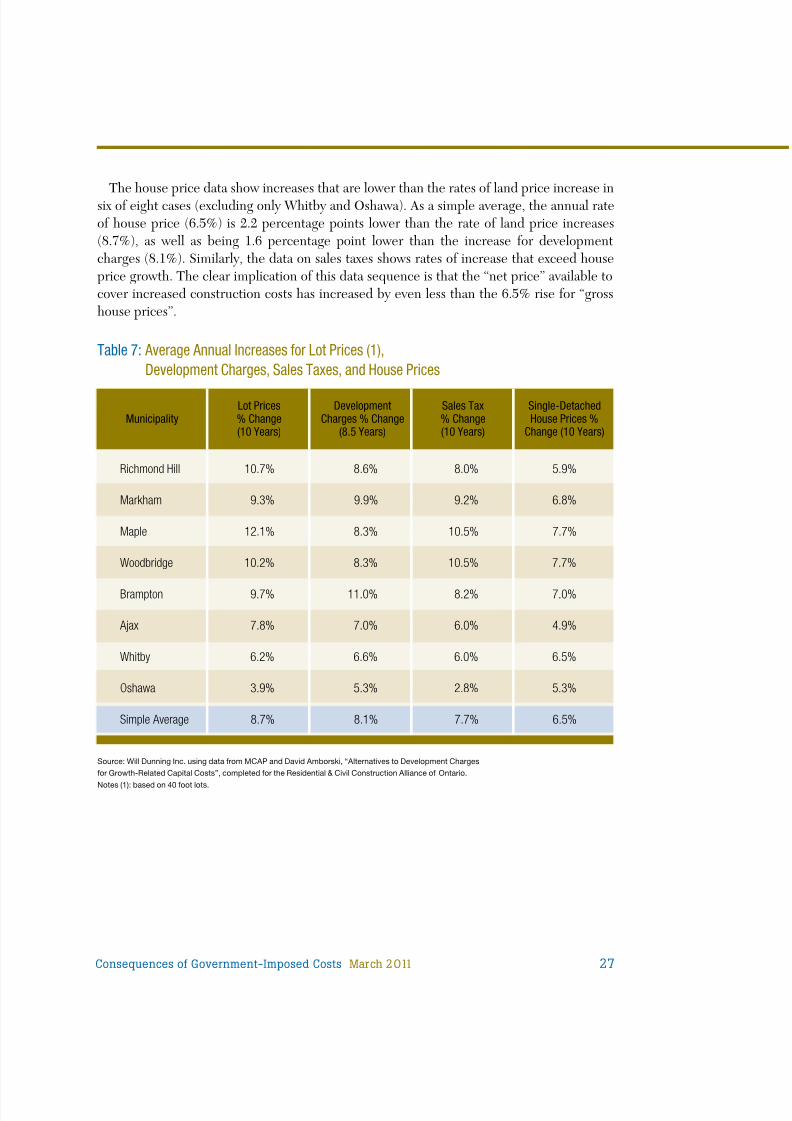
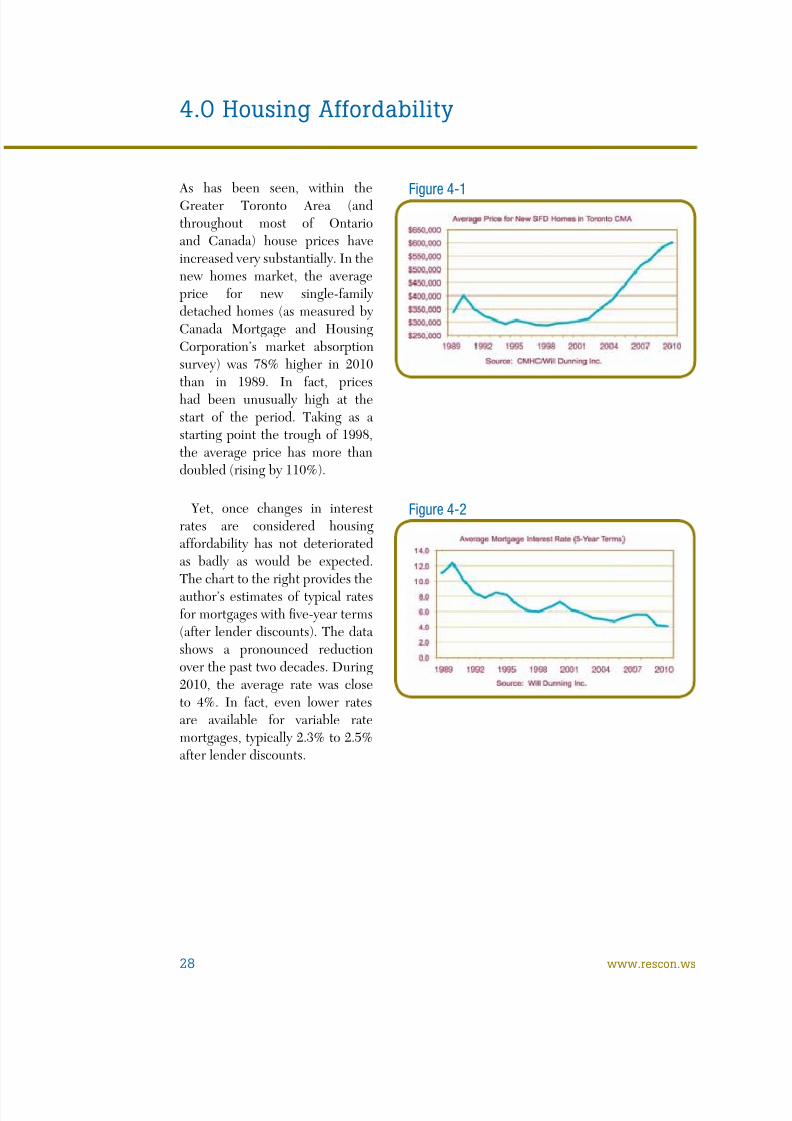
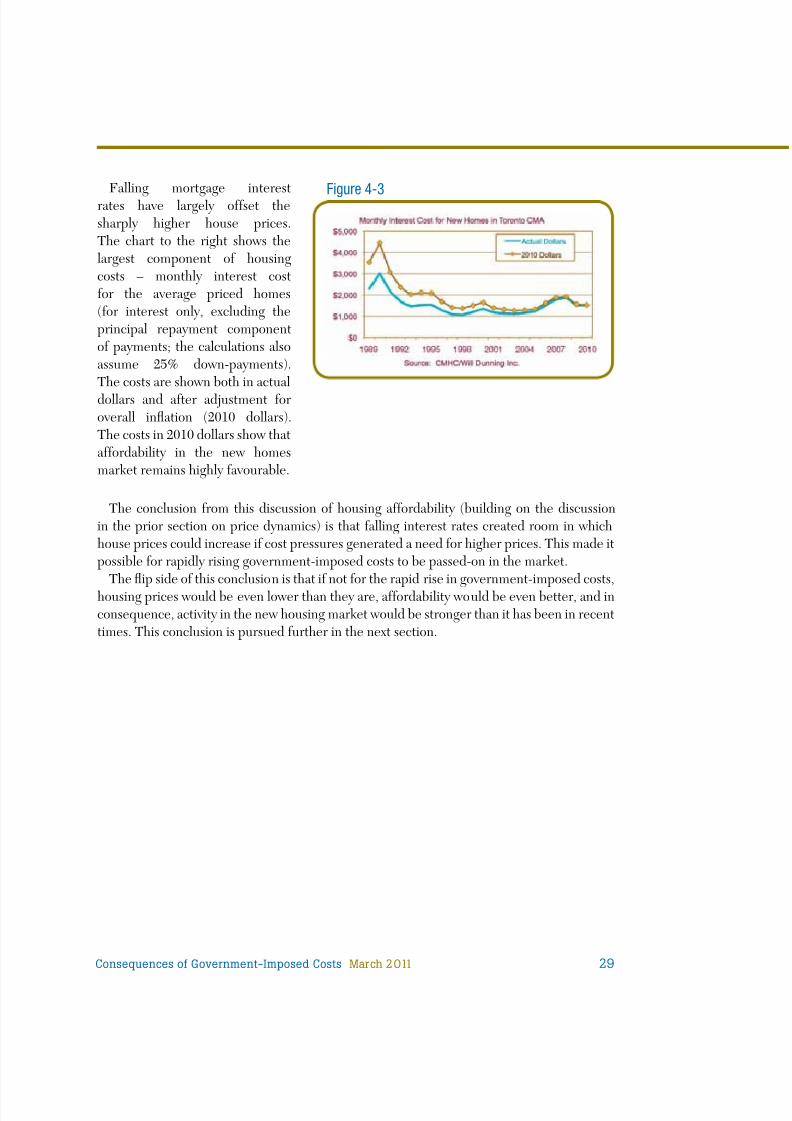
Falling mortgage interestrates have largely o set thesharply higher house prices.The chart to the right shows thelargest component o housingcosts – monthly interest cost
or the average priced homes(for interest only, excluding theprincipal repayment componento payments; the calculations alsoassume 25% down-payments).The costs are shown both in actualdollars and a ter adjustment oroverall in ation (2010 dollars).The costs in 2010 dollars show thata ordability in the new homesmarket remains highly avourable.
Figure 4-3
Consequences of Government-Imposed Costs March 2011 29
8/7/2019 Dunning Study
http://slidepdf.com/reader/full/dunning-study 30/40
5.0 Impacts on Housing Activity
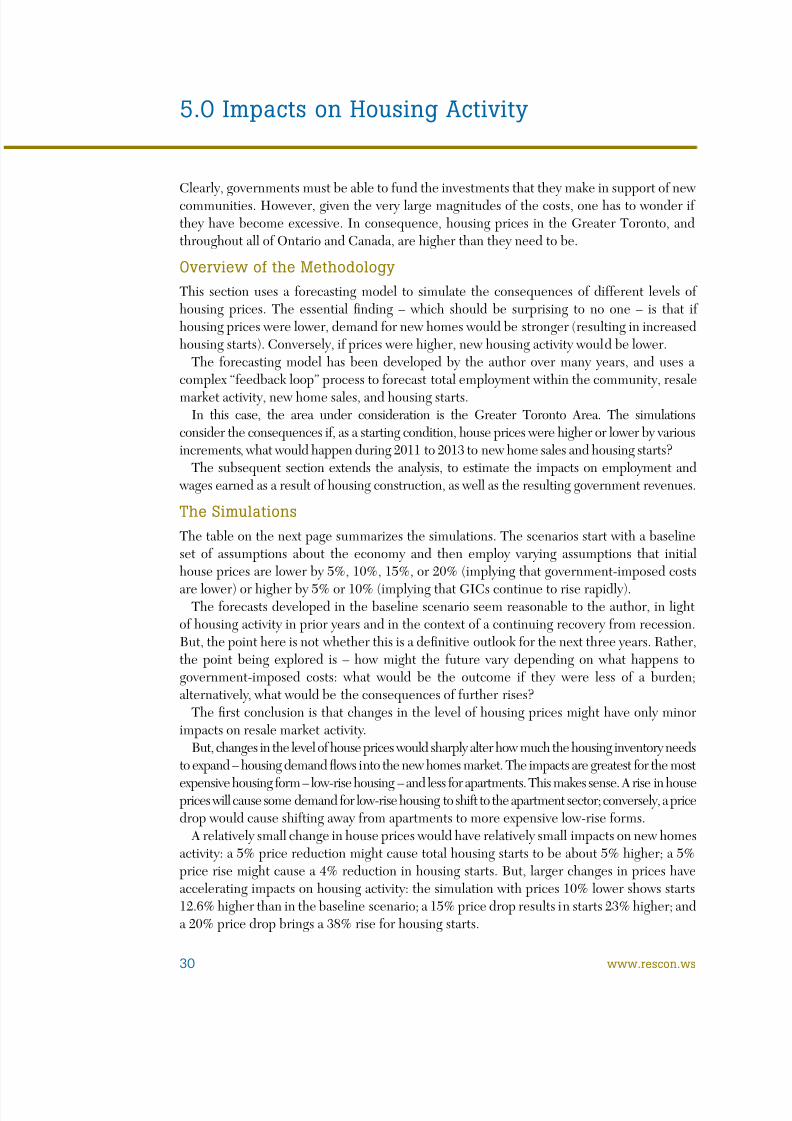
Clearly, governments must be able to und the investments that they make in support o newcommunities. However, given the very large magnitudes o the costs, one has to wonder i they have become excessive. In consequence, housing prices in the Greater Toronto, andthroughout all o Ontario and Canada, are higher than they need to be.
Overview of the MethodologyThis section uses a orecasting model to simulate the consequences o di erent levels o housing prices. The essential nding – which should be surprising to no one – is that i housing prices were lower, demand for new homes would be stronger (resulting in increasedhousing starts). Conversely, i prices were higher, new housing activity would be lower.
The orecasting model has been developed by the author over many years, and uses acomplex “ eedback loop” process to orecast total employment within the community, resalemarket activity, new home sales, and housing starts.
In this case, the area under consideration is the Greater Toronto Area. The simulationsconsider the consequences i , as a starting condition, house prices were higher or lower by variousincrements, what would happen during 2011 to 2013 to new home sales and housing starts?
The subsequent section extends the analysis, to estimate the impacts on employment andwages earned as a result o housing construction, as well as the resulting government revenues.
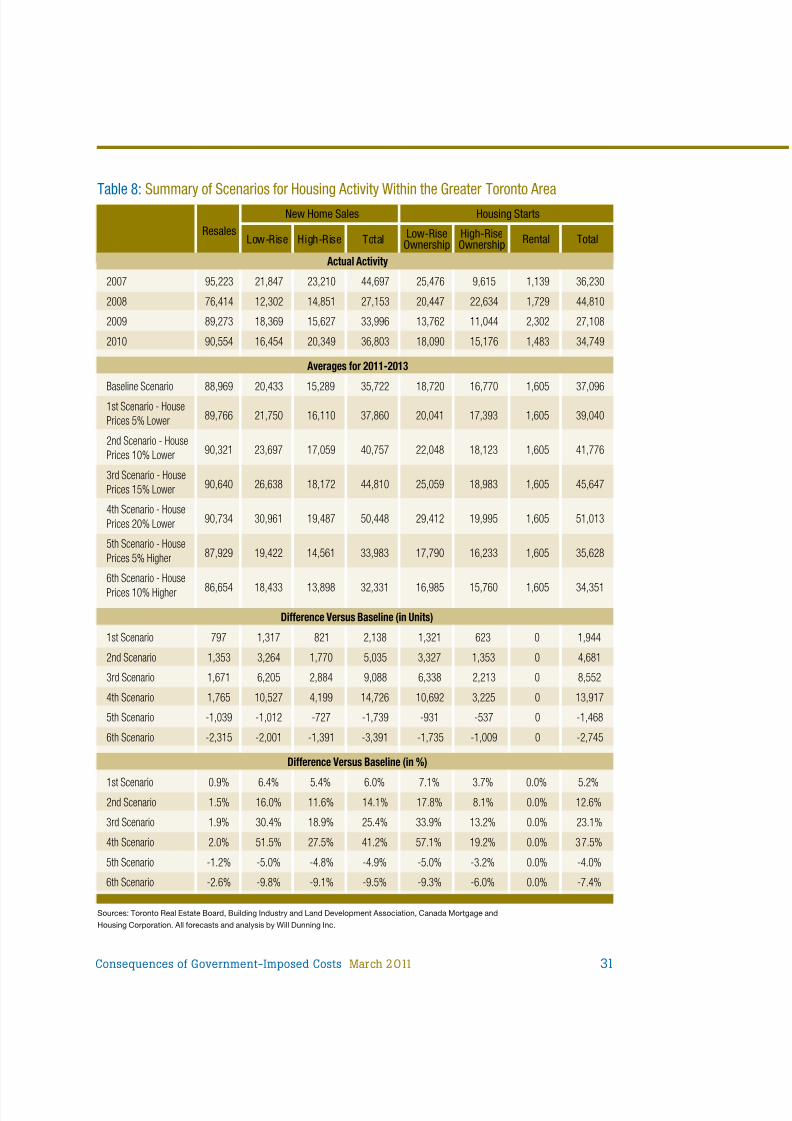
The SimulationsThe table on the next page summarizes the simulations. The scenarios start with a baselineset o assumptions about the economy and then employ varying assumptions that initialhouse prices are lower by 5%, 10%, 15%, or 20% (implying that government-imposed costs
are lower) or higher by 5% or 10% (implying that GICs continue to rise rapidly).The orecasts developed in the baseline scenario seem reasonable to the author, in light
o housing activity in prior years and in the context o a continuing recovery rom recession.But, the point here is not whether this is a de nitive outlook or the next three years. Rather,the point being explored is – how might the uture vary depending on what happens togovernment-imposed costs: what would be the outcome i they were less o a burden;alternatively, what would be the consequences o urther rises?
The rst conclusion is that changes in the level o housing prices might have only minorimpacts on resale market activity.
But, changes in the level o house prices would sharply alter how much the housing inventory needsto expand – housing demand fows into the new homes market. The impacts are greatest or the most
expensive housing orm – low-rise housing – and less or apartments. This makes sense. A rise in houseprices will cause some demand or low-rise housing to shi t to the apartment sector; conversely, a pricedrop would cause shi ting away rom apartments to more expensive low-rise orms.
A relatively small change in house prices would have relatively small impacts on new homesactivity: a 5% price reduction might cause total housing starts to be about 5% higher; a 5%price rise might cause a 4% reduction in housing starts. But, larger changes in prices haveaccelerating impacts on housing activity: the simulation with prices 10% lower shows starts12.6% higher than in the baseline scenario; a 15% price drop results in starts 23% higher; anda 20% price drop brings a 38% rise or housing starts.
30 www.rescon.ws
8/7/2019 Dunning Study
http://slidepdf.com/reader/full/dunning-study 31/40
Sources: Toronto Real Estate Board, Building Industry and Land Development Association, Canada Mortgage andHousing Corporation. All forecasts and analysis by Will Dunning Inc.
Table 8:Summary of Scenarios for Housing Activity Within the Greater Toronto Area
ResalesHousing StartsNew Home Sales
Low-Rise High-Rise Total Low-RiseOwnership
High-RiseOwnership Rental Total
Actual Activity
2007 95,223 21,847 23,210 44,697 25,476 9,615 1,139 36,230
2008 76,414 12,302 14,851 27,153 20,447 22,634 1,729 44,810
2009 89,273 18,369 15,627 33,996 13,762 11,044 2,302 27,108
2010 90,554 16,454 20,349 36,803 18,090 15,176 1,483 34,749
Averages for 2011-2013
Baseline Scenario 88,969 20,433 15,289 35,722 18,720 16,770 1,605 37,096
1st Scenario - HousePrices 5% Lower 89,766 21,750 16,110 37,860 20,041 17,393 1,605 39,040
2nd Scenario - HousePrices 10% Lower 90,321 23,697 17,059 40,757 22,048 18,123 1,605 41,776
3rd Scenario - HousePrices 15% Lower 90,640 26,638 18,172 44,810 25,059 18,983 1,605 45,647
4th Scenario - HousePrices 20% Lower 90,734 30,961 19,487 50,448 29,412 19,995 1,605 51,013
5th Scenario - HousePrices 5% Higher 87,929 19,422 14,561 33,983 17,790 16,233 1,605 35,628
6th Scenario - HousePrices 10% Higher 86,654 18,433 13,898 32,331 16,985 15,760 1,605 34,351
Difference Versus Baseline (in Units)
1st Scenario 797 1,317 821 2,138 1,321 623 0 1,944
2nd Scenario 1,353 3,264 1,770 5,035 3,327 1,353 0 4,681
3rd Scenario 1,671 6,205 2,884 9,088 6,338 2,213 0 8,552
4th Scenario 1,765 10,527 4,199 14,726 10,692 3,225 0 13,917
5th Scenario -1,039 -1,012 -727 -1,739 -931 -537 0 -1,468
6th Scenario -2,315 -2,001 -1,391 -3,391 -1,735 -1,009 0 -2,745
Difference Versus Baseline (in %)
1st Scenario 0.9% 6.4% 5.4% 6.0% 7.1% 3.7% 0.0% 5.2%2nd Scenario 1.5% 16.0% 11.6% 14.1% 17.8% 8.1% 0.0% 12.6%
3rd Scenario 1.9% 30.4% 18.9% 25.4% 33.9% 13.2% 0.0% 23.1%
4th Scenario 2.0% 51.5% 27.5% 41.2% 57.1% 19.2% 0.0% 37.5%
5th Scenario -1.2% -5.0% -4.8% -4.9% -5.0% -3.2% 0.0% -4.0%
6th Scenario -2.6% -9.8% -9.1% -9.5% -9.3% -6.0% 0.0% -7.4%
Consequences of Government-Imposed Costs March 2011 31
8/7/2019 Dunning Study
http://slidepdf.com/reader/full/dunning-study 32/40
6.0 Economic Consequences
Construction is a signi cant element o the Canadian economy. At present, about 7% o Canadian employment (over 1.2 million individuals) is in construction, and about 1 millionmore work in other industries, providing goods and services that are used in the constructionindustry. This section extends the simulations developed in the prior section, to estimate theimpacts o changing levels o housing starts on employment and on wages earned. Thoseestimates are then used to estimate impacts on ederal and provincial revenues rom personalincome tax, and premiums or Canada Pension Plan and Employment Insurance.
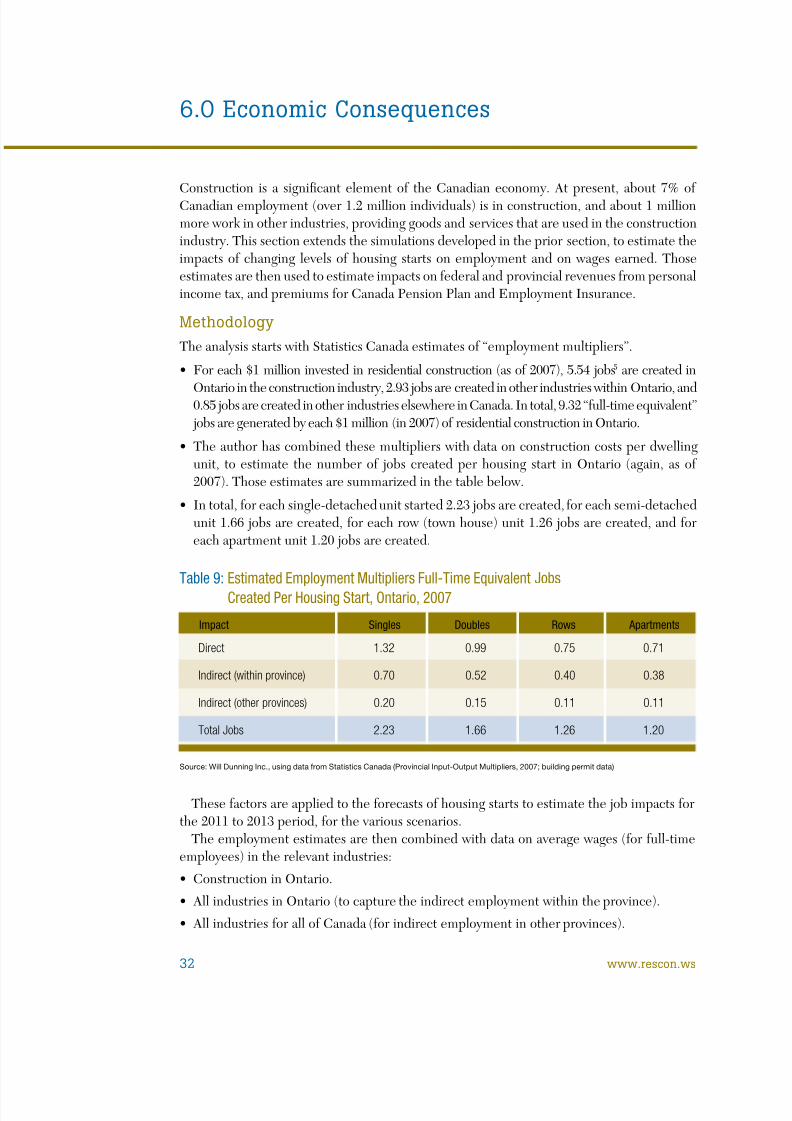
MethodologyThe analysis starts with Statistics Canada estimates o “employment multipliers”.
• For each $1 million invested in residential construction (as of 2007), 5.54 jobs5 are created in
Ontario in the construction industry, 2.93 jobs are created in other industries within Ontario, and0.85 jobs are created in other industries elsewhere in Canada. In total, 9.32 “ ull-time equivalent”jobs are generated by each $1 million (in 2007) of residential construction in Ontario.
• The author has combined these multipliers with data on construction costs per dwellingunit, to estimate the number of jobs created per housing start in Ontario (again, as of 2007). Those estimates are summarized in the table below.
• In total, for each single-detached unit started 2.23 jobs are created, for each semi-detachedunit 1.66 jobs are created, for each row (town house) unit 1.26 jobs are created, and foreach apartment unit 1.20 jobs are created.
Table 9:Estimated Employment Multipliers Full-Time Equivalent JobsCreated Per Housing Start, Ontario, 2007
Source: Will Dunning Inc., using data from Statistics Canada (Provincial Input-Output Multipliers, 2007; building permit data)
Impact Singles Doubles Rows Apartments
Direct 1.32 0.99 0.75 0.71
Indirect (within province) 0.70 0.52 0.40 0.38
Indirect (other provinces) 0.20 0.15 0.11 0.11
Total Jobs 2.23 1.66 1.26 1.20
These actors are applied to the orecasts o housing starts to estimate the job impacts orthe 2011 to 2013 period, or the various scenarios.
The employment estimates are then combined with data on average wages (for full-timeemployees) in the relevant industries:• Construction in Ontario.• All industries in Ontario (to capture the indirect employment within the province).• All industries for all of Canada (for indirect employment in other provinces).
32 www.rescon.ws
8/7/2019 Dunning Study
http://slidepdf.com/reader/full/dunning-study 33/40
Fiscal impacts are estimated based on ederal and provincial parameters or personalincome taxes, combined with estimated impacts on the level o employment and averagewage rates or ull-time employment. Similarly, ederal government receipts are estimated
or Canada Pension Plan and Employment Insurance premiums.
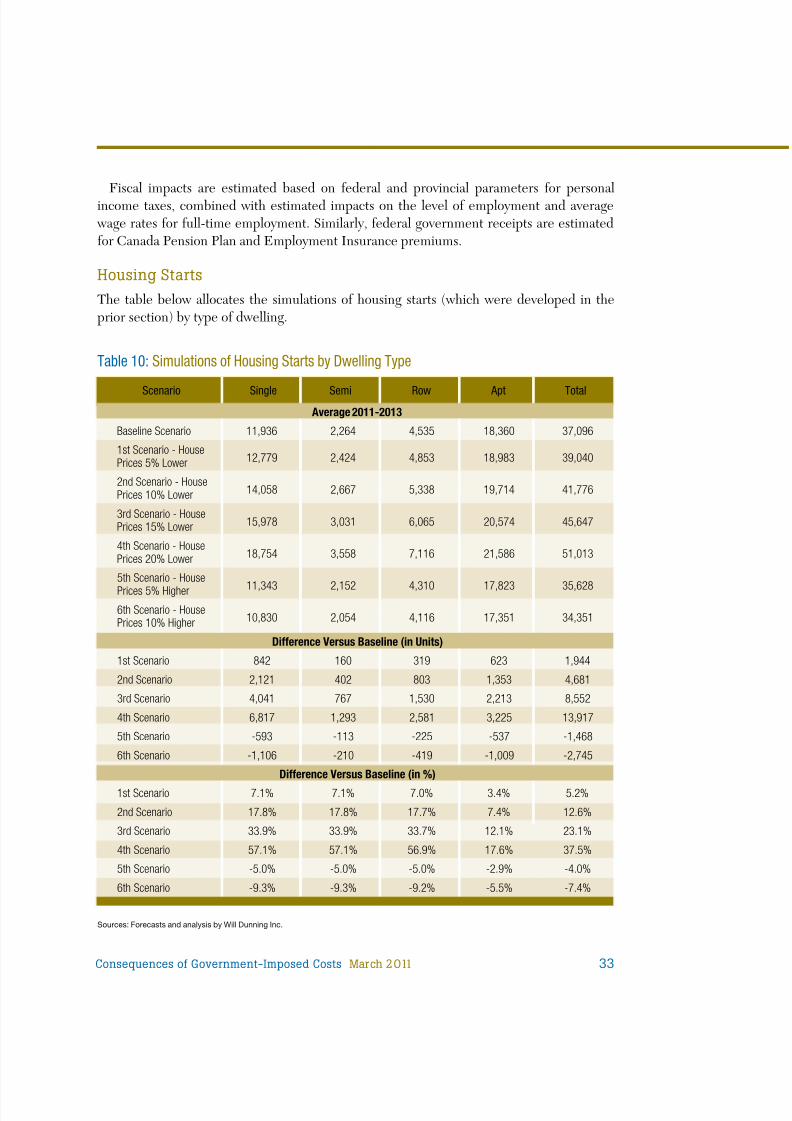
Housing StartsThe table below allocates the simulations of housing starts (which were developed in theprior section) by type o dwelling.
Sources: Forecasts and analysis by Will Dunning Inc.
Scenario Single Semi Row Apt Total
Table 10:Simulations of Housing Starts by Dwelling Type
Average 2011-2013
Baseline Scenario 11,936 2,264 4,535 18,360 37,096
1st Scenario - HousePrices 5% Lower 12,779 2,424 4,853 18,983 39,040
2nd Scenario - HousePrices 10% Lower 14,058 2,667 5,338 19,714 41,776
3rd Scenario - HousePrices 15% Lower 15,978 3,031 6,065 20,574 45,647
4th Scenario - HousePrices 20% Lower 18,754 3,558 7,116 21,586 51,013
5th Scenario - HousePrices 5% Higher 11,343 2,152 4,310 17,823 35,6286th Scenario - HousePrices 10% Higher 10,830 2,054 4,116 17,351 34,351
Difference Versus Baseline (in Units)
1st Scenario 842 160 319 623 1,944
2nd Scenario 2,121 402 803 1,353 4,681
3rd Scenario 4,041 767 1,530 2,213 8,552
4th Scenario 6,817 1,293 2,581 3,225 13,917
5th Scenario -593 -113 -225 -537 -1,468
6th Scenario -1,106 -210 -419 -1,009 -2,745
Difference Versus Baseline (in %)
1st Scenario 7.1% 7.1% 7.0% 3.4% 5.2%
2nd Scenario 17.8% 17.8% 17.7% 7.4% 12.6%
3rd Scenario 33.9% 33.9% 33.7% 12.1% 23.1%
4th Scenario 57.1% 57.1% 56.9% 17.6% 37.5%
5th Scenario -5.0% -5.0% -5.0% -2.9% -4.0%
6th Scenario -9.3% -9.3% -9.2% -5.5% -7.4%
Consequences of Government-Imposed Costs March 2011 33
8/7/2019 Dunning Study
http://slidepdf.com/reader/full/dunning-study 34/40
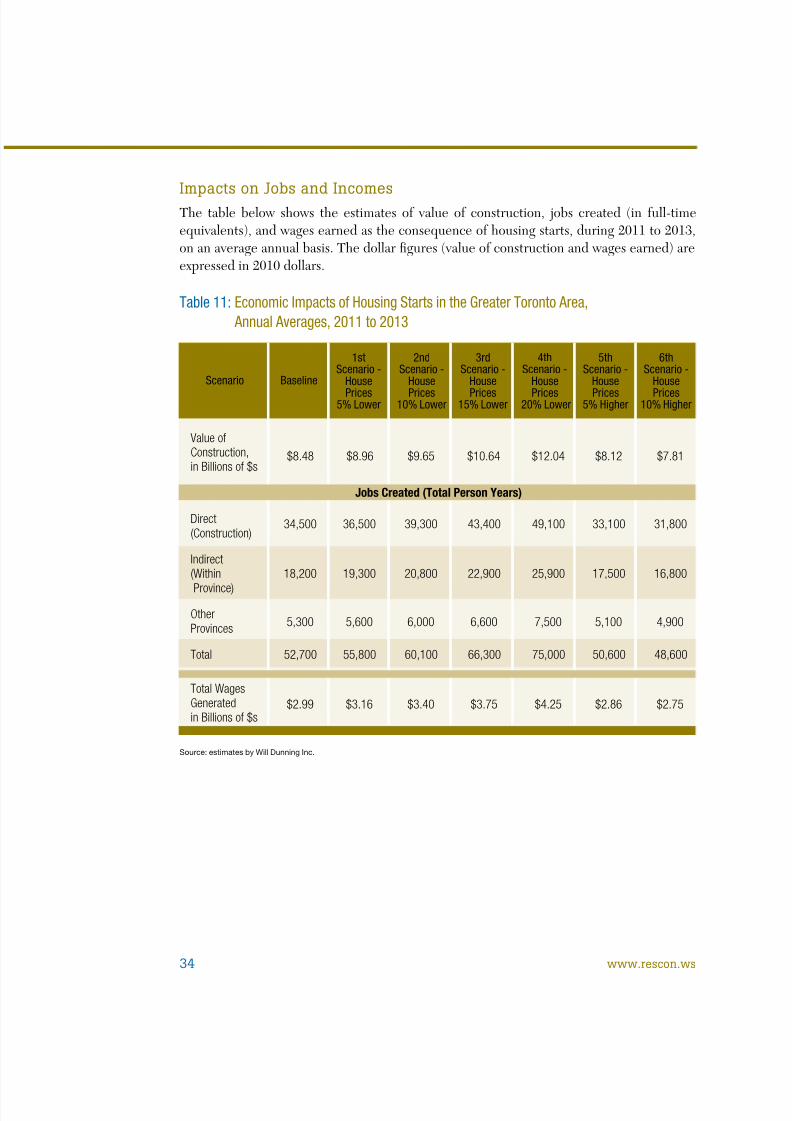
Impacts on Jobs and IncomesThe table below shows the estimates of value of construction, jobs created (in full-timeequivalents), and wages earned as the consequence o housing starts, during 2011 to 2013,on an average annual basis. The dollar gures (value of construction and wages earned) areexpressed in 2010 dollars.
Source: estimates by Will Dunning Inc.
Table 11:Economic Impacts of Housing Starts in the Greater Toronto Area,Annual Averages, 2011 to 2013
1stScenario -
HousePrices
5% Lower
Scenario
2ndScenario -
HousePrices
10% Lower
3rdScenario -
HousePrices
15% Lower
4thScenario -
HousePrices
20% Lower
5thScenario -
HousePrices
5% Higher
6thScenario -
HousePrices
10% Higher
Baseline
Value ofConstruction,in Billions of $s
$8.48 $8.96 $9.65 $10.64 $12.04 $8.12 $7.81
Jobs Created (Total Person Years)
Direct(Construction)
34,500 36,500 39,300 43,400 49,100 33,100 31,800
Indirect(Within
Province)
18,200 19,300 20,800 22,900 25,900 17,500 16,800
OtherProvinces 5,300 5,600 6,000 6,600 7,500 5,100 4,900
Total 52,700 55,800 60,100 66,300 75,000 50,600 48,600
Total WagesGeneratedin Billions of $s
$2.99 $3.16 $3.40 $3.75 $4.25 $2.86 $2.75
34 www.rescon.ws

8/7/2019 Dunning Study
http://slidepdf.com/reader/full/dunning-study 35/40
Table 12 compares the scenarios, showing the deviations compared to the baseline. Theseestimates show the escalating impact o high house prices and are highly suggestive aboutthe positive economic impacts that can be achieved by rationalizing government-imposedcosts on housing.
Source: estimates by Will Dunning Inc.
Table 12:Economic Impacts of Housing Starts in the Greater Toronto Area,Annual Averages, 2011 to 2013 Differences Versus Baseline
1stScenario -
House
Prices5% Lower
Scenario
2ndScenario -
House
Prices10% Lower
3rdScenario -
House
Prices15% Lower
4thScenario -
House
Prices20% Lower
5thScenario -
House
Prices5% Higher
6thScenario -
House
Prices10% Higher
Value ofConstruction,in Millions of $s
$480 $1,170 $2,160 $3,560 -$360 -$670
Jobs Created (Total Person Years)
Direct(Construction)
2,000 4,800 8,900 14,600 -1,400 -2,700
Indirect(Within
Province)
1,100 2,600 4,700 7,700 -700 -1,400
OtherProvinces
300 700 1,300 2,200 -200 -400
Total 3,100 7,400 13,600 22,300 -2,100 -4,100
Total WagesGeneratedin Millions of $s
$170 $410 $760 $1,260 -$130 -$240
Consequences of Government-Imposed Costs March 2011 35
8/7/2019 Dunning Study
http://slidepdf.com/reader/full/dunning-study 36/40
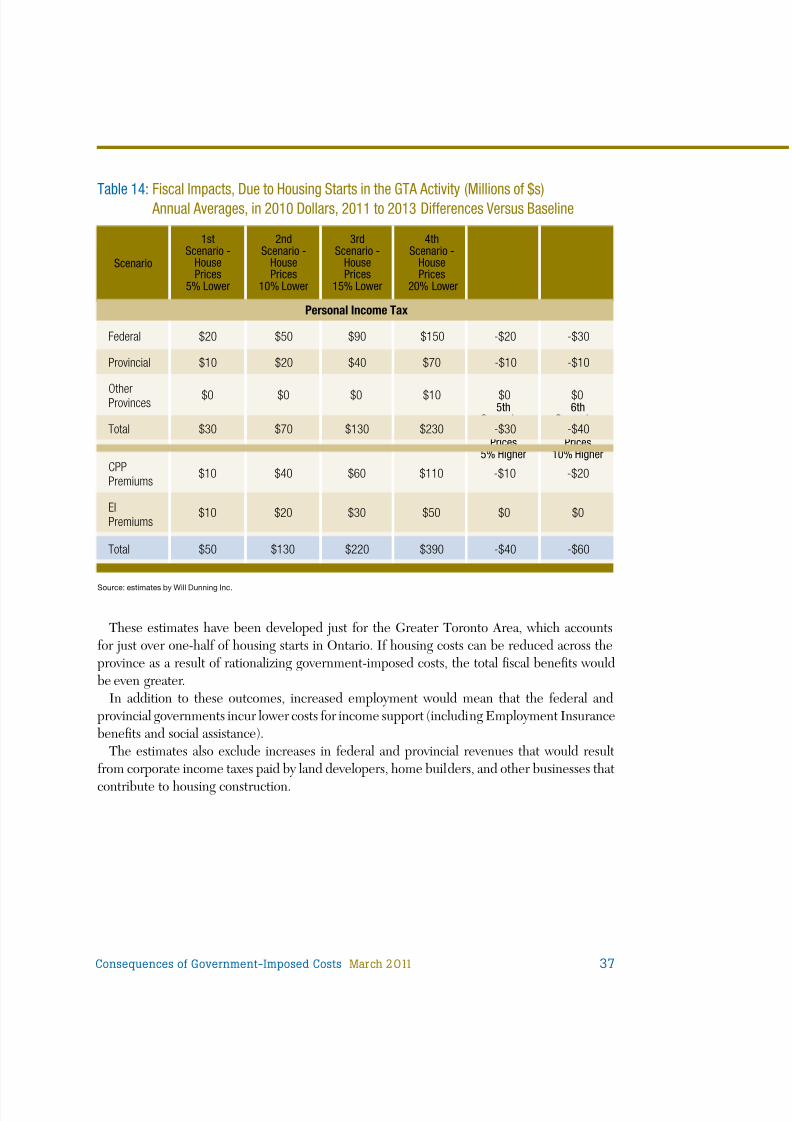
Table 14 on the next page shows the deviations compared to the baseline scenario. Asis illustrated, reducing housing prices (by reducing government-imposed costs) has thepotential to generate substantial increases in ederal and provincial tax revenues: i housingprices were 5% lower, revenues from these sources would be about $50 (5%) higher thanin the baseline. A 10% downward price adjustment would result in $130 million (14%) inadditional revenue; a 15% price adjustment would result in $220 million (24%), and a 20%price reduction would result in $390 million additional revenue (43%).
On the other hand, a 5% urther increase in costs would reduce the revenues by $40million (4%) and a 10% cost rise would reduce revenues by $60 million (7%).
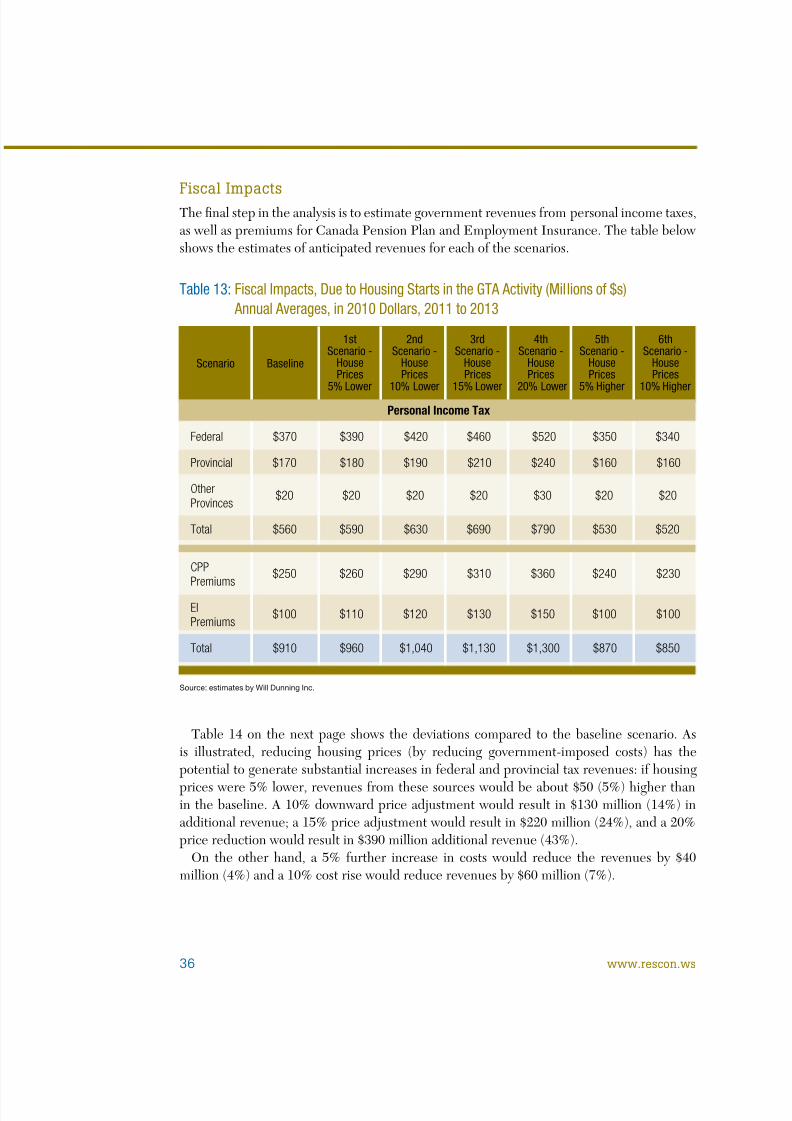
Fiscal ImpactsThe nal step in the analysis is to estimate government revenues rom personal income taxes,as well as premiums or Canada Pension Plan and Employment Insurance. The table belowshows the estimates o anticipated revenues or each o the scenarios.
Source: estimates by Will Dunning Inc.
Table 13:Fiscal Impacts, Due to Housing Starts in the GTA Activity (Millions of $s)Annual Averages, in 2010 Dollars, 2011 to 2013
1stScenario -
HousePrices
5% Lower
Scenario
2ndScenario -
HousePrices
10% Lower
3rdScenario -
HousePrices
15% Lower
4thScenario -
HousePrices
20% Lower
5thScenario -
HousePrices
5% Higher
6thScenario -
HousePrices
10% Higher
Baseline
Personal Income Tax
Federal $370 $390 $420 $460 $520 $350 $340
Provincial $170 $180 $190 $210 $240 $160 $160
OtherProvinces
$20 $20 $20 $20 $30 $20 $20
Total $560 $590 $630 $690 $790 $530 $520
CPPPremiums
$250 $260 $290 $310 $360 $240 $230
EIPremiums
$100 $110 $120 $130 $150 $100 $100
Total $910 $960 $1,040 $1,130 $1,300 $870 $850
36 www.rescon.ws
8/7/2019 Dunning Study
http://slidepdf.com/reader/full/dunning-study 37/40
8/7/2019 Dunning Study
http://slidepdf.com/reader/full/dunning-study 38/40
Endnotes
1 Source: Statistics Canada, Provincial and Territorial Economic Accounts: Table 2, Grossdomestic product, expenditure-based, Ontario, catalogue number 13-018-X; analysis by Will Dunning Inc.
2 “Government-Imposed Charges on New Housing in Canada”, by Ray Tomalty and AndrejsSkaburskis, published January 2009. The relatively long lag time between the e ective dateo the research and its publication would appear to testi y to the di culty o compiling thisvery detailed (and widely distributed) information.
3 “Examination into Government Imposed Charges on New Construction”. Completed by IBI Group, 2010.
4 The calculations use data rom Canada Mortgage and Housing Corporation on averageprices for single-detached houses that were absorbed (occupied after the completion
o construction) during the respective years and there ore the estimates here or 2006will di er rom those in the Tomalty/Skarburskis report. This methodology allows or aconsistent calculation o changes during 2006 to 2010.
5 The gures are expressed as “ ull-time equivalent” jobs. Since some o the work will bepart-time, the actual number o individuals employed will be greater. This conversion to
ull-time equivalent jobs permits us to more accurately estimate the resulting incomes and,in the subsequent section, the taxes generated.
Consequences of Government-Imposed Costs March 201138 www.rescon.ws

8/7/2019 Dunning Study
http://slidepdf.com/reader/full/dunning-study 39/40
Design by Actual Media

8/7/2019 Dunning Study
http://slidepdf.com/reader/full/dunning-study 40/40
www.rescon.ws