Embed Size (px)
Citation preview
Full Terms & Conditions of access and use can be found athttp://www.tandfonline.com/action/journalInformation?journalCode=ucme20
Download by: [ JH Libraries] Date: 03 August 2016, At: 10:10
International Journal for Computational Methods inEngineering Science and Mechanics
ISSN: 1550-2287 (Print) 1550-2295 (Online) Journal homepage: http://www.tandfonline.com/loi/ucme20
Multi-Scale Characterization and Modeling ofDuctile Failure in Cast Aluminum Alloys
S. Ghosh , V. Dakshinamurthy , C. Hu & J. Bai
To cite this article: S. Ghosh , V. Dakshinamurthy , C. Hu & J. Bai (2008) Multi-ScaleCharacterization and Modeling of Ductile Failure in Cast Aluminum Alloys, InternationalJournal for Computational Methods in Engineering Science and Mechanics, 9:1, 25-42, DOI:10.1080/15502280701752635
To link to this article: http://dx.doi.org/10.1080/15502280701752635
Published online: 27 Dec 2007.
Submit your article to this journal
Article views: 73
View related articles
Citing articles: 4 View citing articles

International Journal for Computational Methods in Engineering Science and Mechanics, 9:25–42, 2008Copyright c© Taylor & Francis Group, LLCISSN: 1550–2287 print / 1550–2295 onlineDOI: 10.1080/15502280701752635
Multi-Scale Characterization and Modeling of DuctileFailure in Cast Aluminum Alloys
S. Ghosh, V. Dakshinamurthy, C. Hu, and J. BaiDepartment of Mechanical Engineering, Ohio State University, Columbus, OH, USA
This paper develops three components contributing to theframework of multi-scale modeling of ductile fracture in aluminumalloys. The first module is morphology-based domain partitioning,which delineates regions of statistical inhomogeneity. The secondmodule is micromechanical analysis with particle fragmentationand matrix cracking. A locally enriched VCFEM or LE-VCFEM isdeveloped to incorporate ductile failure through matrix cracking inthe form of void growth and coalescence using a non-local Gurson-Tvergaard-Needleman model. The third module develops a homog-enized anisotropic plasticity-damage model for macroscopic anal-ysis. Parameters in this GTN model are calibrated from resultsof homogenization of microstructural variables of microstructuralRVE.
Keywords Multiscale Domain Partitioning, Voronoi Cell FEM,Ductile Failure, Anisotropic GTN Model, Multi-ScaleModeling
1. INTRODUCTIONMany metals and alloys consist of heterogeneities in their
microstructure. For example, cast aluminum alloys such as A319 used in automotive systems contain microstructural het-erogeneities in the form of silicon particulates, intermetallics,precipitates and voids. The processing routes affect morpho-logical variations such as irregularities in spatial dispersionincluding clustering and alignment, or irregularities in phaseshapes and sizes. Experimental studies on ductile failure in [1–4]have shown that these morphological variations strongly affect
This work has been supported by the National Science FoundationNSF Div Civil and Mechanical Systems Division through the GOALIgrant No. CMS-0308666 (Program director: C. Cooper) and by theDepartment of Energy Aluminum Visions program through grant No.A5997 (sub contract from Univ. of Illinois). This sponsorship is grate-fully acknowledged. Computer support by the Ohio SupercomputerCenter through grant PAS813-2 is also gratefully acknowledged.
Address correspondence to S. Ghosh, Department of Mechani-cal Engineering, Ohio State University, Room W496, Scott Labora-tory, 201 West 19th Avenue, Columbus, OH 43210, USA. E-mail:[email protected]
microstructural damage nucleation due to particulate crackingand interfacial decohesion, as well as ductile damage growth bymatrix rupture due to void growth and coalescence. Argon [5] hasshown that particles in clustered regions have a greater propen-sity towards cracking than those in regions of dilute concentra-tion, since local stresses increase rapidly with reduced distancebetween neighboring particles. Experimental work in Cacereset al. [6, 7] has demonstrated that larger and longer particles aremore prone to cracking and damage accumulation increases withhigher dendrite arm spacing. Consequently, rigorous fundamen-tal studies reflecting the actual microstructural morphologies arerequired for understanding deformation and failure mechanisms.Modeling these alloys for failure properties like strain to fail-ure, ductility and fracture toughness requires special attention onthe microstructural morphology. Various computational modelshave been proposed for analysis of the mechanical propertiesand response of multi-phase materials using simplified repre-sentations of the microstructural morphology as unit cell mod-els in [8–10]. The predictive capabilities of these models forfailure properties in nonuniform microstructures are very lim-ited due to simplification of the critical local features that arecritical to failure. A few studies have focused on modeling morerealistic representation of microstructures with non-uniform dis-persion of heterogeneities [11, 12] by combining digital imageprocessing with microstructure modeling. The microstructure-based Voronoi cell finite element model or VCFEM [11–15] hasbeen shown to offer significant promise in accurate analysis oflarge microstructural regions with high efficiency.
Modeling these materials requires consideration of large do-mains with special attention on the microstructural morphol-ogy. The concept of multi-scale modeling provides the necessaryframework for selective micro-analysis in a very limited regionof a macroscopic computational domain as done by Ghosh et al.in [16, 17]. The multiscale models undergo domain partitioningbased on the evolution of stresses, strains and/or damage in themicrostructure. An optimal domain partitioning can significantlyenhance the efficiency of multi-scale computational models bykeeping the “zoomed-in” regions of intense micromechanicalanalysis to a minimum. This paper discusses three important
25
Dow
nloa
ded
by [
JH L
ibra
ries
] at
10:
10 0
3 A
ugus
t 201
6
26 S. GHOSH ET AL.
ingredients of multi-scale modeling of ductile failure in hetero-geneous cast aluminum alloys. These include: (i) a multi-scalecharacterization based preprocessor for multi-scale models; (ii)microstructural analysis module for ductile fracture; and (iii)a homogenization based continuum damage mechanics modelfor ductile materials that can be used in macroscopic analysismodules.
The local morphology in many non-uniform heterogeneousmaterials may warrant embedding pockets of microstructural re-gions in an otherwise homogenized domain, even prior to start-ing the analysis. In a concurrent multi-scale model, it is there-fore prudent to partition the initial computational domain basedon information of the underlying microstructure, prior to me-chanical analysis. The morphology-based domain partitioning(MDP), as a preprocessor to multiscale modeling, is intended fortwo reasons: (1) to determine microstructural representative vol-ume elements or RVE’s that can be used in the “bottom-up” ho-mogenization for different regions in the computational domain;and (2) to identify those regions where the morphology alone(e.g. regions of dense clustering) can cause a breakdown in thehomogenization assumption. Embedded regions requiring mi-crostructural analysis should then be coupled with complemen-tary regions of homogenized macroscopic analysis. The MDPprocess developed in [18, 19] is discussed in detail in section 2.
At the microstructural scale, the complex interaction be-tween competing damage modes in the presence of nonuni-formities makes the task of failure analysis rather challenging.Various computational studies have been conducted for under-standing the elastic-plastic deformation and damage behavior ofdiscretely reinforced MMC’s and other material. Ghosal et al.[20] have studied the fracture initiation around the notch tip,while Steglich et al. [21] have studied the mechanism of voidnucleation by debonding or particle cracking. In a comprehen-sive account of simulation methods for deformation and dam-age in particle reinforced composites, Llorca [22] has presentedinvestigations on the influence of particle distribution on me-chanical properties and ductile failure using multi-particle unitcells. A number of these studies focus on the initial stages ofductile failure and do not consider the effect of microstructuralmorphology on the evolution of ductile failure by void growthin the matrix and coalescence. In addition, there is a paucityof studies on failure modeling in the presence of multiple re-inforcements of different shapes, sizes, orientation and spatialdistribution. Ghosh et al. have developed the Voronoi cell finiteelement model (VCFEM) to simulate particle cracking induceddamage [12, 14] and interfacial debonding [11, 15] in particleand fiber reinforced composites with complex non-uniform mi-crostructural morphology. In the present work, the microstruc-tural VCFEM with particle fragmentation is extended to incor-porate ductile failure through matrix cracking in the form of voidgrowth and coalescence. Interfacial debonding is not explicitlymodeled in this work. However, this occurs by void evolutionalong the interface between matrix and particle. A non-localGurson-Tvergaard-Needleman (GTN) model [23–25] is imple-
mented in a locally enriched VCFEM framework or LE-VCFEMfor simulating ductile fracture. In LE-VCFEM, the VCFEMformulation is enriched adaptively in narrow bands of local-ized plastic flow and void growth. In these localized regions,assumed stress hybrid VCFEM formulation is overlaid with anarrow band of displacement based elements to accommodatestrain softening.
In the final segment of this paper, an anisotropic contin-uum damage model for pressure dependent plastic materials isdeveloped for macroscopic analysis in a multi-scale materialmodeling framework. Damage evolution in ductile materials isinherently a multiple-scale phenomenon where damage initi-ates at one scale and grows into another. Effective simulatorsshould connect events at different length scales with delineationof morphological details at each scale. It is convenient to usemacroscopic constitutive laws obtained by the homogenizationof variables obtained from micromechanics simulations. One ofthe earliest models of anisotropic ductile failure was proposedby Rice [26]. Various continuum constitutive models have beendeveloped based on unit cell analyses of composite and porousmicrostructures. A number of these models are developed basedon the GTN model. Chien et al. [27] have investigated the in-fluence of normal anisotropy of matrix material on the plasticbehavior of porous ductile material. Benzerga et al. [28–30]have conducted limit analyses of RVE and incorporated micro-scopic plastic anisotropy and void shape effect into constitutiveequation of porous ductile metal. Most of these models do notconsider the complexity of real microstructures and damage in-teraction. In this paper, an anisotropic GTN type constitutivemodel is developed for macroscopic damage analysis in parti-cle reinforced aluminum with non-uniform microstructure. Themodel is based on homogenization of microstructural variablesobtained by LE-VCFEM analysis of microstructural represen-tative volume element (RVE) containing particles, matrix andvoids. The three modules are detailed in the next sections.
2. MORPHOLOGY BASED DOMAIN PARTITIONINGA necessary requirement of the morphology-based domain
partitioning (MDP) process developed in [18, 19] is that ac-curate information of the microstructural morphology, at leastwith respect to certain characterization functions, be availableat all points of the computational domain. This can be a verychallenging and time-consuming task if the entire image hasto be acquired by optical or scanning electron microscopy. Afew methods have been suggested in the literature for dealingwith this problem. A method of preparing a montage of a largenumber of high magnification microstructural images (nearly400–500) followed by image compression has been proposedby Gokhale et al. [31, 32]. Their M-SLIP method is effectivefor small domains where few images are necessary and the mi-crostructural information obtained has been shown to be suffi-cient for evaluating point statistics in [33]. However, this processof extracting microstructural images at each individual point
Dow
nloa
ded
by [
JH L
ibra
ries
] at
10:
10 0
3 A
ugus
t 201
6

MULTI-SCALE CHARACTERIZATION AND MODELING OF DUCTILE FAILURE IN CAST ALUMINUM ALLOYS 27
may be prohibitively exhaustive for large domains. Alternatestatistical methods in the literature include simulated annealing[34, 35], random sequential packing algorithm [35], and Monte-Carlo technique in [36]. All these methods have shortcomingswith respect to convergence to the actual image. The MDP pro-cess proposed in this study consists of three steps, executed insequence. They are: (a) simulation of necessary high-resolutionmicrostructural information at all points of a computational do-main from continuous low resolution images of the entire do-main and few sample high resolution images; (b) quantitativecharacterization of the microstructure to create effective metricsthat can relate microstructural features to critical material be-havior of the heterogeneous materials; (c) domain partitioningbased on functions of microstructural descriptors. The MDPprocess delineates regions corresponding to different lengthscales.
2.1. Microstructure ReconstructionA prerequisite for creating the morphology-based domain
partitioning of the computational domain as a pre-processorfor multiscale modeling is information of high-resolution mi-crostructure at all points of the domain. Since it is almost im-possible to experimentally obtain contiguous high resolutionmicroscopic images at all points, it is desirable to simulate thelocal microstructure from micrographs extracted at a few se-lected locations in the domain. A typical low resolution imageof a cast aluminum alloy A319 is shown in Figure 1. The lowresolution micrograph does not provide adequate informationrequired for microstructural characterization and modeling. Themicrostructure reconstruction process generates correspondinghigh resolution images with clear delineation of the multi-phasemorphology.
FIG. 1. Low magnification, low resolution digital image of cast aluminumalloy A319, for which high resolution micrograph of a window C is desirablewith available high resolution micrographs at other locations A and B.
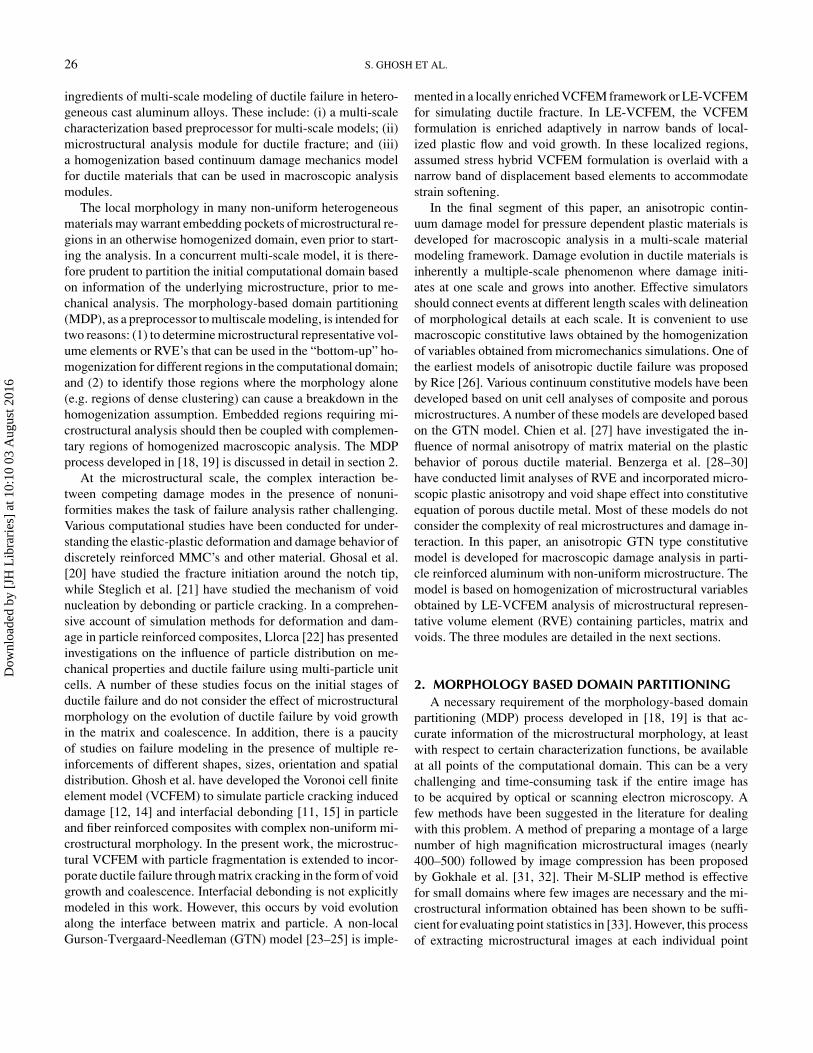
The digital micrograph of Figure 1 can be resolved into agrid of pixels, with each pixel belonging to a certain level inthe grayscale (white-black) hierarchy. For a region �mic in themicrograph, the grayscale level of each pixel at (x, y) is rep-resented by an integer valued indicator function Ig(x,y), whichcan assume any integer value between 0 and 255 at each pointof the micrograph. A magnified image of a small region ofthis micrograph is shown in Figure 2(a). In this paper, mag-nification refers to the pixel size and hence a magnified im-age will have larger size of pixels with the same number ofgrayscale pixels as the original image. Resolution, on the otherhand, corresponds to the number of pixels or pixel densityin an image. The high resolution microstructure reconstruc-tion incorporates a wavelet based interpolation of low resolu-tion images followed by a gradient based enhancement method(WIGE).
2.1.1. Wavelet Based Interpolation in WIGE TechniqueIn the WIGE image reconstruction technique, the integer in-
dicator function I g(x,y) is first interpolated in real space usinga basis of wavelet functions. Let a window �lrsm
w of the lowresolution image encompass a p × q pixel grid. For a higher res-olution image �hrsm
w , the same window may contain a p′ × q′
pixel grid, where p′ > p and q′ > q. The grayscale level of eachpixel in the p × q pixel grid corresponds to the value of the indi-cator function I g(x,y) at its centroid, which is thus representedby known discrete values at a set of equi-spaced points in the lowresolution image window. This is shown in Figure 2(b). Waveletbased interpolation is used for estimating the indicator functionsI gwvlt (x,y) in the high resolution pixel grid. Gaussian functions
with continuous derivatives are popular wavelets bases [37, 38]and can effectively represent sharp variations in image features.In encoding a p × q pixel sub-region of a low resolution image,the indicator function may be expressed in terms of a level (m,k)Gaussian wavelet function as
I g′wvlt (x, y) =
∑1≤n≤p
∑1≤l≤q
�m,n,k,l
=∑
1≤n≤p
∑1≤l≤q
e−12 ( x−bn
am)2
e−12 ( y−dl
ck)2
βm,n,k,l (1)
Here (m,k) refer to the wavelet level in a multi-resolution waveletrepresentation and (n,l) correspond to the discrete translation ofthe bases in x and y directions, respectively. The parameters bn ,dl correspond to translation, while am , ck are dilation parameters.This yields a continuous interpolated image representation interms of indicator function values of the low resolution image.The bases are constructed by translation from one pixel to thenext in the p × q pixel sub-region and the region is encodedwith p × q Gaussian functions. The wavelet coefficients βm,n,k,l
can be obtained by solving the matrix equation {I g} = [F]{B}where {Ig}, [F] and {B} are matrices of order pq × 1, pq × pqand pq × 1, respectively. The matrix {Ig} contains the valuesof the indicator functions from the available p × q pixel data.
Dow
nloa
ded
by [
JH L
ibra
ries
] at
10:
10 0
3 A
ugus
t 201
6
28 S. GHOSH ET AL.
FIG. 2. High magnification 35µm × 35µm images of a region near C, shown in Figure 1: (a) zoomed-in image showing larger pixels but with original resolution;(b) pixels of the square region marked in (a); (c) a higher resolution micrograph of (a) obtained by interpolation.
The matrix [F] contains the terms of Gaussian wavelet function,while the matrix {B} contains the unknown wavelet coefficients.Numerical studies conducted have indicated that the values forwhich the system is stable are around p = 6,q = 6.
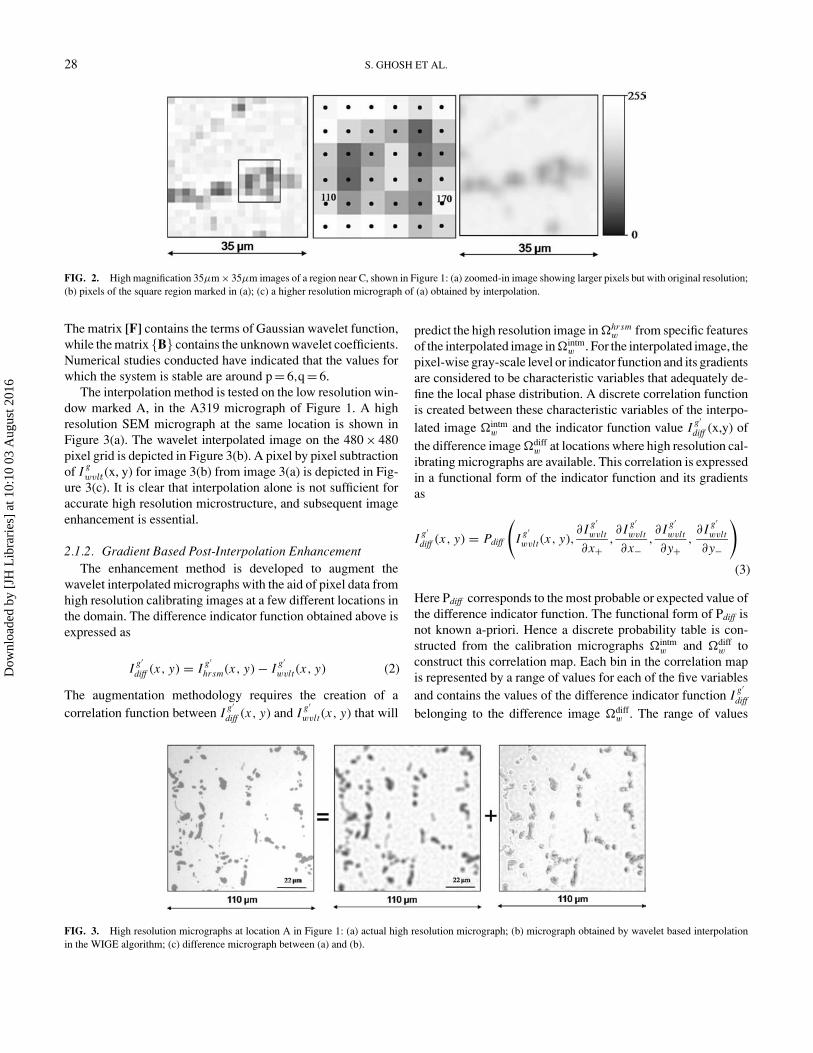
The interpolation method is tested on the low resolution win-dow marked A, in the A319 micrograph of Figure 1. A highresolution SEM micrograph at the same location is shown inFigure 3(a). The wavelet interpolated image on the 480 × 480pixel grid is depicted in Figure 3(b). A pixel by pixel subtractionof I g
wvlt (x, y) for image 3(b) from image 3(a) is depicted in Fig-ure 3(c). It is clear that interpolation alone is not sufficient foraccurate high resolution microstructure, and subsequent imageenhancement is essential.
2.1.2. Gradient Based Post-Interpolation EnhancementThe enhancement method is developed to augment the
wavelet interpolated micrographs with the aid of pixel data fromhigh resolution calibrating images at a few different locations inthe domain. The difference indicator function obtained above isexpressed as
I g′diff (x, y) = I g′
hrsm(x, y) − I g′wvlt (x, y) (2)
The augmentation methodology requires the creation of acorrelation function between I g′
diff (x, y) and I g′wvlt (x, y) that will
predict the high resolution image in �hrsmw from specific features
of the interpolated image in �intmw . For the interpolated image, the
pixel-wise gray-scale level or indicator function and its gradientsare considered to be characteristic variables that adequately de-fine the local phase distribution. A discrete correlation functionis created between these characteristic variables of the interpo-lated image �intm
w and the indicator function value I g′diff (x,y) of
the difference image �diffw at locations where high resolution cal-
ibrating micrographs are available. This correlation is expressedin a functional form of the indicator function and its gradientsas
I g′diff (x, y) = Pdiff
(I g′wvlt (x, y),
∂ I g′wvlt
∂x+,∂ I g′
wvlt
∂x−,∂ I g′
wvlt
∂y+,∂ I g′
wvlt
∂y−
)
(3)
Here Pdiff corresponds to the most probable or expected value ofthe difference indicator function. The functional form of Pdiff isnot known a-priori. Hence a discrete probability table is con-structed from the calibration micrographs �intm
w and �diffw to
construct this correlation map. Each bin in the correlation mapis represented by a range of values for each of the five variablesand contains the values of the difference indicator function I g′
diff
belonging to the difference image �diffw . The range of values
FIG. 3. High resolution micrographs at location A in Figure 1: (a) actual high resolution micrograph; (b) micrograph obtained by wavelet based interpolationin the WIGE algorithm; (c) difference micrograph between (a) and (b).
Dow
nloa
ded
by [
JH L
ibra
ries
] at
10:
10 0
3 A
ugus
t 201
6

MULTI-SCALE CHARACTERIZATION AND MODELING OF DUCTILE FAILURE IN CAST ALUMINUM ALLOYS 29
to be assigned to each bin depends on the nature of variationof the variables. For example, the range 0 ≤ I g′
wvlt ≤ 255 canbe divided into as high as 256 bins or as low as 2 to 3 bins.However, with increasing number of bins, the number of I g′
diffentries in each bin will decrease and many of the bins maybe empty for the calibration micrographs considered. Sparsityin the correlation bins renders the reliability of this probabil-ity table to be low. A moderate number of divisions (∼10–15)is numerically found to be sufficient, as corroborated by con-vergence studies discussed later. The range of divisions for thegradients is selected in such that they are able to distinguish be-tween regions that belong to the interior and exterior of a givenphase.
2.1.3. Accounting for the Location of the CalibratingMicrographs
For multi-phase microstructures, the location of high reso-lution calibrating micrographs in relation to the image beingsimulated is of considerable importance to the image augmenta-tion process. A major assumption made is that if the calibratingmicrographs contain the same constituent phases as the onesbeing simulated and if they are all produced by the same man-ufacturing process, the probability functions (P) of local mi-crostructural distributions will have a continuous variation fromone micrograph to the next. These probability-wise similar localdistributions are necessary for the calibration process to hold.For sharply contrasting micro-regions, calibrating micrographsshould be appropriately chosen from regions that represent theessential features of the one being simulated. The effect of theproximity between calibrating and simulated images can be ad-dressed by assigning distance-based weights to the expectedvalues in the probability table. Micrographs closer to the sim-ulated image will have a stronger influence than those that arefarther away. This dependence of a microstructure’s correlationmap on its spatial distance from each of the calibrating micro-graphs is represented by a “shape function” type interpolationrelation, commonly used in finite element analysis, representedfor two calibrating micrographs as
I g′diff (x, y) = Pdiff (x, y) =
(1 − ξ
2
)Pdiff (xA, yA)
+(
1 + ξ
2
)Pdiff (xB, yB) (4)
Here ξ = ( RA−RBRAB
) and RA and RB are the distances of a pixel inthe simulated image from the corresponding pixels in calibrat-ing micrographs A and B, respectively, and RAB is the distancebetween them. For microstructures containing a single predom-inant second-phase in the matrix, e.g. Si for cast aluminum al-loys, the different locations, e.g. A and B, may have statisticallyequivalent expected values of the probability. In this case, theeffect of multiple locations in equation 4 will be minimal.
2.1.4. Validation Test for WIGE AlgorithmThe effectiveness and convergence characteristics of the
WIGE algorithm are tested by comparing characteristic metricsof the simulated microstructure with those for a real micrographat the same location. The n-point statistics developed in [39]are effective metrics for multi-phase microstructure characteri-zation and are used as validation tools. Specifically, the 1-point,2-point and 3-point statistics are used for this validation. Forthe low resolution microstructural region of Figure 1, windowsat locations A and B are the high resolution calibration micro-graphs. The WIGE algorithm is used to simulate the image at awindow C, for which a high resolution SEM micrograph is avail-able for validation. The 1-point probability function correspondsto the area fraction of the second phase particles. Its variationis plotted in Figure 4(a) as a function of increasing number ofdivisions in the range of I g′
wvlt , or bins in the probability table.The value at 0 bins corresponds to the micrograph with no en-hancement. The simulated area fraction converges to the SEMimage area fraction with about 10 discrete divisions or bins. The
FIG. 4. Convergence plots for n-point statistics: (a) 1-point probability func-tion; (b) error in 2-point and 3-point probability functions.
Dow
nloa
ded
by [
JH L
ibra
ries
] at
10:
10 0
3 A
ugus
t 201
6
30 S. GHOSH ET AL.
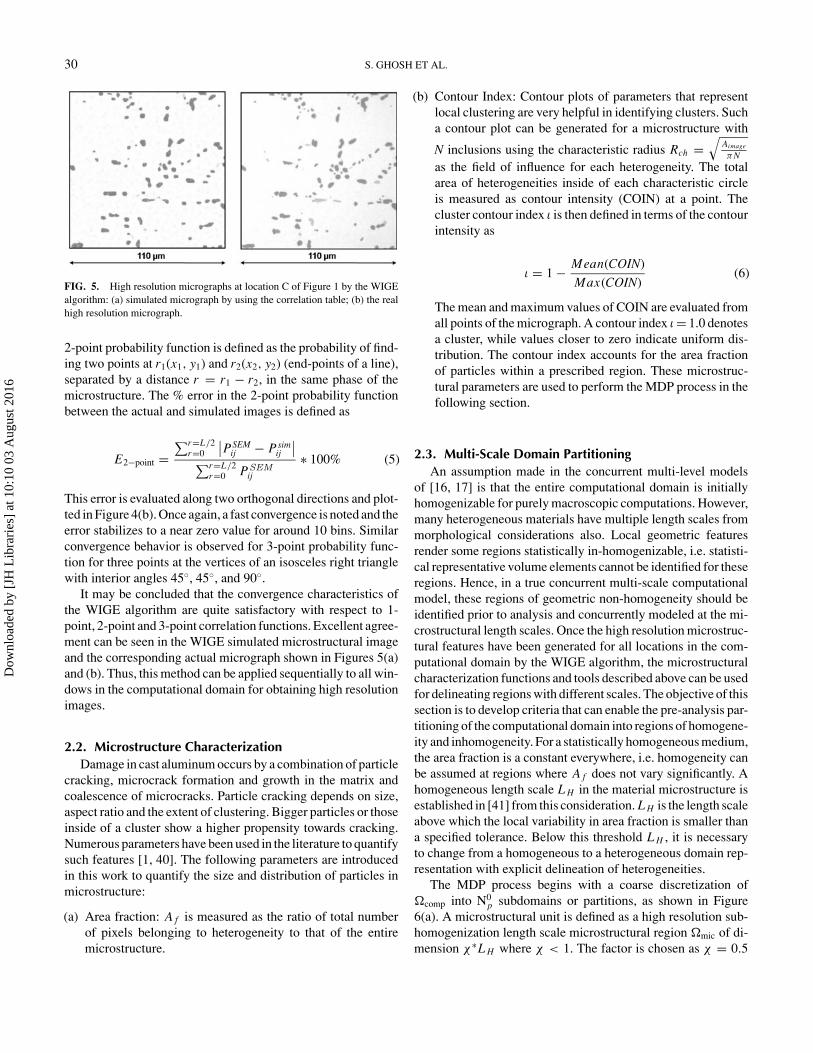
FIG. 5. High resolution micrographs at location C of Figure 1 by the WIGEalgorithm: (a) simulated micrograph by using the correlation table; (b) the realhigh resolution micrograph.
2-point probability function is defined as the probability of find-ing two points at r1(x1, y1) and r2(x2, y2) (end-points of a line),separated by a distance r = r1 − r2, in the same phase of themicrostructure. The % error in the 2-point probability functionbetween the actual and simulated images is defined as
E2−point =∑r=L/2
r=0
∣∣PSEMij − Psim
ij
∣∣∑r=L/2r=0 PSEM
ij
∗ 100% (5)
This error is evaluated along two orthogonal directions and plot-ted in Figure 4(b). Once again, a fast convergence is noted and theerror stabilizes to a near zero value for around 10 bins. Similarconvergence behavior is observed for 3-point probability func-tion for three points at the vertices of an isosceles right trianglewith interior angles 45◦, 45◦, and 90◦.
It may be concluded that the convergence characteristics ofthe WIGE algorithm are quite satisfactory with respect to 1-point, 2-point and 3-point correlation functions. Excellent agree-ment can be seen in the WIGE simulated microstructural imageand the corresponding actual micrograph shown in Figures 5(a)and (b). Thus, this method can be applied sequentially to all win-dows in the computational domain for obtaining high resolutionimages.
2.2. Microstructure CharacterizationDamage in cast aluminum occurs by a combination of particle
cracking, microcrack formation and growth in the matrix andcoalescence of microcracks. Particle cracking depends on size,aspect ratio and the extent of clustering. Bigger particles or thoseinside of a cluster show a higher propensity towards cracking.Numerous parameters have been used in the literature to quantifysuch features [1, 40]. The following parameters are introducedin this work to quantify the size and distribution of particles inmicrostructure:
(a) Area fraction: A f is measured as the ratio of total numberof pixels belonging to heterogeneity to that of the entiremicrostructure.
(b) Contour Index: Contour plots of parameters that representlocal clustering are very helpful in identifying clusters. Sucha contour plot can be generated for a microstructure with
N inclusions using the characteristic radius Rch =√
Aimage
π Nas the field of influence for each heterogeneity. The totalarea of heterogeneities inside of each characteristic circleis measured as contour intensity (COIN) at a point. Thecluster contour index ι is then defined in terms of the contourintensity as
ι = 1 − Mean(COIN)
Max(COIN)(6)
The mean and maximum values of COIN are evaluated fromall points of the micrograph. A contour index ι = 1.0 denotesa cluster, while values closer to zero indicate uniform dis-tribution. The contour index accounts for the area fractionof particles within a prescribed region. These microstruc-tural parameters are used to perform the MDP process in thefollowing section.
2.3. Multi-Scale Domain PartitioningAn assumption made in the concurrent multi-level models
of [16, 17] is that the entire computational domain is initiallyhomogenizable for purely macroscopic computations. However,many heterogeneous materials have multiple length scales frommorphological considerations also. Local geometric featuresrender some regions statistically in-homogenizable, i.e. statisti-cal representative volume elements cannot be identified for theseregions. Hence, in a true concurrent multi-scale computationalmodel, these regions of geometric non-homogeneity should beidentified prior to analysis and concurrently modeled at the mi-crostructural length scales. Once the high resolution microstruc-tural features have been generated for all locations in the com-putational domain by the WIGE algorithm, the microstructuralcharacterization functions and tools described above can be usedfor delineating regions with different scales. The objective of thissection is to develop criteria that can enable the pre-analysis par-titioning of the computational domain into regions of homogene-ity and inhomogeneity. For a statistically homogeneous medium,the area fraction is a constant everywhere, i.e. homogeneity canbe assumed at regions where A f does not vary significantly. Ahomogeneous length scale L H in the material microstructure isestablished in [41] from this consideration. L H is the length scaleabove which the local variability in area fraction is smaller thana specified tolerance. Below this threshold L H , it is necessaryto change from a homogeneous to a heterogeneous domain rep-resentation with explicit delineation of heterogeneities.
The MDP process begins with a coarse discretization of�comp into N0
p subdomains or partitions, as shown in Figure6(a). A microstructural unit is defined as a high resolution sub-homogenization length scale microstructural region �mic of di-mension χ∗L H where χ < 1. The factor is chosen as χ = 0.5
Dow
nloa
ded
by [
JH L
ibra
ries
] at
10:
10 0
3 A
ugus
t 201
6
MULTI-SCALE CHARACTERIZATION AND MODELING OF DUCTILE FAILURE IN CAST ALUMINUM ALLOYS 31
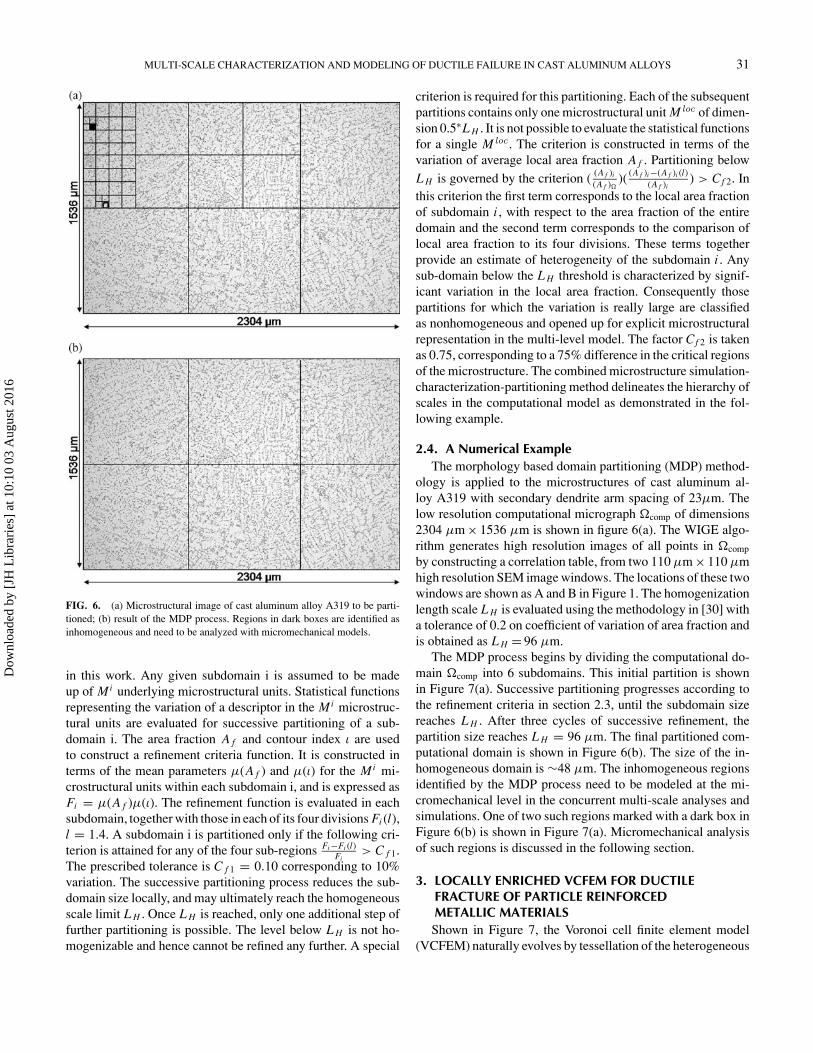
FIG. 6. (a) Microstructural image of cast aluminum alloy A319 to be parti-tioned; (b) result of the MDP process. Regions in dark boxes are identified asinhomogeneous and need to be analyzed with micromechanical models.
in this work. Any given subdomain i is assumed to be madeup of Mi underlying microstructural units. Statistical functionsrepresenting the variation of a descriptor in the Mi microstruc-tural units are evaluated for successive partitioning of a sub-domain i. The area fraction A f and contour index ι are usedto construct a refinement criteria function. It is constructed interms of the mean parameters µ(A f ) and µ(ι) for the Mi mi-crostructural units within each subdomain i, and is expressed asFi = µ(A f )µ(ι). The refinement function is evaluated in eachsubdomain, together with those in each of its four divisions Fi (l),l = 1.4. A subdomain i is partitioned only if the following cri-terion is attained for any of the four sub-regions Fi −Fi (l)
Fi> C f 1.
The prescribed tolerance is C f 1 = 0.10 corresponding to 10%variation. The successive partitioning process reduces the sub-domain size locally, and may ultimately reach the homogeneousscale limit L H . Once L H is reached, only one additional step offurther partitioning is possible. The level below L H is not ho-mogenizable and hence cannot be refined any further. A special
criterion is required for this partitioning. Each of the subsequentpartitions contains only one microstructural unit M loc of dimen-sion 0.5∗L H . It is not possible to evaluate the statistical functionsfor a single M loc . The criterion is constructed in terms of thevariation of average local area fraction A f . Partitioning belowL H is governed by the criterion ( (A f )i
(A f )�)( (A f )i −(A f )i (l)
(A f )i) > Cf 2. In
this criterion the first term corresponds to the local area fractionof subdomain i , with respect to the area fraction of the entiredomain and the second term corresponds to the comparison oflocal area fraction to its four divisions. These terms togetherprovide an estimate of heterogeneity of the subdomain i . Anysub-domain below the L H threshold is characterized by signif-icant variation in the local area fraction. Consequently thosepartitions for which the variation is really large are classifiedas nonhomogeneous and opened up for explicit microstructuralrepresentation in the multi-level model. The factor Cf 2 is takenas 0.75, corresponding to a 75% difference in the critical regionsof the microstructure. The combined microstructure simulation-characterization-partitioning method delineates the hierarchy ofscales in the computational model as demonstrated in the fol-lowing example.
2.4. A Numerical ExampleThe morphology based domain partitioning (MDP) method-
ology is applied to the microstructures of cast aluminum al-loy A319 with secondary dendrite arm spacing of 23µm. Thelow resolution computational micrograph �comp of dimensions2304 µm × 1536 µm is shown in figure 6(a). The WIGE algo-rithm generates high resolution images of all points in �comp
by constructing a correlation table, from two 110 µm × 110 µmhigh resolution SEM image windows. The locations of these twowindows are shown as A and B in Figure 1. The homogenizationlength scale L H is evaluated using the methodology in [30] witha tolerance of 0.2 on coefficient of variation of area fraction andis obtained as L H = 96 µm.
The MDP process begins by dividing the computational do-main �comp into 6 subdomains. This initial partition is shownin Figure 7(a). Successive partitioning progresses according tothe refinement criteria in section 2.3, until the subdomain sizereaches L H . After three cycles of successive refinement, thepartition size reaches L H = 96 µm. The final partitioned com-putational domain is shown in Figure 6(b). The size of the in-homogeneous domain is ∼48 µm. The inhomogeneous regionsidentified by the MDP process need to be modeled at the mi-cromechanical level in the concurrent multi-scale analyses andsimulations. One of two such regions marked with a dark box inFigure 6(b) is shown in Figure 7(a). Micromechanical analysisof such regions is discussed in the following section.
3. LOCALLY ENRICHED VCFEM FOR DUCTILEFRACTURE OF PARTICLE REINFORCEDMETALLIC MATERIALSShown in Figure 7, the Voronoi cell finite element model
(VCFEM) naturally evolves by tessellation of the heterogeneous
Dow
nloa
ded
by [
JH L
ibra
ries
] at
10:
10 0
3 A
ugus
t 201
6

32 S. GHOSH ET AL.
FIG. 7. (a) Micrograph at region marked in Figure 6(b); (b) equivalent microstructure with elliptical particles; (c) Voronoi cell FEM mesh of the equivalentmicrostructure.
microstructure into a network of multi-sided Voronoi cells.Each Voronoi cell in VCFEM represents the neighborhood ofheterogeneities such as particle or inclusions in the microstruc-ture. The particles are represented by ellipses or by multi-sidedpolygonal domains in this paper. The particles are assumed to bebrittle elastic materials while the matrix is assumed to be ductileand represented by a pressure dependent elasto-plastic modelfor porous materials.
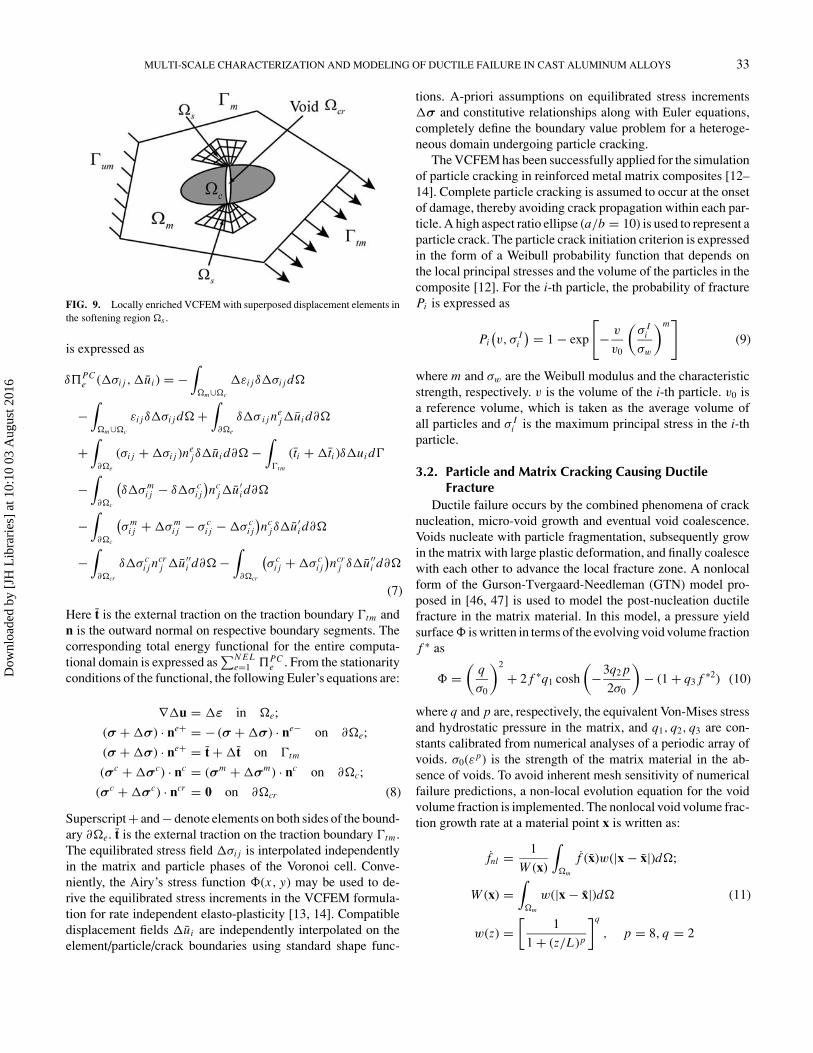
The VCFEM formulation is based on the assumed stress hy-brid formulation [11–15], in which equilibrated stress fieldsare assumed in the interior of each element and compatibledisplacements are assumed on the boundary of each elementand on the particle-matrix interface. After particle fragmen-tation, the topology of each element changes from two con-stituent phases to three constituents with the inclusion of thecrack, as shown in Figure 8. In the subsequent ductile frac-ture phase, regions in each Voronoi cell that exhibit softeningin the stress-strain behavior is enriched adaptively with finitedeformation, displacement based finite elements. The enrichedVoronoi cell consists of the matrix phase �m , the particle phase�c and a softening region of ductile damage �s , as shown inFigure 9.
Particle cracking in the microstructure naturally gives riseto stress concentrations or singularities, which in turn cause lo-cal matrix failure. With continued deformation beyond particlecracking, material points in the matrix lose their load carrying
FIG. 8. Evolution of a Voronoi cell element (a) without damage and (b) with particle cracking.
capacity due to local void growth and strain softening. Theseregions are identified and adaptively converted to softened re-gions �s , for which a displacement based finite element meshis automatically generated. Though in the schematics of Figures8 and 9 ductile matrix cracking is preceded by particle crack-ing, the two mechanisms exist simultaneously and independentlyin the model. Stresses σ s
i j in the softened region are generatedby using large deformation kinetics with an implicit backwardEuler integration rule [42]. For the superposed displacementelements, a type of h-type of refinement strategy proposed in[43] is used to reduce the mesh sensitivity. The B-bar methodsuggested in [44] is used for avoiding the volume locking prob-lem for nearly incompressible plasticity. The rotated Cauchystress rate [45] is used as an objective stress measure for thefinite deformation formulation within these narrow localizationzones. A summary of the LE-VCFEM formulation is presentedhere.
3.1. VCFEM Formulation with Particle CrackingFor particle cracking in an elastic-plastic matrix, an incre-
mental element energy functional PCe is defined for each
Voronoi cell element in terms of stress increments in the ma-trix and particle phases �m ∪ �c, and displacement incrementson the element boundary ∂�e, particle-matrix interface ∂�c aswell as on the crack boundary ∂�cr . The first variation of PC
e
Dow
nloa
ded
by [
JH L
ibra
ries
] at
10:
10 0
3 A
ugus
t 201
6
MULTI-SCALE CHARACTERIZATION AND MODELING OF DUCTILE FAILURE IN CAST ALUMINUM ALLOYS 33
FIG. 9. Locally enriched VCFEM with superposed displacement elements inthe softening region �s .
is expressed as
δPCe (�σi j , �ui ) = −
∫�m∪�c
�εi jδ�σi j d�
−∫
�m∪�c
εi jδ�σi j d� +∫
∂�e
δ�σ i j nej�ui d∂�
+∫
∂�e
(σi j + �σi j )nejδ�ui d∂� −
∫�tm
(ti + �ti )δ�ui d�
−∫
∂�c
(δ�σ m
i j − δ�σ ci j
)nc
j�u′i d∂�
−∫
∂�c
(σ m
i j + �σ mi j − σ c
i j − �σ ci j
)nc
jδ�u′i d∂�
−∫
∂�cr
δ�σ ci j n
crj �u′′
i d∂� −∫
∂�cr
(σ c
i j + �σ ci j
)ncr
j δ�u′′i d∂�
(7)
Here t is the external traction on the traction boundary �tm andn is the outward normal on respective boundary segments. Thecorresponding total energy functional for the entire computa-tional domain is expressed as
∑N E Le=1 PC
e . From the stationarityconditions of the functional, the following Euler’s equations are:
∇�u = �ε in �e;
(σ + �σ) · ne+ = − (σ + �σ) · ne− on ∂�e;
(σ + �σ) · ne+ = t + �t on �tm
(σc + �σc) · nc = (σm + �σm) · nc on ∂�c;
(σc + �σc) · ncr = 0 on ∂�cr (8)
Superscript + and − denote elements on both sides of the bound-ary ∂�e. t is the external traction on the traction boundary �tm .The equilibrated stress field �σi j is interpolated independentlyin the matrix and particle phases of the Voronoi cell. Conve-niently, the Airy’s stress function �(x, y) may be used to de-rive the equilibrated stress increments in the VCFEM formula-tion for rate independent elasto-plasticity [13, 14]. Compatibledisplacement fields �ui are independently interpolated on theelement/particle/crack boundaries using standard shape func-
tions. A-priori assumptions on equilibrated stress increments�σ and constitutive relationships along with Euler equations,completely define the boundary value problem for a heteroge-neous domain undergoing particle cracking.
The VCFEM has been successfully applied for the simulationof particle cracking in reinforced metal matrix composites [12–14]. Complete particle cracking is assumed to occur at the onsetof damage, thereby avoiding crack propagation within each par-ticle. A high aspect ratio ellipse (a/b = 10) is used to represent aparticle crack. The particle crack initiation criterion is expressedin the form of a Weibull probability function that depends onthe local principal stresses and the volume of the particles in thecomposite [12]. For the i-th particle, the probability of fracturePi is expressed as
Pi(v, σ I
i
) = 1 − exp
[− v
v0
(σ I
i
σw
)m]
(9)
where m and σw are the Weibull modulus and the characteristicstrength, respectively. v is the volume of the i-th particle. v0 isa reference volume, which is taken as the average volume ofall particles and σ I
i is the maximum principal stress in the i-thparticle.
3.2. Particle and Matrix Cracking Causing DuctileFracture
Ductile failure occurs by the combined phenomena of cracknucleation, micro-void growth and eventual void coalescence.Voids nucleate with particle fragmentation, subsequently growin the matrix with large plastic deformation, and finally coalescewith each other to advance the local fracture zone. A nonlocalform of the Gurson-Tvergaard-Needleman (GTN) model pro-posed in [46, 47] is used to model the post-nucleation ductilefracture in the matrix material. In this model, a pressure yieldsurface � is written in terms of the evolving void volume fractionf ∗ as
� =(
q
σ0
)2
+ 2 f ∗q1 cosh
(−3q2 p
2σ0
)− (1 + q3 f ∗2) (10)
where q and p are, respectively, the equivalent Von-Mises stressand hydrostatic pressure in the matrix, and q1, q2, q3 are con-stants calibrated from numerical analyses of a periodic array ofvoids. σ0(ε p) is the strength of the matrix material in the ab-sence of voids. To avoid inherent mesh sensitivity of numericalfailure predictions, a non-local evolution equation for the voidvolume fraction is implemented. The nonlocal void volume frac-tion growth rate at a material point x is written as:
fnl = 1
W (x)
∫�m
f (x)w(|x − x|)d�;
W (x) =∫
�m
w(|x − x|)d� (11)
w(z) =[
1
1 + (z/L)p
]q
, p = 8, q = 2
Dow
nloa
ded
by [
JH L
ibra
ries
] at
10:
10 0
3 A
ugus
t 201
6
34 S. GHOSH ET AL.
The weighting function w(z) has a value close to 1 within acharacteristic length scale radius L (z ≤ L) and diminishesrapidly outside the material radius. The explicit introduction ofthe length scale parameter L regularizes the localization problemand prevents the matrix crack from being unreasonably small. InVCFEM, the FE mesh is generated based on tessellation of thereal microstructure and hence the mesh has a inherent connectionto the material microstructure. The length scale parameter L ischosen based on the maximum size of the Voronoi cell finiteelements. The local void growth rate is governed by the relation:
f = (1 − fnl) e pkk + A(ε p)˙ε p (12)
where the evolution of effective plastic strain is written as:
σ0 ˙ε p = σi j λ∂�
∂σi j(13)
The second term in equation (12) is for void nucleation con-trolled by plastic strain as suggested in [46], where
A = fN
sN
√2π
exp
[−1
2
(ε p − εN
sN
)2]
(14)
For void coalescence, an acceleration function proposed in [47]is used,
f ∗ =
fnl fnl ≤ fc
fc + f ∗u − fc
f f − fc( fnl − fc) fnl > fc
(15)
Here fc is the critical void volume fraction at which voidcoalescence first occurs and f f is the value at final failure,which means the material loses all load capacity as fnl →f f ( f ∗ → f ∗
u = 1/q1). To avoid the numerical difficulties,( fnl → 0.95 f f ) is used instead of ( fnl → f f ).
A problem with the stress based VCFEM is that non-uniqueness in the displacement solutions in the softening phaseof material deformation will result in numerical instabilities.To avert this shortcoming, the softening region �s within eachVoronoi cell element is adaptively augmented with displacementbased finite elements as shown in Figure 9. Finite deformation,pressure dependent elasto-plasticity formulation is used for theof displacement finite elements in the local softening region.
Once the displacement based local FE region �s is over-laid, a parameter mapping process maps local stresses, strainsand material internal variables from the VCFEM domain to dis-placement elements. A superscript s corresponds to variablesassociated with the enriched softening regions �s . The formu-lation guarantees that the displacement us on the boundary ∂�s
is compatible with the displacement u, u′ and u′′, respectively,on the ∂�m , ∂�c and ∂�cr , i.e.
us = u on ∂�s ∩ ∂�m ; us = u′ on ∂�s ∩ ∂�c;
us = u′′ on ∂�s ∩ ∂�cr (16)
With the addition of the enriched softening region �s , theVCFEM formulation is modified with the augmentation of theenergy functional of equation (7). The corresponding incremen-tal potential energy �A for the displacement elements is addedwith appropriate boundary conditions are added to incremen-tal element energy functional PC
e to yield an enriched energyfunctional E N
e with an added independent variable �us . Thecorresponding first variation of E N
e is written as
δE Ne
(�σi j , �ui , �us
i
)= δPCe −
∫�s
(σ s
i j + �σ si j
)δ�εs
i j d�
+∫
∂�s
δ�σi j nsj�us
i d∂� +∫
∂�s
(σi j + �σi j )nsjδ�us
i d∂�
(17)
where �usi is the displacement increment for the displacement
elements. The displacement interpolation in terms of the nodaldisplacements are expressed as
{�us} = {Ns}{�qs} (18)
Additional Euler equations resulting from equation (16) are:
(σ + �σ) · ns = (σs + �σs) · ns on ∂�s ;
�us = �u on ∂�s ∩ ∂�m
�us = �u′ on ∂�s ∩ ∂�c;
�us = �u′′ on ∂�s ∩ ∂�cr (19)
The first Euler equation ensures the traction reciprocity on thesoftening region interface ∂�s . The next three equations ensurethe displacement increment continuity on ∂�s ∩∂�m , ∂�s ∩∂�c
and ∂�s ∩ ∂�cr .
3.2.1. Integration Algorithms in the LE-VCFEM FormulationThe adapted LE-VCFEM couples a small deformation hybrid
stress-based region �m and a finite deformation displacement-based softening region �s . This necessitates different integrationalgorithms for elements in different regions. In the hybrid stress-based region a strain update algorithm implementing the RegulaFalsi scheme is used to calculate plastic strains, stresses andstate variables for a given stress increments �σ [13, 14]. Forthe displacement elements, a backward Euler method proposedin [42] is used for stress and plastic strain update in an updatedLagrangian formulation introduced in [45]. An objective rate ofthe rotated Cauchy stress σs
R= RTσsR, in which R is a properorthogonal tensor representing pure rotation obtained from thepolar decomposition of F, i.e. R = FU−1 decomposition. Thesubscript “R” corresponds to variables in a rotated configuration.The rotated Cauchy stress is updated to the n + 1-th incrementusing the equation
(σs
R
)n+1 = (σs
R
)n +�σsR; where �σs
R=(Ce−p)n+1: �εsR
(20)
Dow
nloa
ded
by [
JH L
ibra
ries
] at
10:
10 0
3 A
ugus
t 201
6
MULTI-SCALE CHARACTERIZATION AND MODELING OF DUCTILE FAILURE IN CAST ALUMINUM ALLOYS 35
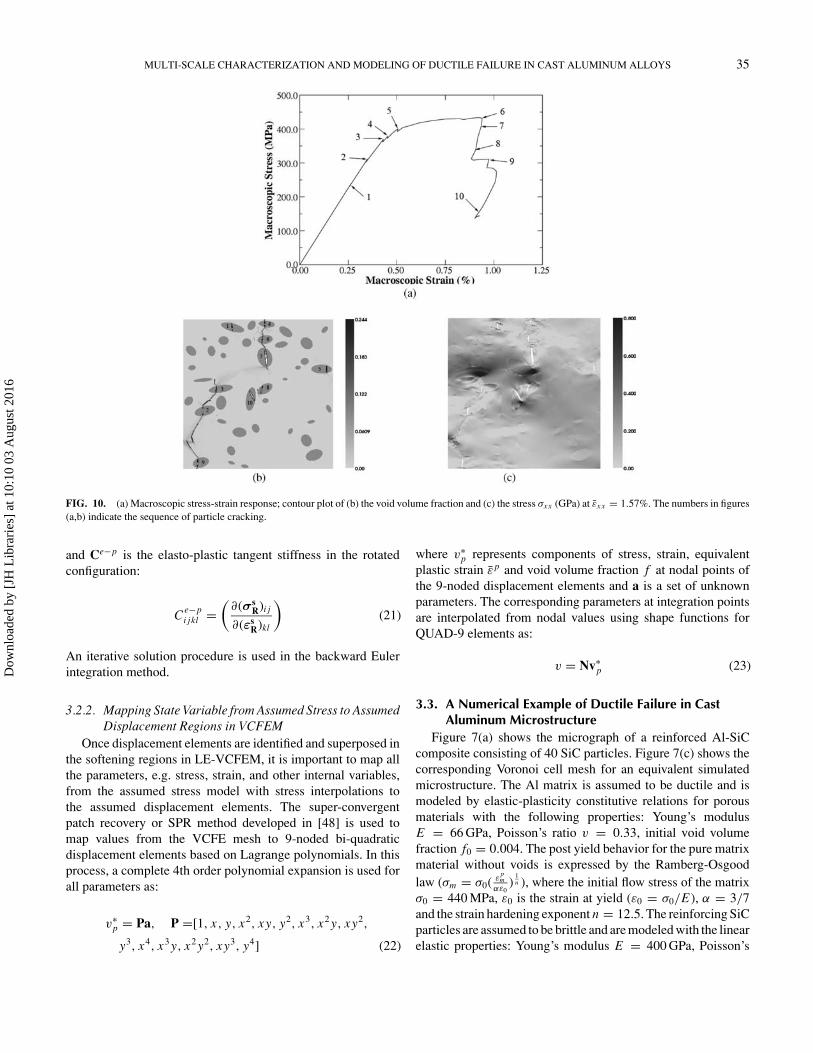
FIG. 10. (a) Macroscopic stress-strain response; contour plot of (b) the void volume fraction and (c) the stress σxx (GPa) at εxx = 1.57%. The numbers in figures(a,b) indicate the sequence of particle cracking.
and Ce−p is the elasto-plastic tangent stiffness in the rotatedconfiguration:
Ce−pi jkl =
(∂(σs
R)i j
∂(εsR)kl
)(21)
An iterative solution procedure is used in the backward Eulerintegration method.
3.2.2. Mapping State Variable from Assumed Stress to AssumedDisplacement Regions in VCFEM
Once displacement elements are identified and superposed inthe softening regions in LE-VCFEM, it is important to map allthe parameters, e.g. stress, strain, and other internal variables,from the assumed stress model with stress interpolations tothe assumed displacement elements. The super-convergentpatch recovery or SPR method developed in [48] is used tomap values from the VCFE mesh to 9-noded bi-quadraticdisplacement elements based on Lagrange polynomials. In thisprocess, a complete 4th order polynomial expansion is used forall parameters as:
v∗p = Pa, P =[1, x, y, x2, xy, y2, x3, x2 y, xy2,
y3, x4, x3 y, x2 y2, xy3, y4] (22)
where v∗p represents components of stress, strain, equivalent
plastic strain ε p and void volume fraction f at nodal points ofthe 9-noded displacement elements and a is a set of unknownparameters. The corresponding parameters at integration pointsare interpolated from nodal values using shape functions forQUAD-9 elements as:
v = Nv∗p (23)
3.3. A Numerical Example of Ductile Failure in CastAluminum Microstructure
Figure 7(a) shows the micrograph of a reinforced Al-SiCcomposite consisting of 40 SiC particles. Figure 7(c) shows thecorresponding Voronoi cell mesh for an equivalent simulatedmicrostructure. The Al matrix is assumed to be ductile and ismodeled by elastic-plasticity constitutive relations for porousmaterials with the following properties: Young’s modulusE = 66 GPa, Poisson’s ratio v = 0.33, initial void volumefraction f0 = 0.004. The post yield behavior for the pure matrixmaterial without voids is expressed by the Ramberg-Osgoodlaw (σm = σ0( ε
pm
αε0)
1n ), where the initial flow stress of the matrix
σ0 = 440 MPa, ε0 is the strain at yield (ε0 = σ0/E), α = 3/7and the strain hardening exponent n = 12.5. The reinforcing SiCparticles are assumed to be brittle and are modeled with the linearelastic properties: Young’s modulus E = 400 GPa, Poisson’s
Dow
nloa
ded
by [
JH L
ibra
ries
] at
10:
10 0
3 A
ugus
t 201
6
36 S. GHOSH ET AL.
ratio v = 0.2. For particle cracking, (m = 2.4, σw = 1.32 GPa)are used in equation (9) for Weibull model. For the GTN model,(q1 = 1.5, q2 = 1.0, q3 = q2
1 = 2.25) are used in equation (10)and L = 0.05 × (maximum size of the Voronoi cell elements)= 1 µm is used in equation (11) for nonlocal model. And(εN = 0.1, sN = 0.1, fN = 0.1) are used in equation (14) fornucleation. The microstructure is subjected to a macroscopictension strain εxx = 1.57%, applied on the left side of thecomputational domain. The results of the simulation are shownin Figure 4. Figure 10(a) shows the macroscopic strain-stress re-sponse, with the explicit effect of particle cracking followed byductile matrix fracture. The cracked particle numbers are shownin Figure 10(b). The first 9 particles crack in isolation and do notaffect the cracking of others. During this period, no softeningin the stress-strain behavior is observed. Softening, manifestedby a drop in the stress-strain curve corresponding to a negativestiffness, starts after the tenth particle has cracked followed bysignificant plastic deformation and void growth in the matrix.From Figure 10(b), it is evident that the subsequent sequence ofparticle and matrix cracking occur in a very narrow band of themicrostructure and hence a dominant crack path is observed.The sequence of particle cracking is shown in the stress-strainplot of Figure 10(a). The figure shows that particles (# 6, 7, 8,9, and 10) crack after the dominant ductile crack has developedin the microstructure. Contour plots of the void volume fractionin the matrix (with fc = 0.15, f f = 0.25) and the stress in theloading direction for εxx = 1.57% are shown in Figures 10(b,c).Near the dominant fracture path, the stress σxx decreases to nearzero.
4. CONTINUUM DAMAGE MECHANICS MODEL FORDUCTILE MATERIALS BY HOMOGENIZATION OFMICROMECHANICAL RESPONSE FUNCTIONSIn this section, a macroscopic continuum damage mechanics
model is developed for multi-phase ductile materials containingnon-uniform dispersion of brittle particles. The damage model,developed for plane strain analysis, can be used in macroscopicanalysis models for predicting ductile failure in the material. Theanisotropic damage model is chosen to follow the general frame-work of the Gurson-Tvergaard-Needleman (GTN) model [46,47]. To accommodate non-proportional loading, the anisotropicconstitutive and damage models are expressed in the principalmaterial and principal damage coordinate systems respectively.A pre-matrix cracking homogenization based continuum dam-age model for ductile composites undergoing particle crackingonly, has been developed by Ghosh et al. in [16].
φ = F(Wp)(�yy − �zz)2 + G(Wp)(�zz − �xx )2 + H (Wp)(�xx − �yy)2 + C(Wp)�2xy
Y 2f (Wp)
− 1 = 0 (26)
4.1. Homogenized Anisotropic Constitutive Model Basedon the GTN Model
The GTN model based homogenized anisotropic elastic-plastic constitutive model for materials undergoing microstruc-tural ductile fracture considers only void growth for planestrain problems. The anisotropic yield criterion for porous duc-tile materials containing a dispersion of particles depends onhydrostatic stress measures and void volume fraction, and maybe written as
φ = �2eq
Y 2f (Wp)
+ 2Q1 f cosh
(Qa�xx + Qb�yy + Qc�zz
Y f (Wp)
)
− 1 − (Q1 f )2 = 0 (24)
where �i j is the macroscopic homogenized stress in a compos-ite medium Wp is the plastic work and Y f is the flow stress inshear. As stated in equation (12), the evolution of f is governedby the plastic strain and its rate, as well as f itself. The incre-ment of macroscopic plastic strain is obtained from the yieldcriterion by using an associated flow rule for hardening materi-als, i.e. e p
i j = λ∂φ
∂�i j. For plane strain, the equivalent stress �eq in
the matrix material without voids (microstructure consisting ofmatrix and particles) is represented using Hill’s [49] anisotropicyield function as
�2eq = F(Wp)(�yy − �zz)
2 + G(Wp)(�zz − �xx )2
+H (Wp)(�xx − �yy)2 + C(Wp)�2xy (25)
The anisotropy parameters F(Wp), G(Wp),H (Wp) andC(Wp) are functions of the plastic work Wp that are cal-ibrated from homogenization studies with material withoutvoids. Likewise, the parameters Q1(Wp), Qa(Wp), Qb(Wp) andQc(Wp) corresponding to an effective hydrostatic stress arecalibrated from homogenization studies on materials contain-ing voids. The asymptotic expansion based homogenization ofmicroscopic variables in the microstructural RVEs using pe-riodicity assumptions on the boundary has been discussed in[16, 17, 50]. Homogenization studies in this work are con-ducted with the micromechanical LE-VCFEM analysis dis-cussed in section 3. The calibrated parameters will dependon the microstructural characteristics of the RVE’s, and theircalibration process for each RVE is discussed in section 4.2.When f = 0, equation (23) reduces to the yield criterion foran anisotropic composite material without porosity, and hence
Dow
nloa
ded
by [
JH L
ibra
ries
] at
10:
10 0
3 A
ugus
t 201
6
MULTI-SCALE CHARACTERIZATION AND MODELING OF DUCTILE FAILURE IN CAST ALUMINUM ALLOYS 37
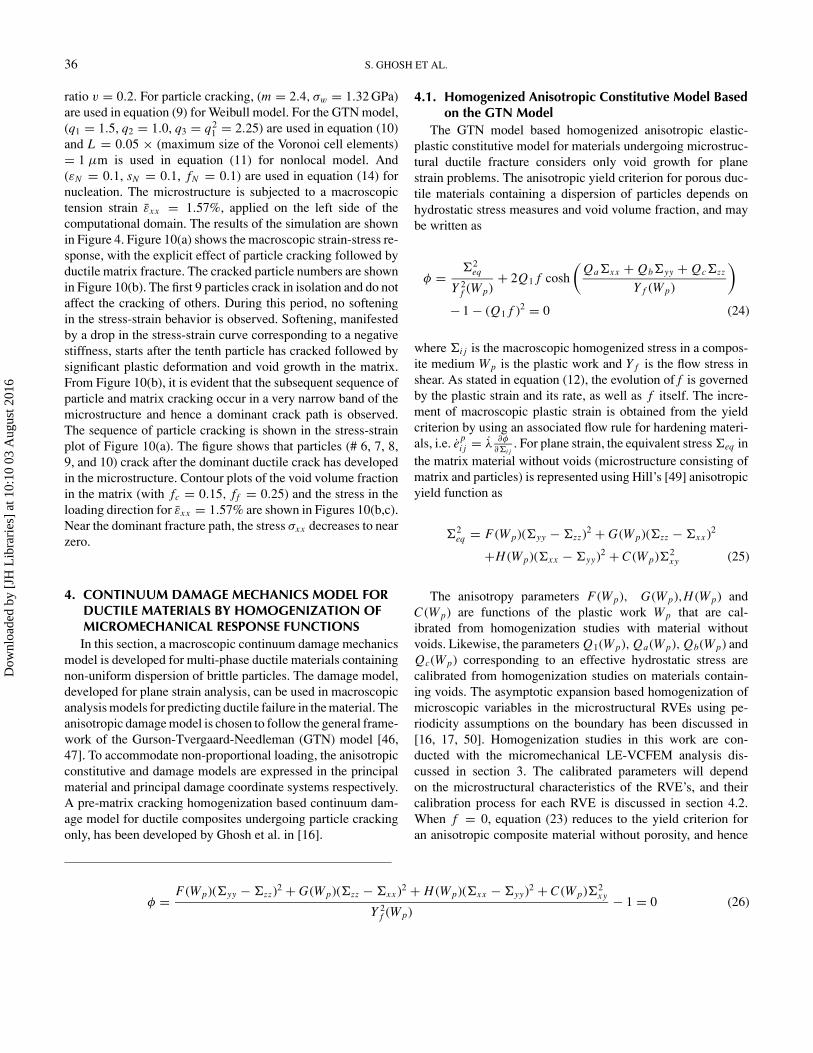
FIG. 11. RVE with randomly distributed particles showing principal axes ofmaterial anisotropy.
This yield criterion is defined in the principal axes of materialsymmetry. The material is assumed to be orthotropic with re-spect to the principal coordinate system. Material anisotropy isdetermined not only by the morphology of microstructures, suchas size, shape and distribution of particles, but also the evolutionof plastic deformation and damage in the microstructure duringthe loading process. It is assumed that at every load step, materialremains orthotropic with respect to the evolving material axis.At every load step, the angle β in Figure 11 corresponding toprincipal axes of anisotropy for plane strain conditions is deter-mined from the conditions required to keep the tangent modulusE tan
i jkl orthotropic. Consequently, terms coupling the normal andshear components in the transformed tangent modulus are set tozero, i.e. (E tan
1112)′ = (E tan2212)′ = (E tan
3312)′ = 0, where
(E tan
i jkl
)′ = Qim Q jn Qkp Qlq E tanmnpq where
[Q] =
cos β sin β 0
− sin β cos β 0
0 0 1
(27)
4.2. Evaluation of Constitutive Parameters Variables inthe Homogenized Constitutive Model
4.2.1. Y f (Wp) and C in Equation (26)As defined in equation (24), Y f (Wp) is taken as the flow
stress in shear. A microscopic boundary value problem of theRVE is solved for incremented pure shear loading (exx = eyy =0, exy �= 0), which is followed by homogenization. This is done
by applying pure macroscopic shear strain on the RVE with peri-odic boundary conditions, as detailed in [16]. The macroscopicplastic work, stresses and strains are evaluated by averaging themicrostructural variables using following equations:
Wp = 1
�
∫�
σi j εpi j d�, �i j = 1
�
∫�
σi j d�, ei j = 1
�
∫�
εi j d�
(28)
For pure shear loading condition, �xx = �yy = �zz = 0 and�xy �= 0. The parameter C in equation (25) is first set to 3,then Y f (Wp) = √
3�xy . Finally, the flow stress is plotted as afunction of plastic work Wp, as shown in Figure 12(a).
4.2.2. Parameters F, G and H(i) A set of numerical experiments for given RVE (without
voids and without particle fragmentation) with differentloading conditions are performed using LE-VCFEM and ho-mogenization theory. The different loading conditions are
FIG. 12. (a) Yield stress as a function of macroscopic plastic work; (b) macro-scopic stresses as functions of macroscopic plastic work.
Dow
nloa
ded
by [
JH L
ibra
ries
] at
10:
10 0
3 A
ugus
t 201
6

38 S. GHOSH ET AL.
represented by various macroscopic strain combinations,exx : eyy : exy = 1 : a : b, where a = 0, 0.5, 1.0 and2.0, and b = 0, 0.5, 1.0 and 2.0, respectively. A total of16 numerical experiments are performed, and macroscopicstresses and plastic work are obtained for each case in theprincipal axes of anisotropy from equations (28). For eachloading condition, macroscopic stresses in principal axes ofanisotropy are plotted as functions of plastic work Wp, asshown in Figure 12(b).
(ii) Assuming that the plastic work (Wp) is invariant with re-spect to the loading condition. For a given value of macro-scopic plastic work, yield stress Y f (Wp) is obtained fromthe curve plotted in section 4.2.1, macroscopic stresses com-ponents for each loading conditions are obtained from thecurves plotted in step (i), as shown in Figure 12(b). Thenanisotropic parameters F, G and H in yield criterion (26) areevaluated by minimizing the function
∑16i=1 φ2
i (F, G, H )using least square method for this macroscopic plasticwork for the 16 numerical experiments. This step is re-peated for different values of macroscopic plastic workand the anisotropic parameters are plotted as functions ofWp.
4.2.3. Parameters Q1, Qa, Qb and Qc
(i) A macro-micro pure shear problem is solved with RVE ho-mogenization while the matrix material has non-zero ini-tial void volume fraction. The macroscopic stresses andaveraged void volume fraction are plotted as functionsof Wp, where the averaged incremental plastic work isWp = 1
�
∫�
11− f σi j ε
pi j d�. Because normal stresses equal to
zero and void volume fraction does not change, Q1 can bedetermined directly by solving the following yield equationwith different �xy and corresponding Y f .
3�2xy
Y 2f
+ 2Q1 f − (1 + Q2
1 f 2) = 0
(ii) The same set of numerical experiments used in section 4.2.2for the RVE is again performed for the matrix material withnon-zero initial void volume fraction.
(iii) Again, assuming that the plastic work is invariant withthe loading condition, the parameters Qa , Qb and Qc inyield criterion (23) are evaluated by minimizing the func-tion
∑16i=1 φ2
i (Qa, Qb, Qc) using least square method withcalibrated anisotropic parameters F, G and H. This step isrepeated for different values of macroscopic plastic workand subsequently, the parameters Qa , Qb and Qc are plottedas functions of Wp.
4.3. Numerical ImplementationThe macroscopic constitutive laws for the ductile material
consisting of brittle particles and undergoing ductile failure arederived from the anisotropic yield function (24) with associ-
ated flow rule and strain hardening. In an incremental form, themacroscopic stress increments ��i j are related to incrementsof strains as
��i j = Ei jkl(�ekl − �ep
kl
)(29)
where Ei jkl is the homogenized elastic tensor. Using associatedflow rule, the components of plastic strain increment are obtainedas:
�epxx = �λ
∂φ
∂�xx, �ep
yy = �λ∂φ
∂�yy,
�epxy = �λ
∂φ
∂�xy�ep
zz = �λ∂φ
∂�zz(30)
Elimination of the flow parameter�λ from equations (24) results
FIG. 13. (a) Anisotropic plastic yield parameters; (b) comparison of strain-stress response by the macroscopic constitutive model with that by microscopicRVE analysis with homogenization for a simple unit cell with one particle.
Dow
nloa
ded
by [
JH L
ibra
ries
] at
10:
10 0
3 A
ugus
t 201
6

MULTI-SCALE CHARACTERIZATION AND MODELING OF DUCTILE FAILURE IN CAST ALUMINUM ALLOYS 39
in the set of equations
�epxx
(∂φ
∂�yy
)− �ep
yy
(∂φ
∂�xx
)= 0,
�epxx
(∂φ
∂�xy
)− �ep
xy
(∂φ
∂�xx
)= 0,
�epxx
(∂φ
∂�zz
)− �ep
zz
(∂φ
∂�xx
)= 0
(31)
With known increments of strain, the set of equation (31), to-gether with the yield function equation (24), are solved itera-tively by using the Newton-Raphson method to obtain stressincrements using the following steps.
(i) Initialize values of ��xx , ��yy , ��zz and ��xy by using��i j = Ei jkl�ekl
(ii) Calculate the gradient ( ∂φ
∂�i j) of yield function and solve for
the increments of plastic strain �epxx , �ep
yy, �epzzand�ep
xy
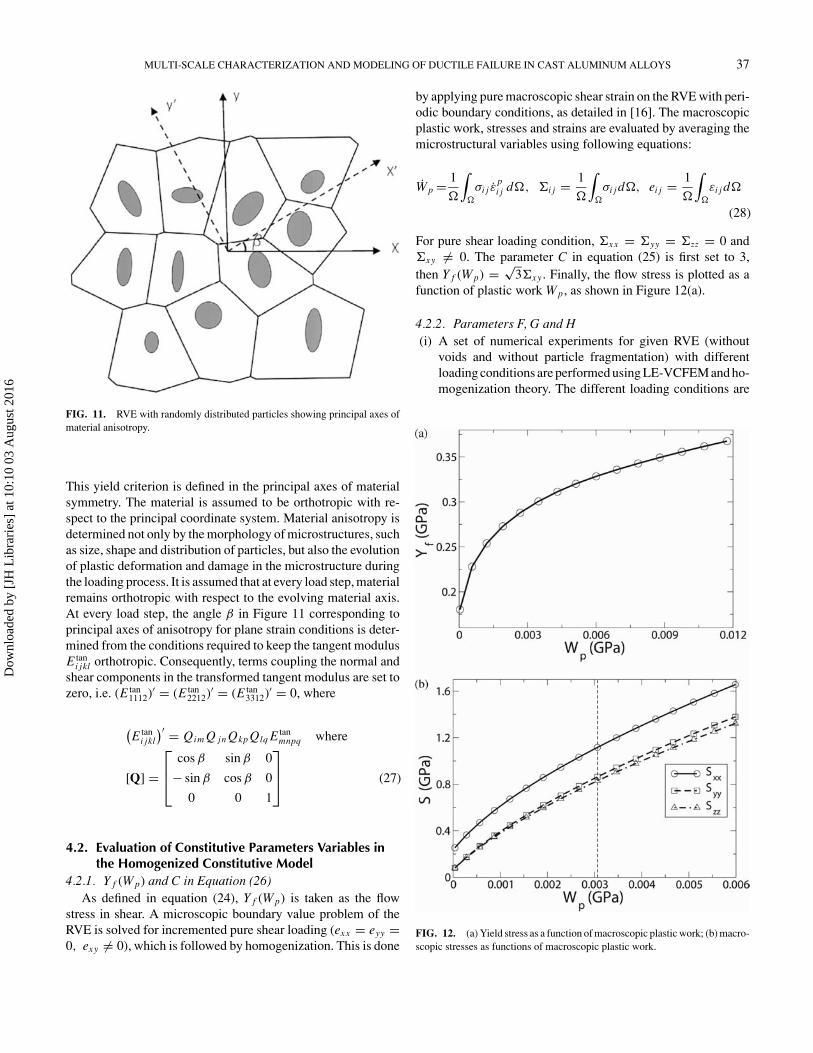
FIG. 14. (a) Anisotropic plastic yield parameters; (b) comparison of strain-stress response by the macroscopic constitutive model with that by microscopicRVE analysis with homogenization for an arbitrary RVE with 11 random dis-tributed particles.
from equations (31) and (24). Update the stresses, voidvolume fraction and plastic work using the relation
�Wp = �xx�epxx + �yy�ep
yy + �zz�epzz + �xy�ep
xy
(32)
(iii) Update all parameters using the updated plastic work.(iv) If φ ≤ tol1 and correction to plastic strain increment δep
i j ≤tol2, where tol1, tol2 are prescribed tolerances, then stop.Otherwise go to step (ii).
4.4. Numerical ExamplesThe homogenized anisotropic GTN model is validated by
comparing the results of a range of macroscopic numericalsimulations with those obtained by coupled macro-micro scaleanalysis using LE-VCFEM and homogenization. Simulationsare conducted for two heterogeneous microstructures, without
FIG. 15. (a) Anisotropic parameters for the hydrostatic portion of plasticyield; (b) comparison of strain-stress response by the macroscopic constitu-tive model with that by microscopic RVE analysis with homogenization for asimple unit cell with one particle.
Dow
nloa
ded
by [
JH L
ibra
ries
] at
10:
10 0
3 A
ugus
t 201
6
40 S. GHOSH ET AL.
and with voids. The RVEs considered are: (1) a square matrixdomain with one circular particle and (b) an arbitrary shapeddomain with 11 randomly distributed particles of different sizesand shapes (Figure 11). The RVE material properties for thematrix are E = 66 GPa, v = 0.33. The post yield behaviorfor the pure matrix material without voids is expressed by theRamberg-Osgood law (σm = σ0( ε
pm
αε0)
1n ), where the initial flow
stress of the matrix is σ0 = 440 MPa, ε0 is the strain at yield(ε0 = σ0/E), material parameter α = 3/7 and strain hardeningexponent n = 12.5. For the brittle particles, E = 400 GPa andv = 0.2.
4.4.1. Simulations with the Anisotropic Plasticity Model forMicrostructure Without Voids
Anisotropic parameters for the two RVE’s are plotted inFigures 13(a) and 14(a) as functions of Wp. Results of a puremacroscopic analysis using the anisotropic plasticity modelof equations (24, 25, 29, 30) are compared with pure mi-cromechanics based results that are averaged after each load
FIG. 16. (a) Anisotropy parameters for the hydrostatic portion of plastic yield;(b) comparison of strain-stress response by the macroscopic constitutive modelwith that by microscopic RVE analysis with homogenization for an arbitraryRVE with 11 random distributed particles.
step. The results of this comparison for the loading condition(exx : eyy : exy = 4 : 2 : 3) are shown in Figures 13(b) and14(b) with good agreement. Comparisons for other loading con-ditions represented by various strain combinations (not shown)also show good agreement.
4.4.2. Simulations with the Anisotropic Plasticity-damageModel for Microstructure with Voids
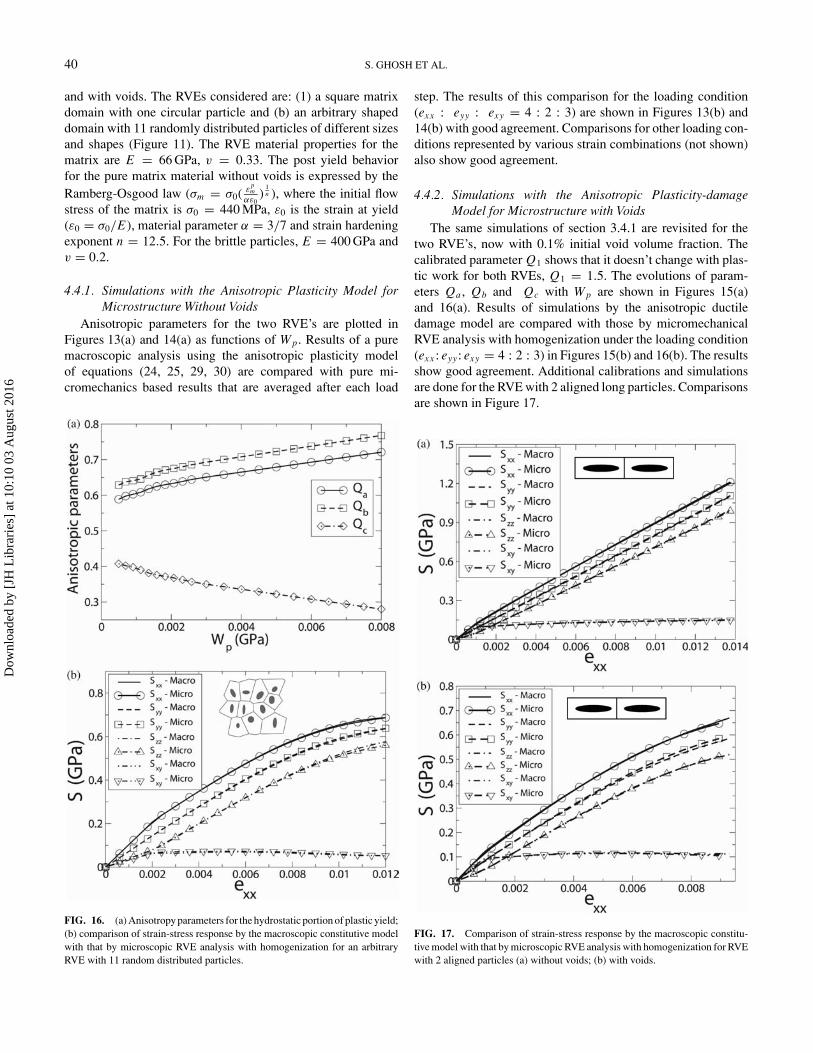
The same simulations of section 3.4.1 are revisited for thetwo RVE’s, now with 0.1% initial void volume fraction. Thecalibrated parameter Q1 shows that it doesn’t change with plas-tic work for both RVEs, Q1 = 1.5. The evolutions of param-eters Qa , Qb and Qc with Wp are shown in Figures 15(a)and 16(a). Results of simulations by the anisotropic ductiledamage model are compared with those by micromechanicalRVE analysis with homogenization under the loading condition(exx : eyy : exy = 4 : 2 : 3) in Figures 15(b) and 16(b). The resultsshow good agreement. Additional calibrations and simulationsare done for the RVE with 2 aligned long particles. Comparisonsare shown in Figure 17.
FIG. 17. Comparison of strain-stress response by the macroscopic constitu-tive model with that by microscopic RVE analysis with homogenization for RVEwith 2 aligned particles (a) without voids; (b) with voids.
Dow
nloa
ded
by [
JH L
ibra
ries
] at
10:
10 0
3 A
ugus
t 201
6
MULTI-SCALE CHARACTERIZATION AND MODELING OF DUCTILE FAILURE IN CAST ALUMINUM ALLOYS 41
5. CONCLUSIONSThis paper develops three modules contributing to the over-
all framework of multi-scale modeling of ductile fracture ofparticle reinforced metallic materials, e.g., cast aluminum al-loys with dispersed particulates. The first module introduces amorphology based domain partitioning (MDP) as a preprocessorto multiscale modeling, identifying regions of strong inhomo-geneity in the microstructural domain. The three step simulation-characterization-partitioning technique provides a delineation ofvarious length scales in the microstructure.
The second module is for detailed micromechanical analysisof particle fragmentation and matrix cracking of heterogeneousmicrostructures leading to ductile fracture. This module is nec-essary for RVE level analysis with periodicity (level-1) as wellas pure micromechanical analysis in regions where periodicityceases to hold (level-2) in the multi-level analysis discussed in[16, 17, 50]. The Voronoi cell FEM for particle fragmentationis extended in this paper to incorporate ductile failure throughmatrix cracking in the form of void growth and coalescence us-ing a non-local Gurson-Tvergaard-Needleman (GTN) model. Inthe resulting locally enriched VCFEM or LE-VCFEM, the as-sumed stress-based hybrid VCFEM formulation is overlaid withnarrow bands of displacement based elements to accommodatestrain softening in the constitutive behavior. Numerical exam-ples presented show the potential of LE-VCFEM in accuratemicrostructural modeling of ductile fracture.
The third module in this paper develops a homogenizedanisotropic plasticity-damage model for macroscopic analysis inthe multi-scale material model. The anisotropic model is takento be in the form of the GTN model. Parameters in this modelare calibrated from results of homogenization of microstructuralvariables obtained by LE-VCFEM analysis of microstructuralRVE containing particles, matrix and voids. Numerical exam-ples are simulated with this model for different RVE’s under-going a wide variety of load paths. Comparison between theanisotropic GTN model and homogenized micromechanics re-sults shows excellent agreement. Thus the model is suitable forbeing implemented in macroscopic finite element codes [51]to represent ductile failure in composites as long as the ba-sic RVE assumptions remain valid. The authors are currentlyworking on integrating these modules in a comprehensivemulti-scale framework, which will be reported in subsequentpapers.
REFERENCES1. Q.C. Wang, C.H. Caceres, J.R. Griffiths, Jr., Damage by Eutectic Particle
Cracking in Aluminum Casting Alloys A356/357, Metall. Mater. Trans. A.,vol. 34A, pp. 2901–2912, 2003.
2. Q.C. Wang, Microstructural Effects on the Tensile and Fracture Behaviorof Aluminum Casting Alloys A356/357, Metall. Mater. Trans. A., vol. 34A,pp. 2887–2899, 2003.
3. J.M. Boileau, The Effect of Solidification Time on the Mechanical Propertiesof a Cast 319 Aluminum Alloy, Ph.D. Dissertation, Wayne State University,2000.
4. W.J. Poole, E.J. Dowdle, Experimental Measurements of Damage Evolutionin Al-Si Eutectic Alloys, Scripta Mater., vol. 39, pp. 1281–1287, 1998.
5. A.S. Argon, J. Im, R. Sofoglu, Cavity Formation from Inclusions in DuctileFracture, Metall. Mater. Trans. A., vol. 6A, pp. 825–837, 1975.
6. C.H. Caceres, Particle Cracking and the Tensile Ductility of a ModelAl-Si-Mg Composite System, Aluminum Transactions, vol. 1, pp. 1–13,1999.
7. C.H. Caceres, J.R. Griffiths, Damage by the Cracking of Silicon Particlesin an Al-7Si-0.4Mg Casting Alloy, Acta Mater., vol. 44, pp. 25–33, 1996.
8. T. Christman, T. Needleman, S. Suresh, An Experimental and NumericalStudy of Deformation in Metal-Ceramic Composites, Acta Metall. et Mater.vol. 37, pp. 3029–3050, 1989.
9. C. Gonzalez, J. Llorca, Prediction of the Tensile Stress-Strain Curve andDuctility in Al/SiC Composites, Scripta Metall., vol. 35(1), pp. 91–97, 1996.
10. E. Weissenbek, H.J. Boehm, F.G. Rammerstoffer, Micromechanical Inves-tigations of Fiber Arrangement Effects in Particle Reinforced Metal MatrixComposites, Comp. Mater. Sci., vol. 3, pp. 263–278, 1994.
11. S. Ghosh, Y. Ling, B. Majumdar, R. Kim, Interfacial Debonding Analysis inMultiple Fiber Reinforced Composites, Mech. Mater., vol. 32, pp. 561–591,2000.
12. M. Li, S. Ghosh, O. Richmond, An Experimental-Computational Approachto the Investigation of Damage Evolution in Discontinuously ReinforcedAluminum Matrix Composites, Acta Mater., vol. 47(12), pp. 3515–3552,1999.
13. S. Ghosh, S. Moorthy, Particle Fracture Simulation in Non-Uniform Mi-crostructures of Metal-Matrix Composites, Acta Mater., vol. 46, pp. 965–982, 1998.
14. S. Moorthy, S. Ghosh, A Voronoi Cell Finite Element Model for Parti-cle Cracking in Elastic-Plastic Composite Materials, Comput. Meth. Appl.Mech. Engrg., vol. 151, pp. 377–400, 1998.
15. S. Li, S. Ghosh, Debonding in Composite Microstructures with Morpho-logical Variations, Int. Jour. Comput. Methods, vol. 1, no. 1, pp. 121–149,2004.
16. S. Ghosh, K. Lee, P. Raghavan, A Multi-Level Computational Model forMultiscale Damage Analysis in Composite and Porous Materials, Int. J. ofSolids Struct. vol. 38, no. 14, pp. 2335–2385, 2001.
17. P. Raghavan, S. Ghosh, Adaptive Multi-Scale Computational Modelingof Composite Materials, Comp. Model. Engrg. Sci., vol. 5, pp. 151–170,2004.
18. S. Ghosh, D.M. Valiveti, S.H. Harris, J. Boileau, Microstructure Charac-terization Based Domain Partitioning as a Pre-Processor to Multi-ScaleModeling of Cast Aluminum Alloys, Model. Simul. Mater. Sci. Engrg., vol.14, pp. 1363–1396, 2006.
19. D.M. Valiveti, S. Ghosh, Domain Partitioning of Multi-Phase MaterialsBased on Multi-Scale Characterizations: A Preprocessor for Multi-ScaleModeling, Int. Jour. Numer. Meth, Engrg., vol. 69(8), pp. 1717–1754, 2007.
20. A.K. Ghosal, R. Narasimhan, Mixed-Node Fracture Initiation in a DuctileMaterial with a Dual Population of Second-Phase Particles, Mater. Sci.Engrg., vol. A211, pp. 117–127, 1996.
21. D. Steglich, W. Brocks, Micromechanical Modeling of the Behavior ofDuctile Materials Including Particles, Comput Mater Sci, vol. 9, pp. 7–17,1997.
22. J. Llorca, C. Gonzalez, Microstructural Factors Controlling the Strength andDuctility of Particle Reinforced Metal-Matrix Composites, J. Mech. Phys.Solids, vol. 46, pp. 1–28, 1998.
23. J.B. Leblond, G. Perrin, J. Devaux, Bifurcation Effects in Ductile Met-als with Nonlocal Damage, J. Appl. Mech., vol. 61, pp. 236–242,1994.
24. V. Tvergaard, A. Needleman, Effect of Non-Local Damage in Porous PlasticSolids, Int. J. of Solids. Struct., vol. 32, pp. 1063–1077, 1995.
25. V. Tvergaard, A. Needleman, Nonlocal Effects on Localization in a Void-Sheet, Int. J. of Solids Struct., vol. 34, pp. 2221–2238, 1997.
26. J.R. Rice, The Localization of Plastic Deformation, Proc. 14th Int. Congr.On Theoretical and Applied Mechanics, Delft, Amsterdam, pp. 207–20,North-Holland, New York, 1976.
Dow
nloa
ded
by [
JH L
ibra
ries
] at
10:
10 0
3 A
ugus
t 201
6

42 S. GHOSH ET AL.
27. W.Y. Chien, J. Pan, S.C. Tang, Modified Anisotropic Gurson Yield Criterionfor Porous Ductile Sheet Metals, J Engrg Mater Tech, vol. 123, pp. 409–416,2001.
28. A.A. Benzerga, J. Besson, A. Pineau, Anisotropic Ductile Fracture, Part II:Theory, Acta Mater., vol. 52, pp. 4639–4650, 2004.
29. A.A. Benzerga, J. Besson, Plastic Potential for Anisotropic Porous Solids,Eur J Mech, vol. 20A, pp. 397–434, 2001.
30. A.A. Benzerga, J. Besson, R. Batisse, A. Pineau, Synergistic Effects ofPlastic Anisotropy and Void Coalescence on Fracture Mode in Plane Strain,Modeling Simul Mater Sci Eng, vol. 10, pp. 73–102, 2002.
31. A.M. Gokhale, S. Yang, Application of Image Processing for Simulation ofMechanical Response of Multi-Length Scale Microstructures of Engineer-ing Alloys, Metall. Mater. Trans, vol. A30, pp. 2369–81, 1999.
32. A. Tewari, A.M. Gokhale, J.E. Spowart, D.B. Miracle, Quantitative Charac-terization of Spatial Clustering in Three-Dimensional Microstructures Us-ing Two-Point Correlation Functions, Acta Materialia, vol. 52, pp. 307–19,2004.
33. C.L.Y. Yeong, S. Torquato, Reconstructing Random Media, Phys. Rev. E,vol. 57, pp. 495–505, 1998.
34. M.D. Rintoul, S. Torquato, Reconstruction of Structure of Dispersions, Jnl.of Colloid and Interface Science, vol. 186, pp. 467–76, 1997.
35. D.W. Cooper, Random Sequential Packing Simulation in Three Dimensionsfor Spheres, Phys. Rev. A, vol. A38, pp. 522–24, 1998.
36. R.K. Everett, J.H. Chu, Modeling of Non-Uniform Composite Microstruc-tures, J. Compos. Mater, vol. 27, pp. 1128–44, 1992.
37. R. Everson, L. Sirovich, K.R. Sreenivasan, Wavelet Analysis of the Turbu-lent Jet, Physics Letters A, vol. 145, pp. 314–22, 1990.
38. L. Prasad, S.S. Iyengar, Wavelet Analysis with Applications to Image Pro-cessing, CRC Press, Boca Raton, FL, 1997.
39. S. Torquato, Random Heterogeneous Materials: Microstructure and Macro-scopic Properties, Springer-Verlag New York, 2002.
40. C.H. Caceres, J.R. Griffiths, P. Reiner, The Influence of Microstructure onthe Bauschinger Effect in An Al-Si-Mg Casting Alloy, Acta Mater., vol. 44,pp. 15–23, 1996.
41. J.E. Spowart, B. Maruyama, D.B. Miracle, Multiscale Characterization ofSpatially Heterogeneous Systems: Implications for Discontinuously Re-inforced Metal-Matrix Composite Microstructures, Mat. Sci. Engrg., vol.A307, pp. 51–66, 2001.
42. N. Aravas, On the Numerical Integration of a Class of Pressure-DependentPlasticity Models, Int. J. Numer. Meth. Engrg., vol. 24, pp. 1395–1416,1987.
43. J.M. Bass, J.T. Oden, Adaptive Finite Element Methods for a Class ofEvolution Problems in Visco-Plasticity, Int. J. Engrg Sci, vol. 6, pp. 623–653, 1987.
44. T.J.R. Hughes, Generalization of Selected Integration Procedures toAnisotropic and Nonlinear Media, Int. J. Number Methods Engrg., vol.15, pp. 1413–1418, 1980.
45. S. Ghosh, N. Kikuchi, An arbitrary Lagrangian-Eulerian Finite Ele-ment Method for Large Deformation Analysis of Elastic-ViscoplasticSolids, Comput. Methods Appl. Mech. Engrg., vol. 86, pp. 127–188,1991.
46. C.C. Chu, A. Needleman, Void Nucleation Effects in Biaxially StretchedSheets, J. Eng. Mater. Tech., vol. 102, pp. 249–256, 1980.
47. V. Tvergaard, Influence of Voids on Shear Band Instabilities Under PlaneStrain Conditions, Int. J. Fract. Mech., vol. 17, pp. 389–407, 1981.
48. O.C. Zienkiewicz, J.Z. Zhu, The Super-Convergent Patch Recovery and aPosteriori Error Estimates. Part 1: The Recovery Technique, Int. J. Numer.Methods Eng., vol. 33, pp. 1331–1364, 1992.
49. R.A. Hill, A Theory of Yielding and Plastic Flow of Anisotropic Metals,Proc. Roy. Soc. London, Ser. A., vol. 193, pp. 281–297, 1948.
50. P. Raghavan, S. Ghosh, Concurrent Multi-Scale Analysis of Elastic Com-posites by a Multi-Level Computational Model, Comp. Meth. Appl. Mech.Engrg., vol. 193, pp. 497–538, 2004.
51. K.S. Surana, A. Rajwani, J.N. Reddy, The k-version Finite ElementMethod for Singular Boundary-Value Problems with Application to Lin-ear Fracture Mechanics, International Journal for Computational Meth-ods in Engineering Science and Mechanics, vol. 7 (3), pp. 217–239,2006.
Dow
nloa
ded
by [
JH L
ibra
ries
] at
10:
10 0
3 A
ugus
t 201
6