Embed Size (px)
Citation preview

DUBAI REAL ESTATE MARKET OVERVIEW
Q3 2017
REAL ESTATE SERVICES

2
FOREWORD ADIB Real Estate Services comprises a comprehensive real estate banking and advisory platform providing the full range of professional services from a single provider. Our services include:-
�� Real estate financing�� Strategic development advisory�� Investment advisory�� Asset management�� Project management
�� Valuation�� Agency�� Market research�� Property management�� Facilities management
Residential
�� Approximately 3,600 new units, the total residential stock of Dubai reached 510,000 units as of Q3 2017. During the nine months of 2017, c.14,500 units were added with 75% being apartments and 25% villas/townhouses.
�� During the quarter residential rents soften by 1% while year-on-year the decline was 6%. Multiple factors like addition of new residential units, increase in ownership and constrained job opportunities are impacting the rental rates and occupancy levels.
�� During the quarter, sale rates for villas and apartments recorded a marginal decline of 1% and 4.5% year-on-year. Within the villas segment, Arabian Ranches recorded the highest decline of 6.5% year-on-year while Downtown Dubai recorded a decline of 7% year-on-year within the apartment segment.
�� During the quarter over 9,000 new off-plan properties were launched. The Cityscape Global, the annual real estate exhibition further fueled launch of new properties. Moreover, for the first time developers were allowed to sell properties during the event and resulted in transaction of AED870 million worth of property during the three day event.
Office
�� The total office stock of Dubai reached 96 million sq.ft. during Q3 2017, with the addition of 1.1 million sq.ft. of office space being added in this quarter. New additions include office tower from One Central development, First Abu Dhabi bank building in Al Jadaf and low-rise office towers from Umm Al Sheif area.
�� Average office rents dropped by 4% year-on-year, while quarter-on-quarter the rates remained unchanged.
Leasing enquiries during the quarter mostly emanated from existing companies looking to migrate to newer buildings that offer quality space and market aligned rental rates.
�� Office sale rates remained stable during the quarter and registered a 3% drop year-on-year. In terms of rental decline by location development, Downtown Dubai recorded the highest annual drop of 7% followed by Barsha Heights at 5%.
Retail
�� With the addition of 9600,000 sq.ft. of gross leasable area (GLA), during Q3 2017 the total retail stock of Dubai account to 35.5 million sq.ft. GLA, as of end Q3 2017. During the quarter, Marsa Al Seef by Meraas located along the creek, a new retail destination, opened its door to public.
�� Challenging economic conditions, softening sales of luxury segment, rise in supply and online shopping penetration are putting pressure on the mall operators to review existing leases, as retailers are looking to downsize / consolidate their operations.
Hospitality
�� Hotel performance continues to be under pressure during the quarter, as a result of continued pricing competition in the market to retain desired occupancy levels during the summer period. On an average ADR’s dropped by around 10% during the quarter, as operators continue to focus on the overall revenue growth / stability.
�� With the addition of 585 rooms during the quarter, the total hotel supply of Dubai reached to 107,000 rooms and apartments. Looking at the ongoing construction activity, we expect c.800 rooms to enter during the last quarter of the year.

3
CONTENTSDemand Drivers 4
Macro Trends 6
Residential Sector 8
Project Focus 14
Office Sector 16
Retail Sector 22
Hospitality Sector 24
Definitions & Methodology 26
Contact Information 27
Supply - Photo Gallery 28
Development Location Map 30
MPM PROPERTIES FACTS AND FIGURES
TOTAL UAE STAFF PROPERTY MANAGEMENT STAFF ADVISORY STAFF
UNITS UNDER MANAGEMENT
LEASING & SALES STAFF LANDLORD CLIENTS
COMBINED MARKET VALUE OF PROPERTIES VALUED SINCE JANUARY 2012
MORTGAGE VALUATIONS SINCE JANUARY 2012
DEDICATED VALUATION PROFESSIONALS
OCCUPANCY RATE
LARGEST ABU DHABI MAINLAND PORTFOLIO
160+
7,600+
No.1
98.5%20+
30+
90bn
35+
23,500+
95+
1,700

REAL ESTATE SERVICES | DUBAI REAL ESTATE MARKET OVERVIEWQ3 2017
4
DEMAND DRIVERS
REAL ESTATE AND CONSTRUCTIONHEALTHY INVESTOR INTEREST FOR LARGE AND SMALL ASSETS
�� Damac Properties awarded AED628 million contract to Arabtec for building 1,296 villas in Akoya Oxygen development located between Emirates Road and Al Qudra Road. The masterplan development is spread across 55 million sq.ft. offering residential, retail, hospitality and entertainment components along with a 18 hole golf course. The construction is expected to commence in Q3 2017, with completion in 24 months.
�� Belhasa Engineering & Contracting Company
has won AED600 million contract from Deyaar Properties PJSC to build two districts of the Midtown project in Dubai Production City. The two districts of Afnan and Dania offer a total of 1,238 residential units comprising of studio, one, two and three bedroom units. The construction period for the two districts is expected to be completed within 29 months. The Midtown project comprises of a total of 27 buildings spread across six districts on a 1.2 million sq.ft. plot and is expected to have a built-up area of c.5 million sq.ft. on completion.
FREEZONES SIGNING UP NEW TENANTS; CREATING EMPLOYMENT OPPORTUNITIES
�� DMCC Freezone, master developer of Jumeirah Lakes Towers (JLT) announced construction of a 10 million sq.ft development ‘Uptown Dubai’ located in close proximity to JLT. The development comprises of seven towers atop seven levels of podium offering Grade A office space, 3,000 luxury apartments, 200 retail and F&B outlets along with luxury hotels. The development is expected to create over 10,000 new job opportunities.
�� Jebel Ali Freezone recorded a 17% growth across
non-oil foreign trade reaching 27.9 million tonnes in 2016 compared to 23.9 million tonnes in 2015. Machinery, electronics and electrical goods dominated the trade with a share of 49% followed by petrochemical, oil and gas sector 16% and food and FMCG at 8%. The total value of non-oil foreign trade valued at US$80.2 billion. In terms of trade by region, trade with Asia Pacific region accounted at US$32.4 billion followed by the Middle East at US$27.2 billion, the Europe US$9.9 billion, the Americas US$5.5 billion and Africa at US$5 billion.
GOVERNMENT INITIATIVESATTRACTING ENTREPRENEURS; IMPROVING EASE OF DOING BUSINESS
�� The President, His Highness Sheikh Khalifa bin Zayed Al Nahyan, has issued the Federal Law No. 7 of 2017 for Tax Procedures. The Law defines a clear set of common procedures and rules to be applied to all tax laws in the UAE and clearly states the respective rights and obligations of the Federal Tax Authority and the taxpayer. The Law covers tax procedures, audits, objections, refunds, collection, and obligations - which include tax registration, tax-return preparation, submissions, payment and voluntary disclosure rules - in addition to tax evasion and general provisions.
�� Dubai Holding has appointed Tecom Group to develop the Emirates Business Park project. The AED 5 billion mixed use project, includes four high rise towers and a number of other buildings. The new business park will offer premium office space along with three five-star hotels, plus food and beverage units, and a space dedicated to host events and other functions. Project is expected to start by the end of 2017 with completion due within four years.

REAL ESTATE SERVICES | DUBAI REAL ESTATE MARKET OVERVIEW Q3 2017
5
TOURISM INITIATIVES �� The Roads and Transport Authority (RTA) opened
a new bridge located at the intersection of Airport Road and Marrakech Street. The RTA has also awarded the second contract of Airport Road Improvement project valued at AED404 million which is expected to be completed by end of the year. The project includes an overpass on the Airport Road, with three lanes in each direction, a direct ramp from the bridge heading to Terminal 3 and building a two-lane tunnel to serve traffic heading left from Airport Road towards Marrakech Street.
�� A new station, Al Ittihad Park station opened along the Palm Monorail. The station is located
near the Shoreline apartments and offers direct access to the Palm Jumeirah’s central park and the Golden Mile Galleria mall. The Palm Monorail station network is expected to expand further with new stations been planned at the upcoming developments of Nakheel Mall and the Pointe.
�� Dubai International Airport handled 8.2 million passengers in August 2017, up by 6.6% compared to 7.7 million passengers in August 2016. YTD August 2017, passenger traffic increased by 6.3% to 59.3 million passengers, up from 55.8 million passengers during the same period last year.
TRANSPORTATION IMPROVING ACCESSIBILITY AND REACH IN DUBAI; CREATING JOBS
�� The UAE Cabinet approves visa on arrival at all ports to Indian passport holders carrying a valid EU or UK residency visa. An agreement was also signed between the UAE and the Pacific Island nation of Vanuatu exempting UAE nationals carrying diplomatic, private, VIP and regular passport holders and nationals of Vanuatu carrying diplomatic and private passports from obtaining pre-entry visas.
�� Figures from the Department of Tourism and Commerce Marketing (Dubai Tourism) indicate
a 8.2% rise in visitors to Dubai YTD August 2017 versus the same period last year. During the period YTD August 2017, Dubai had 10.4 million overnight visitors with 21% of the visitors originated from GCC countries, 20% from Western European countries, and 18% from South Asia. In terms of top source market, India ranks top with 1.32 million visitors followed by Saudi Arabia with 1.09 million visitors and the United Kingdom remained third with 0.81 million.
REAL ESTATE SERVICES | DUBAI REAL ESTATE MARKET OVERVIEWQ3 2017
6
MACRO TRENDS
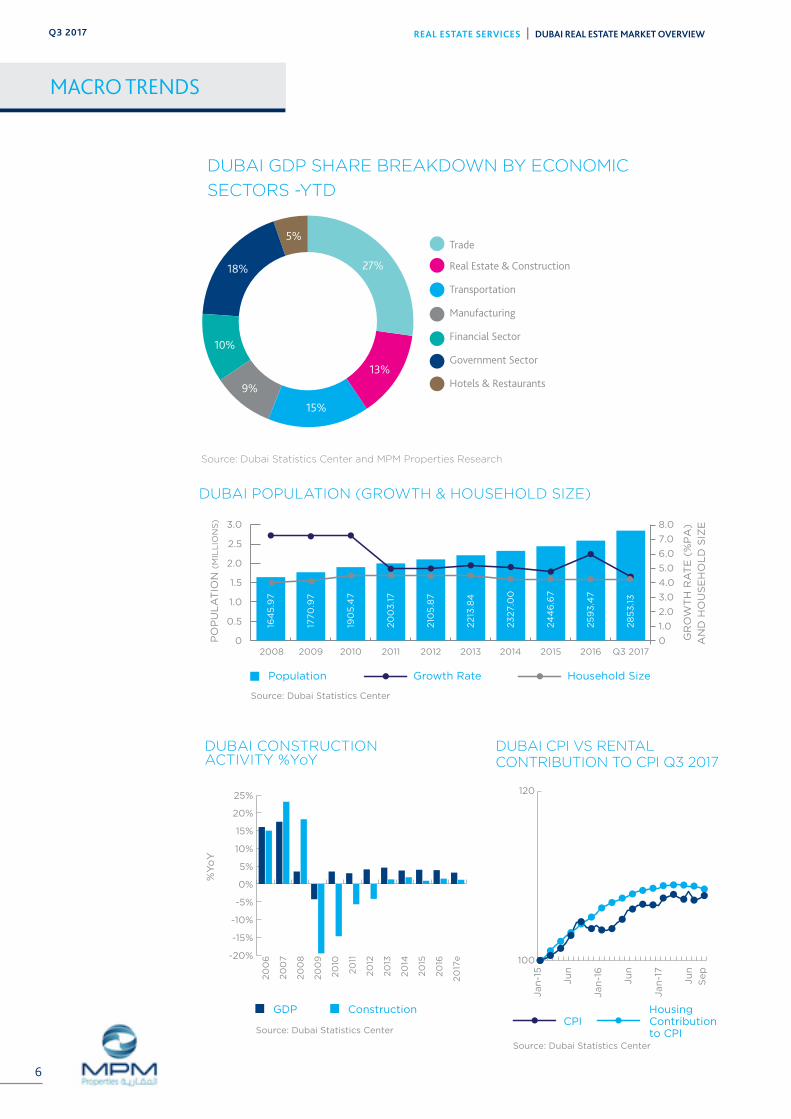
DUBAI POPULATION (GROWTH & HOUSEHOLD SIZE)
Population Growth Rate
2008
16
45
.97
1770
.97
19
05
.47
20
03
.17
210
5.8
7
2213
.84
23
27.0
0
24
46
.67
25
93
.47
28
53
.13
2009 2010 2011 2012 2013 2014 2016 Q3 20172015
3.0
2.5
2.0
1.5
1.0
0.5
0
8.0
7.0
6.0
5.0
4.0
3.0
2.0
1.0
0PO
PU
LA
TIO
N (
MIL
LIO
NS
)
GR
OW
TH
RA
TE
(%
PA
)
AN
D H
OU
SE
HO
LD
SIZ
E
Household Size
Source: Dubai Statistics Center
DUBAI CONSTRUCTIONACTIVITY %YoY
GDP Construction
%Y
oY
DUBAI CPI VS RENTALCONTRIBUTION TO CPI Q3 2017
CPIHousingContributionto CPISource: Dubai Statistics Center
Source: Dubai Statistics Center
20
06
20
07
20
08
20
09
20
10
20
11
20
12
20
13
20
14
20
15
20
16
20
17e
Jan
-15
Jan
-16
Jan
-17
Sep
Ju
n
Ju
n
Ju
n
-20%
-15%
-10%
-5%
0%
5%
10%
15%
20%
25%
100
120
Source: Dubai Statistics Center and MPM Properties Research
DUBAI GDP SHARE BREAKDOWN BY ECONOMIC
SECTORS -YTD
5%
27%
13%
15%
9%
10%
18%

REAL ESTATE SERVICES | DUBAI REAL ESTATE MARKET OVERVIEW Q3 2017
7
INVESTOR ANALYSIS
2012 2013 2014 2015 2016 2017-100%
-80%
-60%
-40%
-20%
0%
20%
40%
60%
80%
Valu
e (
in M
illio
ns)
Sales Transactions
Tra
nsa
cti
on
s
DUBAI LAND TRANSACTIONSVOLUME vs VALUE
Sales Value
4,000
2,000
0
6,000
8,000
10,000
12,000
0
5,000
10,000
15,000
20,000
25,000
30,000
2012 2013 2014 2015 2016 2017
DUBAI LAND TRANSACTIONSQoQ% CHANGE
Sales Transactions
Source: DLD and MPM Properties Research
* Established Real estate
Source: DLD and MPM Properties Research
TOP NATIONALITIES INVESTING IN DUBAI PROPERTY (JAN 2016 - JUN 2017)
0
200
400
600
800
1,000
Tra
nsa
cti
on
Valu
eA
ED
mill
ion
TOP LOCATIONS - RESIDENTIAL TRANSACTION VALUE
Q2 2017 Q3 2017
Source: DLD
Bu
sin
ess
Bay
Ju
meir
ah
Vill
ag
e
Du
bai
Sp
ort
s C
ity
Ju
meir
ah
Lakes
To
wers
Ara
bia
nR
an
ch
es
Palm
Ju
meir
ah
Ju
meir
ah
Beach
Resi
den
ce
Du
bai
Mari
na
Do
wn
tow
nD
ub
ai
Em
irate
sL
ivin
g
Valu
e (
AE
D' B
illio
ns)
LebanonUSAChinaEgyptJordanPakistanUnitedKingdom
SaudiArabia
IndiaUAE0
5
10
15
20
25
30
35
40
Source: DLD

REAL ESTATE SERVICES | DUBAI REAL ESTATE MARKET OVERVIEWQ3 2017
8
RESIDENTIAL SUPPLY �� With the addition of over 3,600 new units,
the total residential stock of Dubai reached 510,000 units as of Q3 2017. During the nine months of 2017, c.14,500 units were added with 75% being apartments and 25% villas/townhouses.
�� Looking at the ongoing construction activity, we expect a further 4,000 new units to be added during the last quarter of the year. Few of the projects that are expected to be handed over during the last quarter include Manara Tower, Reef Residence, Hub Canal 2, Zahra townhouses, Glitz 1 and 2, Yasmin and Samara villas.
�� Real estate projects offering over 9,000 new off-plan properties were launched during
this quarter. Launch of such high number of properties was due to Cityscape Global, the annual real estate exhibition. Furthermore, for the first time developers were allowed to sell properties during the event which led several developers to launch properties at the same time. According to the Dubai land department, AED870 million worth of off-plan properties was sold during the three day event.
�� A few of the projects launched include Azizi Riviera and MAG Eye in Meydan City, Parkland Residences and Views in Dubai South, Seven Residences on the Palm Jumeirah, IGO101 in Jumeirah Lakes Towers, Spanish and Arabian towers in Dubai Sports City.
0
100
200
300
400
500
600
2014 2015 2016 Q42017
Q32017
H12017
2018 2019
Source: MPM Properties Research
Supply Apartments
RESIDENTIAL SUPPLY BY UNITS 2013-2019
Existing Supply Villas +% Change
1.9% 2.7% 3.1% 2.2% 0.7% 1.1% 5.0% 3.8% YoY 3.1%
2013
444 452 469 481 496 507 511 516 542
8.5 14 11 11 8 3 173 1.2 4.2 34
4215
RESIDENTIAL SECTOR

REAL ESTATE SERVICES | DUBAI REAL ESTATE MARKET OVERVIEW Q3 2017
9
SAMPLE OF RESIDENTIAL UPCOMING PROJECTS
SAMPLE OF ANNOUNCED PROJECTS IN Q3 2017
NAME OF PROJECT TYPE DEVELOPER LOCATION
Bait Al Aseel Villa Damac Akoya Oxygen
Azizi Riviera Apartments Azizi Meydan
Bin Ghatti Stars Apartments Bin Ghatti Dubai Silicon Oasis
Spanish and Arabian Towers Apartments Dubai Sports City Dubai Sports City
J One Apartments RKM Durar Business Bay
O2 Apartments Tiger Properties Jumeirah Village Circle
Icon Bay Apartments Emaar Dubai Creek Harbour
Parklane Residences Apartments Dubai South Dubai South
Parklane Views Apartments Dubai South Dubai South
Al Haseen Residences Apartments City Properties Dubai Industrial Park
The Life Villa/Townhouses Jumeirah Luxury Living Jumeirah Golf Estates
IGO 101 Apartments Jumeirah Lakes Towers IGO
Seven Residences Apartments Seven Tides Palm Jumeirah
MAG Eye Villa/Townhouses MAG Meydan
Aston Plaza & Residences Apartments Aston Dubai Science Park
LOCATION PROPERTY NAME
Business Bay The Pad
Dubai Motor City OIA Residence
Dubai Studio City Glitz 1 & 2
Manara Tower Jumeirah Village Triangle
Reef Residence Jumeirah Village Circle
Piccadily Green Damac Hills
Zahra Townhouses Townsquare

REAL ESTATE SERVICES | DUBAI REAL ESTATE MARKET OVERVIEWQ3 2017
10
RESIDENTIAL SECTOR
Th
eG
reen
s
Ju
meir
ah
Beach
Resi
den
ce
Bu
sin
ess
Bay
Du
bai
Mari
na
Th
eV
iew
s
Palm
Ju
meir
ah
DIF
C
Old
To
wn
Do
wn
tow
nD
ub
ai
APARTMENT AVERAGE SALES PRICES (Q3 2017)AND PERCENTAGE CHANGE
AE
D/s
q.ft.
Source: MPM Properties Research
-1.2% -1.4% 0.0% -1.7% 0.0% 0.0% -1.9% -0.8%0.0% QoQ
YoY -7% -8% -3% -8% -2% -2% -6% -2%-6%
0
500
1,000
1,5002,000
2,500
2,0
00
1,775
1,75
0
1,5
00
1,4
75
1,3
75
1,23
0
1.3
00
1,20
0
SALE PRICES �� The total residential transactions (off-plan and
completed properties) during Q3 2017 were valued at AED13.87 billion. Of these, off-plan properties accounted for 70% of the transactions (AED9.81 billion) and the rest 30% towards completed properties.
�� Transactions for completed properties recorded a year-on-year increase of 4% in value terms and a marginal decline in volume. During Q3 2017 a total of 2,401 transactions were recorded at a value of AED4.06 billion compared to AED3.89 billion during the same period last year. However, quarter-on-quarter the decline has been substantial at 18.6%. Historically transactions during the third quarter of the year remain sluggish due to holiday and festive period.
�� In terms of transactions by unit type, apartments accounted for 65% valued at AED2.62 billion
while villas and townhouses accounted for 35% of the total transaction value at AED1.44 billion.
�� During the quarter, sale rates for villas and apartments recorded a marginal decline of 1% and 4.5% year-on-year. Within the villas segment, Arabian Ranches recorded the highest decline of 6.5% year-on-year while Downtown Dubai recorded a decline of 7% year-on-year within the apartment segment.
�� Substantial increase of off-plan properties is adversely affecting the sales of completed properties. Developers are not only incentivizing the customers with flexible payment plans but also agents with above market norm, commission structure in order to boost the sales.

REAL ESTATE SERVICES | DUBAI REAL ESTATE MARKET OVERVIEW Q3 2017
11
RENTS�� During the quarter residential rents soften by 1% while
year-on-year the decline was 6%. Multiple factors like addition of new residential units, increase in ownership and constrained job opportunities are impacting the rental rates and occupancy levels.
�� The highest rental decline within the leasehold areas was recorded across the traditional residential bases of Bur Dubai, Oud Metha, Al Barsha and Al Nahda, wherein the rates have dropped by over 7% year-on-year.
�� The highest brunt was noticed in Bur Dubai area with a 9% rental drop which was primarily due to migration of tenants from ageing structures that offer limited or lack facilities and amenities that are demanded by the tenants. The studio and two bedroom apartments recorded a decline of 11% year-on-year. The two bedroom apartments are currently achieving a rent of AED 82,000-110,000 per unit per annum as compared to AED95,000-120,000 per unit per annum in Q3 2016.
�� Within the freehold areas the highest drop was recorded across the developments of Palm Jumeirah, Downtown Dubai, Discovery Gardens and International City which saw
rents dropping by over 7% year-on-year. The rental decline has been largely noticed across high-end and affordable market segments while the mid-market segment recorded a modest drop.
�� Across the villa segment, Dubai Silicon Oasis, Palm Jumeirah, Springs and Jumeirah Park recorded a decline of over 7% year-on-year. The highest decline was in Jumeirah Park wherein rates dropped by 9% year-on-year, this is mainly due to high rental rates that prevailed at the start of handover and are currently adjusting to the market levels. The four bedroom units within the development dropped from AED190,000-240,000 per unit per annum in Q3 2017 to AED225,000-275,000 per unit per annum in Q3 2016.
�� The residential sector in terms of rental and occupancy performance is expected to remain under stress as substantial new supply is expected to enter the market over the course of next 15 months.
LOCATION STUDIO 1BR 2BR 3BR Q-ON-Q Y-ON-Y
Business Bay 60 78 115 153 -1.33% -6.61%
DIFC 78 105 138 205 -0.58% -5.85%
Discovery Gardens 44 65 90 - -2.29% -7.22%
Downtown Dubai 68 100 150 205 -1.29% -7.28%
Dubai Marina 60 88 130 183 -0.34% -5.32%
Greens 64 83 123 150 -0.88% -6.53%
International City 31 46 65 87 -1.30% -7.79%
Jumeirah Beach Residence
74 100 128 168 -1.71% -4.03%
Jumeirah Lakes Towers 57 85 113 145 -1.40% -3.93%
Palm Jumeirah 78 113 145 182 -1.32% -9.53%
Barsha Heights 57 75 98 130 -3.00% -6.82%
AVERAGE APARTMENT ANNUAL RENTS Q3 2017
Source: MPM Properties Research

REAL ESTATE SERVICES | DUBAI REAL ESTATE MARKET OVERVIEWQ3 2017
12
RESIDENTIAL SECTOR
PROJECT 2 BEDROOM 3 BEDROOM 4 BEDROOM 5 BEDROOM Q.O.Q Y.O.Y
Al Furjan - 155 - 215 -1.38% -2.14%
Arabian Ranches 138 175 225 280 -0.98% -6.78%
Dubai Sports City - 168 188 260 -1.60% -7.32%
Jumeirah Park - - 215 273 -1.59% -9.19%
Jumeirah Village 138 145 158 185 0.00% -6.47%
Meadows - 208 235 270 -0.40% -6.07%
Palm Jumeirah - 305 415 455 -1.31% -6.26%
Springs 120 163 - - -0.76% -7.42%
Jumeirah Islands - - 275 350 -0.70% -6.87%
Jumeirah Golf Estates - 235 290 360 -2.10% -10.54%
0
500
1,000
1,500
2,000
2,500
Al F
urj
an
Ju
meir
ah
Vill
ag
e
Sp
rin
gs
& M
ead
ow
s
Ju
meir
ah
Park
Ara
bia
nR
an
ch
es
Du
bai
Sp
ort
s C
ity
Th
eL
akes
Palm
Ju
meir
ah
AVERAGE VILLA SALE PRICE AED/ sq.ft. Q3 2017
AE
D/s
q.ft
Source: MPM Properties Research
0.0%
-3.0%
-2.0%
-7.0%
0.0%
-4.0%
-2.0%
-5.0%
0.0%
-5.0%
0.0%
-4.0%
-2.0%
-5.0%
0.0%
-4.0%
QoQ
YoY
2,4
00
1,275
1,10
0
1,0
50
1,0
50
1,0
00
95
0
975
AVERAGE VILLA ANNUAL RENTS Q3 2017
Source: MPM Properties Research
REAL ESTATE SERVICES | DUBAI REAL ESTATE MARKET OVERVIEW Q3 2017
13
350
500425
300
500
400
600
950
775
250
350300
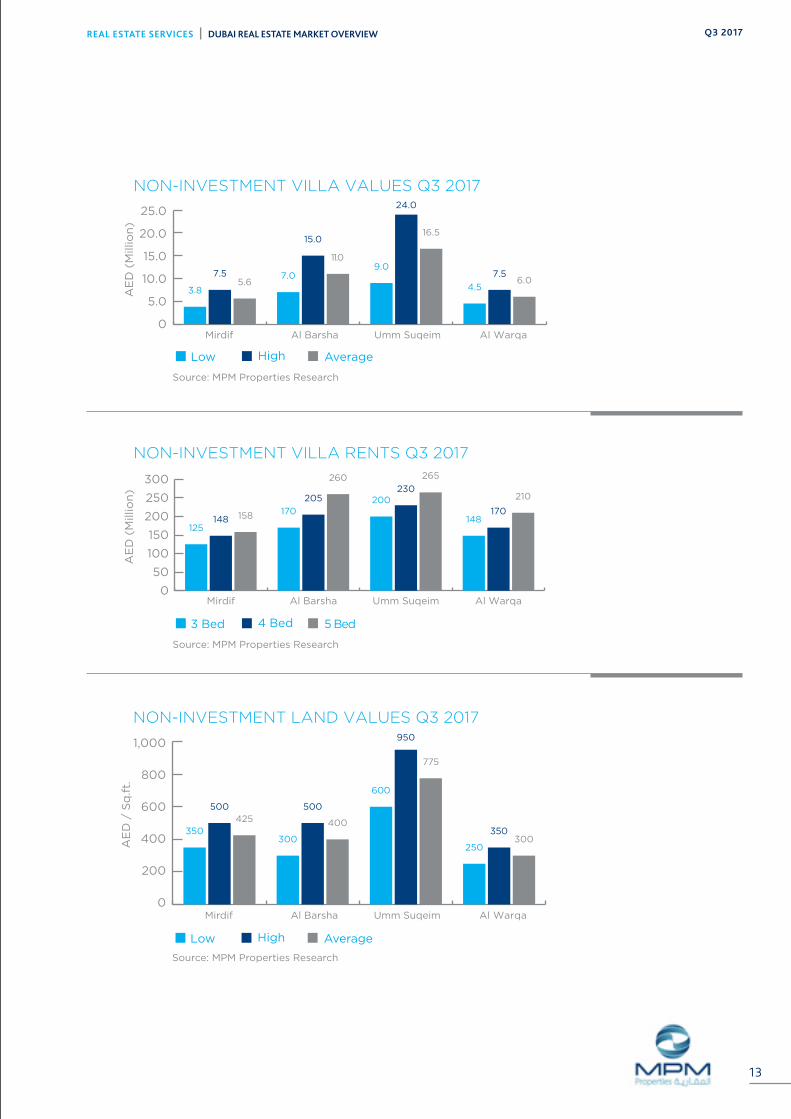
NON-INVESTMENT LAND VALUES Q3 2017
1,000
800
600
400
200
0
AE
D /
Sq
.ft.
Source: MPM Properties Research
Mirdif Al Barsha Umm Suqeim Al Warqa
HighLow Average
NON-INVESTMENT VILLA RENTS Q3 2017
AE
D (
Mill
ion
)
Source: MPM Properties Research
4 Bed3 Bed 5 Bed
0
50
100
150
200
250
300
Al WarqaUmm SuqeimAl BarshaMirdif
148170
210200230
265
170
205
260
125148 158
3.8
7.55.6
7.0
15.0
11.09.0
24.0
16.5
4.5
7.56.0
NON-INVESTMENT VILLA VALUES Q3 2017
25.0
20.0
15.0
10.0
5.0
0
AE
D (
Mill
ion
)
Source: MPM Properties Research
Mirdif Al Barsha Umm Suqeim Al Warqa
HighLow Average

REAL ESTATE SERVICES | DUBAI REAL ESTATE MARKET OVERVIEWQ3 2017
14
IMPERIAL AVENUE

REAL ESTATE SERVICES | DUBAI REAL ESTATE MARKET OVERVIEW Q3 2017
15
AMENITIES AND FACILITIES
PAYMENT PLAN
One of India’s oldest business conglomerates, Shapoorji Pallonji began as a humble infrastructure development company in 1865. Over the past 150 years, it has come a long way, created many a milestone and constructed world-renowned landmarks across the Indian subcontinent and beyond.
Imperial Avenue is the first real estate project by Shapoorji Pallonji outside India. Needless to mention, the company is
leaving no stone unturned to make exemplary statement with it. An exclusive collection of luxury homes, each in a class of its own, Imperial Avenue offers a chance to reside at the pinnacle of elegance in one of the world’s most celebrated neighbourhoods, Downtown Dubai. Located in a direct nod to Burj Khalifa, it is awe-inspiring, inside out. Right from its fluid design and sophisticated features to its unsurpassed amenities and prestigious location, it is a true jewel in the crown.
Dubai overtook London as the most preferred property investment location for 2017. This is testimony to the sector’s maturity and identity as a safe haven for investment, providing long-term returns. The total return analysis of real estate assets in Dubai stands between 5-11%.
An increase in the rate of economic expansion is expected in 2018 and 2019, underpinned by higher spending levels. For the country’s real estate markets, this is expected to translate into widespread stability and growth in some segments by the end of 2018.
We see a number of positive indicators for the UAE’s property market as we head towards the fourth quarter of 2017. While Expo 2020 is well documented as the shining light on the horizon, we view the government’s plan to introduce a formal tax regime as a tremendously positive step and are confident that it will help cement much-needed alternative revenue streams.
Cyrus EngineerManaging Director
�� 10,000 sq.ft. lobby
�� 2 Infinity pools
�� Apartments with Spacious Private decks
�� Grand Entrance
�� Indoor and outdoor kids play areas
�� Fitness Centre and Squash court
�� Exclusive Private AV room
�� Party Hall
�� 5% Down payment;
�� 40% during construction;
�� 55% on handover
17
UNIT TYPE AREA (SQ.FT.) STARTING PRICE (AED)
One bedroom 825 – 1,100 1.56 million
Two bedroom 1,350 – 1,750 2.5 million
Three bedroom 1,750 – 2,200 3.7 million
Four bedroom 3,065 – 5,100 7.6 million
Five bedroom 5,500 onwards 17.5 million
3,4,5 BR podium villa 3,710-5,935 7.7 million

REAL ESTATE SERVICES | DUBAI REAL ESTATE MARKET OVERVIEWQ3 2017
16
OFFICE SUMMARY �� The total office stock of Dubai reached 96
million sq.ft. during Q3 2017, with the addition of 1.1 million sq.ft. of office space being added in this quarter. New additions include office tower from One Central development, First Abu Dhabi bank building in Al Jadaf and low-rise office towers from Umm Al Sheif area.
�� Average office rents dropped by 4% year-on-year, while quarter-on-quarter the rates remained unchanged. Leasing enquiries during the quarter mostly emanated from
existing companies looking to migrate to newer buildings that offer quality space and market aligned rental rates. There are several fully fitted office space in the market that are offered at attractive rates and targeted towards new entrants and SME’s, which avoid incurring capital expenditure towards office fit outs.
�� Looking at the ongoing construction activity, close to a million sq.ft. of office space is due for completion during the last quarter which in anticipated to further inflate the vacancy rates.
OFFICE SECTOR
0
20
40
60
80
120
100
DUBAI OFFICE STOCK (2008 - 2019)
Mill
ion
sq
.ft.
20092008 2010 2011 2012 2013 2014 2015 2016 H12017
Stock Expected
Source: MPM Properties Research
20192018
0.91.10.83.56.82.50.26.0
6.010.0
8.06.0
96
2.8
97
3.8
1009594918481817569595145
Q32017
Q42017

REAL ESTATE SERVICES | DUBAI REAL ESTATE MARKET OVERVIEW Q3 2017
17
OFFICE SALES �� Office sale rates remained stable during the quarter
and registered a 3% drop year-on-year. In terms of rental decline by location development, Downtown Dubai recorded the highest annual drop of 7% followed by Barsha Heights at 5%. The sale rates in Downtown Dubai range from AED 1,700 – 2,400 per sq.ft. while in Barsha Heights it ranges between AED 750 – 1,050 per sq.ft.
�� During Q3 2017, office transactions were valued at AED453 million for a cumulative office space of 393,000 sq.ft. with an anticipated sale price of AED1,150 per sq.ft, an increase by 4.8% quarter-on-
quarter. The transaction activity remained strong for office with an area less than 2,500 sq.ft., accounting for 82% of the total transactions in Q3 2017.
�� The two business districts - Business Bay and Jumeirah Lakes Towers dominated the transaction market with over AED350 million worth of sales being concluded during the quarter. Business Bay recorded transactions worth AED254 million across 221,000 sq.ft. at an average of AED1,150 per sq.ft. while Jumeirah Lakes Towers saw transaction of 109,000 sq.ft. at a total value of AED102.4 million, at an average sale price / sq.ft. of AED940.
OFFICE SUPPLY �� The office rents remain flat during the quarter
while year-on-year the rates dropped by 4%. Few large office space enquiries are floating in the market from logistics, online trading companies and business centres who are looking for large floor space across consecutive floors in-close proximity to the metro network to facilitate easy movement for their workforce.
�� The office rents in the CBD area remained unchanged during the quarter, while a drop of 2% was recorded year-on-year. Average rents in the area range between AED85-240 per sq.ft. per annum (all inclusive).
�� The Business Bay area which accounts for 14% of the total existing office space, with majority being strata office space, recording a decline of 2% quarter-on-quarter and 7% year-on-year. The prevailing office rents range between AED65-190 per sq.ft. per annum (all inclusive).
�� Within the DIFC district, office space managed by the DIFC authority continues to record high occupancy and top-end rental rates. The worst impacted segment has been the strata owned office space within the area, which are currently being offered at an all-inclusive rate starting from AED125 per sq.ft. per annum.

Sheikh Mohamed Bin Zayed Rd.
Sheikh Mohamed Bin Zayed Rd.
Sheikh Mohamed Bin Zayed Rd.
Al Khail Road
Al Khail Road
daoR mi equS
mm
U
Sheikh Zayed Rd.
Sheikh Zayed Rd.
Sheikh Zayed Rd.
Arabian RanchesDubai
Land
DubaiLand
DubaiLand
DubaiLand
DubaiLand
Nad AlSheba 2
Nad Al Sheba
DubaiSilicon Oasis
InternationalCity
DragonMark
MushrifNational Park
Murdif
FestivalCity
TOSHARJAH
TOHATTA & OMAN
TOAL AIN
TOABU DHABI
TheLagoons
Business Bay Za’abeel
Garhoud
Al Qusais
Port Saeed
Rigga
Ras Al Khor
Al Marqadh
LegendsAl Barari
City of ArabiaGlobal Village
MotorCity
DubaiSport City
DubaiInvestment
Park 1
Jumeirah GolfEstates
Jumeirah GolfEstates
IMPZ
DubaiInvestment
Park 2
JumeirahVillage
JumeirahVillage South
The Meadows
Emirates Hills
The Springs
TheGardens
Jebel Ali Village
Jebel Ali Port
Jebel Ali Freezone
Jebel AliIndustrial Area
Dubai World Central Airport
DiscoveryGardens
JumeirahPark
JumeirahIslands
BarshaHeightsThe
Lakes
TheGreens
Naif
Al Raffa
SatwaJumeirah
Al WaslAl Safa
Umm Suqeim
The PalmJumeirah
Al SufouhMedia / Internet
CityJumeirah Lake
Towers
Dubai Marina
Burj Al Arab
The World
The Palm Deira
Al QuozIndustrial Area
Al Barsha
Al Quoz
Emirates Towers
DIFCBurj Khalifa
Karama
OudMetha
Al Mamzar
Port Rashid
DubaiInternational
Airport
OFFICE SECTOR
0
50
100
150
200
250
300
350
DIC
& D
MC
Bars
ha
Heig
hts
Ju
meir
ah
Lake T
ow
ers
Bu
sin
ess
Bay
Sh
eik
hZ
ayed
Rd
Do
wn
tow
nD
ub
ai
DIF
C
OFFICE RENTS AED/sq.ft. Q3 2017
AE
D/s
q.ft.
High Low
Source: MPM Properties Research
125
34
0
130
24
0
85
180
65 13
5 190
55
70 11
0
120 17
5
SHEIKH ZAYED RD.RENT = AED 85 - AED 180 /sq.ft.
DIC & DMCRENT = AED 120 - AED 175 /sq.ft.
BARSHA HEIGHTSRENT = AED 70 - AED 110 /sq.ft.AVG. SALE = AED 900 /sq.ft.
JUMEIRAH LAKES TOWERSRENT = AED 55 - AED 190 /sq.ft.AVG. SALE = AED 975 /sq.ft.
DOWNTOWN DUBAIRENT = AED 130 - AED 240 /sq.ft.AVG. SALE = AED 2,050 /sq.ft.
DIFCRENT = AED 125 - AED 340 /sq.ft.AVG. SALE = AED 1,750 /sq.ft.
BUSINESS BAYRENT = AED 65 - AED 135 /sq.ft.AVG. SALE = AED 1,050 /sq.ft.
REAL ESTATE SERVICES | DUBAI REAL ESTATE MARKET OVERVIEWQ3 2017
18 21
0
500
1,000
1,500
2,000
2,500
BarshaHeights
JumeirahLake Towers
BusinessBay
DubaiMarina
DIFCDowntownDubai
OFFICE AVERAGE SALE PRICES Q3 2017
AE
D /
sq
.ft.
-1.0%
-7.0%
0.0%
-3.0%
-1.0%
-1.0%
0.0%
0.0%
0.0%
-3.0%
0.0%
-5.0%
QoQ YoY
2,0501,750
1,4651,050 975 900

REAL ESTATE SERVICES | DUBAI REAL ESTATE MARKET OVERVIEWQ3 2017
19
RETAIL SECTOR
PRIME SHOPPING MALL AVERAGE RENTS – Q3 2017
An
ch
ors
Cin
em
a
Hyp
erm
ark
et
Min
i M
ajo
rs
Fla
gsh
ips
Rest
au
ran
ts
Fo
od
Co
urt
Lin
e S
ho
ps
1,2001,1001000900800700600500400300200100
0
AE
D/s
q.ft.
Source: MPM Properties Research
�� With the addition of 960,000 sq.ft. of gross leaseable area (GLA), the total retail stock of Dubai account to 35.5 million sq.ft. GLA, as of end Q3 2017. During the quarter, Marsa Al Seef by Meraas located along the creek, a new retail destination, opened its door to public.
�� Challenging economic conditions, softening sales of luxury segment, rise in supply and online shopping penetration are putting pressure on the mall operators to review existing leases, as retailers are looking to downsize / consolidate their operations. However, the impact remains marginal
across Grade “A” assets which continue to record strong occupancy and footfall figures. Secondary retail centres continue to struggle in their attempt to hold healthy occupancy and rental rates.
�� Looking at the current challenging market environment, it is important for properties under stress to review their retail mix and diversify the use of retail space to other related use in order to remain competitive in the market, while growing the revenues to desired levels.
RETAIL SUMMARY
22

REAL ESTATE SERVICES | DUBAI REAL ESTATE MARKET OVERVIEW Q3 2017
20
Source: MPM Properties Research
0
10
20
30
50
40
24.5 27.1 27.9 28.4 28.7 30.0 32.6 34.5 34.5
1.0
35.5
0.6
36.1
3.2
39.3
2.9
42.2
3.4
DUBAI RETAIL MALL STOCK (2010 - 2020)
GL
A s
q.ft.
(Mill
ion
s)
Stock Expected - *Includes all retail malls with a GLA greater than 25,000 sq.ft.
Source: MPM Properties Research
2010 2011 2012 2013 2014 2015 2016 H12017
Q32017
Q42017
2018 2019 2020
2.62.6 0.7 0.5 0.3 1.3
1.8 0.04
DUBAI RETAIL MALLS GLA BY AREA Q3 2017
12%
16%
14%
25%
33%
DUBAI RETAIL MALLS BY SIZE Q3 2017
DUBAI RETAIL SUPPLY (PRE-2010)
NEW SUPPLY DELIVERED 2010-Q3 2017
Neighborhood - 22%
Community - 14%
Regional - 16%
Sub-Regional - 18%
Super Regional - 30%
Neighborhood - 30%
Community - 20%
Regional - 18%
Sub-Regional - 6%
Super Regional - 23%
30%
20%18%
6%
23%22%
14%
16%18%
30%
19%
10%
13%
9%10%
4%
5%
6%3%
6%3%
8% 3%
Deira - 19%
Mirdif - 10%
Business Bay - 13%
Bur Dubai - 9%
Barsha - 10%
Dubailand - 4%
Dubai Marina - 5%
Jebel Ali - 6%
Jumeirah - 3%
Al Quoz - 6%
Al Wasl - 3%
Al Warsan - 8%
Other Areas - 3%
Neighborhood - 16%
Community - 12%
Regional - 14%
Sub-Regional - 25%
Super Regional - 33%
23

REAL ESTATE SERVICES | DUBAI REAL ESTATE MARKET OVERVIEWQ3 2017
21
HOSPITALITY SECTOR
HOTEL SUMMARY �� With the addition of 585 rooms during the
quarter, the total hotel supply of Dubai reached to 107,000 rooms and apartments. Looking at the ongoing construction activity, we expect c.800 rooms to enter during the last quarter of the year.
�� Hotel performance continues to be under pressure during the quarter, as a result of continued pricing competition in the market to retain desired occupancy levels during the summer period. Beach and key central business district properties are performing on par, while properties in other areas are being
challenged by falling ADR’s. On an average ADR’s dropped by around 10% during the quarter, as operators continue to focus on the overall revenue growth / stability.
�� Continuous growth in tourism numbers is helping the hospitality sector and creating confidence among existing and new hotel operators on the future growth of the sector. We expect the performance to improve during the last quarter, as several tourism initiatives are been lined up which include the opening of Dubai Safari, Dubai Frame and the Global Village.
DUBAI HOTEL ROOMS SUPPLY (2012 - 2019)
No
. o
f R
oo
ms
('0
00
s)
Existing Supply New Supply
Source: MPM Properties Research
418 4.7
6.8 3.3 0.6
H12017
Q32017
Q42017
2018 2019201620152012 2013 20140
30
60
90
120
150
79 80 84 9297 104 107
2.5
107
8.0
110
7.5
118
24

REAL ESTATE SERVICES | DUBAI REAL ESTATE MARKET OVERVIEW Q3 2017
22
0
200
400
600
800
1,000
1,200
DUBAI HOTELS PERFORMANCE - 2017 YTD
ADR RevPAR
Source: MPM Properties Research
Occupancy
100.0%90.0%80.0%70.0%60.0%50.0%40.0%30.0%20.0%10.0%0%
Jan
-14
May
Sep
Oct
Jan
-15
May
Sep
Jan
-16
May
Sep
Jan
-17
May
Sep
AE
D
Occu
pan
cy
HOTEL NAME LOCATION STAR DATE NUMBER OF KEYS
Mena Plaza Al Barsha 3 star Q3 2017 92
Omega Hotel Bur Dubai 4 star Q3 2017 238
The Retreat Palm Dubai Palm Jumeirah 5 star Q3 2017 255
HOTEL NAME LOCATION STAR DATE NUMBER OF KEYS
Waldorf AstoriaDubai International
Financial Centre5 star 2017 247
Creek Rotana & Arjaan Deira 4 star 2017 280
Bulgari Resort & Residences
Jumeirah Bay Island 5 star 2017 212
Park Inn by Radisson Motor City 4 star 2017 146
Renaissance Down-town Dubai
Business Bay 5 star 2017 298
HOTELS - NEW SUPPLY Q3 2017
SAMPLE OF UPCOMING SUPPLY
25

REAL ESTATE SERVICES | DUBAI REAL ESTATE MARKET OVERVIEWQ3 2017
23
DEFINITIONS & METHODOLOGY
RESEARCH STUDY AREA
The geographic extent of the study area covers the key districts in Dubai.
RESIDENTIAL
New residential developments are classified as delivered and thus entered into the new supply category when they are made available for occupation. This is verified via a combination of site inspections and discussion with the developer and hence our supply numbers do take into consideration the phased release of large projects.
Rental and sales trend analysis is based on transactional data derived from the MPM Properties Agency team and data sourced from developers and owners.
OFFICES
New office developments are classified as delivered and thus entered into the new supply category when they are available for tenant fit-outs.
Given the general lack of transparency in the local market rents quoted are headline rents, thus exclude any rent free period of other financial
incentives that may have been negotiated between the parties. The rents quoted are also exclusive of service charges.
RETAIL
New retail developments are classified as delivered and thus entered into the new supply category when the first units are open and trading.
Our classification of malls is based on our own assessment having regard to size and the catchment area which the mall typically penetrates.
HOSPITALITY
New hotels are classified as delivered and thus entered into the new supply category when they are opened and trading. All trading performance data is provided by DTCM.
FUTURE SUPPLY PROJECTIONS
Our future supply projections across all sectors are based on a combination of regular site inspections and discussions with developers.
BESPOKE CLIENT RESEARCH ADDING VALUE TO YOUR PROPERTY INTERESTSThe ADIB Real Estate Services team covers all sectors of the real estate market. We provide bespoke market research to our valued clients to meet their specific requirements.
We provide reports, information and presentations derived from primary market data that directly assist our clients to save or make money from real estate and shape strategies to enhance value.
DISCLAIMER:
The information contained in this report has been obtained from and is based upon sources that MPM Properties believes to be reliable, however, no warranty or representation, expressed or implied, is made to the accuracy or completeness of the information contained herein, and same is submitted subject to errors, omissions, change of price, rental or other conditions, withdrawal without notice, and to any special listing conditions imposed by our principals. MPM Properties will not be held responsible for any third-party contributions. All opinions and estimates included in this report constitute MPM Properties, as of the date of this report and are subject
to change without notice. Figures contained in this report are derived from a basket of locations highlighted in this report and therefore represent a snapshot of the Dubai market. Due care and attention has been used in the preparation of forecast information. However, actual results may vary from forecasts and any variation may be materially positive or negative. Forecasts, by their very nature, involve risk and uncertainty because they relate to future events and circumstances which are beyond MPM Properties’ control. For a full in-depth study of the market, please contact MPM Properties team.
26

REAL ESTATE SERVICES | DUBAI REAL ESTATE MARKET OVERVIEW Q3 2017
24
A collaborative team providing our integrated services
27
BALAJI NAGARAJ MSC MRICS Head of Residential Valuation Dubai & Northern Emirates T: +971 (0)4 371 9463 M: +971 (0)55 196 2396 [email protected]
CHARLES ANDREW CHAMBERS CEO T: +971 (0)2 610 0545 M: +971 (0)56 6773521 [email protected]
ABDULLAH SAID AL KUWEITI Business Development Director T: +971 (0)2 610 1554 M: +971 (0)50 623 5854 [email protected]
MOHAMMED FAHEEM Manager Strategic Advisory & Research T: +971 (0)4 371 9471 M: +971 (0)50 384 5220 [email protected]
WAHIDA KARAMA Head of Property Operations T: +971 (02) 610 0435 M: +971 (0)50 765 7679 [email protected]
STEPHEN DUNCAN FORBES Chief Operating Officer T: +971 (0)2 510 0687 M: +971 (0)54 777 3750 [email protected]
DOMINIC BARLOW Head of Retail, Hospitality & Leisure T: +971 (0)2 510 0655 M: +971 (0)56 288 1458 [email protected]
JUBRAN AL HASHMI Head of Property Services T: +971 (0)2 610 0232 M: +971 (0)50 122 0041 [email protected]
VINEET KUMAR Director of Agency – UAE T: +971 (0)4 371 9462 M: +971 (0)50 651 6491 [email protected]
VAIBHAV SHARMA MCOM; MDBA Chief Strategy Officer T: +971 (0)2 412 8914 M: +971 (0)50 660 9295 [email protected]
ALI ABDULLAH ABDUL RAHMAN Acting Regional Head – Northern Emirates T: 971 (0)6 597 2514 M: +971 (0)50 656 2486 [email protected]
MOHAMED AL ZOUBI Head of Development Advisory BSc Civil Engineering T: +971 (0)2 610 0564 M: +971 (0)50 310 3570 [email protected]
YOUSEF AL ZAROONI Regional Head – Al Ain T: +971 (0)3 708 8636 M: +971 (0)50 600 1002 [email protected]
PAUL MAISFIELD BSC (HONS) MRICS Head of UK Real Estate T: +44 (0) 20 7590 2234 M: +44 (0)7802 404868 [email protected]

SAMPLE OF UPCOMING PROJECTS – Q3 2017RESIDENTIAL
RETAIL
HOTEL
3 REEF RESIDENCE, JVC1 EMIRATES AIRLINES BUILDINGS
2 GLITZ 1 & 2, STUDIO CITY
4 ZAHRA TOWNHOUSES, TOWNSQUARE
OFFICE
4 THE EXCHANGE DIFC
1 DUBAI MALL EXTENSION DOWNTOWN DUBAI
2 NAKHEEL MALL PALM JUMEIRAH
3 PAVILLION BADRAH RESIDENCE
4 THE POINTE PALM JUMEIRAH
1 BULGARI RESORT & RESIDENCE
2 PARK INN MOTOR CITY
3 RENAISSANCE DOWNTOWN DUBAI
4 WALDORF ASTORIA DIFC
1 HSBC HQ DOWNTOWN DUBAI
2 THE COURT BUSINESS BAY
3 THE OPUS BUSINESS BAY
SUPPLY - PHOTO GALLERY
REAL ESTATE SERVICES | DUBAI REAL ESTATE MARKET OVERVIEWQ3 2017
28 29
NEW SUPPLY – Q3 2017RESIDENTIAL
RETAIL
HOTEL
3 SAFEER TOWER 2, BUSINESS BAY
4 SERENA, MAJAN2 MODELUX 1, INTL. CITY PHASE 2
1 CENTURION, DIP
OFFICE
1 FAB OFFICE BUILDING AL JADDAF
1 FIRST AVENUE MALL MOTOR CITY
2 MARSA AL SEEF BUR DUBAI
3 THE FAIRWAYS JGE
1 MENA PLAZA AL BARSHA
2 OMEGA HOTEL BUR DUBAI
3 THE RETREAT PALM DUBAI
2 OFFICE BUILDING UM AL SHEIF
3 OFFICE TOWER UM AL SHEIF

TOABU DHABI
Jebel Ali Port
Jebel Ali FreezoneBarshaHeights
Al Mamzar
Al Qusais
1
2
3
231
3
3
4
1
2
3
3
4 1
2
2
3
3
1
2
2
1
1
4
4
2
4
1
Residential
Offices
Retail
Hotels
Q3 2016 NEW SUPPLY
Residential
Offices
Retail
Hotels
UNDER CONSTRUCTION
Q3 2017
30 31

INTEGRATED SERVICES COVERING THE FULL PROPERTY LIFECYCLE
Property Management
Investment Advisory
Project Management and ESCROW
Research & Strategic AdvisoryAgency (Sales & Leasing)
Valuation
VAIBHAV SHARMA MCOM; MDBA Chief Strategy Officer T: +971 (0)2 412 8914 M: +971 (0)50 660 9295 [email protected]
ABU DHABI HEAD OFFICE 6th Floor, Al Wahda Tower P.O Box 114686 Abu Dhabi
Tel. +971 2 610 0252Fax. +971 2 610 0514 www.mpmproperties.ae
DUBAI OFFICE Office 2301,2303,2305 - Level 123 Arenco Tower, Dubai Internet City Dubai
Tel. +971 (0)4 371 9462
AL AIN OFFICE 201-204 ADIB Ladies Branch Building Oud Touba Street Al Ain
Tel. +971 (0)3 703 9521
SHARJAH OFFICE Sarh Al Emarat Tower Buheira CornicheSharjah
Tel. +971 (0)6 597 2555
Enhancing value for individual & institutional property owners:
�� Prompt leasing & debt collection
�� Effectively market & lease vacant units
�� Physical & technical maintenance of asset
�� Maintain tenant satisfaction
�� Timely lease renewals
�� Manage risk, insurance & litigation
�� Protect your interests and enhance value
Complete Project Management services at planning & construction stage:
�� Engineering Review & Scheduling
�� Cost Estimate & Procurement
�� Project Monitoring
�� Cost Control & Accounting
�� Assist with Permits & Licensing
�� Ensure appropriate fund movement for Escrow based on Project Assessment
Aiding developers and investors to maximize value:
�� Investment Advisory & Due Diligence
�� Investment Management
�� Disposal Strategy
�� Portfolio Review & Optimization
�� Deal Structuring & Capital Sourcing
�� Investment Sale
We work with developers, commercial tenants, retailers and individuals, offering:
�� Launch Strategy
�� Project Launch Handling
�� Project Marketing Events
�� Acquisitions
�� Leasing
�� Sales
We cover all sectors, including residential, commercial, industrial, retail, and land.
Bankable studies for your real estate and business needs:
�� Highest & Best Use
�� Market & Financial Feasibility
�� Development Strategy
�� Market Research
�� Corporate Real Estate Strategy
�� Master-plan and design review
Valuation reports for:
�� Mortgage & Loan Security
�� Securing Project Funding
�� Internal Accounting
�� Mergers & Acquisitions
�� Investment appraisal
�� Litigation
�� Inheritance
We cover all asset classes. Our reports are in compliance with the International Valuation Standards (IVS) and the RICS Professional Valuation Standards.
CHARLES ANDREW CHAMBERS CEO T: +971 (0)2 610 0545 M: +971 (0)56 6773521 [email protected]