Embed Size (px)
Citation preview
Grant Agreement: 644047
INtegrated TOol chain for model-based design of CPSs
DSE in the INTO-CPS Platform
Deliverable Number: D5.2d
Version: 1.0
Date: 2016
Public Document
http://into-cps.au.dk

D5.2d - DSE in the INTO-CPS Platform (Public)
Contributors:
Carl Gamble, UNEW
Editors:
Carl Gamble, UNEW
Reviewers:
Thierry Lecomte, CLEJulien Ouy, CLEEtienne Brosse, STMartin Peter Christiansen, AI
Consortium:
Aarhus University AU Newcastle University UNEWUniversity of York UY Linköping University LIUVerified Systems International GmbH VSI Controllab Products CLPClearSy CLE TWT GmbH TWTAgro Intelligence AI United Technologies UTRCSofteam ST
2

D5.2d - DSE in the INTO-CPS Platform (Public)
Document History
Ver Date Author Description0.1 2016-11-7 Carl Gamble Initial draft for review0.2 2016-12-6 Carl Gamble Abstract added1.0 2016-12-8 Carl Gamble Internal review comments addressed
3
D5.2d - DSE in the INTO-CPS Platform (Public)
Abstract
This deliverable presents the state of the work of Task T5.1. The first partincludes information gathered from the industrial partners of INTO-CPSoutlining the goals for DSE in each of their case studies. The second partgives details of the current state and outline plans for components of theDSE module including the current file and folder structure; a walkthroughof the DSE config file section describing the affect each has upon the DSEprocess; an outline of the DSE drivers currently available along with the othersupport files for handling interaction with the COE and presenting resultsand concludes with a description of how the analysis developed for DSE maybe applied to single simulations so they may form part of the data set usedto generate ranking reports.
There are methodological elements to DSE presented in deliverable D3.2a[FGPP16]. This includes the analysis of requirements and decomposition ofthe problem using the INTO-CPS SysML profile and initial results assessthe effectiveness of the genetic algorithm when applied to a range of designspaces
4

D5.2d - DSE in the INTO-CPS Platform (Public)
Contents1 Introduction 6
2 Related Work 6
3 INTO-CPS Case Study DSE Goals 83.1 Agro Intelligence . . . . . . . . . . . . . . . . . . . . . . . . . 83.2 TWT Gmbh . . . . . . . . . . . . . . . . . . . . . . . . . . . . 93.3 ClearSy . . . . . . . . . . . . . . . . . . . . . . . . . . . . . . 113.4 United Technologies . . . . . . . . . . . . . . . . . . . . . . . . 123.5 Key Points from the Case Studies . . . . . . . . . . . . . . . . 14
4 DSE Component Status and Plans 154.1 Module Overview . . . . . . . . . . . . . . . . . . . . . . . . . 154.2 DSE Config File . . . . . . . . . . . . . . . . . . . . . . . . . . 164.3 Search Algorithms . . . . . . . . . . . . . . . . . . . . . . . . 254.4 COE Handler . . . . . . . . . . . . . . . . . . . . . . . . . . . 274.5 Results Presentation . . . . . . . . . . . . . . . . . . . . . . . 274.6 App Integration . . . . . . . . . . . . . . . . . . . . . . . . . . 294.7 Analysis Available to Single Simulations . . . . . . . . . . . . 29
5 List of Acronyms 33
5

D5.2d - DSE in the INTO-CPS Platform (Public)
1 Introduction
Design Space Exploration is a significant addition to the INTO-CPS toolchain and so touches on several parts. Recently work has begun on definingDSE configuration details early on in the INTO-CPS workflows in SysML,this work on defining and using a SysML profile is presented in [FGPP16]. Adescription of how to use the DSE features is presented in the INTO-CPS usermanual [BLL+16]. This document focusses on the tool support around DSE,providing a description of the structure, the current status and plans forthe final year (Section 4). The deliverable also touches upon related work(Section 2) and recounts the description of the work package 1 case studiesand their expectations for using DSE (Section 3).
2 Related Work
In the DESTECS project1 DSE was supported by applying Automated Co-model Analysis (ACA), such as parameter sweep. The project also providedsupport for testing different model implementations. The project providedmethodological guidelines for DSE in [BFG+12] and [FLPV13] and tool sup-port for the Crescendo in the form of ACA [NBAR+12]. INTO-CPS will usethe methods work from DESTECS as a baseline, extended with wider rangeof analysis techniques and including closed loop support.
The Certainty project2 uses DSE in the DOL-Critical method; using theresults of interference analysis reliability analysis to evaluate potential map-ping and scheduling solutions of tasks to cores on multi-core platforms.The project includes several tools: “the EXPO tool is the central moduleof the framework. As an underlying multi-objective search algorithm, theStrength Pareto Evolutionary Algorithm (SPEA2) is used that communicateswith EXPO via the PISA interface” [CER13a]. The project also proposesthe “Mixed Criticality Mapping and Scheduling Optimisation (MCMSO)method” which implements a heuristic method based on simulated anneal-ing [CER13b]. Both the implementation and methods developed by Cer-tainty will influence DSE in INTO-CPS, in particular the use of simulatedannealing and Pareto Front techniques. It is not clear to what extent thiswork is ‘closed-loop’, one focus of DSE in INTO-CPS.
1http://www.destecs.org/2http://www.certainty-project.eu/
6
D5.2d - DSE in the INTO-CPS Platform (Public)
As part of an integrated tool chain for high-level synthesis of high-performanceFPGA systems, the ENOSYS 3 project uses two tools for DSE: FalconML4
and Jink 5. The Jink Design Space Explorer coordinates a design flow andits exploration engine searches over various parameters used in customisingthe soft core multi processor and in partitioning the UML design to the un-derlying architecture. Jink finally parses over the various logs and reportsfiles produced by the various tools during synthesis, compilation, simulationto extract various design characteristics and metrics. This work is limitedto FPGA design and it is not clear to what extent this work is ‘closed-loop’, or which ranking or analysis methods are used. Further investigationis required to determine the extent of influence these outputs may have onINTO-CPS.
The ongoing AXIOM 6 project will provide DSE, with a deliverable on DSEdue in M24 of the project (January 2017). DSE technologies will be used inthe development of the software parts and the selection of the most appro-priate hardware architecture and interconnect.
MADNESS 7 use traditional methods for DSE, alongside their “co-exploration”which uses different search algorithms for different dimensions and they re-port that “multidimensional co-exploration can find better design points andevaluates a higher diversity of design alternatives as compared to the moretraditional approach of using a single search algorithm for all dimensions.”We have been unable to obtain public deliverables.
In the iCyPhy project8, effort is placed to reduce the design space for DSEthrough optimal architecture selection [FNSV15]. A routine is defined tooptimise the continuous parameters of a CPS to decrease the number ofsimulations.
The DARPA AVM META project9 defines the CyPhyML for the modellingof CPSs. The project uses the Design Space Exploration Tool (DESSERT)to prune the design space to a “manageable size”. INTO-CPS should considerthe DESSERT technology and its methods for design space reduction.
The Merlin project10 produced a suit of tools collectively called the Strategic3https://sites.google.com/a/enosys-project.eu/www/home4https://sites.google.com/a/enosysproject.eu/www/enosys-tools/falconml5https://sites.google.com/a/enosys-project.eu/www/enosys-tools/jink6http://www.axiom-project.eu7http://www.madnessproject.org/8http://www.icyphy.org/index.html9http://cps-vo.org/group/avm/meta
10http://www.ncl.ac.uk/newrail/research/project/4392
7
D5.2d - DSE in the INTO-CPS Platform (Public)
Decision Making Tool (SDMT) to facilitate exploring the design space withinthe rail domain. This suite consists of a core tool that orchestrates the DSE,an optimisation tool responsible for driving the DSE through the use of agenetic algorithm and pareto optimality analysis and a costing analysis tooltasked with computing the electrical costs part of the simulation results. Thisproject makes explicit something akin to architectural aspects of the designspace by allowing the use of clusters, where each cluster may have differentsets of parameters and constraints but all are ultimately compared using thesame objective values.
3 INTO-CPS Case Study DSE Goals
In this section the case study owners present details of their scenarios fromfour distinct viewpoints. These viewpoints consider the parameters thatare present in each scenario, how each scenario will be measured, how theresults of each design will be compared to rank the designs and how theresults could be presented. These aspects will affect the direction of the DSEmodule scripts over the next two years of the project.
3.1 Agro Intelligence
3.1.1 Design Parameters
In the agricultural case study, we have two categories of parameters. Thefirst category defines the robot and its operation conditions. The secondcategory defines the parameters of the surrounding environments. The firstcategory has internal dependencies, like total weight, wheel size/operationspeed, sensors and control software. But there are also dependencies betweenthe two categories, the wheel slip will affect the operating speed and thesurface type will affect the wheel slip. Crop type will affect the width of therobot because the robot needs to fit the row distance for the current crop.Current placement of the robot in the environment has a significant impacton how the controller should operate in terms of movement and operationalstrategy.
8
D5.2d - DSE in the INTO-CPS Platform (Public)
3.1.2 Solution Objectives
The simulation goal for the agro-case is to determine viable candidate robotconfigurations for a given scenario. The scenarios are defined by the imple-ment, crop, and surface type. The parameters that the robot design shouldbe optimised for are navigation and implement response in the environment.The result should be a list of configuration parameters that can be used inthe robot design.
3.1.3 Ranking of solutions
Similarly to the automotive case discussed in Section 3.2.3, the different robotdesigns will be compared by a cost function. The evaluation criteria of thecost function will be total cost and operational performance of the robot inthe given scenario and configuration.
3.1.4 Results Presentation
The result of the simulation should be presented in an interactive manner,where the company developers can select the parameter he/she want to evalu-ate for a specific scenario. It should be possible to select several parameters,e.g. robot vehicle implement, wheel size, and sensory types. The resultshould be presented in a list and a graph so the user can see the how theresult compares to each other. It should be possible to select the individualsimulations to see a detailed description of the scenario.
3.2 TWT Gmbh
3.2.1 Design Parameters
For the automotive case study, two categories of parameters can be differ-entiated: The first group of design parameters that can be varied during anDSE experiment defines the vehicle: vehicle mass, aerodynamic drag coeffi-cient cw, rolling friction coefficient crr, battery capacity C, and the full loadcurve, defined by the maximum engine speed nmax and the maximum torqueMmax. The second set of parameters defines the route the vehicle takes toget from the start position to its destination. These parameters can be de-scribed as a set of coordinates. For a typical DSE experiment in the context
9
D5.2d - DSE in the INTO-CPS Platform (Public)
of INTO-CPS, the first set of parameters, defining the vehicle, is most likelythe more relevant group.
The vehicle design parameters can depend on each other, e.g. the batterycapacity has an influence on the total mass.
3.2.2 Solution Objectives
The simulation results that are of most interest for the automotive case studyare relatively directly measurable. They include: the maximum accelerationshould not be higher than a specific value (e.g. 4ms−2), the time that ittakes to travel a certain distance, the time it takes to achieve a temperatureinside the vehicle within the comfort zone (Tmin < T < Tmax).
3.2.3 Ranking of solutions
Different designs (i.e. vehicle configurations) are compared by using a cost-function that has parameters such as total vehicle cost, energy consumption,space, and mass. In particular, electric vehicles are optimized using costfunctions that include the battery capacity, energy consumption, mass, driv-ing performance, efficiency per component, and energy at the tire. Hybridvehicles have cost functions that include the battery capacity, power of theelectric motor, power of the combustion motor, range, energy consumption,driving performance, and efficiency of components. These cost functions arehowever individual for each automobile manufacturer and depend on the spe-cific problem that needs to be solved. Therefore, there are no universal costfunctions or rules for ranking of results.
3.2.4 Results Presentation
The range of electric vehicles is typically presented as a bar diagram fordifferent vehicle configurations. For hybrid vehicles, the results could beshown in a 3D-plot, with the different working points of the combustionmotor as the second parameter axis.
10

D5.2d - DSE in the INTO-CPS Platform (Public)
3.3 ClearSy
3.3.1 Design Parameters
For the railway case study, two kinds of parameters can be differenciated.The first group of parameters correspond to real numbers (or function ofreal numbers) such as Kinetic energy, communication or physical movementdelay, track length, track slope (function of position) or traction acceleration(function of speed), or breaking force.The other group of parameters is rather a choice of decomposition of a wholetrack map into several distributed one, and the corresponding distributedinterlocking. Thus, such parameters are a set of subsets of the track mapdatabase tuples. One can also consider a varying number of trains.The parameters may be related, such as minimal and maximal Kinetic energy,or minimal or maximal slope, or traction acceleration.
3.3.2 Solution Objectives
There are two kinds of measurement. The first kind of measurement areextremal values of monitored real number variables such as: train trip delay,Kinetic energy, train availability. The other kind of measurement is whetherone train will overun another and collide, or whether two train collide be-cause of an error in the interlocking PLCs. The two kinds may be dependent:one may want to measure availability but only in the case there is no colli-sion.
3.3.3 Ranking of solutions
The preference value for solution objective may be the maximal or minimalvalue while such and such parameters vary (ex: track map distribution ortraction vary and then the simulation tool would try to find the minimaltrain trip delay).
It is not clear what is the link between train trip delay and train availabil-ity. In this case, a curve with at least an extremal value (for instance theavailability) in function of train trip delay could be fine (train trip delaycomputed with the other parameters the number of train, track map decom-position).
11
D5.2d - DSE in the INTO-CPS Platform (Public)
3.3.4 Results Presentation
The presentation for simple objective value would be a table or curve witha few significative simulations and showing the extremal objective value(s).For the case of a limit value is overun (such as maximal allowed speed,overun of train so positions overrunning, or collision with same), it couldbe interesting to show similar table or curve in the neighbourhood of thislimit value. Finally, it should be interesting to show XY curve for showingtrade off between two competitive objectives such as availability vs train tripdelay.
3.4 United Technologies
3.4.1 Design Parameters
DSE is used in building automation to: (a) identify the optimal equipmentand control settings for an existing building; (b) study the equipment scal-ability over different building thermal characteristics. In the following wehighlight the key design parameters used in the building automation casestudy:
• Equipment Design Parameters: tuning these parameters lead to iden-tify the optimal thermal supply settings to a building using Fan CoilUnits (FCUs).
1. Maximum water flow rate: m·water ∈ [0.08 : 0.12]
2. Maximum air flow rate: m·air ∈ [0.4 : 0.6]
3. Water coil efficiency: εcoil ∈ [0.1 : 1]
• Control Design Parameters: tuning these parameters lead to identifythe optimal PID control response to the building thermal load.
1. Proportional set-point weighting: Kp ∈ [0 : 1]
2. Derivative set-point weighting: Kd ∈ [0 : 1]
• Plant Design Parameters: these parameters are used to express dif-ferent building heat dissipation characteristics. The building thermalparameters are varied based on ASHRAE fundamentals 2013 standard.
1. Wall density: ρwall ∈ [960 : 1600]
2. Wall thermal conductivity: λwall ∈ [0.0865 : 0.1298]
12
D5.2d - DSE in the INTO-CPS Platform (Public)
Considering that these parameters are independent, then the search space foroptimizing equipment setting is m·
water ×m·air × εcoil ×Kp ×Kd . Whereas,
the search space for equipment scalability study is ρwall × λwall.
3.4.2 Solution Objectives
The objective of a building automation system is to maintain the user com-fort, while minimizing the energy consumption. In our case study, the usercomfort is represented as the room air temperature RAT , whereas morecomfort metrics can be taken in account, such as CO2 and humidity. Theautomation system maintains the RAT in the comfort band identified asRATsp ± 1oC, where RATsp is the RAT set-point identified by the user orthe building manager. Therfore, evaluating these performance metrics re-quires observation of the following dependent variables:
1. Room Air Temperature RAT
2. Room Air Temperature Set-point RATsp
3. Supplied Power Qin
3.4.3 Ranking of solutions
In order to rank the search space solutions, we formulate two evaluationmetrics as follows:
• User discomfort UD is calculated as the area between RAT and RATspcurves. In order to minimize the user discomfort, the RAT needs to re-spect the RATsp. RMSE (Root Mean Square Error) is used to quantifythe user discomfort as follows, where N is the total number of samples:
UD =
√√√√∑Nk=1
[RATsp(k)−RAT (k)
]2N
(1)
• Energy Consumption E is calculated as the integration of the usedpower Qin over the time. In order to calculate the energy consumption,Coefficient Of Performance (COP) of the heat pump (HP) requiredto be considered as follows (i.e. COP=2.6), where T is the sampleduration :
E =N∑k=1
Qin(k) ∗ TCOP
(2)
13

D5.2d - DSE in the INTO-CPS Platform (Public)
Optimizing the building performance requires minimizing both metricsMin(UD,E).However decreasing one of them leads to increase the other, therefore a paretofrontier is required to be evaluated in order to identify the optimal designparameters.
3.4.4 Results Presentation
Considering the building automation is a multi-objective optimization prob-lem, then we present the DSE results in an nD plot, where n is the numberof the optimization criteria. In our case study, we optimize the buildingautomation against two optimization criteria, i.e. E, UD. Therefore, thesearch space will be presented in a 2D plot that captures E and UD valuesfor different configurations.
3.5 Key Points from the Case Studies
There are many key points from these descriptions that we can extractand take into account during the future development of the DSE modelscripts.
• Each of the scenarios has a mixture of both design parameters of thesystem itself and parameters defining the environment in which thesystem is to operate. While these both contribute to the total designspace to be explored it is important that we differentiate between themwhen, for example, grouping results by design.
• There are sometimes relations between simulation parameters meaningthat not all combinations are valid, for example in the AI case study,the surface type of the ground affects the wheel slip parameter and inthe TWT case study various parameters of the vehicles are linked, suchas the battery capacity of an electric vehicle and its total mass. Theparameter sweep should only visit parameter sets that respect theseconstraints.
• There is a range of different complexity levels when processing the rawsimulation results to derive the objective measures needed to assesseach simulation. Some are instantaneous measures that may be directlyprovided by the simulation outputs, such as the maximum accelerationof a vehicle, which others require more complex assessment. Exam-ples include the time taken for the car cabin temperature to reach a
14
D5.2d - DSE in the INTO-CPS Platform (Public)
comfortable level, the cumulative occupant comfort level in the UTRCscenario and computation of the turning radius in the AI study.
• There are also constraints over the variables in the simulations thatmust not be breached, an example of this is the detection of collision oftwo trains in the CLE case study. Such a constraint results in a booleanpass or fail that should be recorded amongst the objective results. Itmay be advantageous to terminate a simulation when a constraint isbreached to reduce wasted CPU time but this is outside the currentplanned capabilities of the DSE module.
• The UTRC case study explicitly calls for a pareto optimal type analysisto compare and rank the design results the TWT case study calls forcost functions that take into account multiple design parameters andsimulation results and are unique to each vehicle simulated.
• In terms of presentation the case studies propose a range of visuali-sations from being able to select a range of graph types such as bargraphs, 2D and 3D plots. These plots could show a range parameterand results or focus in on interesting areas such as the neighbourhoodaround the maximum speed of a train. These are alongside the abilityto compare any two values on an XY plot style and also pareto optimalstyle plots.
4 DSE Component Status and Plans
4.1 Module Overview
The DSE module comprises multiple python scripts, configuration files, anal-ysis files and files used to store DSE progress and results. Figures 1 & 2 showthe entities associated with DSE. Within an INTO-CPS project folder, theprimary element is the dseConfig which contains details defining the designspace to be searched, how to search it, how to measure the results and howto compare results. Paths to the dseConfig and the mm.json file describingthe model to be used are passed to the search algorithm script to start theDSE process. The search algorithm creates a date-time folder to store resultsand creates a subfolder for each simulation it needs to run. The subfoldercontains a config file containing the complete multi-model details includingthe specific parameters for that simulation. The COE hanlder script sendsthe contents of the config files to the COE, launches the simulation, retrieves
15

D5.2d - DSE in the INTO-CPS Platform (Public)
Figure 1: Folders and file used by DSE in an INTO-CPS project
the raw result and saves it in the results.csv file.
With the raw results in place, the search algorithm invokes the analysis de-fined in the dseConfig which making use of the built in simple objective scriptsand/or user defined scripts, represented here by analysis.py. In the case ofthe user defined analysis, the script is passed a path to a scenario folder, inthis case scen. 1 in which it will find a data file related to that scenarioif needed, such as the map for a line following robot, here represented byanalysis data. Both types of analysis store their results (objective values)in the objectives.json file appropriate for the simulation. The results in theobjectives.json files are used by the ranking script, to compare all results,with the resulting rankings over the whole DSE experiment being stored inthe ranking file. Finally the stored rankings are used by the output scriptswhich generates the dseResult that is presented to the user.
4.2 DSE Config File
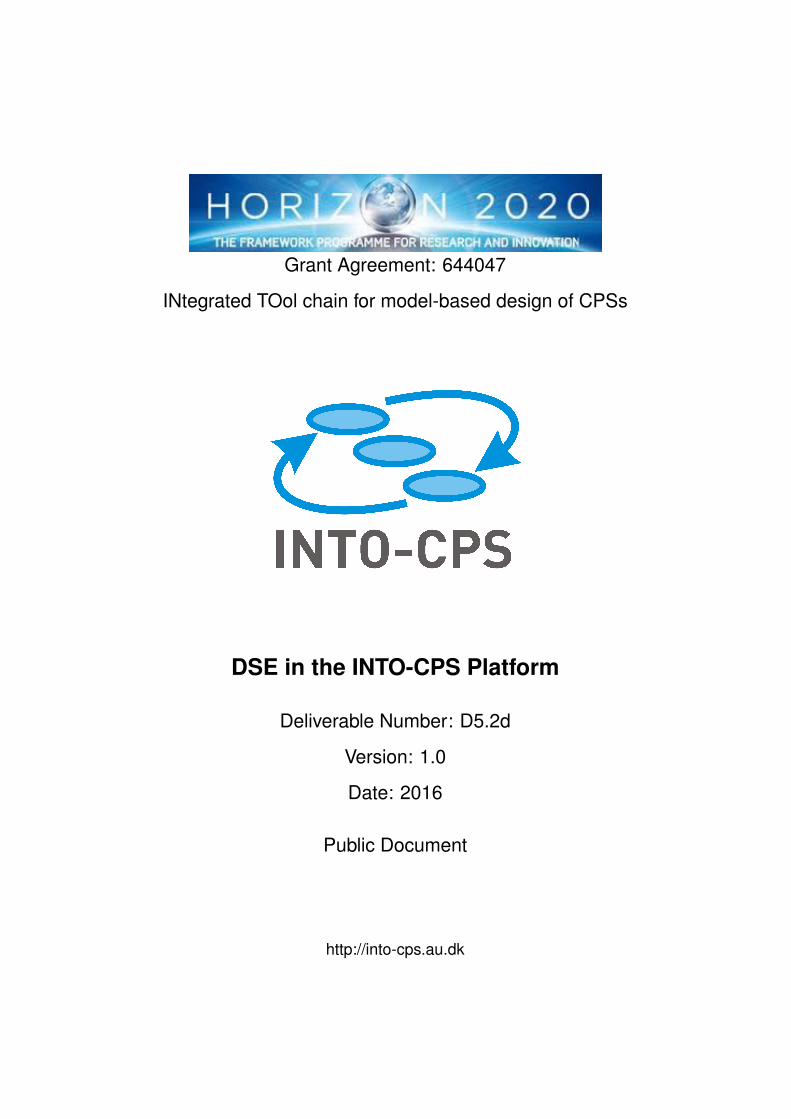
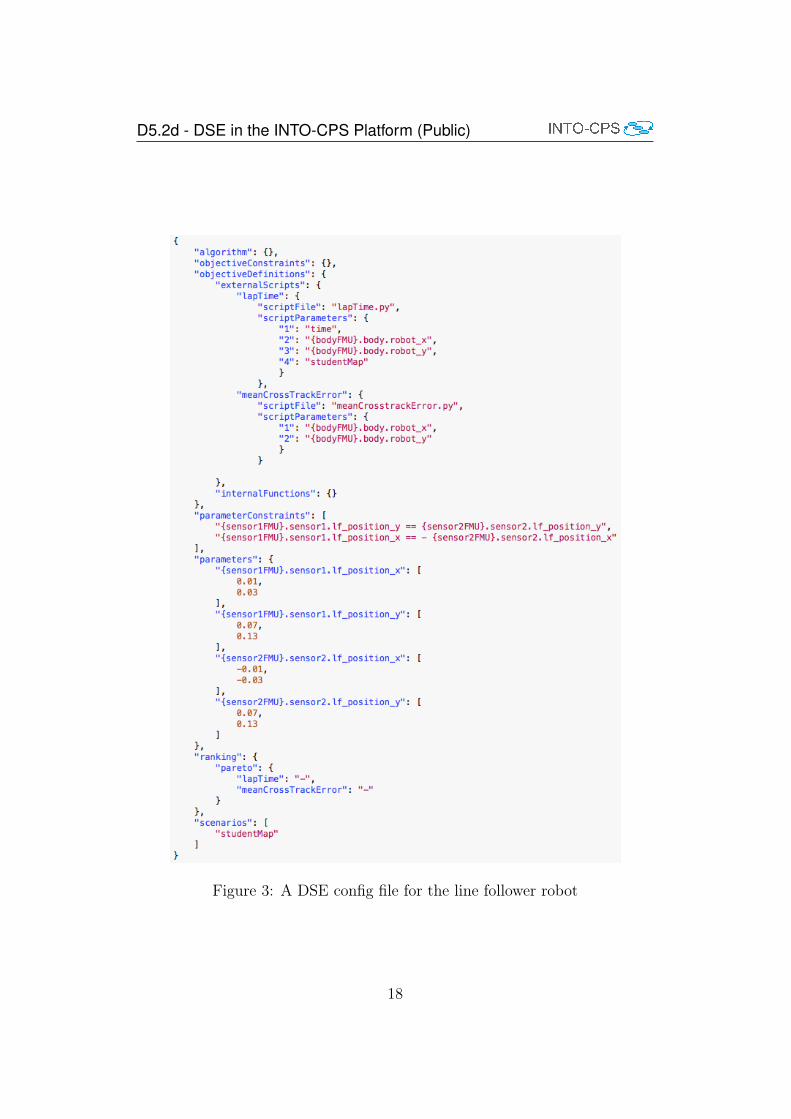
The <name>.dse.json files contain seven sections, each defining a separatepart of the DSE to be performed, Figure 3, these will now be explained.
16

D5.2d - DSE in the INTO-CPS Platform (Public)
Figure 2: Outline scripts in the DSE module
4.2.1 Parameters
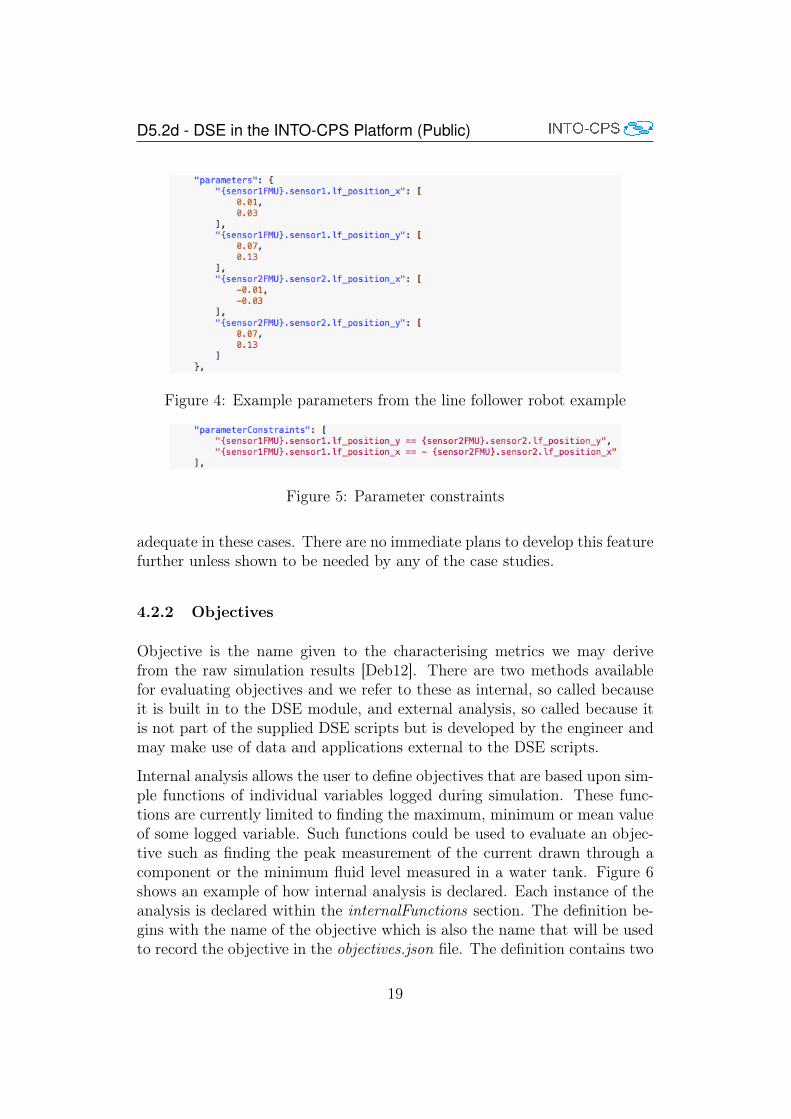
Parameters are core to defining the space over which a DSE should search.Figure 4 shows an example of parameter definition for the line follower robot.Parameters are currently defined explicitly as a list.
The future plan here is to allow a set comprehension such as defining lowervalue, upper value and step.
Parameter Constraints Parameter constraints allow the user to defineconditions that must be true for a set of design parameters to be valid andtherefore worth simulating. For example, in the line follower example we de-fine parameters that represent the co-ordinates of the left and right line fol-low sensors. Of the 16 combinations of design parameters shown in Figure 4,only four combinations represent symmetrical designs and so the engineermay want to apply constraints so that the non-symmetrical designs are notsimulated. Figure 5 shows the constraints that ensure the line follow sensorsonly adopt symmetrical positions.
These constraints are written as a list of boolean equations in python, whichare processed to map the names given to the data structure used in the DSEscripts and then passed to the Python eval method where it is evaluated.This method of defining parameter constraints has been tested using the linefollower model and the three water tank model and has proven itself to be
17
D5.2d - DSE in the INTO-CPS Platform (Public)
Figure 3: A DSE config file for the line follower robot
18
D5.2d - DSE in the INTO-CPS Platform (Public)
Figure 4: Example parameters from the line follower robot example
Figure 5: Parameter constraints
adequate in these cases. There are no immediate plans to develop this featurefurther unless shown to be needed by any of the case studies.
4.2.2 Objectives
Objective is the name given to the characterising metrics we may derivefrom the raw simulation results [Deb12]. There are two methods availablefor evaluating objectives and we refer to these as internal, so called becauseit is built in to the DSE module, and external analysis, so called because itis not part of the supplied DSE scripts but is developed by the engineer andmay make use of data and applications external to the DSE scripts.
Internal analysis allows the user to define objectives that are based upon sim-ple functions of individual variables logged during simulation. These func-tions are currently limited to finding the maximum, minimum or mean valueof some logged variable. Such functions could be used to evaluate an objec-tive such as finding the peak measurement of the current drawn through acomponent or the minimum fluid level measured in a water tank. Figure 6shows an example of how internal analysis is declared. Each instance of theanalysis is declared within the internalFunctions section. The definition be-gins with the name of the objective which is also the name that will be usedto record the objective in the objectives.json file. The definition contains two
19

D5.2d - DSE in the INTO-CPS Platform (Public)
Figure 6: Definition of an internal objective which captures the energy con-sumed during a simulation
Figure 7: Definition of external objectives for the line follower robot
fields, columnID which defines the name of the variable to be tracked andobjectiveType which states the function to be applied to that column of datawhere the options are max, min and mean.
External analysis permits the user to define their own methods for calculatingobjectives for use during DSE. The definition is in two parts, the script thatperforms the calculation and the definition of the dseConfig of the parametersneeded to invoke the script. Figure 7 shows the definition of two externalanalysis that evaluate the lap time and cross track error for the line followingrobot. Each analysis definition is given a name and contains two fields, thescriptFile field contains the name of the python script containing the analysisand the scriptParameters field contains and ordered list of arguments to bepassed to the script when launched. The parameters passed can contain anystring and in the example they contain the name of variables to be used bythe script and also a constant value which represents a target value to beused in the cumulative deviation script. When launching an external scriptthere are three arguments that are passed by default and before those theuser defines. These arguments pass the script its objective name, the pathto the folder containing the simulation results and the path to a scenariofolder.
20
D5.2d - DSE in the INTO-CPS Platform (Public)
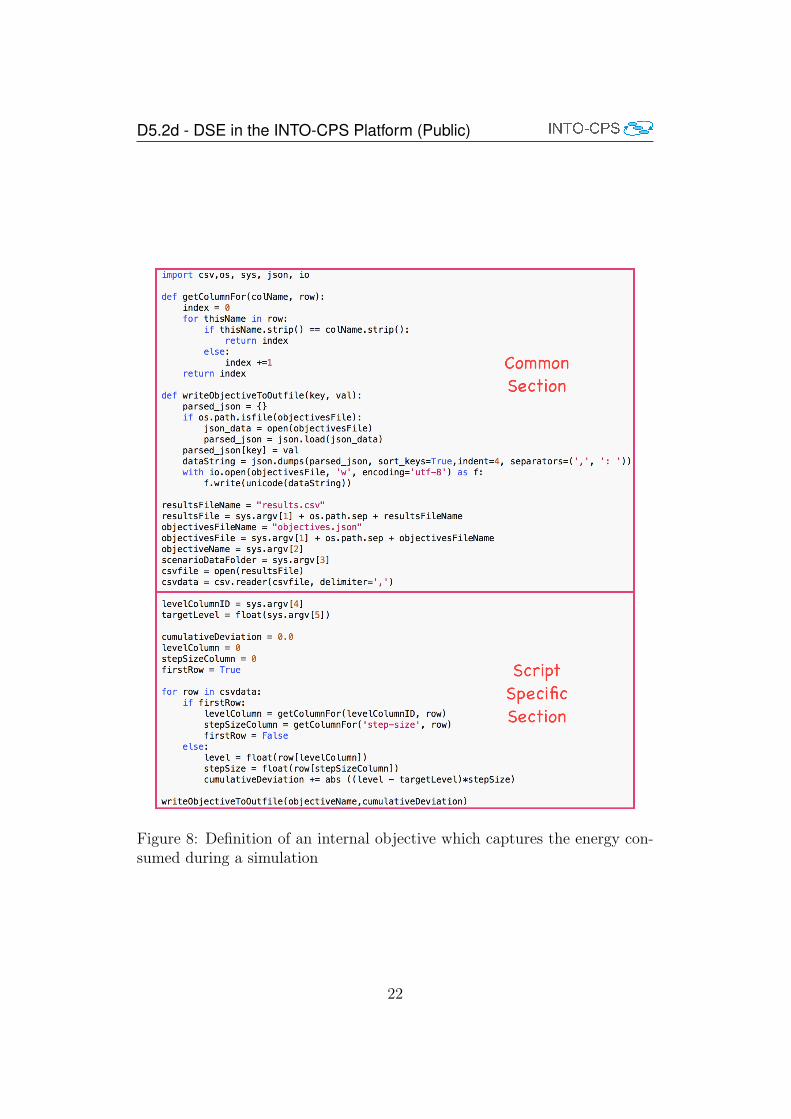
Figure 8 shows an example of an external analysis script that calculates thecumulative deviation of the water level from a target level in the water tankexample. The script can be separated into two parts. The common part canbe used in all scripts and it extracts the objective name, results folder pathand scenario folder path, it also contains methods to determine the columnindex for any variables it should use and a method to write the final objectiveresult into the objectives.json file. The second part of the script contains thescripting that is required to compute the associated objective value and toextract the arguments added by the user in the definition.
There are no plans currently to develop the internal analysis at this pointunless the need for more simple functions is derived from any of the casestudies. There are plans to develop the external analysis in two ways. First,the common part of the analysis is to be made a library that can be importedto reduce the need to copy and paste code. The second is with regard to thevalues returned by an objective. It has been observed that it is not alwayspossible to return a value from the analysis function that has meaning, forexample, if the line follower robot fails to complete a lap in the simulationtime it is not possible to calculate the lap time. To this end we will introducekeyword values that may be returned to indicate that it was not possible tocompute a value and this will be used in place of the very large default valuesthat have been used up till this point.
4.2.3 Objective Constraints
Objective constraints are not yet implemented but it is expected that theywill follow the same structure as used for parameter constraints. Thesewill be boolean expressions over objectives values defining conditions thatmust be true for a result to be considered further. Such expressions couldinclude objective values being considered against constant values, such as’maximum_power < 200’ based upon multiple objectives such as’max_deviation_A +max_deviation_B < 10’. These constraints may beused both by closed loop DSE algorithms so that bad results are not consid-ered further and also in the presentation of results so only acceptable resultsare presented.
4.2.4 Ranking
Ranking is the process of determining the relative fitness of the simulateddesigns to meet some goals of the user. There is a single ranking method
21
D5.2d - DSE in the INTO-CPS Platform (Public)
Figure 8: Definition of an internal objective which captures the energy con-sumed during a simulation
22
D5.2d - DSE in the INTO-CPS Platform (Public)
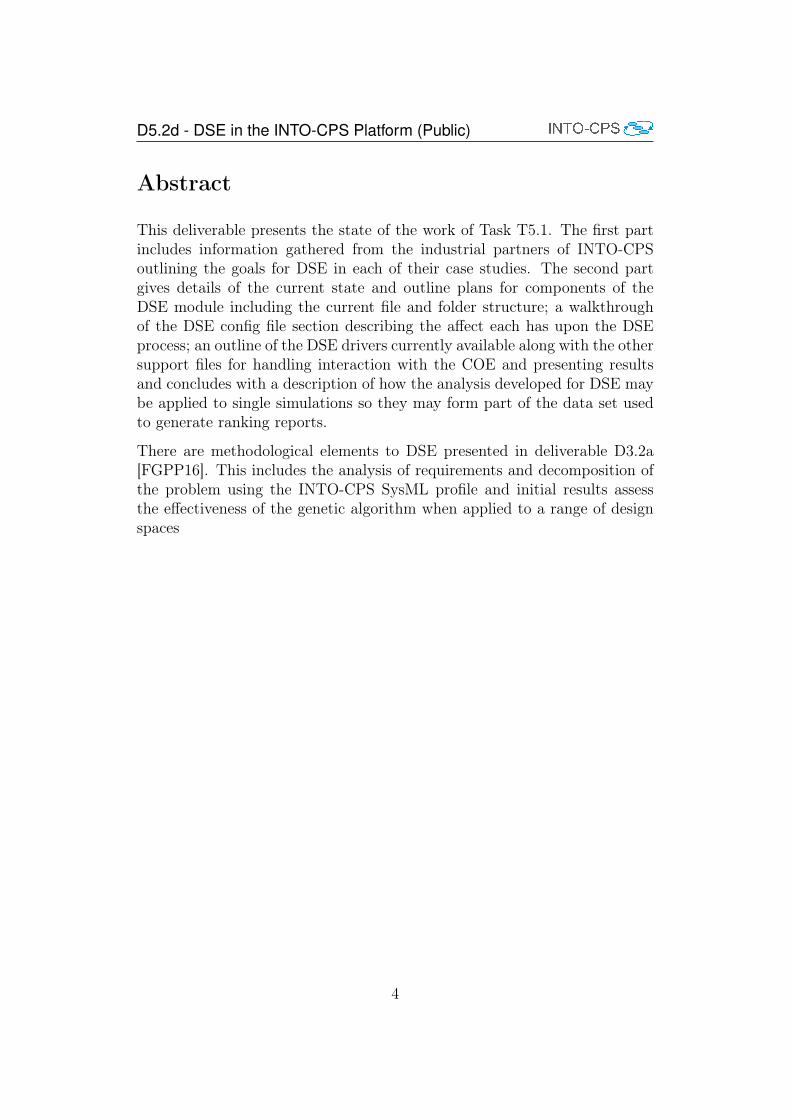
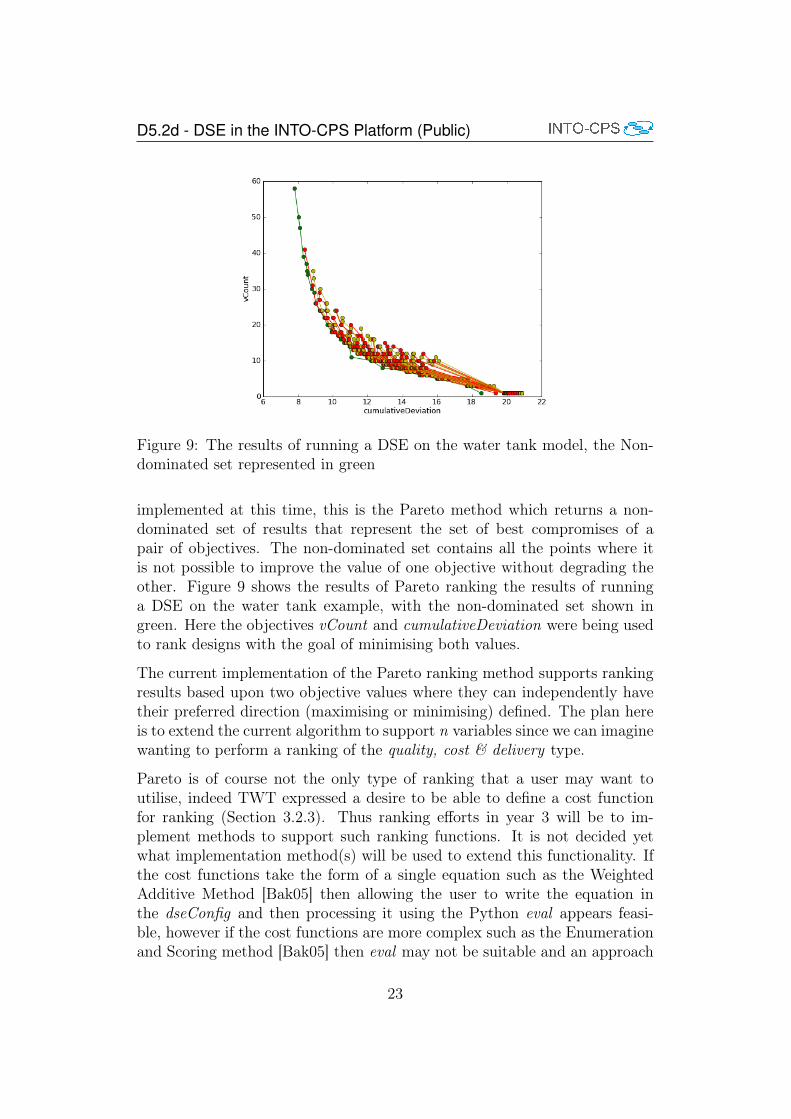
Figure 9: The results of running a DSE on the water tank model, the Non-dominated set represented in green
implemented at this time, this is the Pareto method which returns a non-dominated set of results that represent the set of best compromises of apair of objectives. The non-dominated set contains all the points where itis not possible to improve the value of one objective without degrading theother. Figure 9 shows the results of Pareto ranking the results of runninga DSE on the water tank example, with the non-dominated set shown ingreen. Here the objectives vCount and cumulativeDeviation were being usedto rank designs with the goal of minimising both values.
The current implementation of the Pareto ranking method supports rankingresults based upon two objective values where they can independently havetheir preferred direction (maximising or minimising) defined. The plan hereis to extend the current algorithm to support n variables since we can imaginewanting to perform a ranking of the quality, cost & delivery type.
Pareto is of course not the only type of ranking that a user may want toutilise, indeed TWT expressed a desire to be able to define a cost functionfor ranking (Section 3.2.3). Thus ranking efforts in year 3 will be to im-plement methods to support such ranking functions. It is not decided yetwhat implementation method(s) will be used to extend this functionality. Ifthe cost functions take the form of a single equation such as the WeightedAdditive Method [Bak05] then allowing the user to write the equation inthe dseConfig and then processing it using the Python eval appears feasi-ble, however if the cost functions are more complex such as the Enumerationand Scoring method [Bak05] then eval may not be suitable and an approach
23

D5.2d - DSE in the INTO-CPS Platform (Public)
similar to the external analysis scripts used for measuring objectives maypermit the user the flexibility they need. One or both of these methods willbe added to the ranking options during Year 3.
4.2.5 Scenarios
Scenarios permit the user to make use of different text environments and con-ditions when assessing the performance of a system under test, for examplewe may want to evaluate performance of the line following robot using a vari-ety of tracks that assess different capabilities or in the case of a vehicle modelwe may want to assess how it performs with different driver models.
There are multiple ways in which scenarios may be changed in an INTO-CPS multi-model depending on how and where the scenario is defined in themodel. Changing a scenario may change any or all of the following:
FMU parameter(s) If the an FMU contains aspects of more than one sce-nario such as a line follow sensor containing the data for more than onemap, it may possible to select which map is used via a parameter thatmay be set using the same mechanism as used for design parameters.
FMU implementation An alternative to FMUs containing data for mul-tiple scenarios is to use multiple FMUs each representing one scenario.This is the current method used for the line follow robot sensors. Herescenarios would be changed by changing the instance of FMU refer-enced in the multi-model.
Multi-Model configuration While there have so far been no examplesof this any any of the pilot studies, it is conceivable that a differentscenario may require the use of a different multi-model.
External analysis data file Finally, the external analysis scripts may re-quire data specific to a scenario to support their analysis. For examplethe cross track error analysis for the line follow robot requires a datafile containing a representation of the path to be followed.
The DSE configuration contains a section where the user may specify in alist the name of each scenario to be used in a DSE (Figure 10). The DSEdrivers currently used this list both in the naming of results directories alongwith the design parameters and it is also used to define a path passed to theexternal analysis so it may find the required data file.
Scenario development in year 3 will take a stepped approach to implementing
24
D5.2d - DSE in the INTO-CPS Platform (Public)
Figure 10: Specification of scenario names to be explored
the other changes listed for scenario swapping. It will start with how todefine swapping FMUs for scenario changes, followed by parameter changesand finally the swapping of entire multi-models.
4.3 Search Algorithms
At this point there are two DSE search scripts implemented, exhaustivesearch, and a genetic algorithm.
4.3.1 Exhaustive Search
The first algorithm is an open loop exhaustive algorithm which, as the namesuggests, will search through the the entire design space, testing each andevery combination of design parameters, computing the objective values asit goes and finally determining the ranking of those results. This is a simplealgorithm with no parameters to adjust its behaviour and it guarantees tofind the optimal design with the design space defined. However its weaknessis that it may not be feasible to run simulations for all combinations of designparameters and so it is only applicable to ’small’ design spaces.
4.3.2 Genetic Algorithm
The second script contains two variants of a genetic algorithm [Deb12] thathave two parameters to tune their behaviour. The variations offer choicesof both how the initial population is generated and how parents are selectedto produce each subsequent generation. The parameters affect the size ofthe initial population and how long the algorithm will continue if no betterresults are being found. The following subsections outline the steps take bythe genetic algorithm.
Initial population generation The first step in the genentic algorithmis to generate an initial population of designs. The size of this initial set isa parameter the user may set and there is ongoing work that is described
25

D5.2d - DSE in the INTO-CPS Platform (Public)
in D3.2a [FGPP16] that aims to provide guidance on what this size shouldbe. It is on the generation of this initial set that the two genetic algorithmsdiffer. One version of the script produces an entirely random set of designsand then proceeds to the next step, while the other version attempts toproduce a set of designs that is evenly distributed across the design space.Again the experimentation in D3.2a aims to provide guidance about whichof these options should be used and when.
Evaluation and ranking The second step in the genetic algorithm is toevaluate the new designs according to the objectives in the DSE config file(section 4.2.2) and then to place them in a partial order according to theranking defined (section 4.2.4).
Progress assessment With the whole population evaluated and rankedit is possible to determine if the fitness of the best designs is improving ornot. This is done by looking at the population of the non-dominated setof designs to determine how long, in generations, it has been since the oneor more new designs were added to this set. If the number of generationssince this set changed is above a threshold then the algorithm assumes thatan optimal design has been found and the genetic algorithm halts, returningthe graph and table of results to the user. The number of generations thealgorithm will proceed to the next step without seeing any improvement is aparameter the user may define for the algorithm and once again this is beinginvestigated so that guidance may be provided.
Parent selection and offspring generation If the algorithm decides toproceed, the next step is to select a pair of parents from the whole popula-tion. Here the parents are weighted according to the rank they achieved inthe evaluation step such that those in rank 1 are more likely to be selectedthan any of those in rank 2 and any design in rank 2 is more likely to beselected than any in rank 3 and so on. With a pair of parents selected thealgorithm places their design parameters in an ordered list, and randomlychooses a place to cross them, producing two offspring, such that each off-spring has some parameters from each parent, with a small probability thateach parameter may mutate to a different but valid value. Once the offspringhave been defined, the process moves back to the evaluation and ranking stepand the loop continues until the progress and assessment step determines thatno progress is being made.
26

D5.2d - DSE in the INTO-CPS Platform (Public)
4.4 COE Handler
The COE handler is the script that that connects the DSE scripts with theCOE and orchestrates the running of the simulation and retrieval of thesimulation results. Aside from the occasional changes imposed by changedin the COE itself, this script has not needed to change since its first stableversion in year 1. There are two changes that, while not necessary, would beimprovements to this script.
The first change is the method used for communication with the COE, whichis currently based upon the application curl. This application is available inOSx as standard but at the time of writing it is not available by default underWindows. The current solution is to include the application curl.exe in withthe DSE scripts and this is certainly working well, however if for some reasonwe are not longer able to include the file with the DSE scripts then Windowsusers would no longer be able to perform DSE. Thus an alternative andpreferably native approach to constructing and sending the HTTP requeststo the COE from Python will be explored.
The second change involves the monitoring of progress of a simulation. Whileit is not expected that a user will sit and watch a DSE running, it is importantthat feedback be given on the progress of this activity. As will be discussedlater in Section 4.6, it is most important that the user can perceive progresson the level of the DSE search rather than an individual simulation, howeverif individual simulation progress were available then this would provide theuser with extra information regarding how long the DSE is likely to take.There is a mechanism currently in the INTO-CPS Application that performsthis simulation progress function, it will therefore be investigate if this maybe leveraged for use in the DSE section of the application.
4.5 Results Presentation
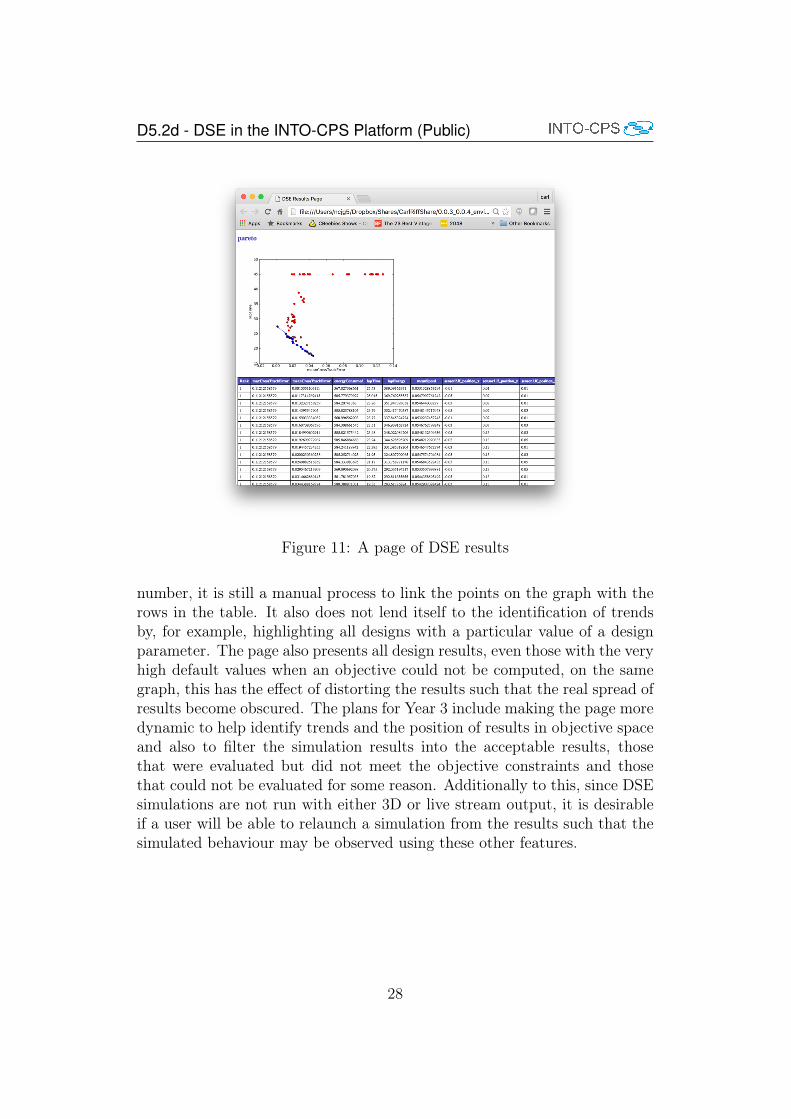
The results presentation is the result of two scripts, the ranking script isresponsible for producing the raw ranking data and the graph that will bedisplayed (in png format). The output script is responsible for producinga static html file including the png graph and extracting the details of theranked designs for a table, the results of which are shown in Figure 11.
The page contains the information that would allow the user to determinewhich are the best designs, but while the graph highlights the best designswith different coloured points and the table lists all designs with their rank
27
D5.2d - DSE in the INTO-CPS Platform (Public)
Figure 11: A page of DSE results
number, it is still a manual process to link the points on the graph with therows in the table. It also does not lend itself to the identification of trendsby, for example, highlighting all designs with a particular value of a designparameter. The page also presents all design results, even those with the veryhigh default values when an objective could not be computed, on the samegraph, this has the effect of distorting the results such that the real spread ofresults become obscured. The plans for Year 3 include making the page moredynamic to help identify trends and the position of results in objective spaceand also to filter the simulation results into the acceptable results, thosethat were evaluated but did not meet the objective constraints and thosethat could not be evaluated for some reason. Additionally to this, since DSEsimulations are not run with either 3D or live stream output, it is desirableif a user will be able to relaunch a simulation from the results such that thesimulated behaviour may be observed using these other features.
28
D5.2d - DSE in the INTO-CPS Platform (Public)
Figure 12: The current DSE launch page in the app
4.6 App Integration
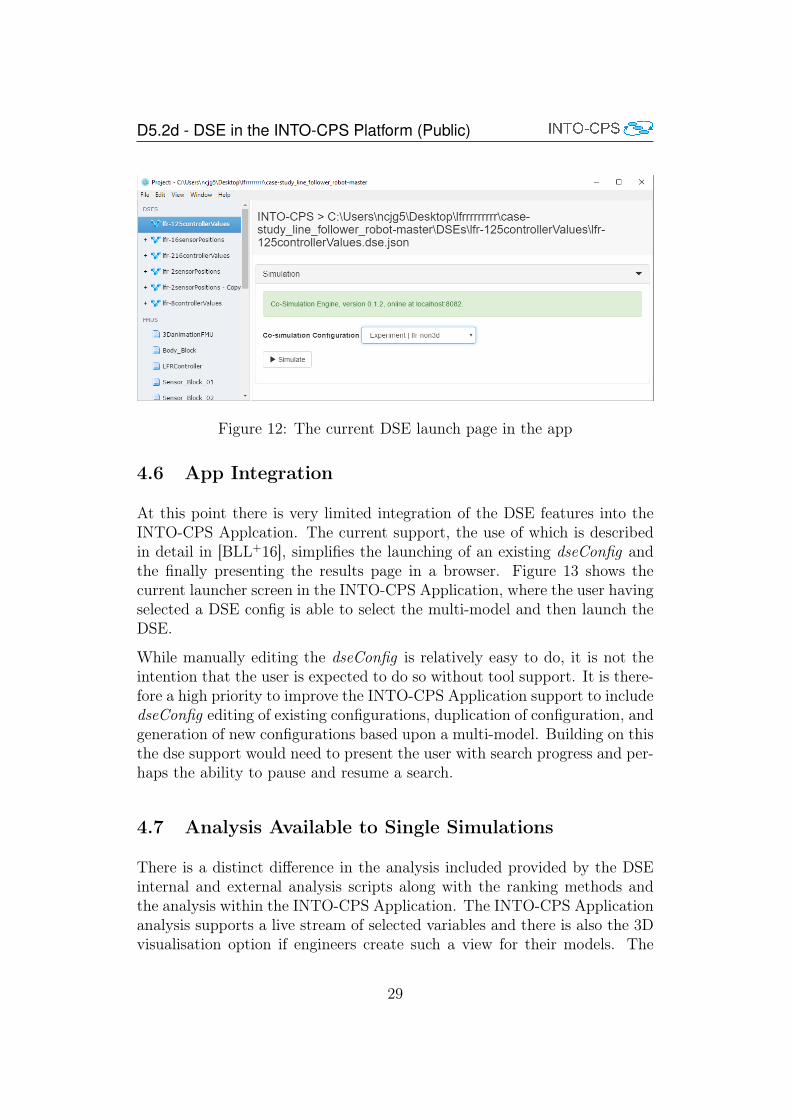
At this point there is very limited integration of the DSE features into theINTO-CPS Applcation. The current support, the use of which is describedin detail in [BLL+16], simplifies the launching of an existing dseConfig andthe finally presenting the results page in a browser. Figure 13 shows thecurrent launcher screen in the INTO-CPS Application, where the user havingselected a DSE config is able to select the multi-model and then launch theDSE.
While manually editing the dseConfig is relatively easy to do, it is not theintention that the user is expected to do so without tool support. It is there-fore a high priority to improve the INTO-CPS Application support to includedseConfig editing of existing configurations, duplication of configuration, andgeneration of new configurations based upon a multi-model. Building on thisthe dse support would need to present the user with search progress and per-haps the ability to pause and resume a search.
4.7 Analysis Available to Single Simulations
There is a distinct difference in the analysis included provided by the DSEinternal and external analysis scripts along with the ranking methods andthe analysis within the INTO-CPS Application. The INTO-CPS Applicationanalysis supports a live stream of selected variables and there is also the 3Dvisualisation option if engineers create such a view for their models. The
29
D5.2d - DSE in the INTO-CPS Platform (Public)
app analysis is well suited for understanding how a model is behaving dur-ing simulation, for fault analysis and for communicating with non-technicalstakeholders, especially through the 3D visualisation. At the same time theDSE analysis abstracts away the detail generated during a simulation andconcentrates on producing the objective values that characterise performanceand allow comparison of competing designs. Making the DSE type of anal-ysis available to single simulations as well as DSE simulations would allowthem to be compared on common grounds
As can be seen earlier in Figure 3 the definitions of both the DSE searchspace and algorithm are in the same file as the definition of the objectives andranking definition, this structure does not make it obvious that the analysiscould be used outside of DSE, also it leads to the objective and rankingdefinitions being duplicated across multiple DSE configurations when it onlyneeds to be defined once.
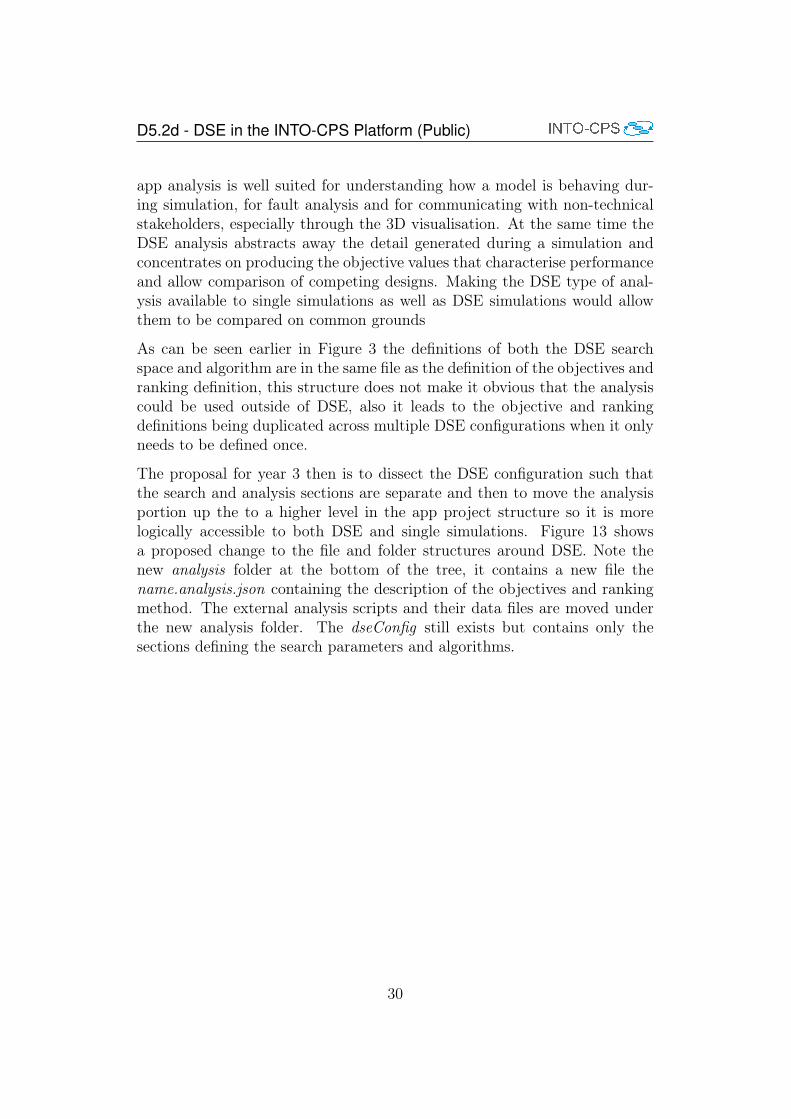
The proposal for year 3 then is to dissect the DSE configuration such thatthe search and analysis sections are separate and then to move the analysisportion up the to a higher level in the app project structure so it is morelogically accessible to both DSE and single simulations. Figure 13 showsa proposed change to the file and folder structures around DSE. Note thenew analysis folder at the bottom of the tree, it contains a new file thename.analysis.json containing the description of the objectives and rankingmethod. The external analysis scripts and their data files are moved underthe new analysis folder. The dseConfig still exists but contains only thesections defining the search parameters and algorithms.
30

D5.2d - DSE in the INTO-CPS Platform (Public)
Figure 13: Proposed adjustment to the app project structure around DSE
31

D5.2d - DSE in the INTO-CPS Platform (Public)
References
[Bak05] Rachel Edith Baker. An Approach for Dealing with DynamicMulti-Attribute Decision Problems. PhD thesis, Department ofComputer Science, University of York, UK., 2005.
[BFG+12] Jan F. Broenink, John Fitzgerald, Carl Gamble, Claire Ingram,Angelika Mader, Jelena Marincic, Yunyun Ni, Ken Pierce, andXiaochen Zhang. Methodological guidelines 3. Technical report,The DESTECS Project (INFSO-ICT-248134), October 2012.
[BLL+16] Victor Bandur, Peter Gorm Larsen, Kenneth Lausdahl, CasperThule, Anders Franz Terkelsen, Carl Gamble, Adrian Pop, Eti-enne Brosse, Jörg Brauer, Florian Lapschies, Marcel Groothuis,Christian Kleijn, and Luis Diogo Couto. INTO-CPS Tool ChainUser Manual. Technical report, INTO-CPS Deliverable, D4.2a,December 2016.
[CER13a] CERTAINTY. Modelling languages and models. Technical Re-port Deliverable D2.3, EU FP7 288175 CERTAINTY, 2013.
[CER13b] CERTAINTY. Preliminary methodology. Technical Report De-liverable D8.2, EU FP7 288175 CERTAINTY, 2013.
[Deb12] Kalyanmoy Deb. Optimization for engineering design: Algo-rithms and examples. PHI Learning Pvt. Ltd., 2012.
[FGPP16] John Fitzgerald, Carl Gamble, Richard Payne, and Ken Pierce.Method Guidelines 2. Technical report, INTO-CPS Deliverable,D3.2a, December 2016.
[FLPV13] John Fitzgerald, Peter Gorm Larsen, Ken Pierce, and MarcelVerhoef. A Formal Approach to Collaborative Modelling andCo-simulation for Embedded Systems. Mathematical Structuresin Computer Science, 23(4):726–750, 2013.
[FNSV15] John B. Finn, Pierluigi Nuzzo, and Alberto Sangiovanni-Vincentelli. A mixed discrete-continuous optimization schemefor cyber-physical system architecture exploration. In Interna-tional Conf. Computer-Aided Design, 2015.
[NBAR+12] Yunyun Ni, Jan F. Broenink, Kenneth G. Lausdahl Au-gusto Ribeiro, Frank Groen, Ken Pierce Marcel Groothuis, CarlGamble, and Peter Gorm Larsen. Design space exploration tool
32

D5.2d - DSE in the INTO-CPS Platform (Public)
support. Technical report, The DESTECS Project (INFSO-ICT-248134), December 2012.
5 List of Acronyms
AU Aarhus UniversityCLE ClearSyCLP Controllab Products B.V.DSE Design Space ExplorationENUM Enumeration and ScoringPROV-N The Provenance NotationST SofteamTWT TWT GmbH Science & InnovationUNEW University of Newcastle upon TyneUTRC United Technology Research CenterUY University of YorkVSI Verified Systems InternationalWAM Weighted Additive MethodWP Work Package
33