Embed Size (px)
Citation preview
Drug Absorption and Bioavailability
Juan J.L. Lertora, M.D., Ph.D.
Director Clinical Pharmacology Program
October 1, 2009
Office of Clinical Research Training and Medical Education National Institutes of Health
Clinical Center
1
GOALS of Drug Absorption and
Bioavailability Lecture
- Factors Affecting Drug Absorption
- Estimation of Bioavailability - Clinical Significance of Differences in Bioavailability
- Prediction of Bioavailability in High-Throughput Drug Candidate Screening
2

Factors Affecting
DRUG ABSORPTION Biopharmaceutic Factors
- Tablet compression - coating and matrix - excipients
Interactions
- Food - Other drugs - Bacteria
Physiological Factors
3

Change in PHENYTOIN Excipients Results in
Epidemic Toxicity* Graph of plasma concentration versus time showing the extent of phenytonin absorption varied greatly with different excipients.
*Bochner F., et al. Proc Aust Assoc Neurol 1973;9:165-70
4

Factors Affecting
DRUG ABSORPTION
-Biopharmaceutic Factors - INTERACTIONS
- Food - Other Drugs - Bacteria
- Physiologic Factors
5

ENTERIC METABOLISM OF DIGOXIN*
Chemical structure of digoxin and metabolites produced by enteric bacteria. * Lindenbaum J, et al. N Engl J Med 1981;305:789-94.
6

Factors Affecting
DRUG ABSORPTION Biopharmaceutic Factors Interactions PHYSIOLOGICAL FACTORS
7
Drug Absorption Passive Non-Ionic Diffusion: Primary mechanism for most drugs.
8
Drug Absorption - Specialized Transport Mechanisms Large Neutral Amino Acid Transporter: L-Dopa, Methyldopa, Baclofen
9

Drug Absorption - Specialized Transport Mechanisms Oligopeptide Transporter (PEPT-1): Amino-beta-lactams ACE Inhibitors
10

Drug Absorption - Specialized Transport Mechanisms Monocarboxylic Acid Transporter: Salicylic acid Pravastatin
11

FALLACIES Concerning Gastric Drug Absorption
- Acidic Drugs absorbed in the stomach - Basic Drugs absorbed in the small Intestine - Gastric pH is always acidic
In fact, most drug absorption occurs in the SMALL INTESTINE
12
ASPIRIN ABSORPTION FROM STOMACH AND SMALL
INTESTINE* Table showing Aspirin (ASA) absorption from simultaneously perfused stomach and small intestine. Changes in pH reduce absorption from the stomach but intestinal absorption does not change significantly. * From: Hollander D, et al. J Lab Clin Med 1981;98:591-8
13
Variation in Gastric and Intestinal pH*
Graph illustrating wide variation in gastric pH. * Meldrum SJ, et al. Br Med J 1972;2:104-6.
14

PHYSIOLOGICAL FACTORS
Affecting Drug Absorption - Rate of gastric emptying is a major determinant of initial delay in drug absorption. - Intestinal motility is a determinant of the extent of drug absorption.
15
PATTERNS OF GASTRIC
MOTOR ACTIVITY Phase 1 - Quiescence Phase 2 - Irregular Contractions Phase 3 - Major Motor Complex Burst Phase 4 - Transition Period
16
Interdigestive Intestinal Motor Activity in Humans*
Chart illustrating gastrointestinal motor activity. *From: Rees WDW, et al. Dig Dis Sci 1982;27:321-9.
17

PATTERNS OF GASTRIC
MOTOR ACTIVITY POST PRANDIAL (Up to 10 hr delay) - Pylorus constricted - Antral contractions reduce particle size
18
GI TRANSIT - SUSTAINED-RELEASE
CARBAMAZEPINE FORMULATION* Illustration of the significant inter-individual variation in extent of carbamazepine absorption. *From: Wilding IR, et al. Br J Clin Pharmacol 1991;32:573-9.
19
Variation in “Peak” Levels
ACETAMINOPHEN* Chart showing major variability in peak levels of Acetaminophen in patients. * Prescott LF. Med Clin N Am 1974;42:907-16.
20

Gastric Emptying Rate Affects ACETAMINOPHEN Absorption*
Chart illustrating that metoclopramide accelerates gastric emptying and propantheline delays gastric emptying and the effect of these changes on acetaminophen absorption. *From: Nimmo J, et al. Br Med J 1973;1:587-9.
21

Factors Affecting RATE and EXTENT of Drug Absorption
Illustration showing the impact of intestinal transit time and reserve length on drug absorption.
22
RESERVE LENGTH
RESERVE LENGTH is the anatomical length over which absorption of a drug can occur MINUS the length at which absorption is complete.
23
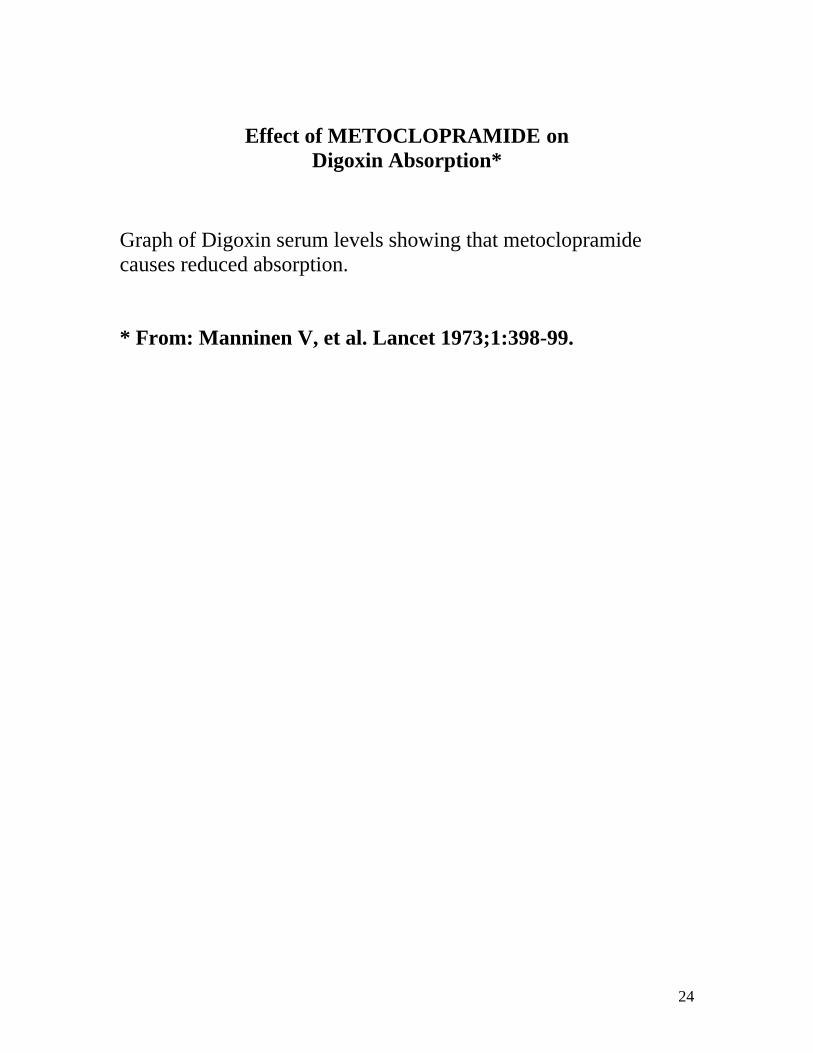
Effect of METOCLOPRAMIDE on
Digoxin Absorption* Graph of Digoxin serum levels showing that metoclopramide causes reduced absorption. * From: Manninen V, et al. Lancet 1973;1:398-99.
24

Effect of PROPANTHELINE on
Digoxin Absorption* Chart illustrating that propantheline enhances digoxin absorption. * From: Manninen V, et al. Lancet 1973;1:398-99.
25
Factors Affecting RATE and EXTENT of Drug Absorption
Illustration of the significance of mucosal surface area regarding drug absorption.
26

Normal Intestinal Villi
Histological section under microscope.
27
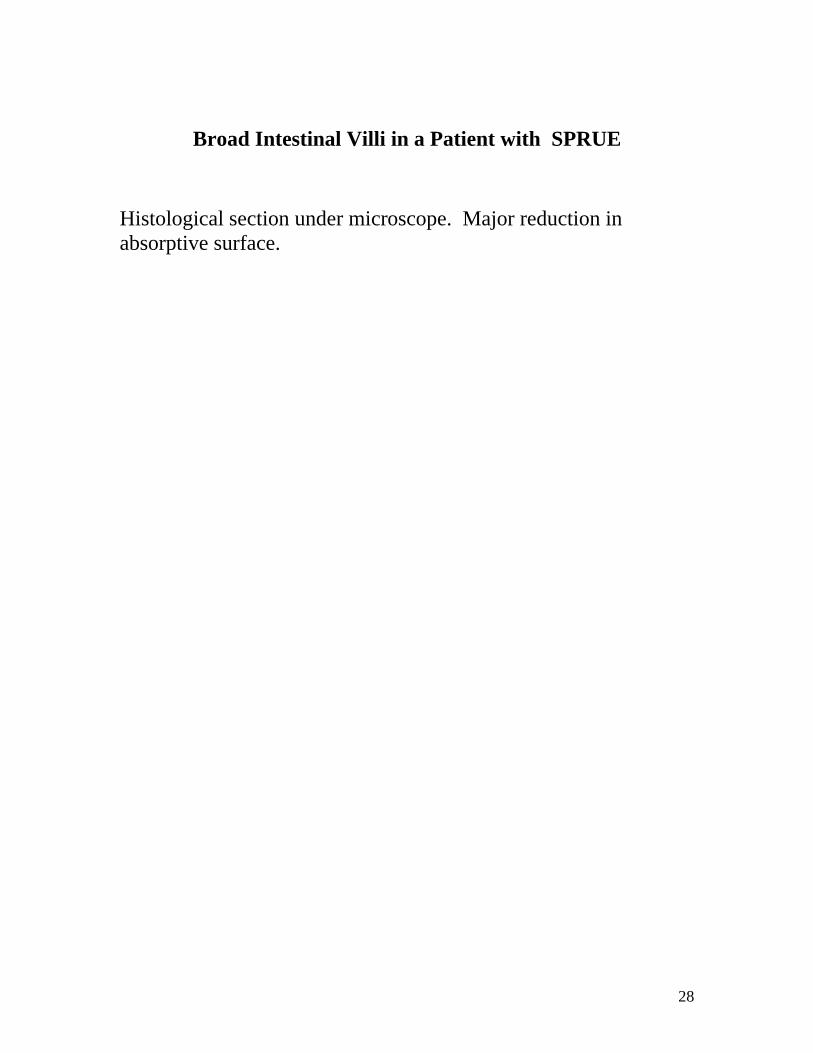
Broad Intestinal Villi in a Patient with SPRUE
Histological section under microscope. Major reduction in absorptive surface.
28

Digoxin Levels in Patients with
INTESTINAL MALABSORPTION* Chart illustrating reduced digoxin absorption. * From: Heizer WD, et al. N Engl J Med 1971;285:257-9.
29

Factors Affecting RATE and EXTENT of Drug Absorption
Illustration highlighting the role of transporters in drug absorption.
30

P-GLYCOPROTEIN EFFLUX PUMP
Intestinal Lumen
Illustration of this drug efflux pump. Slides courtesy of M. Gottesman.
31

BIOAVAILABILITY OF SOME
P-GLYCOPROTEIN SUBSTRATES Chart showing percent of absorption for various substrate drugs.
32

70% BIOAVAILABILITY OF SOME P-GLYCOPROTEIN SUBSTRATES
Illustration of how a large effective absorption surface can compensate for the effect of p-glycoprotein on drug absorption.
33

FACTORS AFFECTING RATE AND EXTENT OF DRUG ABSORPTION
Illustration of the impact of first-pass metabolism on drug absorption.
34
Sites of FIRST-PASS Elimination
- INTESTINAL MUCOSA
CYP Enzymes P-Glycoprotein
- LIVER CYP Enzymes
35

FIRST-PASS METABOLISM
Illustration of first-pass metabolism and the portal circulation.
36
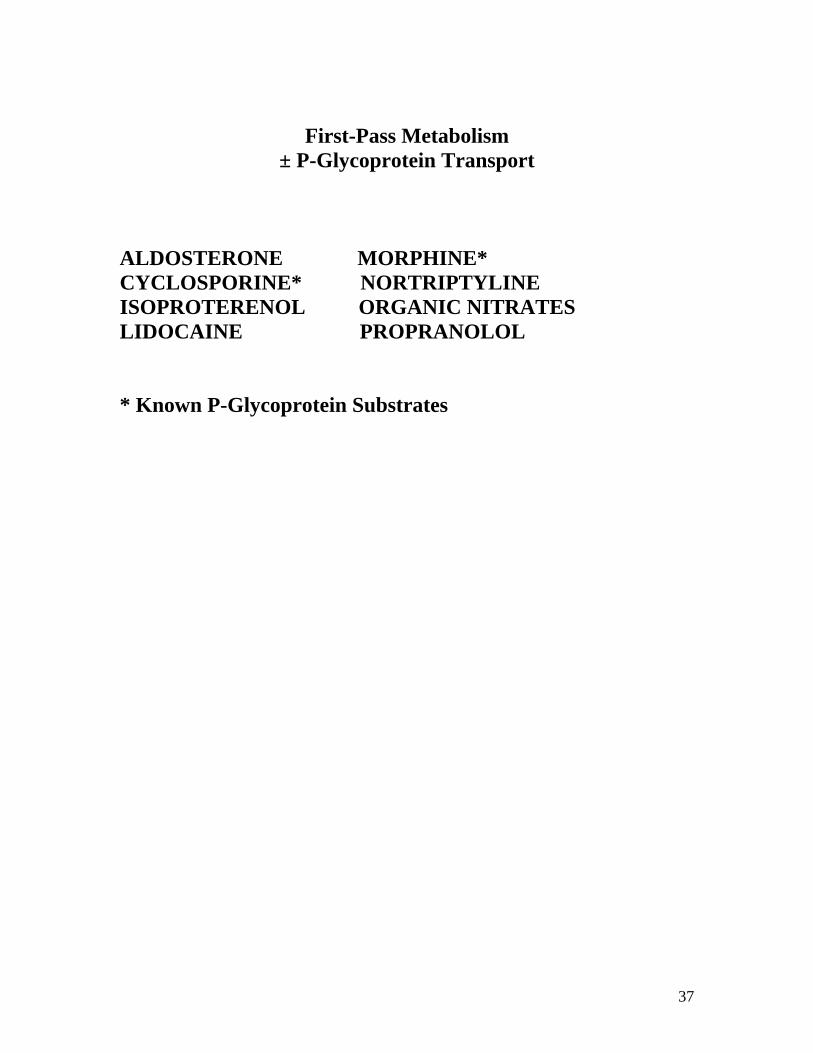
First-Pass Metabolism
± P-Glycoprotein Transport ALDOSTERONE MORPHINE* CYCLOSPORINE* NORTRIPTYLINE ISOPROTERENOL ORGANIC NITRATES LIDOCAINE PROPRANOLOL * Known P-Glycoprotein Substrates
37

Factors Affecting RATE and
EXTENT of Drug Absorption Illustration of the role of splanchnic circulation on drug absorption.
38
GOALS of Drug Absorption and Bioavailability Lecture
- Factors Affecting Drug Absorption
- ESTIMATION OF BIOAVAILABILITY
- Clinical Significance of Differences in Bioavailability
- Prediction of Bioavailability.
39
BIOAVAILABILITY
BIOAVAILABILITY is the RELATIVE AMOUNT (F) of a drug dose that reaches the systemic circulation unchanged and the RATE at which this occurs.
40
Serum Concentration-Time Curve
after a Single Oral Dose Chart showing the area under the serum concentration time-curve after a single oral dose with the Cmax and Tmax. values.
41
Significance of AUC
Equations illustrating the significance of AUC and its relation to dose and clearance.
42

Calculation of AUC Trapezoidal Rule
Graphic illustration of the use of the trapezoidal rule to estimate area under the curve. From: Rowland M, Tozer TN. Clinical Pharmacokinetics. p 470.
43

AUC A > B
A chart illustrating this concept with 2 hypothetical drugs.
44
ABSOLUTE Bioavailability The formula for estimating absolute bioavailability is shown. Comparison here is between an ORAL and an IV Formulation.
45

RELATIVE Bioavailability The formula for estimating relative bioavailability is shown. The comparison here is between 2 ORAL Formulations.
46
Old Ad for Bayer Timed-Release aspirin entitled, “How to keep salicylate blood levels up…even when your arthritis patient isn’t.” Illustrates why the dose administered needs to be considered when comparing the relative bioavailability of drug formulations. Example of misleading advertisement.
47

RELATIVE Bioavailability The formula for relative bioavailability is shown. AUC Values have to be normalized for dose.
48

ASSESSMENT of Bioavailability
- AUC Estimates can be used to estimate Extent of Drug Absorption
- Recovery of Parent Drug in Urine can be used to estimate Extent of Drug Absorption
- How is ABSORPTION RATE assessed? - TMAX - Integrated Pharmacokinetic Analysis of Absolute Bioavailability.
49
Extent of Absorption from
Renal Excretion of Unchanged Drug Formulas illustrating how to estimate absolute bioavailability from urinary recovery data after oral and intravenous administration.
50
ASSESSMENT OF Bioavailability
- AUC Estimates Can Be Used to Estimate Extent of Drug Absorption.
- Recovery of Parent Drug in Urine Can Be Used to Estimate Extent of Drug Absorption.
- HOW IS ABSORPTION RATE ASSESSED? - TMAX - Integrated Pharmacokinetic Analysis of Absolute Bioavailability.
51
INTERACTION OF DRUG ABSORPTION
AND DISPOSITION PROCESSES Illustration of these processes and the combination of absorption and disposition functions.
52

THE OPERATION OF CONVOLUTION Equations that illustrate this concept.
53

MODEL Used to Analyze
Kinetics of Drug Absorption Graphic illustration of this model.
54

Calculation of Bioavailability from
First-Order Absorption Model Mathematical formula.
55
Methods for Assessment of ABSOLUTE
BIOAVAILABILITY
- CONVENTIONAL: IV and ORAL doses given on two separate occasions.
- Requires two study sessions - Requires two sets of blood samples - Assumes no change in disposition parameters between studies
- STABLE ISOTOPE: - One study and set of blood samples - Special synthesis requirements - Mass Spectrometer Assay required
56
NAPA-13C2
Chemical structure for N-Acetylprocainamide.
57
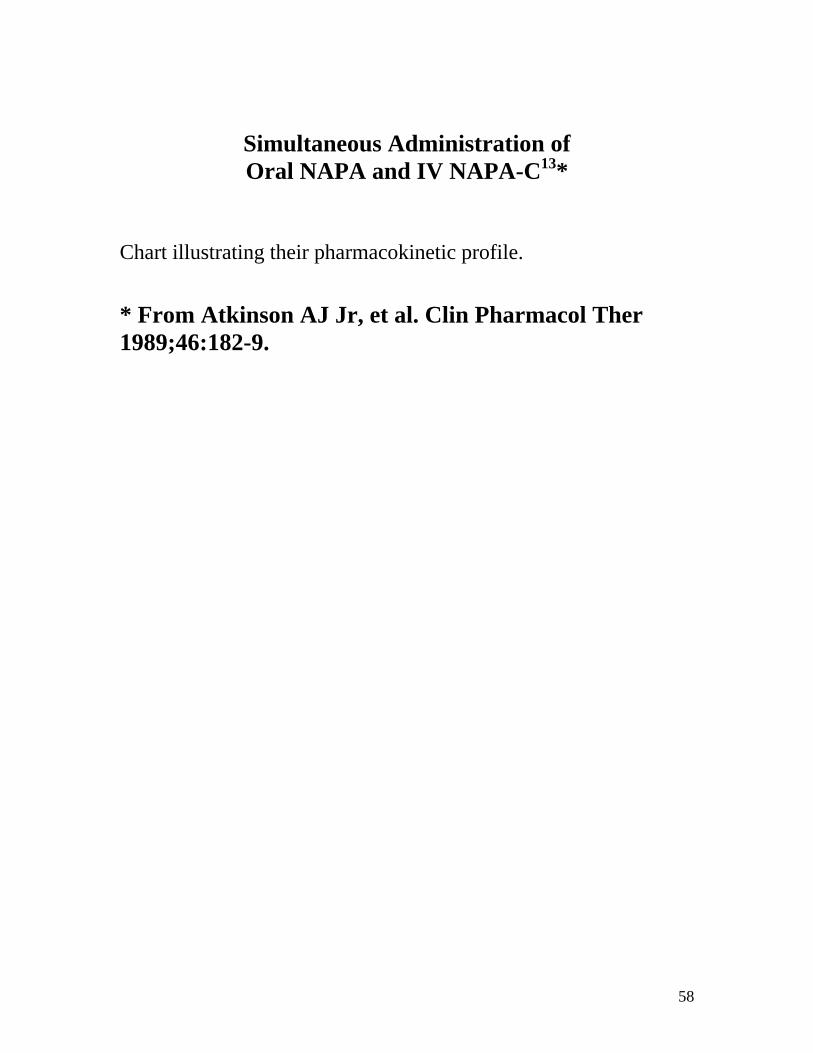
Simultaneous Administration of Oral NAPA and IV NAPA-C13*
Chart illustrating their pharmacokinetic profile. * From Atkinson AJ Jr, et al. Clin Pharmacol Ther 1989;46:182-9.
58
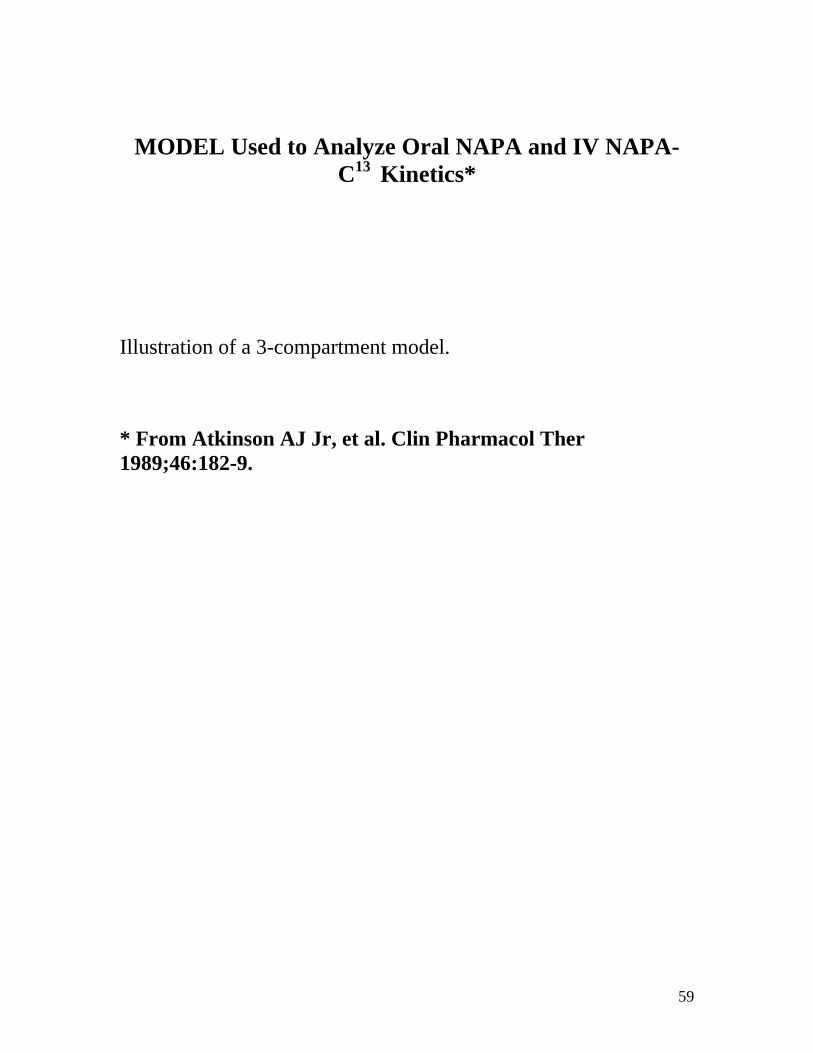
MODEL Used to Analyze Oral NAPA and IV NAPA-
C13 Kinetics* Illustration of a 3-compartment model. * From Atkinson AJ Jr, et al. Clin Pharmacol Ther 1989;46:182-9.
59
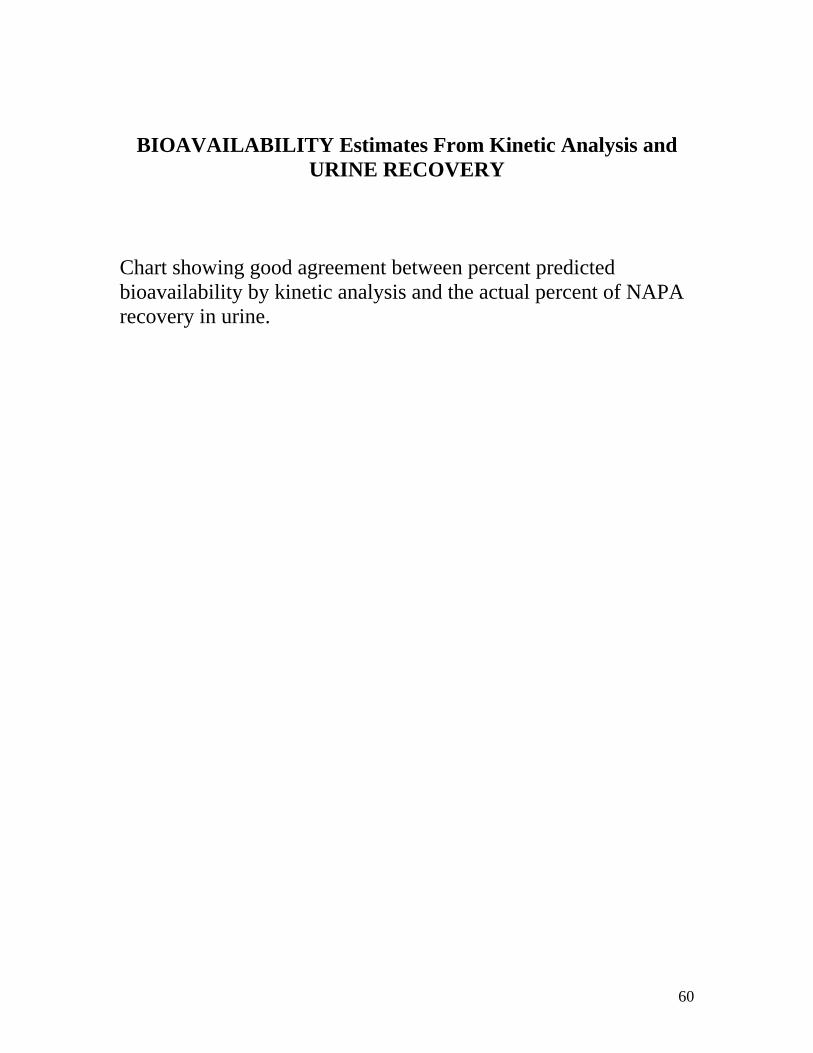
BIOAVAILABILITY Estimates From Kinetic Analysis and
URINE RECOVERY Chart showing good agreement between percent predicted bioavailability by kinetic analysis and the actual percent of NAPA recovery in urine.
60
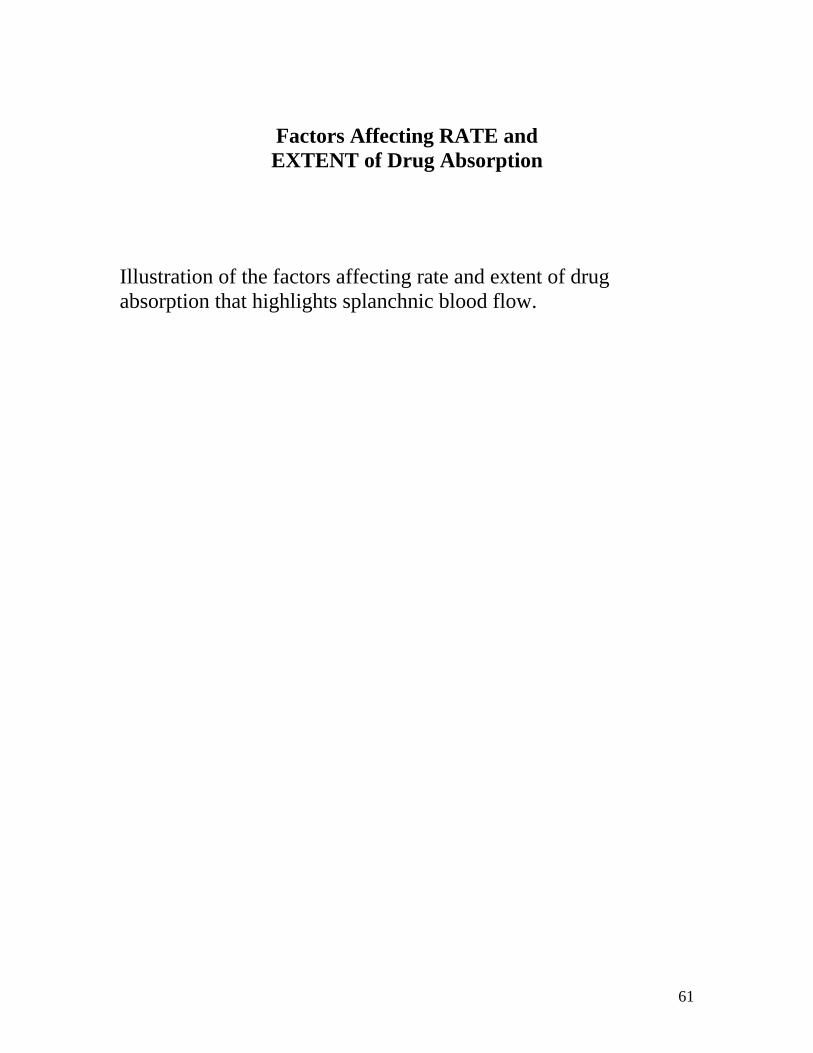
Factors Affecting RATE and EXTENT of Drug Absorption
Illustration of the factors affecting rate and extent of drug absorption that highlights splanchnic blood flow.
61
NAPA PK Model After IV Dose
Illustration of 3-compartment model emphasizing the fast intercompartmental clearance term.
62
Relationship Between CLF and Extent of NAPA Absorption*
Graph of experimental data illustrating this relationship.
* From Atkinson AJ Jr, et al. Clin Pharmacol Ther 1989;46:182-9.
63

THOUGHTS About
Absolute Bioavailability Studies
- Absolute Bioavailability is usually studied in Healthy Subjects, NOT in the Patient Population for whom the drug is intended.
- The Stable Isotope Method is ideally suited for studies in Special Populations
(e.g. Pediatrics, Pregnant Women, other)
64
GOALS of Drug Absorption and Bioavailability Lecture
- Factors Affecting Drug Absorption - Estimation of Bioavailability - Clinical Significance of Differences in Bioavailability - Prediction of Bioavailability
65
RELATIVE Bioavailability Terms
Bioequivalence: AUC and Cmax within 80% - 125% of reference compound. Bioinequivalence: Greater difference in bioavailability. Therapeutic Equivalence: Similar clinical effectiveness and safety. Therapeutic Inequivalence: Important clinical difference in bioavailability.
66
AUC A > B:
Therapeutic Significance? Chart illustrating this concept.
67

AUC A > B: B Ineffective
Illustration of this concept when drug B does not achieve therapeutic concentrations.
68
AUC A > B:
A and B Equally Effective Illustration of this concept when drug B achieves therapeutic concentrations in spite of a lower AUC.
69
Equal AUC but Different Ka:
B is Ineffective
Chart illustrating that drug B has slower absorption that renders it ineffective.
70
Equal AUC but Different Ka:
A is Toxic Chart illustrating this concept and rapid absorption of drug A results in toxicity.
71
RELATIVE BIOAVAILABILITY
CONCLUSIONS
- BIOEQUIVALENCE =
THERAPEUTIC EQUIVALENCE
- BIOINEQUIVALENCE NOT NECESSARILY = THERAPEUTIC INEQUIVALENCE
72

GOALS of Drug Absorption and
Bioavailability Lecture
- Factors Affecting Drug Absorption - Estimation of Bioavailability - Clinical Significance - PREDICTION of Bioavailability as part of High- Throughput Drug Candidate Screening
73

WHY DRUG DEVELOPMENT FAILS - Unsuitable Biopharmaceutical Properties - Unsuitable Clinical Pharmacokinetics - Pharmacology (PD) Doesn’t Work in Humans - Unexpected Toxicity is Encountered * Ronald E. White, Bristol-Myers Squibb (From Good Ligands to
Good Drugs, AAPS-NIGMS Symposium, February 19-21, 1998)
74

BIOPHARMACEUTIC DRUG CLASSIFICATION *
CLASS I: High Solubility-High Permeability CLASS II: Low Solubility-High Permeability CLASS III: High Solubility-Low Permeability CLASS IV: Low Solubility-Low Permeability
* From: Amidon GL, et al. Pharm Res 1995;12:413-20
75

Three CRITICAL
Biopharmaceutical Properties
- Drug Solubility Relative to Dose GOOD = Highest Dose in 250 mL H20, PH 1.0-7.5
- Dissolution Rate of Formulation GOOD = 85% Dissolution in 15 min
- Intestinal Permeability of Drugs
76
CORRELATION of Rates of Drug Dissolution and Oral ABSORPTION Chart showing this correlation. From Rackley RJ. In Young D, Devane JG, Butler J, eds. In vitro-in vivo correlations. p. 1-15.
77

Three Critical Biopharmaceutical Properties - Drug Solubility Relative to Dose - Dissolution Rate of Formulation - Intestinal Permeability of Drug
78
Bioavailability vs. Jejeunal Permeability* Chart illustrating this comparison for several prototype drugs. * From Amidon GL et al. Pharm Res 1995;12:413-20.
79

Bioavailability vs. Caco-2 Cell Permeability Papp*
Chart illustrating this in vitro-in vivo correlation. *From Arturson P, Karlsson J. Biochem Biophys Res Commun 1991;175:880-5
80

Evaluation of Caco-2 Cell Model
- ADVANTAGES
- In Vitro Method - Suitable for High-Throughput
- DISADVANTAGES
- ↓ Paracellular Permeability -
- ↓ Drug Metabolizing Enzymes and Transporters
- No Hepatic First-Pass Metabolism
81
BIOPHARMACEUTIC DRUG CLASSIFICATION *
CLASS I: HIGH SOLUBILITY-HIGH PERMEABILITY
- in vitro – in vivo correlation generally good
- but no way to account for 1st pass metabolism From: Amidon GL, et al. Pharm Res 1995;12:413-20
82

BIOPHARMACEUTIC DRUG CLASSIFICATION *
CLASS II: LOW SOLUBILITY-HIGH PERMEABILITY
- rate of absorption limited by dissolution rate
- in vitro – in vivo correlation tenuous since many factors may affect dissolution From: Amidon GL, et al. Pharm Res 1995;12:413-20
83

BIOPHARMACEUTIC DRUG CLASSIFICATION *
CLASS III: HIGH SOLUBILITY-LOW PERMEABILITY
- Intestinal reserve length is marginal. - If dissolution is rapid, bioavailability will
reflect intestinal permeability and transit time. * From: Amidon GL, et al. Pharm Res 1995;12:413-20
84
BIOPHARMACEUTIC DRUG CLASSIFICATION *
CLASS IV: LOW SOLUBILITY-LOW PERMEABILITY
- in vitro – in vivo correlation poor - good bioavailability not expected
* From: Amidon GL, et al. Pharm Res 1995;12:413-20
85
86
THE BOTTOM LINE
CLASS I DRUGS: HIGH SOLUBILITY-HIGH PERMEABILITY
- Preferred as development candidates - FDA may waive repeat in vivo testing if initial
formulation has good bioavailability*. *Waiver of In Vivo Bioavailability and Bioequivalence Studies for Immediate-Release Solid Oral Dosage Forms Based on a Biopharmaceutics Classification System, CDER Guidance for Industry, August 2000.