Embed Size (px)
Citation preview

CLINICAL PHARMACOKINETICS Juan J.L. Lertora, M.D., Ph.D.
Director Clinical Pharmacology Program
Office of Clinical Research Training and Medical Education
National Institutes of Health Clinical Center

USES OF PHARMACOKINETICS • Basis for rational dose selection in therapeutics • Development and evaluation of new drugs • Basic studies of drug distribution (PET Scan)

Target Concentration Strategy ESTIMATE INITIAL DOSE TARGET LEVEL LOADING DOSE MAINTENANCE DOSE Down arrow Begin therapy Down arrow Assess Therapy Patient Response Drug level Down arrow Refine Dose Estimate – Arrow back to Assess Therapy Adjust Dose (return to Assess Therapy)

RATIONALE FOR
PLASMA LEVEL MONITORING Flowchart for rationale for plasma level monitoring beginning with Prescribed dose and ending in effect.

FIRST DESCRIPTION OF THERAPEUTIC DRUG
MONITORING Copy of this article from Wuth O. JAMA 1927;88:2013-17.

RADIOIMMUNOASSAY
Photo of Rosalyn Sussman Yalow – 1977 Nobel Laureate

GAS LIQUID CHROMATOGRAPHY Photo of gas liquid chromatography

HIGH PERFORMANCE
LIQUID CHROMATOGRAPHY Photo of high performance liquid chromatograph
FLUORESCENCE POLARIZATION IMMUNOASSAY
Photo of TDX FPIA Analyzer

DRUG CANDIDATES FOR TDM • Low therapeutic index • No physiologic or therapeutic endpoints to guide dosage • Pharmacokinetics vary widely between individuals • Need to monitor adherence?
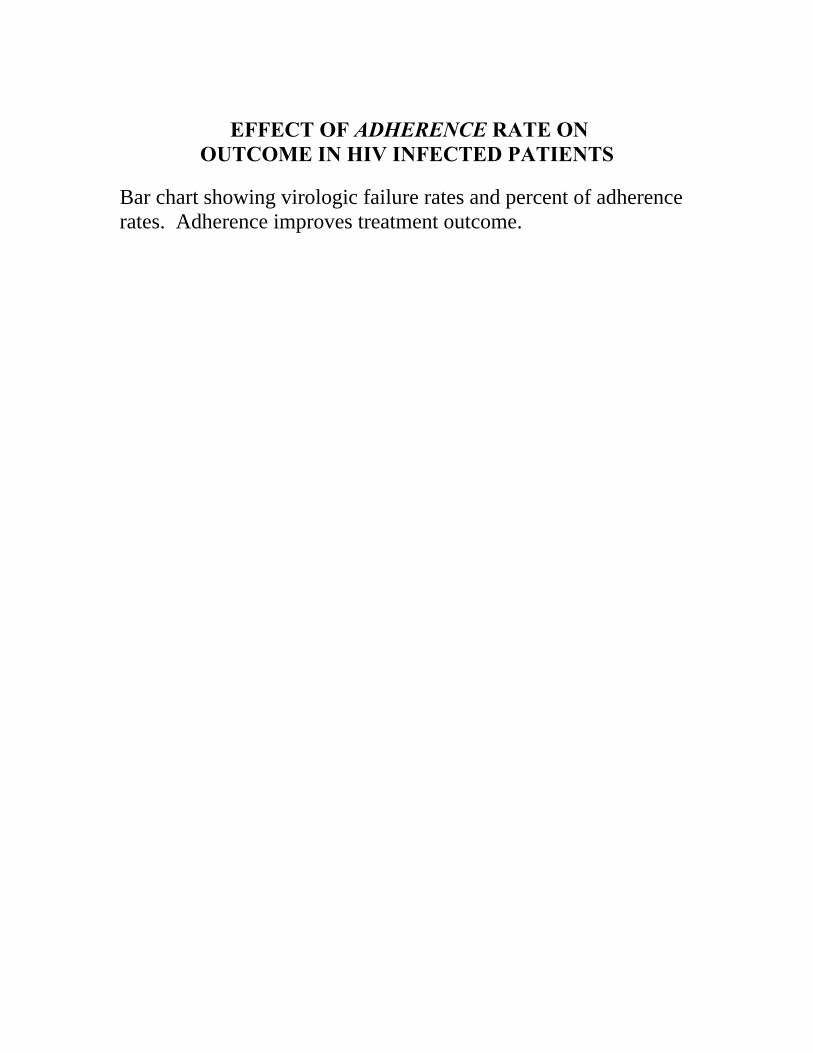
EFFECT OF ADHERENCE RATE ON
OUTCOME IN HIV INFECTED PATIENTS Bar chart showing virologic failure rates and percent of adherence rates. Adherence improves treatment outcome.

INDICATIONS for Measuring Blood Levels • To evaluate suspected toxicity • To evaluate actual or potential lack of therapeutic
efficacy • To monitor prophylactic therapy • To guide dose adjustment

Target Concentration Strategy Estimate initial dose Target level Loading dose Maintenance dose

DIGOXIN Levels in TOXIC and NONTOXIC Patients*
Chart showing that from Smith TW and Haber E. J Clin Invest 1970;49-2377-86
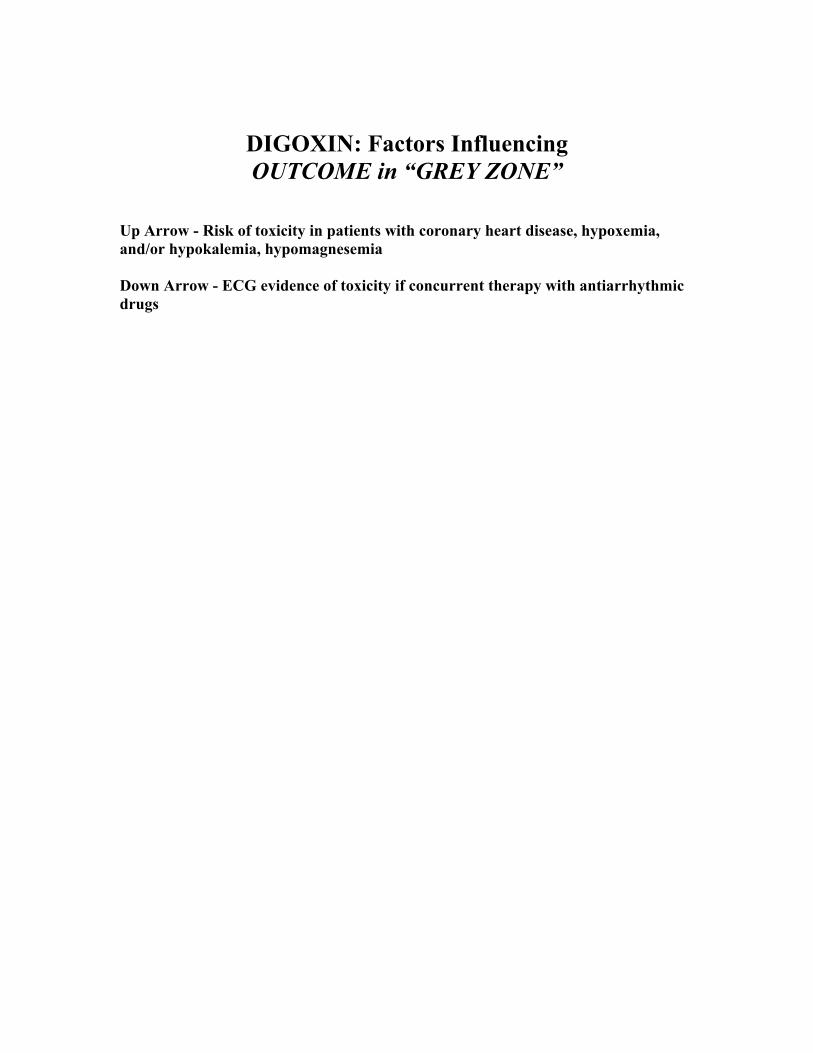
DIGOXIN: Factors Influencing OUTCOME in “GREY ZONE”
Up Arrow - Risk of toxicity in patients with coronary heart disease, hypoxemia, and/or hypokalemia, hypomagnesemia Down Arrow - ECG evidence of toxicity if concurrent therapy with antiarrhythmic drugs

TRADITIONAL Guidelines
for DIGOXIN Levels THERAPEUTIC RANGE: 0.8 - 1.6 ng/mL POSSIBLY TOXIC LEVELS: 1.6 - 3.0 ng/mL PROBABLY TOXIC LEVELS: greater than 3.0 ng/mL
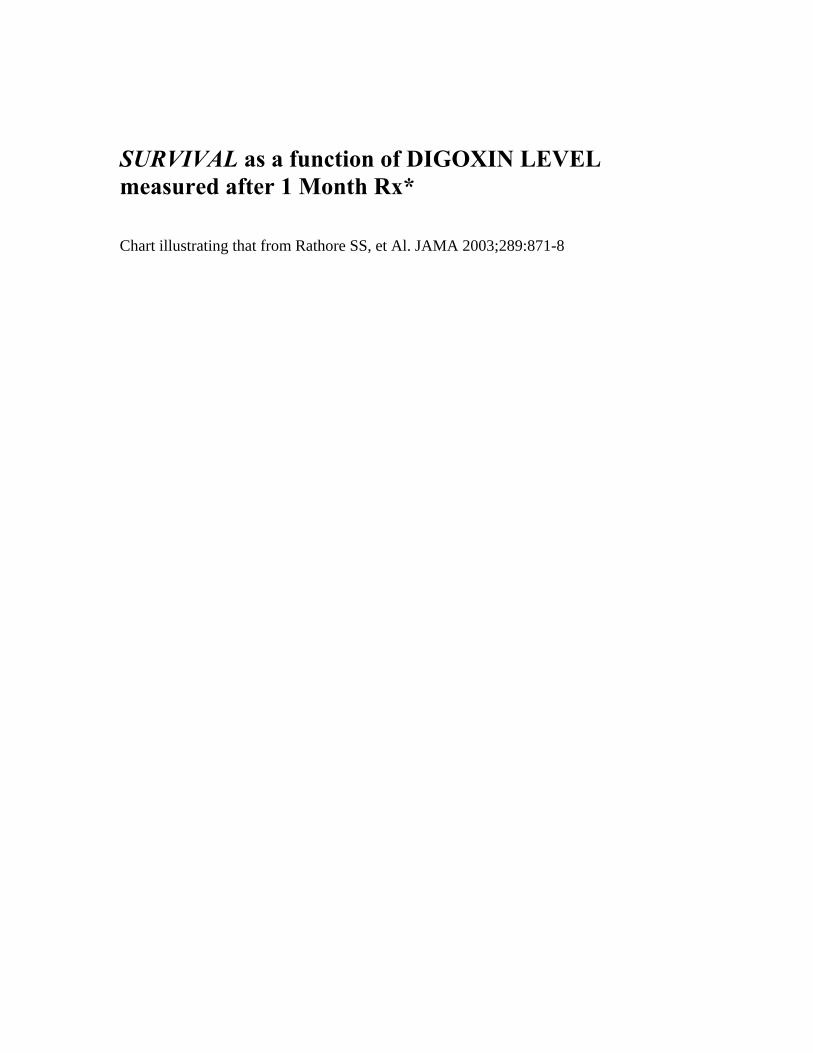
SURVIVAL as a function of DIGOXIN LEVEL measured after 1 Month Rx* Chart illustrating that from Rathore SS, et Al. JAMA 2003;289:871-8

PROPOSED Range of DIGOXIN LEVELS for OPTIMAL
THERAPY in CHF New Therapeutic Range: 0.5 - 0.9 ng/mL Benefit results from INHIBITION OF SYMPATHETIC NERVOUS SYSTEM rather than (up arrow) INOTROPY BUT DIGOXIN DOSES PRESCRIBED FOR PATIENTS WITH THIS RANGE OF DIGOXIN LEVELS SHOULD HAVE BEEN ASSOCIATED WITH HIGHER LEVELS?
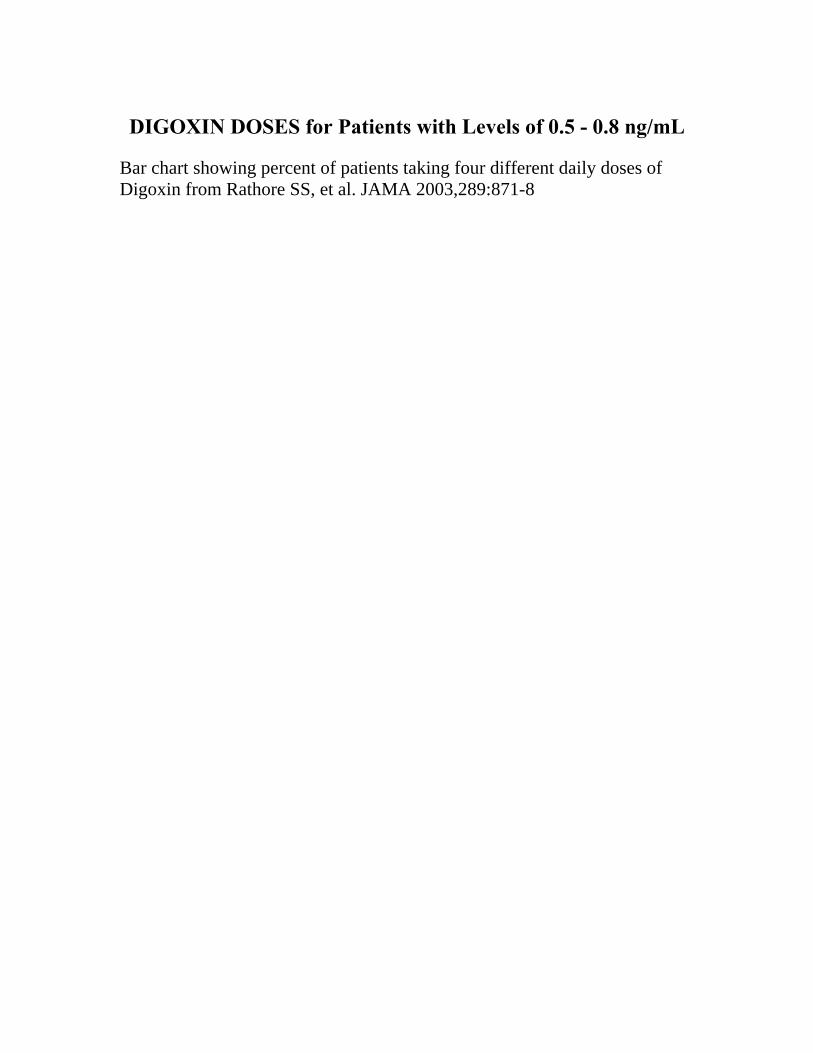
DIGOXIN DOSES for Patients with Levels of 0.5 - 0.8 ng/mL
Bar chart showing percent of patients taking four different daily doses of Digoxin from Rathore SS, et al. JAMA 2003,289:871-8

Target Concentration Strategy ESTIMATE INITIAL DOSE TARGET LEVEL LOADING DOSE MAINTENANCE DOSE BASED ON CONCEPT OF DISTRIBUTION VOLUME

DIGOXIN LEVELS after IV Dose Chart illustrating this showing the distribution phase and the elimination phase

Initial Digitalization Formula relating initial dose, initial digoxin concentration and apparent volume of distribution.
3 DISTRIBUTION VOLUMES

DISTRIBUTION DELAYS ONSET
of DIGOXIN Chronotropic Action* Chart from Gold H, et al. J Pharmacol Exp Ther 1953;109:45-57

DISTRIBUTION DELAYS ONSET of
DIGOXIN Inotropic Action* Chart

Target Concentration Strategy Estimate initial dose Target level Loading dose Maintenance dose Based on concepts Elimination half life and clearance

ELIMINATION HALF-LIFE ELIMINATION HALF-LIFE IS THE TIME REQUIRED FOR THE PLASMA CONCENTRATION (OR TOTAL BODY STORES) OF A DRUG TO FALL TO HALF OF THE CONCENTRATION (OR AMOUNT) PRESENT AT SOME PREVIOUS TIME.
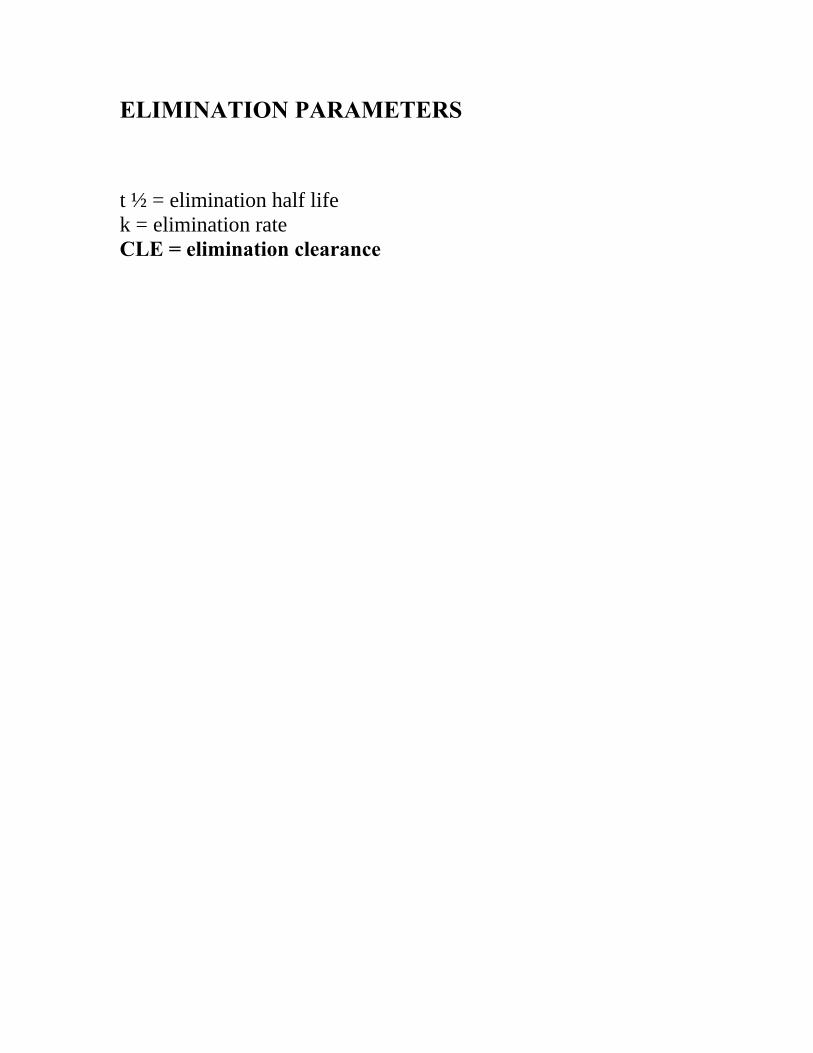
ELIMINATION PARAMETERS t ½ = elimination half life k = elimination rate CLE = elimination clearance

Maintenance Digoxin Therapy Formula relating maintenance dose to daily digoxin loss from the body.

DIGOXIN CUMULATION Formula showing exponential accumulation of digoxin.

CUMULATION FACTOR τ = dose interval k = elimination rate constant
τ = dose interval k = elimination rate constant

ELIMINATION RATE CONSTANT

LOADING & MAINTENANCE DOSES Chart showing Digoxin levels over time as a function of loading and maintenance dosing.

TIME-COURSE OF DIGOXIN CUMULATION Chart showing plasma Digoxin levels over time. Steady-state levels take longer to be reached in patients with uremia.

DIGOXIN CASE HISTORY A 39 year-old man with mitral stenosis was hospitalized for mitral valve replacement (October 1981). He had a history of chronic renal failure resulting from interstitial nephritis and was maintained on hemodialysis. His mitral valve was replaced with a prosthesis and digoxin therapy was initiated postoperatively in a dose 0.25 mg/day.
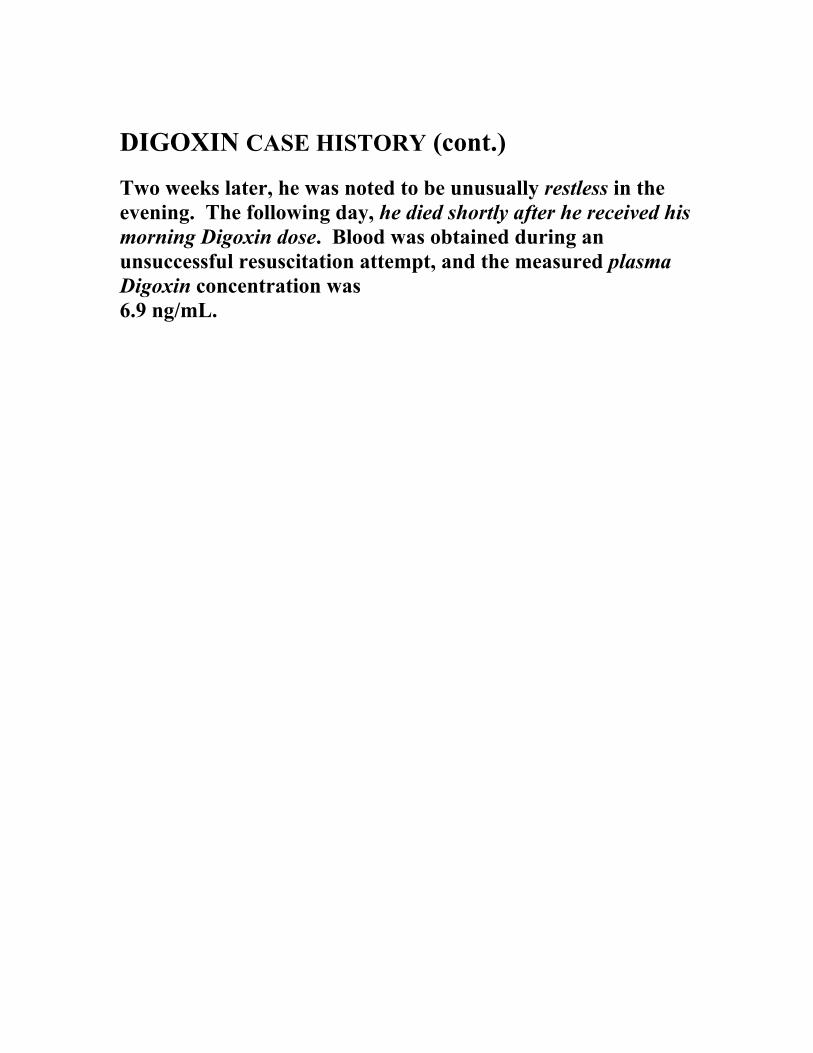
DIGOXIN CASE HISTORY (cont.) Two weeks later, he was noted to be unusually restless in the evening. The following day, he died shortly after he received his morning Digoxin dose. Blood was obtained during an unsuccessful resuscitation attempt, and the measured plasma Digoxin concentration was 6.9 ng/mL.

Target Concentration Strategy ESTIMATE INITIAL DOSE TARGET LEVEL LOADING DOSE MAINTENANCE DOSE Down arrow BEGIN THERAPY Down arrow ASSESS THERAPY PATIENT RESPONSE DRUG LEVEL Down Arrow REFINE DOSE ESTIMATE Down arrow ADJUST DOSE (Arrow back to Assess Therapy)

Target Concentration Strategy ESTIMATE INITIAL DOSE TARGET LEVEL LOADING DOSE MAINTENANCE DOSE Down arrow BEGIN THERAPY Down arrow ASSESS THERAPY PATIENT RESPONSE DRUG LEVEL Down Arrow REFINE DOSE ESTIMATE Down arrow ADJUST DOSE (Arrow back to Assess Therapy)
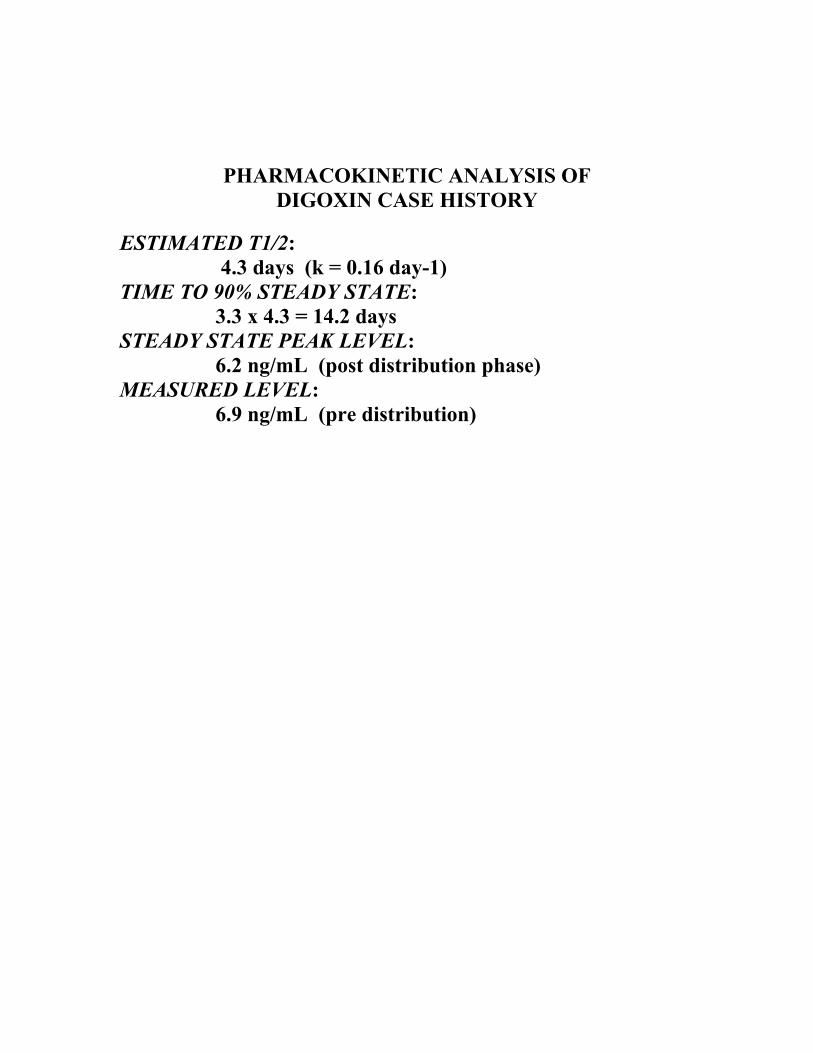
PHARMACOKINETIC ANALYSIS OF DIGOXIN CASE HISTORY
ESTIMATED T1/2: 4.3 days (k = 0.16 day-1) TIME TO 90% STEADY STATE: 3.3 x 4.3 = 14.2 days STEADY STATE PEAK LEVEL: 6.2 ng/mL (post distribution phase) MEASURED LEVEL: 6.9 ng/mL (pre distribution)
STEADY STATE CONCENTRATION Continuous infusion: Intermittent Dosing:

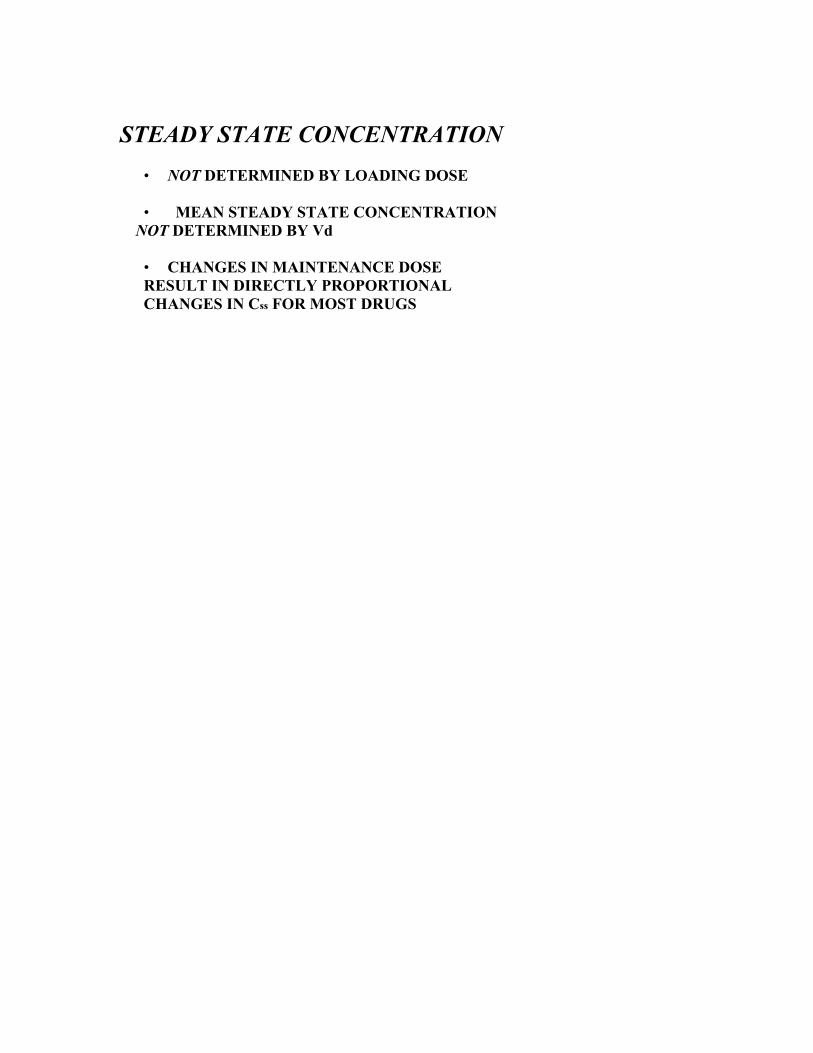
STEADY STATE CONCENTRATION
• Not determined by loading dose
• Mean steady state concentration not determined by Vd
• Peak and trough are affected by Vd

Vd AFFECTS PEAK AND TROUGH BUT NOT MEAN LEVELS
Chart illustrating this
FOR MOST DRUGS, Css IS PROPORTIONAL TO DOSE
(Dosing Rate) Continuous Infusion: Intermittent dosing:
STEADY STATE CONCENTRATION
• NOT DETERMINED BY LOADING DOSE
• MEAN STEADY STATE CONCENTRATION NOT DETERMINED BY Vd
• CHANGES IN MAINTENANCE DOSE RESULT IN DIRECTLY PROPORTIONAL CHANGES IN Css FOR MOST DRUGS

PHARMACOKINETIC MODELS
WHAT PHARMACOKINETIC PARAMETERS ARE PRIMARY?

SINGLE COMPARTMENT MODEL
Example diagram

ELIMINATION HALF-LIFE Therefore, t ½ is t a primary pharmacokinetic parameter
3 DISTRIBUTION VOLUMES

Some Drugs are NOT Eliminated by First Order Kinetics Phenytoin (Dilantin) Ethyl Alcohol Acetylsalicylic Acid (aspirin)
Phenytoin Hydroxylation Chemical structure

Chart
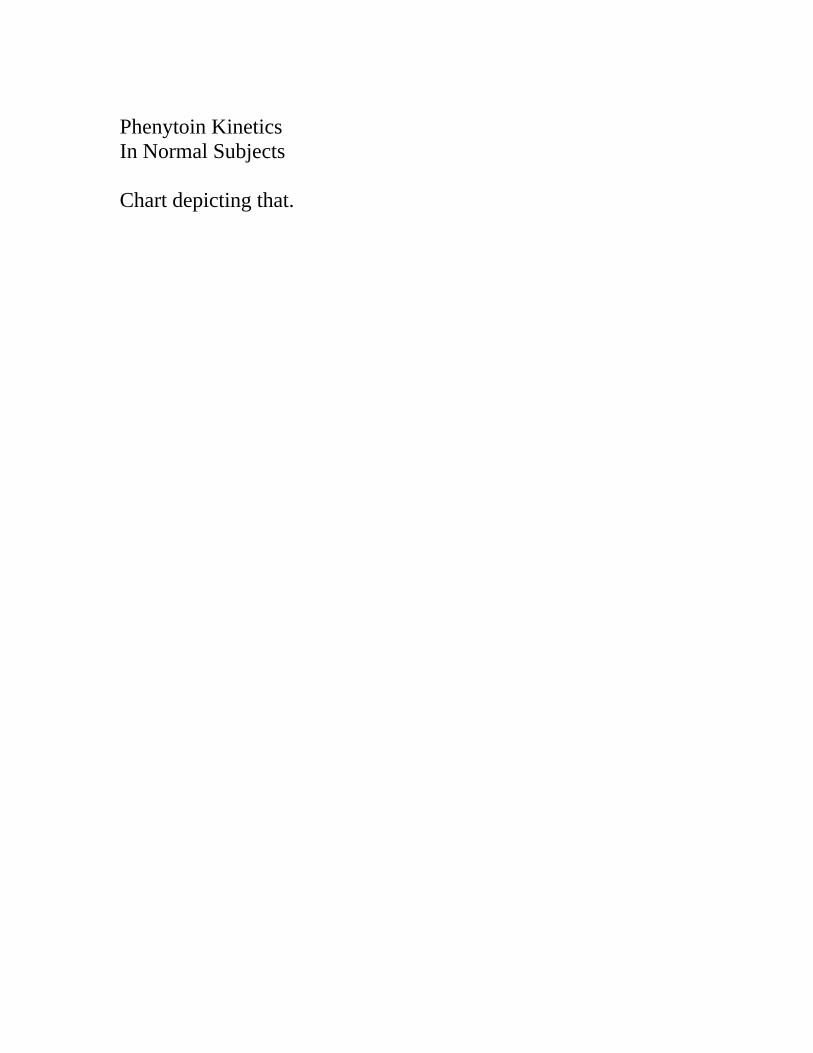
Phenytoin Kinetics In Normal Subjects Chart depicting that.

Steady State Equations
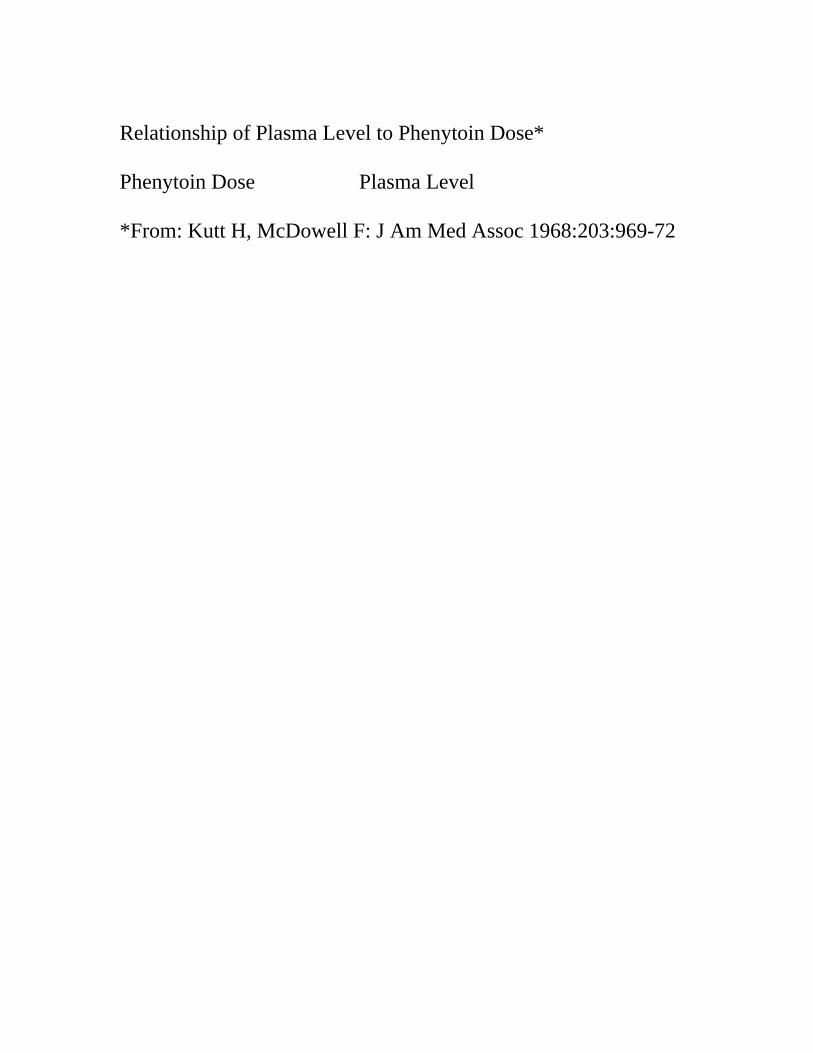
Relationship of Plasma Level to Phenytoin Dose* Phenytoin Dose Plasma Level *From: Kutt H, McDowell F: J Am Med Assoc 1968:203:969-72

Patient who Became Toxic on a Phenytoin Dose of 300 mg/day Chart illustrating this.

Phenytoin Case History After inpatient evaluation for a generalized seizure, a 28-year-old woman was discharged on phenytoin therapy at a dose of 300 mg/day. After 5 days of therapy, she presented to the hospital’s emergency department with marked ataxia. Her phenytoin plasma concentration was found to be 27 μg/mL. She was sent home on a reduced phenytoin dose of 200 mg/day.

Phenytoin Case History (cont.) Two days later, she returned to the emergency department with more severe ataxia. Her phenytoin plasma concentration was now 32 μg/mL. Non-compliance was suspected but a clinical pharmacology evaluation was requested.

Patient with Very Low VMAX Chart depicting this.

Concluding Thoughts
• PRACTICE PROBLEMS AT END OF CHAPTER 2 WITH ANSWERS IN APPENDIX II
• EQUATIONS DERIVED IN “PRINCIPLES OF CLINICAL PHARMACOLOGY” TEXTBOOK
• LAPLACE TRANSFORMS INTRODUCED WITH TABLES IN APPENDIX I


![Clinical Pharmacokinetics Samplechapter[1]](https://img.dokumen.tips/doc/110x75/577d34e41a28ab3a6b8f1c1d/clinical-pharmacokinetics-samplechapter1.jpg)