Embed Size (px)
Citation preview

MARINE ECOLOGY PROGRESS SERIESMar Ecol Prog Ser
Vol. 459: 39–52, 2012doi: 10.3354/meps09771
Published July 12
INTRODUCTION
Primary production in the ocean accounts for ap-proximately 50% of total global production (Field etal. 1998). Of this, heterotrophic protists, such as cili-ates and dinoflagellates, can consume on average67% of daily primary production (Calbet & Landry2004). It has been suggested that even a quantita-tively small disruption of predation pressure relativeto phytoplankton growth can lead to large-scale phe-nomena such as the North Atlantic Spring Bloom(Behrenfeld 2010). Grazing by heterotrophic protistscan alter the abundance, community composition,
and size structure of phytoplankton, as well as glob-ally important rates of primary and export production.Phytoplankton population dynamics can be analyzedand predicted using models (Franks 2001); however,it has been difficult to parameterize such models andthus establish reliable predictions of the magnitude ofgrazer-induced mortality rates (Li et al. 2011).
Although the importance of protistan rates of her-bivory to phytoplankton production and biomass arenow well established from an extensive set of exper-iments (Calbet & Landry 2004), it is still unknownwhat factors drive the magnitude of grazing pres-sure. Measured grazing rates are frequently not
© Inter-Research 2012 · www.int-res.com*Corresponding author. Email: [email protected]
Drivers of protistan grazing pressure: seasonal signals of plankton community composition and
environmental conditions
Caitlyn Lawrence, Susanne Menden-Deuer*
Graduate School of Oceanography, University of Rhode Island, Rhode Island, USA
ABSTRACT: Rates of heterotrophic protist grazing and phytoplankton growth were measuredweekly to bi-weekly in Narragansett Bay, Rhode Island, USA, from January 2010 to February2011. In situ sensor data and species composition were collected concomitantly to link patterns inplankton dynamics with ancillary environmental and biological processes. Annual average phyto-plankton growth rates were 0.69 ± 0.58 d−1, and heterotrophic protist grazing rates were 0.79 ±0.61 d−1. Phytoplankton growth rates were at times negative in both winter and spring. Nutrientlimitation was only detected during summer, and negative growth rates in winter did not resultfrom nutrient limitation. On an annual average, grazing removed 96% (20 to 200%) of primaryproduction, with peaks in both phytoplankton growth and heterotrophic protist grazing rates dur-ing summer. There was no relationship between protistan herbivory rates and initial chlorophyll aconcentration. Dominant grazer taxa changed seasonally. Heterotrophic dinoflagellates domi -nated in summer and were associated with significantly higher than average grazing rates(>1 d−1). Seasonal changes in grazing rates were most significantly characterized by seasonalchanges in both temperature and plankton community composition. The relative effects of temperature and species composition could not be distinguished statistically. The magnitude ofprotistan grazing and subsequent effects on trophic transfer and primary production rates as wellas phytoplankton community composition may be better understood and parameterized whengrazing pressure is evaluated in relation to species composition and environmental conditionsrather than bulk measures of biomass.
KEY WORDS: Heterotrophic protist · Grazing · Seasonal · Dilution · Phytoplankton · Estuary ·Food-web dynamics
Resale or republication not permitted without written consent of the publisher

Mar Ecol Prog Ser 459: 39–52, 2012
related to obvious variables, such as total phyto-plankton biomass measured as chlorophyll a (chl a)concentration (Strom et al. 2001, Sherr et al. 2009,Menden-Deuer & Fredrickson 2010). To identify thedrivers of protistan herbivory rates, it is important toidentify the biotic, environmental, and seasonal fac-tors that govern the magnitude of these grazing ratesin order to predict the magnitude of grazing pressureand thus primary production and biomass accumula-tion rates.
Coastal waters in temperate regions are subject tosignificant seasonal variation in both environmentalconditions and biological processes and thus theseecosystems lend themselves to investigating influ-ences of environmental factors on biological rates.Seasonal grazer-dependent changes in food webstructure and plankton assemblage have been iden-tified from detailed studies of both environmentalconditions and plankton community composition andproduction (Tamigneaux et al. 1997). A seasonalstudy in a coastal Mediterranean lagoon found sig-nificant seasonality in picoeukaryote growth rates aswell as heterotrophic protist grazing rates, but noseasonal signal for growth of or grazing on phyto-plankton >2 µm (Bec et al. 2005). A year-long inves-tigation of nanoplankton population dynamics inNarragansett Bay found that on average, 62% ofdaily primary production of the <5 µm chl a standingstock were grazed by heterotrophic protists, mainlyciliates, which gave rise to seasonal variation in theabundance of different size fractions (Verity 1986).Both studies suggest strong seasonality in growth ofphytoplankton <5 µm and their mainly ciliate preda-tors. However, this smaller size fraction excludesdiatoms, frequently the most productive componentof estuarine plankton communities.
The goal of this study was to quantify seasonalchanges in heterotrophic protist grazing rates on nat-ural phytoplankton assemblages and describe theenvironmental context in which they occur. Thesetypes of data are necessary to identify associationsamong environmental and biological processes andmay be applicable to predictive modeling studies.The research presented here was conducted in anestuary, an ecosystem where plankton populationsare often more productive than in the open ocean asa result of land associations such as nutrient enrich-ment (Cloern & Jassby 2008). Narragansett Bay is awell-mixed, relatively shallow (mean depth 9 m),highly productive estuary located on the northeastcoast of the US (Martin 1965, Borkman & Smayda2009a). It is the site of the longest microplanktonmonitoring project in the US, which commenced in
the 1950s, and which characterizes weekly planktoncommunity composition and environmental variables(Pratt 1959, Borkman & Smayda 2009a,b). Phyto-plankton biomass in lower Narragansett Bay is fre-quently dominated by diatoms, often large or chain-forming species (Pratt 1959, Martin 1965, Karentz &Smayda 1998, Borkman & Smayda 2009a). Although>200 species are regularly observed in NarragansettBay samples, Skeletonema spp. often dominate summer and winter seasons, both numerically and by biomass. Abundant co-occurring phytoplanktoninclude Thalassiosira spp., Chaetoceros spp., andnano flagellates. In this study, protistan grazing andphytoplankton growth rates were quantified andcompared to biotic and environmental drivers overthe course of one seasonal cycle. We hypothesizedthat seasonal shifts in environmental conditions andspecies composition drive changes in populationdemographic and trophic rates.
MATERIALS AND METHODS
Study site and sampling program
Water samples were collected weekly from the sur-face of a station in the West Passage of NarragansettBay (41° 34.5’ N, 71° 24.3’ W, Fig. 1). Net phytoplank-ton growth and grazer-induced mortality rates weremeasured using the dilution method (Landry & Has-sett 1982) in a 2-point modification (Worden & Binder2003, Landry et al. 2008, Strom & Fredrickson 2008).In total, 44 dilution experiments were conductedfrom 26 January 2010 through 21 February 2011.Whole surface seawater samples (WSW) were col-lected using a bucket and gently filtered through a200 µm mesh to remove mesozooplankton predators.Sample water was kept dark in 10 l polycarbonatecarboys while in transit to the laboratory. A portion ofthe water was then gravity filtered through a 0.2 µmfilter (Pall) to yield filtered seawater (FSW). WSWwas diluted with FSW to 10% WSW. Triplicates foreach dilution level (10% and 100%) were incubatedin clear, 1.2 l polycarbonate bottles in ambient sea-water, light, and temperature for 24 h, rotating at 2 to3 rpm in a flow-through seawater incubator. Chl awas extracted in triplicate when bottles were filledinitially (T0) and in triplicate from each of the tripli-cate dilution bottles after 24 h (TF) for total chl a con-centration measurements following Graff & Rynear-son (2011). The volume filtered ranged from 50 to200 ml depending on phytoplankton abundance.Acid-washed polycarbonate bottles and silicon tub-
40

Lawrence & Menden-Deuer: Protistan grazing in an estuary
ing were used throughout to eliminate toxicity effectson heterotrophic protists (Price et al. 1986).
Use of the dilution method to quantify grazingpressure relies on the assumptions that grazing rateis a linear function of dilution and by implication preyconcentration. The 2-point modification of the dilu-tion method employed here does not identify non -linear feeding responses, which are observed, forexample, if feeding is saturated at high prey concen-trations (Gallegos 1989, Lessard & Murrell 1998,Worden & Binder 2003). See Moigis (2006) for a thor-ough comparative analysis of the effects of non -linear feeding responses on estimates of both growthand grazing rates. The grazing rate estimates hereare based on the 2-point method and provide a mini-mum estimate of the grazing pressure. Grazing rate(g, d−1) and net phytoplankton growth rate (k, d−1)were calculated following Worden & Binder (2003).Net phytoplankton growth was calculated for each
dilution level as k = (1/t) × ln(Pt/P0), where Pt and P0
are the final and initial concentration of chl a, respec-tively, and t is the length of incubation period in days.Previous studies have shown that the net phyto-plankton growth rate for the most dilute fraction (k,d−1) was not significantly different from the instanta-neous growth rate (μ, d−1) when comparing the 2-point method with a multi-point dilution experiment(Worden & Binder 2003, Strom & Fredrickson 2008)and can be taken as a conservative estimate of theinstantaneous growth rate (Worden & Binder 2003).Protistan grazing rate was calculated as the differ-ence in growth rates between the 2 dilution fractions.Samples with negative values of grazing and netphytoplankton growth were modified as in Calbet &Landry (2004): negative phytoplankton growth rateswere set to 0.01 d−1 while negative grazing rateswere set to 0 d−1. Replication within experimentsshowed that methodological variation was low for thedilution experiments; the total coefficient of variation(CV) for both growth and grazing rates from tripli-cate measurements in each of the triplicate incuba-tions with and without nutrients throughout the yearwas ≤12%.
The ratio between grazing rate (g, d−1) and phyto-plankton growth rate (k, d−1) was used to estimatepercent primary production consumed (%PP = g/k ×100). Dates on which no significant growth was mea-sured were not used to calculate %PP consumed.
The use of the exponential growth equation (Pn =P0ert) assumes that nutrients were not limiting duringthe incubation. To account for potential nutrient lim-itation, experiments were run both with added nutri-ents at saturating concentrations and without addednutrients. In summer 2010, 3 nutrient-amended ex -periments were conducted, in which nutrients wereadded to parallel experiments with triplicate bottlesat both the 10% and 100% WSW levels. Evidence ofsignificant nutrient limitation during the summer ledto further nutrient-amended experiments to deter-mine the seasonal extent of nutrient limitation.Biweekly nutrient-amended experiments were con-ducted from October 2010 through February 2011,although one experiment on 3 November 2010 wasremoved because chl a was contaminated in thenon-nutrient-amended experiment. In each of these12 experiments, triplicates of 100% and 10% WSWwere prepared as before with the addition of non-limiting concentrations of nitrate and phosphate toa final concentration of 10 and 2 µmol l−1, respec-tively to both the 10% and 100% WSW treatments.Nutrient concentrations for amendments were basedon maximum average nutrient concentrations ob -
41
Fig. 1. Narragansett Bay, Rhode Island, USA, showing thelocation of the Narragansett Bay Time Series station(41° 34.5’ N, 71° 24.3’ W). Map source: Rhode Island Geo-graphic Information Systems (RIGIS), www. edc. uri. edu/rigis/. Projection: RI Stateplane Feet; FIPS Zone: 3800;
Datum NAD 83

Mar Ecol Prog Ser 459: 39–52, 2012
served in Narragansett Bay between spring 2003 and January 2010 from the long-term phytoplanktonmonitoring dataset, effectively adding nutrients inexcess at concentrations equal to maximum in situobserved nutrient concentrations. Samples with neg-ative growth were included in the statistical analysisif growth rates were not limited by nutrient avail -ability; however, samples with negative net growthwere removed when no nutrient-added control was available.
Historical data set
The dilution experiments were conducted withsamples from the same site as those from the Narra-gansett Bay Long-Term Plankton Monitoring pro-gram, initiated in 1952 (Fig. 1; Pratt 1959, Smayda1998). Sample collection for the monitoring programincludes weekly analysis of plankton communitycomposition, size fractionated chl a, macronutrients,turbidity, and temperature, salinity, and dissolvedoxygen measured using an in situ profiler (YellowSprings Instrument YSI 6920 V2).
In addition to water quality analysis, local meteoro-logical variables, such as wind velocity and precipita-tion (monitored at T.F. Green Airport by the NationalOceanic and Atmospheric Administration, www.ncdc. noaa.gov/oa/ncdc.html), as well as irradiance(monitored by Woods Hole Oceanographic Institu-tion, http://cis.whoi.edu/science/PO/climate) werecompiled. Irradiance, measured in W h m−2, was usedfor statistical analysis. These meteorological vari-ables, along with species-specific cell counts, tem-perature, salinity, and dissolved oxygen gathered forthe long-term phytoplankton monitoring program,were used in the analysis of the growth and grazingrate data and to characterize seasonal trends.
Plankton species composition and abundance
For every grazing experiment, plankton commu-nity composition and numerical abundance weredetermined from field samples in accordance withthe methods used for the long-term plankton moni-toring project. A Sedgwick-Rafter (1 ml volume)chamber was used to enumerate live plankton sam-ples to the lowest taxonomic level possible (genus orspecies) using a Nikon Eclipse E800 light microscopeequipped with phase contrast. In order to determineinitial abundance of rarer heterotrophic protists, 10 to50 ml of 3% Lugol’s preserved samples were counted
for all samples (Utermöhl 1958). Due to week-to-week variation in community composition, hetero -trophic protist species were aggregated into the fol -lowing groups to determine numerical dominance:loricate and aloricate ciliates, and heterotrophic dino -flagellates. While other grazer species and groups,including Ebria sp. and silicoflagellates, includingDictyocha speculum, were observed in 7 of the sam-ples, abundances were too low (≤7 ml−1) to includethem in the analysis.
Carbon content was estimated for the 10 mostabundant phytoplankton taxa (genus or species) present during the dilution experiment. Cells (n =100 to 1000) were photographed with a microscope-mounted camera (Allied Vision Technology, StingrayF-146), and the length and width for each cell weremeasured using ImageJ software (National Institutesof Health). Depending on cell shape, cell volume wascalculated assuming a sphere, cylinder, or prolatespheroid. Cell volumes were converted to carboncontent using group-specific regression equations(Menden-Deuer & Lessard 2000).
Statistical analysis
A paired t-test was used to determine whethernutrient addition significantly altered phytoplanktongrowth rates. Linear regression analysis (Model 1)was used to describe the association between chl aconcentration (µg l−1) and grazing rate (d−1). Whenrelating temperature (°C) to grazing rate (d−1), linearand non-linear regression models were applied andthe one with maximum r2 and minimal p value waschosen. Principal component analysis (PCA) andmultidimensional scaling (MDS) analyses were usedto reduce dimensionality of multivariate environ-mental data or phytoplankton taxa, respectively, overthe course of the year. Data points for 3 wk represent-ing extreme flooding and a >10 psu drop in salinity inMarch 2010 were removed, as they obscured allother relationships. This flooding event included thehighest chl a concentration measured, >29 µg l−1.
To determine seasonal patterns in phytoplanktoncommunity composition, multivariate analysis inPRIMER-E v6 (Plymouth Routines in MultivariateEcological Research) was used. Genus/speciesgroups were fourth-root transformed to reduce biasof plankton taxa with high cell abundances. Phyto-plankton abundances were compared to season andgrazing as well as environmental data. Seasons weredelineated as follows: winter = December, January,and February; spring = March, April, and May; sum-
42
Lawrence & Menden-Deuer: Protistan grazing in an estuary
mer = June, July, and August; fall = September, Octo-ber, and November. Protistan grazing rate was parti-tioned into 2 groups representing the relative level ofgrazing; grazing rates that were ≤0.75 d−1 = low graz-ing and >0.75 d−1 = high grazing. Variations in envi-ronmental conditions were compared to season usinganalysis of similarity (ANOSIM, PRIMER-E). Theassociation between environmental data and seasonis described by the global R statistic and can rangefrom 1 to −1. High values of R, approaching 1, indi-cate similarity within and separation among groups,and 0 indicates no relationship. The degree of associ-ation between non-normally distributed variableswas analyzed using Spearman rank correlation. Sta-tistical significance was assigned at p values ≤0.05.
RESULTS
Seasonal patterns
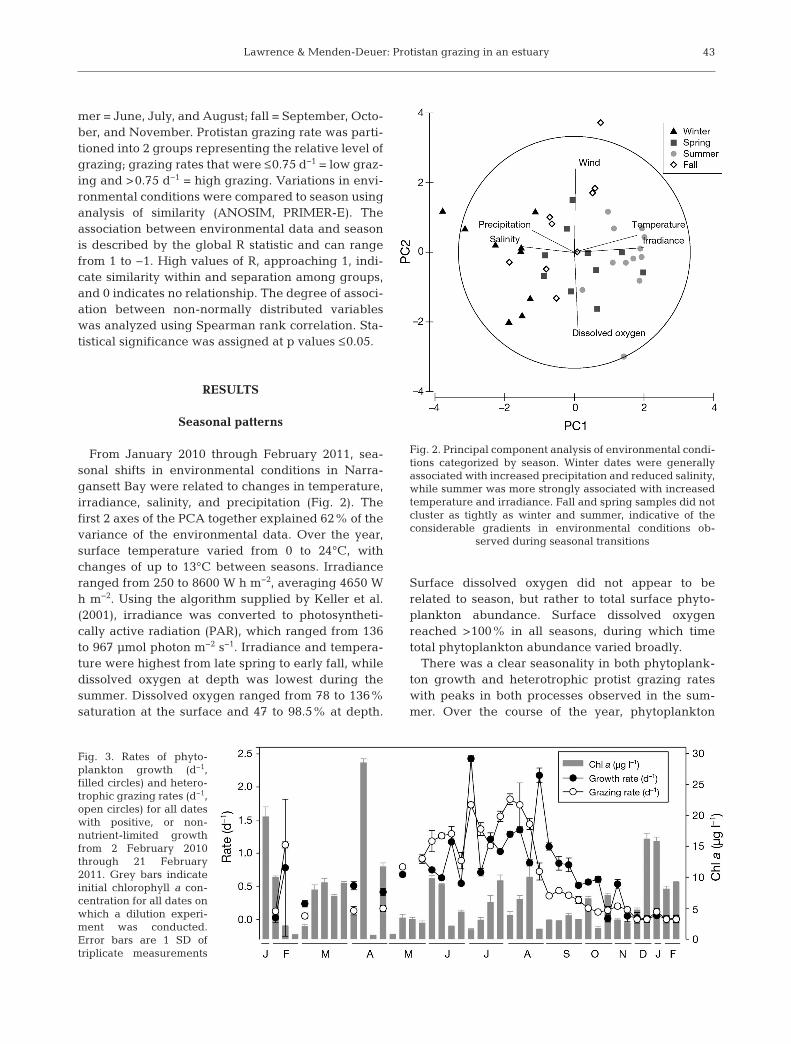
From January 2010 through February 2011, sea-sonal shifts in environmental conditions in Narra-gansett Bay were related to changes in temperature,irradiance, salinity, and precipitation (Fig. 2). Thefirst 2 axes of the PCA together explained 62% of thevariance of the environmental data. Over the year,surface temperature varied from 0 to 24°C, withchanges of up to 13°C between seasons. Irradianceranged from 250 to 8600 W h m−2, averaging 4650 Wh m−2. Using the algorithm supplied by Keller et al.(2001), irradiance was converted to photosyntheti-cally active radiation (PAR), which ranged from 136to 967 µmol photon m−2 s−1. Irradiance and tempera-ture were highest from late spring to early fall, whiledissolved oxygen at depth was lowest during thesummer. Dissolved oxygen ranged from 78 to 136%saturation at the surface and 47 to 98.5% at depth.
Surface dissolved oxygen did not appear to berelated to season, but rather to total surface phyto-plankton abundance. Surface dissolved oxygenreached >100% in all seasons, during which timetotal phytoplankton abundance varied broadly.
There was a clear seasonality in both phytoplank-ton growth and heterotrophic protist grazing rateswith peaks in both processes observed in the sum-mer. Over the course of the year, phytoplankton
43
Fig. 2. Principal component analysis of environmental condi-tions categorized by season. Winter dates were generallyassociated with increased precipitation and reduced salinity,while summer was more strongly associated with increasedtemperature and irradiance. Fall and spring samples did notcluster as tightly as winter and summer, indicative of theconsiderable gradients in environmental conditions ob -
served during seasonal transitions
Fig. 3. Rates of phyto-plankton growth (d−1,filled circles) and hetero-trophic grazing rates (d−1,open circles) for all dateswith positive, or non-nutrient-limited growthfrom 2 February 2010through 21 February2011. Grey bars indicateinitial chlorophyll a con-centration for all dates onwhich a dilution experi-ment was conducted.Error bars are 1 SD oftriplicate measurements

Mar Ecol Prog Ser 459: 39–52, 2012
growth rates in Narragansett Bay ranged from 0.01 to2.4 d−1 (average 0.69 d−1, CV = 12%, Fig. 3). Non-nutrient-amended phytoplankton growth rates werefastest during the summer, which was the only sea-son in which no negative growth rates were re -corded. During the fall, there was only one weekwith negative growth, while winter and spring bothhad substantial periods of negative phytoplanktongrowth (8 of 11 weeks and 8 of 13 weeks, respec-tively). On average, phytoplankton growth rateswere positive for 66% of all weeks sampled. Nutri-ents did significantly limit phytoplankton growthduring the summer (p = 0.007), when already sub-stantive growth increased by an additional 3- to 4-
fold after nutrient addition (Table 1). In fall and win-ter, nutrient addition did not significantly increasephytoplankton growth rates (p = 0.48), and growthrates remained negative even with nutrients added.
Heterotrophic protist grazing rates were similar inmagnitude and seasonal pattern to phytoplanktongrowth rates (Fig. 3). Heterotrophic protist grazing innon-nutrient amended experiments ranged from 0 to1.8 d−1, with an average of 0.66 d−1 and an experi-mental variation of 10% (CV). Including grazingrates from nutrient-amended experiments for dateson which nutrients were limiting, heterotrophic pro-tist grazing ranged from 0 to 3.7 d−1, with an averageof 0.79 d−1. Of the 44 weeks sampled, 18% of experi-ments had non-significant grazing rates, and allinstances of non-significant grazing occurred in thewinter, generally when phytoplankton growth wasnegative. Above average grazing was observed dur-ing the summer and after the 2010 winter−springbloom, which was observed on 26 January 2010.
Fate of primary production
The ratio of heterotrophic grazing rates to phyto-plankton growth (g/k) provides a measure of the%PP consumed by heterotrophic protists. Between20 and 200% (average 96%) of PP was grazedthroughout the course of the year (Fig. 4). Due to lowgrowth and grazing rates on 2 February 2010 and 11January 2011, variation exceeded 100% and errorbars were omitted from Fig. 4. When nutrient limita-tion was ameliorated by nutrient addition during thesummer, %PP consumed was, at maximum, 130%,but protistan grazing remained high relative tophytoplankton growth rates. Percent PP consumedwas greatest in the summer when temperatures were
44
Date k−nutrients k+nutrients
28 Jun 10* 0.54 2.512 Jul 10* 0.71 2.226 Jul 10* 1.0 2.918 Oct 10 0.60 0.6516 Nov 10 0.53 0.6129 Nov 10 0.05 0.0114 Dec 10 0.02 −0.0430 Dec 10 −0.01 −0.0611 Jan 11 0.05 0.061 Feb 11 −0.10 −0.1721 Feb 11 −0.07 −0.10
Table 1. Comparison of phytoplankton growth rates (k, d−1)from parallel incubations with and without added nutrients.Asterisks indicate dates with significant nutrient limitation(p < 0.01). During June and July 2010, phytoplanktongrowth was nutrient limited (p = 0.007). During fall and win-ter 2010, negative growth rates were observed even in nutri-ent-amended incubations and were not significantly differ-ent from non-amended incubations (p = 0.48). Thus, nutrientlimitation only affected phytoplankton growth rates in thesummer, and other factors, such as light limitation, resulted
in negative phytoplankton growth rates in the winter
Fig. 4. Percent primary production (%PP)consumed by heterotrophic protists from2 February 2010 through 11 January2011. Note axis range difference fromFig. 3. %PP was only calculated whenphytoplankton growth was significant.Error bars indicate 1 SD of triplicatemeasures. Due to low growth and graz-ing rates on 2 February 2010 and 11 Jan-uary 2011, variation exceeded 100% anderror bars were omitted. The horizontaldashed line shows equal consumption
and production rates
Lawrence & Menden-Deuer: Protistan grazing in an estuary
warmest or after peak Skeletonema spp. concentra-tions in the winter. During the late spring and sum-mer, irrespective of nutrient addition, consumptionlargely equaled or exceeded production. During thefall and winter, with one exception, production ex -ceeded consumption, although net growth rates werelow. Although not exactly synchronized in time,higher phytoplankton standing stock was observedwhen grazing rates were lower and vice versa.
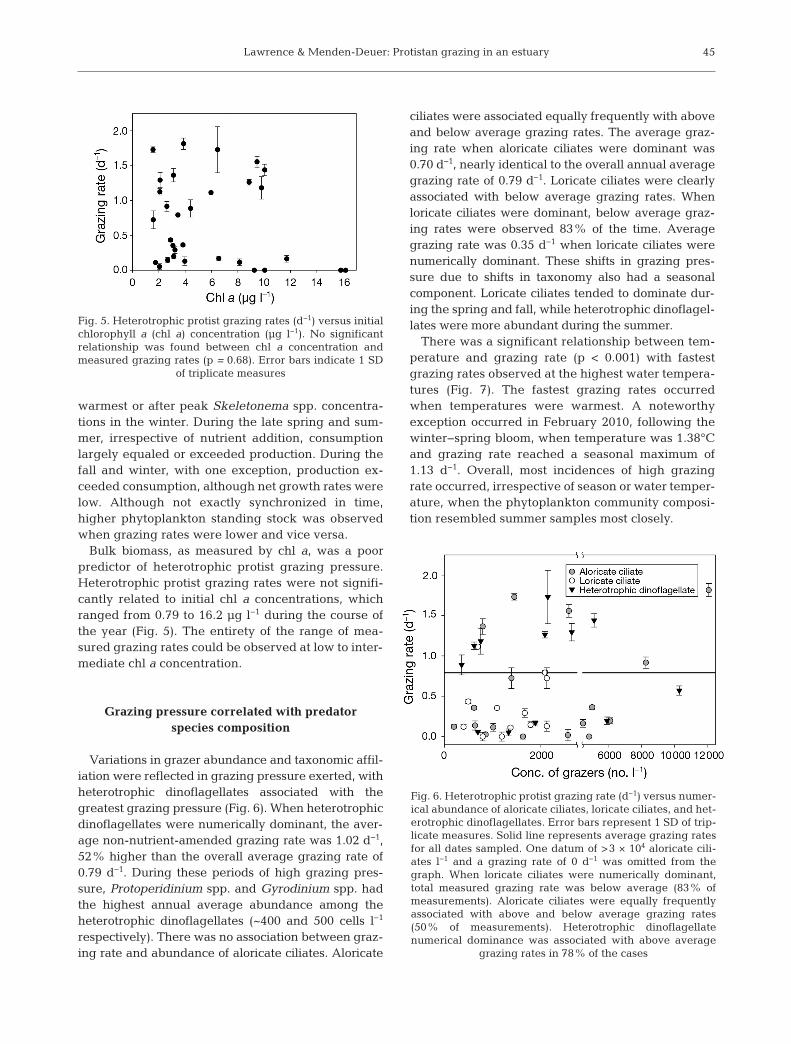
Bulk biomass, as measured by chl a, was a poorpredictor of heterotrophic protist grazing pressure.Heterotrophic protist grazing rates were not signifi-cantly related to initial chl a concentrations, whichranged from 0.79 to 16.2 µg l−1 during the course ofthe year (Fig. 5). The entirety of the range of mea-sured grazing rates could be observed at low to inter-mediate chl a concentration.
Grazing pressure correlated with predator species composition
Variations in grazer abundance and taxonomic affil-iation were reflected in grazing pressure exerted, withheterotrophic dinoflagellates associated with thegreatest grazing pressure (Fig. 6). When heterotrophicdinoflagellates were numerically dominant, the aver-age non-nutrient-amended grazing rate was 1.02 d−1,52% higher than the overall average grazing rate of0.79 d−1. During these periods of high grazing pres-sure, Protoperidinium spp. and Gyrodinium spp. hadthe highest annual average abundance among theheterotrophic dinoflagellates (~400 and 500 cells l−1
respectively). There was no association between graz-ing rate and abundance of aloricate ciliates. Aloricate
ciliates were associated equally frequently with aboveand below average grazing rates. The average graz-ing rate when aloricate ciliates were dominant was0.70 d−1, nearly identical to the overall annual averagegrazing rate of 0.79 d−1. Loricate ciliates were clearlyassociated with below average grazing rates. Whenloricate ciliates were dominant, below average graz-ing rates were observed 83% of the time. Averagegrazing rate was 0.35 d−1 when loricate ciliates werenumerically dominant. These shifts in grazing pres-sure due to shifts in taxonomy also had a seasonalcomponent. Loricate ciliates tended to dominate dur-ing the spring and fall, while heterotrophic dinoflagel-lates were more abundant during the summer.
There was a significant relationship between tem-perature and grazing rate (p < 0.001) with fastestgrazing rates observed at the highest water tempera-tures (Fig. 7). The fastest grazing rates occurredwhen temperatures were warmest. A noteworthyexception occurred in February 2010, following thewinter−spring bloom, when temperature was 1.38°Cand grazing rate reached a seasonal maximum of1.13 d−1. Overall, most incidences of high grazingrate oc curred, irrespective of season or water temper-ature, when the phytoplankton community composi-tion resembled summer samples most closely.
45
Fig. 5. Heterotrophic protist grazing rates (d−1) versus initialchlorophyll a (chl a) concentration (µg l−1). No significantrelationship was found between chl a concentration andmeasured grazing rates (p = 0.68). Error bars indicate 1 SD
of triplicate measures
Fig. 6. Heterotrophic protist grazing rate (d−1) versus numer-ical abundance of aloricate ciliates, loricate ciliates, and het-erotrophic dinoflagellates. Error bars represent 1 SD of trip-licate measures. Solid line represents average grazing ratesfor all dates sampled. One datum of >3 × 10⁴ aloricate cili-ates l−1 and a grazing rate of 0 d−1 was omitted from thegraph. When loricate ciliates were numerically dominant,total measured grazing rate was below average (83% ofmeasurements). Aloricate ciliates were equally frequentlyassociated with above and below average grazing rates(50% of measurements). Heterotrophic dinoflagellatenumerical dominance was associated with above average
grazing rates in 78% of the cases

Mar Ecol Prog Ser 459: 39–52, 2012
Seasonal patterns in community composition
When relating environmental conditions to phyto-plankton community composition, temperature ap -peared to be most strongly correlated with changesin species composition (Spearman correlation coeffi-cient ρ = 0.29, p = 0.001). Weekly species counts showed that diatomswere the most numerically abun-dant phyto plankton, averaging 67%of total cell abundance. Skeletonemaspp. were present year round, withpeaks in abundance in the winterand summer (Table 2). Flagellateswere also abundant year round,though numerical abundance wasgreatest during the summer and fall.Thalassiosira nordenskioeldii andHeterocapsa cf. triquetra were abun-dant during the winter and earlyspring, when temperatures werelower (ranging from 0.5 to 12°C).Leptocylindrus minimus and Cylin-drotheca closter ium were abundantduring the summer when tempera-tures were between 15 and 24°C,although these species were present
even at 0.5°C. Chaetoceros debilis dominated bio-mass during the late fall.
Clear seasonal shifts in phytoplankton communitycomposition were evident from the weekly planktonabundance data (Fig. 8). Based on an ANOSIM,phytoplankton community composition was stronglyassociated with season based on a comparison of car-bon content of the 10 most abundant phytoplanktonspecies (Table 3). Changes in the abundance ofSkeletonema spp. were the most significant driversof changes of phytoplankton community composi-tion. The composition of the phytoplankton commu-nity was most consistent in winter and spring, whilespring and summer were most different from oneanother (p = 0.001). The phytoplankton communityduring summer differed most strongly from all otherseasons. These seasonal phytoplankton associationswere found irrespective of whether biomass ornumerical abundance of phytoplankton was used asa metric. The only difference between the 2 analyti-cal approaches was that the global R-statistic was onaverage 1.5 times greater when the analysis includedall 58 taxa rather than the carbon content of the 10most abundant species.
DISCUSSION
It has been estimated that, on average, heterotro-phic protists graze over half of daily global primaryproduction (Calbet & Landry 2004). In this and inmany previous studies, protistan grazing rates fre-
46
Fig. 7. Heterotrophic grazing rate (d−1) versus surface tem-perature for all weeks with positive or non-nutrient-limitedphytoplankton growth rates. Error bars represent 1 SD oftriplicate measures. Only 8 of 17 experiments conductedbelow 10°C were plotted because phytoplankton growthrates were non-significant. There was a significant rela -tionship between temperature and grazing rate (p < 0.001,r2 = 0.53) with the highest grazing rates observed at thehighest water temperatures. However, a high grazing ratewas observed even at near freezing temperatures whenphytoplankton community composition resembled summer
community composition (see Fig. 8 and ‘Results’)
Winter Spring Summer Fall
Chaetoceros debilis 0 0 52.8 136Chaetoceros socialis 0 41.1 7.83 24.6Chaetoceros spp. 6.57 157 33.9 12.1
Cylindrotheca 2.68 × 10⁻² 4.29 × 10⁻² 7.61 7.13 × 10⁻¹
closterium
Unknown flagellate 9.27 2.49 18.7 11.3
Heterocapsa cf. 992 15.9 0 0triquetra
Leptocylindrus 5.31 0 5.15 1.72minimus
Skeletonema spp. 126 19.9 166 30.2
Thalassiosira 54.3 331 0 0nordenskioeldii
Thalassiosira spp. 6.42 4.94 238 165
Table 2. Seasonal average of carbon content (µg l−1) for 10 dominant planktonspecies observed throughout the course of the year. The largest total biomasswas observed during the winter when large cells such as Heterocapsa cf.
triquetra and Thalassiosira nordenskioeldii were most abundant

Lawrence & Menden-Deuer: Protistan grazing in an estuary
quently and on average exceeded phytoplanktongrowth rates, which suggests a mechanism for themajority of phytoplankton mortality. However, it isstill unclear what factors determine the magnitude ofprotistan grazing pressure. There was no relationshipbetween initial chl a concentrations in the dilution ex-periments and the measured grazing rates, which hasbeen observed previously (Strom et al. 2001, Sherr etal. 2009, Menden-Deuer & Fredrickson 2010). In con-
trast, Verity (1986) found a strong positive correlationbetween grazing and chl a concentration at the samesite when he investigated the grazing of ciliates onthe <5 µm chl a size fraction. It is likely that the excel-lent agreement observed by Verity (1986) resultedfrom a suitable matching of predator and prey typesin the appropriate size spectrum (i.e. ciliates and<5 µm chl a size fraction), whereas our study mea-sured grazing by all protistan predator types on thewhole phytoplankton community. Irigoien et al.(2005) suggested differential algal palatability, due tospecific defenses or morphological incompatibility asa possible mechanism for a mismatch in the relation-ship between predation and apparent availability inbiomass. In most instances, chl a is likely a poor pre-dictor of realized grazing rate because chl a does notreflect the degree of palatability of a specific preyspecies to predators. Chl a concentration may onlyyield strong predictive power for the ultimate grazingrate when well-matched predator− prey assemblagesare dominant or abundant.
Protistan grazing was not related to bulk biomassmeasured by chl a, but it was related to the abun-dance of specific phytoplankton species. When pro-tistan grazing rates were high (>0.75 d−1), abun-dances of the chain-forming diatoms Skeletonemaspp., Chaetoceros spp., and Leptocylindrus minimuswere typically 28 times greater than when grazingrates were <0.5 d−1. In particular, there was a strongrelation between protistan grazing and Skeletonemaspp., the dominant bloom-forming diatom in lowerNarragansett Bay. Over the course of the study, therewere 5 dates on which Skeletonema spp. abundancewas greater than 1 × 10⁷ cells l−1. With the exceptionof fall, these high abundances of Skeletonema spp.all coincided with high grazing rates (>0.75 d−1).These high grazing rates agree with work by Jeonget al. (2004) which has shown that grazing by a the-cate dinoflagellate on S. costatum exceeded grazingby the copepod genus Arcatia spp. by up to 17-fold.The increase in protistan grazing was delayed afterthe 2010 winter bloom when Skeletonema spp. werethe only numerically abundant species and protistangrazing rates increased by 1 d−1, 4 wk after the peakof the bloom. A similar delayed response in grazingrates has been observed in other cold water condi-tions (Levinsen et al. 2000).
Other studies have found that protistan grazingrates often exceeded phytoplankton growth rateswhen the diatoms Chaetoceros spp., Thalassiosiraspp., and Skeletonema spp. bloomed (Bec et al. 2005,Leising et al. 2005). In our study, phytoplankton spe-cies composition was also a strong predictor of protis-
47
Groups Global R
Spring, Summer 0.55**Summer, Winter 0.51**Summer, Fall 0.35*Winter, Fall 0.40**Spring, Fall 0.29*Winter, Spring 0.10
Table 3. Similarity among phytoplankton community com-position compared across seasons (ANOSIM). Analysis wasbased on abundance of the 10 most abundant plankton spe-cies measured as biomass (carbon content, µg l−1). Commu-nity composition from any given season was significantlydifferent from all other seasons (*p < 0.05, **p ≤ 0.001)except between winter and spring (p = 0.1). The mostextreme change in plankton community composition was
observed between spring and summer
Fig. 8. Multidimensional scaling (MDS) analysis of phyto-plankton community composition during the 4 seasons.Shown is a 2D rendition of a 3D MDS analysis. Samples withsimilar community composition are plotted in close proxim-ity. Average grazing pressure measured during that seasonis indicated as high (>0.75 d−1, filled symbols) and low(<0.75 d−1, open symbols). Phytoplankton community com-position for summer dates were most closely related to oneanother and associated with the highest grazing pressure. Itis noteworthy that phytoplankton community compositionfor one winter and spring sample with high grazing eachmore closely resembled summer community composition,suggesting that phytoplankton community compositionplayed a substantial role in driving observed grazing rates
Mar Ecol Prog Ser 459: 39–52, 2012
tan grazing pressure. High grazing rates that coin-cide with dominance of specific species, rather thanabsolute bulk prey concentrations (e.g. chl a) implythat abundance of a specific prey type is a moreappropriate predictor of grazing pressure rather thantotal phytoplankton biomass.
It is noteworthy that we observed the most intensegrazing pressure when heterotrophic dinoflagellateswere abundant along with large (>20 µm) diatoms.This is a result well supported by numerous priorstudies (Jeong et al. 2004, Saito et al. 2006, Strom etal. 2007) and reviewed by Sherr & Sherr (2007). Ourresults further support the notion that modelingefforts of planktonic trophic and demographic ratesurgently need to refrain from simple size-based clas-sifications and shift towards incorporating empiri-cally observed linkages between predators and preytypes, including the significant trophic transferbetween heterotrophic dinoflagellates and diatoms.
Protistan grazing rates were lower than averagewhen species including the diatoms Chaetocerossocialis, Thalassiosira nordenskioeldii and the dino -flagellate Heterocapsa cf. triquetra were numericallyabundant. H. triquetra is a common dinoflagellate inestuarine systems and has been associated with lowprotistan grazing pressure (Litaker et al. 2002), whichwas also the case in this study. C. socialis forms largecolonies, and T. nordenskioeldii is a large chain-forming diatom with chitinous threads, perhaps mak-ing these species difficult for heterotrophic protists toingest. Chl a concentration is expected to be a poorpredictor of grazing pressure when these types ofphytoplankton dominate. Overall, these results sug-gest that community composition rather than total chla concentration would ultimately hold greater pre-dictive power of the magnitude of grazing pressure.
Variability in the abundance of grazer types wasanother strong correlate of the magnitude of grazingrate measured. Biomass of grazers was not directlymeasured for this study, but the abundance of graz-ers in several categories was enumerated. Prioranalyses have shown that rarer, large species oftencontribute disproportionately to grazing pressureand are poorly represented in numerical abundancemeasures (Sherr & Sherr 2007). Therefore, the contri-bution of larger heterotrophic protist species, par -ticularly heterotrophic dinoflagellates and aloricateciliates, to overall grazing pressure may even beunderestimated in this study. Heterotrophic dinofla-gellates may be especially successful grazers in Nar-ragansett Bay as they are known to feed preferen-tially on large phytoplankton (Jacobson & Anderson1986, Buskey 1997, Jeong et al. 2004, Menden-Deuer
et al. 2005, Sherr & Sherr 2007). Loricate ciliates donot graze effectively on large diatoms (Verity & Vil-lareal 1986, Löder et al. 2011). Instead, Verity (1986)found that loricate ciliates were the dominant grazerson the <5 µm size fraction in Narragansett Bay. Sim-ilarly, Löder et al. (2011) reported that ciliate preda-tors had a narrower prey-size spectrum and theirpopulation dynamics were more directly affected byprey type availability than those of heterotrophicdinoflagellates, which had a broader prey-size spec-trum. In this study, taxonomic analysis revealed im -portant food web dynamics, including that dino -flagellate grazers were associated with a greatercommunity grazing impact. These results suggest aspecialization among predator types with respect toprey types that may be useful in linking species com-position to grazing pressure. Grazing rates maydepend upon grazer group present and the ability ofgrazers to successfully prey on the phytoplanktoncommunity available.
Our observations of heterotrophic dinoflagellatesexerting disproportional grazing pressure contradicta recent critique of the dilution method by Dolan &McKeon (2005). Although we are in agreement withthe authors that results from the dilution methodneed to be critically evaluated, we believe resultsgathered, especially in a relative and comparativesense, provide useful insights. Dolan & McKeon(2005) suggested that ciliate grazers present a rea-sonable proxy for total grazing pressure and thatgrazing rates can easily be overestimated because ofdifferential survival of ciliate grazers as a function ofdilution, ranging from ciliate predator growth in theundiluted treatment to ciliate starvation in highlydilute samples, 10% in our case. Although such dif-ferential survival and consequent overestimates ofgrazing have been observed in oligotrophic waters ofthe Mediterranean (Dolan & McKeon 2005) and aeutrophic estuary (Dolan et al. 2000), we do notbelieve that this critique applies to our results, whichclearly showed a linkage in high grazing rates whenphytoplankton communities were dominated bylarge diatoms and accompanied by heterotrophicdinoflagellates. Moreover, in our study, ciliate preda-tors were associated with low grazing pressure, rang-ing from average to below average grazing rates, andthus ciliates are unlikely a reasonable proxy of grazerconcentration and predation pressure.
Environmental conditions were suitable for Skele-tonema spp. bloom formation during both winterssampled. Borkman & Smayda (2009a) found that win-ters with bright, cold, and windy conditions as well aslow abundance of the copepod Acartia hudsonica
48

Lawrence & Menden-Deuer: Protistan grazing in an estuary 49
were conducive to Skeletonema spp. bloom forma-tion. In both 2010 and 2011, these conditions werepresent at the initiation of the Skeletonema spp.bloom; however, bloom magnitude, quantified byboth cell abundances and chl a concentration, andduration differed in each year. In 2010, there was alarge, short-lived high abundance of Skeletonemaspp., but growth appeared to be negative, suggestingthat the experiment may have been conducted afterthe initiation of the bloom when phytoplanktongrowth was no longer positive. In winter 2010/2011,chl a showed a long, broad bloom which reachedabove 15 µg l−1 on 30 December 2010 as a result ofhigh Heterocapsa cf. triquetra abundance. Subse-quently there was a shift in the dominant speciesfrom H. cf. triquetra to Skeletonema spp., indicativeof the characteristic winter− spring Skeletonema spp.bloom in early January. The shift to Skeletonemaspp. dominance was observed concomitantly withthe only positive phytoplankton growth rate ob -served in winter 2011. It is noteworthy that phyto-plankton growth rate was only slight (0.05 d−1), sug-gesting growth need not be very large in order toreach bloom concentrations. Skeletonema spp. win-ter−spring bloom formation has been attributed greatimportance as an environmental indicator in Narra-gansett Bay (Oviatt et al. 2002). The winter Skele-tonema spp. blooms in 2010 and 2011 likely occurredas a result of favorable environmental conditionswhich have not occurred with consistency for manyyears due to a negative NAO (North Atlantic Oscilla-tion) (Oviatt et al. 2002, Borkman & Smayda 2009a).With the recent shift in NAO from a positive to a neg-ative phase, we predict that the yearly average ofSkeletonema spp. (likely to be >2000 cells ml−1) willincrease from those ob served during the positivephase, which may ultimately result in increasedgrazing by heterotrophic protists.
Seasonal patterns were observed in multiple bioticand abiotic measurements, particularly in tempera-ture and phytoplankton community composition.Phytoplankton growth rates in Narragansett Baywere greatest during the summer despite significantnutrient limitation. Grazing by heterotrophic protistswas also greatest during the summer, with grazingrates of up to 3.7 d−1 or 130% of the non-nutrient- limited standing stock. This begs the question: howdoes phytoplankton biomass persist and form bloomsdespite nutrient limitation and substantial grazingpressure? This study may have overestimated therealized protistan grazing pressure because meta-zoan predators were deliberately excluded throughsieving. Martin (1970) found that zooplankton in Nar-
ragansett Bay (>160 µm) exerted significant grazingpressure during spring and early summer. Thewidely observed preference of many copepod spe-cies for heterotrophic protist prey over phytoplank-ton may result in reduced protistan abundanceand thus reduced grazing pressure on phytoplankton(Levinsen et al. 2000). Additionally, we suggest thatthe rate of nutrient recycling within the system, particularly by non-metazoan grazers, was greatenough to continually stimulate phytoplanktongrowth. While smaller flagellates (<10 µm) tend todominate nu trient regeneration, heterotrophic pro-tists do re generate nutrients to a greater degree thando copepods (Glibert et al. 1992, Miller et al. 1995).Sustained grazing by heterotrophic protists and largenumbers of flagellates during the nutrient-limitedsummer months may have rapidly recycled nutrients,allowing phytoplankton growth to persist. In theabsence of protistan grazing, nutrients may be lostdue to export through sinking of phytoplankton ag -gregates or copepod fecal pellets (Legendre & Ras-soulzadegan 1996, Turner 2002). This differential be -tween retention of nutrients in the system duringtimes of higher protistan herbivory and bacterivorymay lead to greater persistence of a bloom, especiallywhen nutrients are limiting phytoplankton growth.
This study was characterized by a high samplingfrequency and resolution. A total of 44 dilutionexperiments were conducted either weekly or 2-weekly over the course of 12 mo, which, with theexception of Verity (1986), exceeds many prior stud-ies in temporal resolution. Despite this exceptionallyhigh resolution, we were unable to predict measuredchl a from phytoplankton growth and protistan graz-ing rates. The trophic and demographic rates onlycoarsely matched primary productivity dynamicsmeasured by changes in total chl a between weeks.Most notably, the large blooms of Skeletonema spp.observed in January of both years cannot easily beexplained by the very low growth rates measured(≤0.05 d−1). Considering Skeletonema spp. abun-dances increased from 410 cells ml−1 on 30 December2010 to 2400 cells ml−1 on 11 January 2011, or 6-fold,2.5 population doublings without concurrent losseswere necessary to produce the observed bloom. Thisincrease in biomass is equivalent to and could resultfrom a moderate continuous growth at an averagerate of 0.16 d−1 over the course of 11 d. Since plank-ton demographic processes occur on the order ofhours to days, it is possible that the intervening timesbetween samplings may have included periods ofsuitable conditions for Skeletonema spp. growth andpermitted the build-up of the Skeletonema spp.

Mar Ecol Prog Ser 459: 39–52, 2012
bloom observed. Moreover, heterotrophic dinofla -gellates, the predominant grazers on diatoms duringour study, were absent for the period precedingthe bloom. These considerations are based on theassumption that phytoplankton distributions arehomo geneous in Narragansett Bay, which is not thecase (Oviatt et al. 2002). A Lagrangian study, such asthe one used by Landry et al. (2008), could assistin resolving the short-term population dynamics ofphytoplankton in this system. The discrepancy be -tween measured rates and observed populationabundances indicates that despite the comparativelyhigh frequency of sampling and large number oftotal experiments, short-term plankton populationdynamics could not be derived from rate measure-ments made at weekly intervals. However, the sam-pling frequency was sufficient to determine seasonaldynamics.
Our study showed a significant seasonal change ina host of environmental and biotic factors. Protistangrazing and phytoplankton growth were greatestduring the summer, and both rates were muchreduced in the winter and spring. Many studies havefound a pronounced seasonality in grazing rates,including increased protistan grazing rates duringthe warmest seasons and reduced protistan grazingand phytoplankton growth in winter/colder months(Palomares-Garcia et al. 2006, Kim et al. 2007, Calbetet al. 2008, Ara & Hiromi 2009). Such a temperature-dependent shift in grazing has also been observed forArcatia spp. in Narragansett Bay, with rates increas-ing 4- to 6-fold from winter/spring to summer/fall(Deason 1980). It has been suggested that low tem-peratures cause a more substantial reduction in het-erotrophic protist growth rates than phytoplanktongrowth rates (Rose & Caron 2007). However, sub-stantial protistan grazing and phytoplankton growthcan occur even when temperatures are low (Levinsenet al. 2000, Putland 2000). Sherr et al. (2009) mea-sured substantive phytoplankton growth and hetero-trophic protist grazing rates at near freezing temper-atures in the Western Arctic Ocean, and our resultsalso recorded substantive grazing at 1.3°C. Priorreports of low grazing rates at low temperatures(Caron et al. 2000, Sherr et al. 2009, Calbet et al.2011) may have been the result of a seasonal mis-match in predators and prey, rather than a physiolog-ical effect of temperature. Our observation supportsthat hypothesis, as grazing in the winter was sub-stantial when the phytoplankton community mostclosely resembled the summer time community.
The increase in temperature associated with in -creased protistan grazing rates was concurrent with
a shift in predator and prey species community com-positions. Similarly, Rose et al. (2009) found that atemperature increase not only resulted in a change inprotistan community composition and physiology butalso influenced the phytoplankton community com-position. The observed similarity of phytoplanktoncommunity composition whenever grazing rateswere >0.75 d−1 is especially indicative of the impor-tance of plankton community composition. With theexception of one high grazing rate after the winter−spring bloom and two in the spring, all high grazingrates occurred in summer. Therefore, the relativeeffects of temperature and species composition couldnot be statistically separated to distinguish which onewas the driving factor or whether both were equallyimportant. Manipulative experiments altering com-munity composition and temperature would berequired to resolve this issue, provided the physio-logical tolerance of the species permitted successfulexperiments. Temperature responses of organismsneed to be examined taking the physiological rangeof species and resultant shifts in community composi-tion into account. Therefore, temperature alone with-out consideration of community composition may nothave the strong scaling, Q10 type effect that is com-monly assumed (e.g. Hansen et al. 1997) and shouldbe further investigated before extensive use to para-meterize trophic and demographic rates.
In summary, high frequency analysis of planktonpopulation dynamics concurrent with biological andenvironmental data allowed us to identify the impor-tance of temperature and predominantly predatorand prey species composition as strong correlates ofpredation pressure. Gathering this type of informa-tion, e.g. through automated in situ technology(Olson & Sosik 2007, Sosik & Olson 2007) may helpimprove our predictive ability of phytoplankton pop-ulation dynamics and derivative metrics, includingrates of primary and export production.
Acknowledgements. This paper is presented on the occa-sion of Professor Theodore Smayda’s 80th birthday, to honorhis invaluable contributions to the study of plankton ecologyin general and in Narragansett Bay specifically. We thank T.Puckett, captain of the RV ‘Cap’n Burt’, and NarragansettBay Long-Term Monitoring Program director T. Rynearson,Graduate School of Oceanography, University of RhodeIsland (URI). Carol Gibson generated the Map of Narra-gansett Bay. This manuscript was greatly improved byreviews from T. Rynearson, M. Gomez-Chiarri, and 4 anony-mous reviewers. Funding for this project was provided byURI in support of the Narragansett Bay Long-Term Monitor-ing Program, National Science Foundation EPSCoR grantno. EPS-1004057 as well as the Office of Naval Research(N000141010124) to S.M.D.
50

Lawrence & Menden-Deuer: Protistan grazing in an estuary
LITERATURE CITED
Ara K, Hiromi J (2009) Seasonal variability in plankton foodweb structure and trophodynamics in the neritic area ofSagami Bay, Japan. J Oceanogr 65:757−779
Bec B, Husseini-Ratrema J, Collos Y, Souchu P, Vaquer A(2005) Phytoplankton seasonal dynamics in a Mediter-ranean coastal lagoon: emphasis on the picoeukaryotecommunity. J Plankton Res 27:881−894
Behrenfeld MJ (2010) Abandoning Sverdrup’s CriticalDepth Hypothesis on phytoplankton blooms. Ecology91:977−989
Borkman DG, Smayda T (2009a) Multidecadal (1959−1997)changes in Skeletonema abundance and seasonal bloompatterns in Narragansett Bay, Rhode Island, USA. J SeaRes 61:84−94
Borkman DG, Smayda TJ (2009b) Gulf Stream position andwinter NAO as drivers of long-term variations in thebloom phenology of the diatom Skeletonema costatum‘species-complex’ in Narragansett Bay, RI, USA. J Plank-ton Res 31:1407−1425
Buskey EJ (1997) Behavioral components of feeding selec-tivity of the heterotrophic dinoflagellate Protoperidiniumpellucidum. Mar Ecol Prog Ser 153:77−89
Calbet A, Landry MR (2004) Phytoplankton growth, micro-zooplankton grazing, and carbon cycling in marine sys-tems. Limnol Oceanogr 49:51−57
Calbet A, Trepat I, Almeda R, Salo V and others (2008)Impact of micro- and nanograzers on phytoplanktonassessed by standard and size-fractionated dilution graz-ing experiments. Aquat Microb Ecol 50:145−156
Calbet A, Saiz E, Almeda R, Movilla JI, Alcaraz M (2011)Low microzooplankton grazing rates in the Arctic Oceanduring a Phaeocystis pouchetii bloom (Summer 2007):fact or artifact of the dilution technique? J Plankton Res33: 687−701
Caron DA, Dennett MR, Lonsdale DJ, Moran DM, Shalapy-onok L (2000) Microzooplankton herbivory in the RossSea, Antarctica. Deep-Sea Res II 47: 3249−3272
Cloern JE, Jassby AD (2008) Complex seasonal patterns ofprimary producers at the land-sea interface. Ecol Lett 11:1294−1303
Deason EE (1980) Grazing of Acartia hudsonica (A. clausi)on Skeletonema costatum in Narragansett Bay (USA):influence of food concentration and temperature. MarBiol 60:101−113
Dolan JR, McKeon K (2005) The reliability of grazing rateestimates from dilution experiments: Have we over-esti-mated rates of organic carbon consumption by microzoo-plankton? Ocean Sci 1:1−7
Dolan JR, Gallegos CL, Moigis A (2000) Dilution effects onmicrozooplankton in dilution grazing experiments. MarEcol Prog Ser 200:127−139
Field CB, Behrenfeld MJ, Randerson JT, Falkowski P (1998)Primary production of the biosphere: integrating terres-trial and oceanic components. Science 281:237−240
Franks PJS (2001) Phytoplankton blooms in a fluctuatingenvironment: the roles of plankton response time scalesand grazing. J Plankton Res 23:1433−1441
Gallegos CL (1989) Microplankton grazing on phytoplank-ton in the Rhode River, Maryland: non-linear feedingkinetics. Mar Ecol Prog Ser 57:23−33
Glibert PM, Miller CA, Garside C, Roman MR, McManusGB (1992) NH4
+ regeneration and grazing: interdepen-dent processes in size-fractionated 15NH4
+ experiments.
Mar Ecol Prog Ser 82:65−74Graff J, Rynearson T (2011) Extraction method influences
the recovery of phytoplankton pigments from naturalassemblages. Limnol Oceanogr Methods 9:129−139
Hansen PJ, Bjørnsen PK, Hansen BW (1997) Zooplanktongrazing and growth: scaling within the 2−2,000 µm bodysize range. Limnol Oceanogr 42:687−704
Irigoien X, Flynn KJ, Harris R (2005) Phytoplankton blooms:a ‘loophole’ in microzooplankton grazing impact?J Plankton Res 27:313−321
Jacobson DM, Anderson DM (1986) Thecate heterotrophicdinoflagellates—feeding behavior and mechanisms.J Phycol 22:249−258
Jeong H, Yoo Y, Kim S, Kang N (2004) Feeding by the het-erotrophic dinoflagellate Protoperidinium bipes on thediatom Skeletonema costatum. Aquat Microb Ecol36:171−179
Karentz D, Smayda TJ (1998) Temporal patterns and varia-tions in phytoplankton community organization andabundance in Narragansett Bay during 1959−1980.J Plankton Res 20:145−168
Keller AA, Taylor C, Oviatt C, Dorrington T, Holcombe G,Reed L (2001) Phytoplankton production patterns inMassachusetts Bay and the absence of the 1998 winter-spring bloom. Mar Biol 138:1051−1062
Kim S, Park MG, Moon C, Shin K, Chang M (2007) Seasonalvariations in phytoplankton growth and microzooplank-ton grazing in a temperate coastal embayment, Korea.Estuar Coast Shelf Sci 71:159−169
Landry MR, Hassett RP (1982) Estimating the grazingimpact of marine micro-zooplankton. Mar Biol 67:283−288
Landry MR, Decima M, Simmons MP, Hannides CCS,Daniels E (2008) Mesozooplankton biomass and grazingresponses to Cyclone Opal, a subtropical mesoscaleeddy. Deep-Sea Res II 55:1378−1388
Legendre L, Rassoulzadegan F (1996) Food-web mediatedexport of biogenic carbon in oceans: hydrodynamic con-trol. Mar Ecol Prog Ser 145:179−193
Leising AW, Horner R, Pierson JJ, Postel J, Halsband-LenkC (2005) The balance between microzooplankton graz-ing and phytoplankton growth in a highly productiveestuarine fjord. Prog Oceanogr 67:366−383
Lessard EJ, Murrell MC (1998) Microzooplankton herbivoryand phytoplankton growth in the northwestern SargassoSea. Aquat Microb Ecol 16:173−188
Levinsen H, Nielsen TG, Hansen BW (2000) Annual succes-sion of marine pelagic protozoans in Disko Bay, WestGreenland, with emphasis on winter dynamics. Mar EcolProg Ser 206:119−134
Li QP, Franks PJS, Landry MR (2011) Microzooplanktongrazing dynamics: parameterizing grazing models withdilution experiment data from the California CurrentEcosystem. Mar Ecol Prog Ser 438:59−69
Litaker RW, Tester PA, Duke CS, Kenney BE, Pinckney JL,Ramus J (2002) Seasonal niche strategy of the bloom-forming dinoflagellate Heterocapsa triquetra. Mar EcolProg Ser 232:45−62
Löder MGJ, Meunier C, Wiltshire KH, Boersma M, Aberle N(2011) The role of ciliates, heterotrophic dinoflagellatesand copepods in structuring spring plankton communi-ties at Helgoland Roads, North Sea. Mar Biol 158:1551−1580
Martin J (1965) Phytoplankton-zooplankton relationships inNarragansett Bay. Limnol Oceanogr 10:185−191
51

Mar Ecol Prog Ser 459: 39–52, 2012
Martin JH (1970) Phytoplankton-zooplankton relationshipsin Narragansett Bay. 4. Seasonal importance of grazing.Limnol Oceanogr 15:413−418
Menden-Deuer S, Fredrickson K (2010) Structure-depen-dent, protistan grazing and its implication for the forma-tion, maintenance and decline of plankton patches. MarEcol Prog Ser 420:57−71
Menden-Deuer S, Lessard EJ (2000) Carbon to volume rela-tionships for dinoflagellates, diatoms, and other protistplankton. Limnol Oceanogr 45:569−579
Menden-Deuer S, Lessard EJ, Satterberg J, Grunbaum D(2005) Growth rates and starvation survival of three spe-cies of the pallium-feeding, thecate dinoflagellate genusProtoperidinium. Aquat Microb Ecol 41:145−152
Miller CA, Penry DL, Glibert PM (1995) The impact oftrophic interactions on rates of nitrogen regenerationand grazing in Chesapeake Bay. Limnol Oceanogr 40:1005−1011
Moigis A (2006) The clearance rate of microzooplankton asthe key element for describing estimated non-linear dilu-tion plots demonstrated by a model. Mar Biol 149:743−762
Olson RJ, Sosik HM (2007) A submersible imaging-in-flowinstrument to analyze nano-and microplankton: ImagingFlowCytobot. Limnol Oceanogr Methods 5:195−203
Oviatt C, Keller A, Reed L (2002) Annual primary productionin Narragansett Bay with no bay-wide winter-springphytoplankton bloom. Estuar Coast Shelf Sci 54:1013−1026
Palomares-Garcia R, Bustillos-Guzman JJ, Lopez-Cortes D(2006) Pigment-specific rates of phytoplankton growthand microzooplankton grazing in a subtropical lagoon.J Plankton Res 28:1217−1232
Pratt DM (1959) The phytoplankton of Narragansett Bay.Limnol Oceanogr 4:425−440
Price N, Harrison P, Landry M, Azam F, Hall K (1986) Toxiceffects of latex and Tygon tubing on marine phytoplank-ton, zooplankton and bacteria. Mar Ecol Prog Ser 34:41−49
Putland JN (2000) Microzooplankton herbivory and bac-terivory in Newfoundland coastal waters during spring,summer and winter. J Plankton Res 22:253−277
Rose JM, Caron DA (2007) Does low temperature constrainthe growth rates of heterotrophic protists? Evidence andimplications for algal blooms in cold water. LimnolOceanogr 52:886−895
Rose J, Feng Y, Gobler C, Gutierrez R, Hare C, Leblanc K,Hutchins D (2009) Effects of increased pCO2 and temper-ature on the North Atlantic spring bloom. II. Microzoo-plankton abundance and grazing. Mar Ecol Prog Ser 388:27−40
Saito H, Ota T, Suzuki K, Nishioka J, Tsuda A (2006) Role ofheterotrophic dinoflagellate Gyrodinium sp. in the fate ofan iron induced diatom bloom. Geophys Res Lett33:L09602, doi:10.1029/2005GL025366
Sherr EB, Sherr BF (2007) Heterotrophic dinoflagellates: asignificant component of microzooplankton biomass andmajor grazers of diatoms in the sea. Mar Ecol Prog Ser352:187−197
Sherr EB, Sherr BF, Hartz AJ (2009) Microzooplankton graz-ing impact in the Western Arctic Ocean. Deep-Sea Res II56:1264−1273
Smayda TJ (1998). Patterns of variability characterizingmarine phytoplankton, with examples from NarragansettBay. ICES J Mar Sci 55:562–573
Sosik HM, Olson RJ (2007) Automated taxonomic classifica-tion of phytoplankton sampled with imaging-in-flowcytometry. Limnol Oceanogr Methods 5:204−216
Strom SL, Fredrickson KA (2008) Intense stratification leadsto phytoplankton nutrient limitation and reduced micro-zooplankton grazing in the southeastern Bering Sea.Deep-Sea Res II 55:1761−1774
Strom SL, Brainard MA, Holmes JL, Olson MB (2001) Phyto-plankton blooms are strongly impacted by microzoo-plankton grazing in coastal North Pacific waters. MarBiol 138:355−368
Strom SL, Macri EL, Olson MB (2007) Microzooplanktongrazing in the coastal Gulf of Alaska: variations in top-down control of phytoplankton. Limnol Oceanogr 52:1480−1494
Tamigneaux E, Mingelbier M, Klein B (1997) Grazing byprotists and seasonal changes in the size structure of pro-tozooplankton and phytoplankton in a temperatenearshore environment (western Gulf of St. Lawrence,Canada). Mar Ecol Prog Ser 146:231−247
Turner JT (2002) Zooplankton fecal pellets, marine snowand sinking phytoplankton blooms. Aquat Microb Ecol27:57−102
Utermöhl H (1958) Zur Vervollkommnung der quantitativenPhytoplankton-Methodik. Mitt Int Ver Theor AngewLimnol 9:1−38
Verity PG (1986) Grazing of phototrophic nanoplankton bymicrozooplankton in Narragansett Bay. Mar Ecol ProgSer 29:105−115
Verity P, Villareal T (1986) The relative food value ofdiatoms, dinoflagellates, flagellates, and cyanobacteriafor tintinnid ciliates. Arch Protistenkd 131:71−84
Worden AZ, Binder BJ (2003) Application of dilutionexperiments for measuring growth and mortality ratesamong Prochlorococcus and Synechococcus populationsin oligotrophic environments. Aquat Microb Ecol 30:159−174
52
Editorial responsibility: Antonio Bode,A Coruña, Spain
Submitted: November 17, 2011; Accepted: April 17, 2012Proofs received from author(s): June 28, 2012