Embed Size (px)
Citation preview

THE PROTISTAN ORIGINS OF MULTICELLUARITY: TIMING AND
EVOLUTION OF CELL ADHESION MOLECULES
by
Susan Christina Sharpe
Submitted in partial fulfilment of the requirements
for the degree of Master of Science
at
Dalhousie University
Halifax, Nova Scotia
November 2015
© Copyright by Susan Christina Sharpe, 2015

ii
I did it.
But ask the animals, and they will teach you;
the birds of the air, and they will tell you;
ask the plants of the earth, and they will teach you;
and the fish of the sea will declare to you.
– Job 12:7-8
"Just goes to show, we don’t know shit about fungi."
– Adam, Only Lovers Left Alive

iii
Table of Contents
List of Tables ....................................................................................................................... v
List of Figures .....................................................................................................................vi
Abstract ............................................................................................................................. vii
List of Abbreviations Used .............................................................................................. viii
Acknowledgements .............................................................................................................. x
Chapter 1: Introduction ........................................................................................................ 1
1.1 Diversity of Multicellularity ................................................................................. 1
1.2 New Functions Required for Multicellularity ...................................................... 5
1.3 Selection Pressures that Favour Multicellularity .................................................. 8
1.4 Evolution of Life Histories and Multicellularity in Amorphea .......................... 10
1.5 Aims of this Thesis ............................................................................................. 12
Chapter 2: Timing the Origins of Multicellular Eukaryotes Through Phylogenomics
and Relaxed Molecular Clock Analyses ............................................................................ 13
2.1 Abstract............................................................................................................... 13
2.2 Introduction ........................................................................................................ 14
2.2.1 Eukaryote Phylogeny............................................................................... 14
2.2.2 Placing Multicellular Groups on the Tree of Eukaryotes ........................ 16
2.2.3 Using Molecular Data to Date the Emergence of Lineages .................... 20
2.3 Methods .............................................................................................................. 23
2.3.1 Dataset Construction ............................................................................... 23
2.3.2 Reference Phylogeny ............................................................................... 23
2.3.3 Fossil Calibrations ................................................................................... 24
2.3.4 Relaxed Molecular Clock Analyses ........................................................ 24
2.4 Results and Discussion ....................................................................................... 26
2.4.1 Metazoa ................................................................................................... 28
2.4.2 Fungi ........................................................................................................ 30
2.4.3 Dictyostelids ............................................................................................ 32
2.4.4 Embryophytes, Stomatophytes and Streptophytes .................................. 34

iv
2.4.5 Red Algae ................................................................................................ 36
2.4.6 Relative Ages of Multicellular Groups.................................................... 39
2.5 Conclusions ........................................................................................................ 41
2.6 Acknowledgements ............................................................................................ 42
Chapter 3: Integrins and the Evolution of Animal Multicellularity ................................... 43
3.1 Introduction ........................................................................................................ 43
3.2 Methods .............................................................................................................. 46
3.2.1 Homology Searches ................................................................................. 46
3.2.2 Pygsuia biforma cDNA Preparation ........................................................ 47
3.2.3 Pygsuia Whole Cell Lysates .................................................................... 48
3.2.4 Expression of Recombinant Protein ........................................................ 48
3.2.5 Antibody Testing on Recombinant Protein ............................................. 48
3.3 Results ................................................................................................................ 49
3.4 Discussion........................................................................................................... 56
3.5 Conclusion .......................................................................................................... 58
Chapter 4: Final Conclusion .............................................................................................. 59
References .......................................................................................................................... 62
Appendix A: Copyright Permission (Chapter 2) ............................................................... 79

v
List of Tables
Table 2.1 Calibrations used for relaxed molecular clock analysis. ................................... 24
Table 2.2: Limits on the age of emergence of multicellularity in different eukaryotic
groups.. ...................................................................................................................... 41
Table 3.1 Peptides used to raise antibodies. ..................................................................... 49
Table 3.2 Conserved motifs in integrin β ......................................................................... 54

vi
List of Figures
Figure 1.1: Diversity of eukaryotic multicellularity. .......................................................... 2
Figure 1.2: Multicellularity and the evolution of Obazoa.................................................. 11
Figure 2.1 Phylogenetic tree of eukaryotes based on a phylogenomic dataset.. ................ 19
Figure 2.2 Estimates of the age of the most recent common ancestor of Metazoa (a),
Fungi (b) and Dictyostelids (c). ................................................................................. 27
Figure 2.3 Estimates of the age of the most recent common ancestor of
Stomatophyta and Stretophyta (a), and Bangiales/Florideophyceae and
Rhodophyceae (b). ..................................................................................................... 33
Figure 2.4 Age of the LECA compared to multicellular eukaryotic groups. ..................... 40
Figure 3.1: Distribution of integrin adhesion machinery in eukaryotes. .......................... 50
Figure 3.2 Domain architectures of protistan integrin β proteins. .................................... 51
Figure 3.3 Domain architectures of protistan integrin α proteins. .................................... 52
Figure 3.4 Domain architectures of protistan talins. ......................................................... 53
Figure 3.5 Antibodies raised against peptides are reactive to Pygsuia proteins
expressed in E. coli.. .................................................................................................. 55

vii
Abstract
Multicellularity has evolved many times within eukaryotes. Comparisons between
various multicellular groups and between multicellular groups and their unicellular
relatives help illuminate how this transition happened. I addressed two aspects of the
evolution of multicellularity: the timing of the emergence of eukaryotic multicellular
groups, and the evolutionary history of integrins, metazoan cell adhesion receptors.
Using phylogenomics and relaxed molecular clock dating methods (which employ
paleontological calibrations), I estimated the timing of the emergence of eukaryotic
multicellular groups. My results show that Metazoa, Fungi and two of the major
multicellular red algal taxa first emerged during the mid-Neoproterozoic, whereas the
dictyostelid aggregative slime moulds arose during the Paleozoic.
I found that the unicellular breviate Pygsuia biforma expresses both subunits of the
metazoan integrin receptor, as well as several associated scaffolding proteins. In Metazoa,
these proteins function in cell adhesion and signaling. To further study these proteins, I
developed antibodies against the Pygsuia homologs of the integrin receptor proteins and
the associated scaffolding protein talin, and demonstrated that they specifically recognize
recombinant target proteins expressed in Escherichia coli. These tools will facilitate the
elucidation of the role of integrins in Pygsuia, furthering our understanding of the
ancestral functions of proteins associated with multicellularity.

viii
List of Abbreviations Used
AA amino acid
AMIDAS adjacent to MIDAS
ASRV among site rate variation
BLAST basic local alignment search tool
BLASTP BLAST proteins
BS bootstrap support
c-Src proto-oncogene cellular-Src
Cal calibration
CIR Cox-Ingersoll-Ross
DHFR dihydrofolate reductase
DNA deoxyribonucleic acid
ECM extracellular matrix
EGF epidermal growth factor
FAK focal adhesion kinase
FERM band 4.1, Ezrin, radixin, moesin domain
GTR general time reversible
HMM hidden Markov Model
HRP horseradish peroxidase
ILK integrin-linked kinase
IMAC integrin-mediated adhesion machinery
IPP complex ILK, PINCH, paxillin complex
IPTG isopropyl beta-D-1-thiogalactopyranoside
ITA integrin α
ITB integrin β
ITG integrin
LBA long-branch attraction
LECA last eukaryotic common ancestor
LG Le-Gascuel amino acid replacement matrix (Le and Gascuel 2008)

ix
LIMBS ligand-induced metal ion–binding site
LogN lognormal
LOX lysyl oxidase
Ma millions of years ago
MCMC Markov Chain Monte Carlo
MIDAS metal ion-dependent adhesion site
ML maximum likelihood
MRCA most recent common ancestor
mRNA messenger RNA
MRO mitochondrion-related organelle
Myr millions of years
PCD programmed cell death
PCR polymerase chain reaction
rDNA ribosomal DNA
RGD arginine – glycine – aspartate
RMC relaxed molecular clock
RNA ribonucleic acid
SDS-PAGE sodium dodecyl sulfate-polyacrylamide gel electrophoresis
SSU small subunit
TBS-T tris buffered saline, 0.1% Tween 20
TS thymidylate synthase
UGam uncorrelated gamma

x
Acknowledgements
My time in the Roger lab has been one of enormous personal growth, and many
amazing people have helped make it happen.
I am forever grateful to my supervisor Andrew Roger for his support and
encouragement, especially during the tough times.
Many thanks to Matt Brown, whose description of Pygsuia and phylogenomic work
was the starting point for much of my research, and who introduced me to Python
scripting. Courtney Stairs taught me many of the techniques I used in the lab, and was
always there with helpful suggestions when things were not working. Laura Eme was my
always encouraging co-author for the molecular clocks work. Thanks to Michelle Leger
for trading steps in Westerns with me, and providing caffeine, puns and constructive
criticism during thesis writing. Tommy, Jiwon, Eleni, Dayana, Jav, Martin and Ryoma
were a pleasure to be around, whether they were hard at work or discussing important
matters at lab beer. Thanks to Jacquie de Mestral, Marlena Dlutek and Wanda Danilchuk
for keeping the lab running, and the other visiting Roger lab members for enriching my
experience.
Thanks to everyone in the Center for Comparative Genomics & Evolutionary
Bioinformatics for creating a great place to work and the opportunity to hear about lots of
very interesting research. The members of my supervisory committee (Alastair Simpson,
Melanie Dobson and John Archibald) were encouraging through all the years of this
degree.
Outside of Dalhousie, I’d like to thank my parents for their ongoing support and
Mohsin Khan for keeping me company along the way.
This work was supported by NSERC, Killam Trusts and Dalhousie’s President’s
Award.

1
Chapter 1: Introduction
One of the most interesting evolutionary questions to big, multicellular organisms
such as ourselves is how unicellular organisms evolved to the complex organisms that
inhabit our visible environment today. With the advent of molecular phylogenetics, the
unicellular organisms most closely related to multicellular groups can be identified, and
their genomes sequenced and annotated. The sequence data gathered to date reveal that
many genes needed for multicellular development existed before the transition to
multicellularity (Rokas 2008, Knoll 2011). Improved phylogenies of eukaryotes have led
to a better understanding of the number of unicellular to multicellular transitions, while
recent advances in genomics mean that the genetic signature of multicellularity is being
elucidated. This chapter outlines the theory behind what is needed for the transition from
unicellularity to multicellularity (both in terms of new functions required and broader
selection pressures) and summarizes what is known about the origin of one multicellular
group, namely animals.
1.1 Diversity of Multicellularity
The evolution of multicellularity can be seen as the result of selection for an
increase in size (Bonner 2000). As surface areas grows more slowly than volume for a
cell of the same shape with a growing length, surface diffusion limits how large a single
cell can be (Saucedo and Edgar 2002), excluding unicellular organisms from certain
niches. Cell size is related to genome size, although the mechanism of this relationship is
not well understood (Cavalier-Smith 2005, Gregory 2001). Some cells have evolved new
and interesting cell biology to get around these constraints, one example being the giant
cells of Acetabularia, which are up to several centimeters in length (Mandoli 1998).
Other large cells function by containing many nuclei (for example myxogastrids – see the
‘Multinucleate’ column in Fig 1.1). Another strategy for the organismal increase in size,
multicellularity, can arise in two fundamentally different ways: either by cells
aggregating or remaining attached after cell division.

2
Figure 1.1: Diversity of eukaryotic multicellularity. Aggregative multicellularity involves solitary
vegetative cells coming together to form fruiting structures. Colonial multicellularity consists of cells
remaining attached after division, while complex multicellularity involves a large enough mass of cells that
some are not in contact with the outside environment (Knoll 2011). Groups straddling these columns
represent intermediate grades of organization – with some cellular differentiation, but less complexity, and
various forms of multicellularity within the groups. Multinucleate organization – cells that reach huge sizes
with many nuclei – is an alternative strategy for the evolution of macroscopic forms. Early fungi consist of
multinucleate hypha, which in some groups have developed cross-walls and a high level of differentiation
in fruiting bodies (Stajich et al. 2009). Parenthesis indicate subgroups of the above group – for example
kelps are a subset of brown algae and Bryopsidales are a subgroup of Chlorophyta. Pezizomycotina and
Agaricomycotina are subsets of Fungi that evolved complex multicellularity independently (Stajich et al.
2009). Bold indicates possible multiple transitions to multicellularity and/or reversion to unicellularity.
Lists of colonial and multinucleate forms are not exhaustive.
Aggregative multicellularity is common throughout eukaryotes (Fig 1.1, first
column). All aggregative multicellular organisms have a similar life cycle: single cells
feed, then when the food runs out they come together, forming spores. In many species
these spores are lifted up on a stalk, which can be made of an extracellular matrix, cells,
or both (Brown and Silberman 2013). While this strategy does help the organism disperse
to more favorable environments, the fact that many different cells are coming together
means that, in principle, they may not all be genetically identical, leading to interesting

3
selection effects (discussed in more detail below). Most examples of aggregative
multicellularity are simple, with only one or two different cell types. Dictyostelium
discoideum (Amoebozoa) contains a polarized epithelium (Dickinson et al. 2011), similar
to the one found in animals, making it an interesting organism for comparative studies.
Most multicellular groups, including the physically largest, develop by cells
remaining attached after division (Fig 1.1, middle columns). The simplest example of this
life-history is ‘colonial growth’, which simply involves cells sticking together, without
any cellular differentiation. In some diatoms (for example Skeletonema), this is achieved
by interlocking the silica shells of adjacent cells (Gebeshuber and Crawford 2006), while
the rhizarian Spongomonas and relatives of Volvox extrude an extracellular matrix. Some
choanoflagellates form clumps of cells (Fairclough et al. 2010) and some ciliates develop
a colonial form of several cells attached to an extracellular stalk (Bonner 1998). Some
colonial organisms with many cells have cells that differentiate, increasing complexity.
This ranges from the simple germ/soma differentiation in Volvox to the more than 100
cell types in some animals (Rokas 2008). After a certain increase in organism size,
differentiation becomes necessary – now some cells are separated from their environment,
and will need specialized structures for the transport of nutrients (Knoll 2011).
Definitions of complex multicellularity vary, but usually rely on number of different cell
types (Rokas 2008) and the presence of a recognizable macroscopic morphology (Cock et
al. 2010). When defined as those organisms that are large enough that some cells are no
longer in contact with the external environment (Knoll 2011), complex multicellularity
has evolved in the land plants, florideophyte red algae, kelps, animals, and twice in fungi
(groups entirely within the ‘complex’ column of Fig. 1.1).
Multinucleate forms are also widespread in eukaryotes (Fig 1.1, rightmost). This
includes foraminiferans, the green algal group Bropsidales, some stramenopiles related to
brown algae (e.g. Vaucheria), and the myxogastrids (or plasmodial slime molds) found in
Amoebozoa. Simple, deep-branching fungi (such as the Mucoromycotina, which
includes Rhizopus) consist of long filaments surrounded by a cell wall made of chitin,
with no cell walls separating the many nuclei. In more complex forms, septa (cross walls
that divide the hyphal tube into sub-compartments) separate nuclei, explaining the
classification of Fungi as a multicellular organism, but even here nuclei can move

4
throughout the hyphae. Complex multicellularity with many cell types has evolved in
both the ascomycetes and basidiomycetes (Knoll 2011), specifically the Pezizomycotina
and Agaricomycotina (Stajich et al. 2009).
While the multiple distinct forms of multicellular organisms detailed above make it
difficult to count the number of transitions to multicellularity, another difficulty lies in
elucidating phylogenetic relationships of multicellular groups and their unicellular
relatives. Early phylogenetic trees of eukaryotes placed many complex multicellular
groups within the so-called ‘crown eukaryotes’ (Sogin et al. 1989), which excluded
‘simpler’ forms such as amitochondrate protists. Further study of the effects of divergent
sequences on phylogenetic reconstruction revealed that this grouping of complex
organisms is the result of distantly related organisms grouping together due to a long-
branch attraction (LBA) artifact (Roger 1999). Theories explaining the transition from
unicellularity to multicellularity rely on inferences of the ancestral unicellular state, as
inferred from the extant deep-branching groups. To identify deep-branching groups, the
tree must be rooted, which requires additional information, such as sequences from an
outgroup, which may be divergent enough to increase the LBA artifact. Issues of
eukaryotic phylogeny are discussed in more detail in the introduction to Chapter 2.
Increasing genetic distance may make the reconstruction of phylogeny difficult, and even
if known unicellular species exist that are the sister-groups of multicellular taxa, their
features may no longer be representative of the ancestral form. Volvox and its relatives is
an example of a recent (209–260 Ma) transition that has proven very profitable to study
(Herron 2009), while the transition in Metazoa is much more ancient (660 – 880 Ma; see
Chapter 2 (Sharpe et al. 2015)) and accordingly more difficult to reconstruct.
While eukaryotes dominate the macroscopic biosphere, multicellularity is also
present in prokaryotes (Claessen et al. 2014). Biofilms held together by secreted matrix
components (for example in Bacillus subtilis) are similar to some forms of colonial
development (Vlamakis et al. 2013). Other prokaryotes show differentiation, a step
towards complex multicellularity. In filamentous cyanobacteria such as Anabaena, cells
differentiate, losing their reproductive capacity, so that they can fix nitrogen (Golden and
Yoon 2003). The regulation of this process, as well as the mechanisms for sharing the
resources produced, involves complex regulation and communication between cells. In

5
the actinomycete Streptomyces, inhibition of cell division leads to the formation of
hyphae – filaments with multiple nucleoids – which undergo a developmental program-
to produce spores that involves programmed cell death, cooperation, differentiation and
the production of antibiotics (Claessen et al. 2014). In Archaea, Methanosarcina grows
in clumps, possibly to protect inner cells from an influx of harmful oxygen (Bonner
1998).
1.2 New Functions Required for Multicellularity
The transition from a unicellular to a multicellular lifestyle involves the acquisition
of two key features: cells that previously would have existed independently must stick
together, and must cooperate rather than compete. While unicellular organisms must
maintain complex signalling systems to respond to their changing environments
(Christensen et al. 1997), multicellularity requires communication between cells of the
same organism. Signalling can help cells maintain homeostasis for the larger organism,
incorporating information about the status of other cells, and control how and when cells
differentiate. In some cases, cells even undergo programmed cell death if that is what is
beneficial to the larger organism (Nedelcu et al. 2011). Genes that control early
development are of particular interest to understand how complex body plans are formed
(Richards and Degnan 2009). Adhesion and signalling proteins (and proteins that fulfill
both roles) are therefore important for establishing the differentiation and cooperation
needed to make a multicellular organism.
In each separate lineage where multicellularity has evolved, different ways for cells
to adhere to one another have evolved (Abedin and King 2010). Plants use polymers to
attach the cell wall of one cell to the next, maintaining the shape of the tissue (Jarvis et al.
2003). In contrast, animals possess a variety of cell adhesion systems, each of which
fulfills slightly different roles (Abedin and King 2010). Two examples are tight junctions,
which create barriers between the outside and the inside of the organism, and focal
adhesions, which create connections between certain cells and the extracellular matrix.
Each of these systems is made up of a specific set of proteins, and finding homologs of
these proteins in unicellular organisms could shed light on what their functions were
before the transition to multicellularity. Although it is not expected that unicellular

6
organisms would have a use for such adhesion molecules, integrins have been found in
Capsaspora owczarzaki and Thecamonas trahens (Sebe-Pedros et al. 2010, Brown et al.
2013), while cadherins have been found in choanoflagellates (King et al. 2003). Possible
functions for these molecules in unicellular organisms include motility, predation or
interactions during sexual reproduction.
Animals maintain the integrity of their tissues with a proteinaceous extracellular
matrix (ECM) (Hynes 2012). Many extracellular matrix proteins are long, with many
repeating, independently folded domains. These domains serve as sites for cross-linking
with other proteins (increasing ECM stiffness), or as binding sides for transmembrane
receptors, allowing cells to maintain a position in a tissue or move across it. The ECM
acts as a reservoir for growth factors, regulating their accessibility and adding a spatial
organization element to their binding to receptors on cells (Hynes 2009); the ECM thus
has a signalling role in development. The arrangements of domains in ECM proteins are
generally conserved in Metazoa, with many specific innovations in vertebrates. Many of
the ECM protein domains are present in unicellular lineages such as choanoflagellates
and Capsaspora, but with different arrangements (Williams et al. 2014). The proteins
necessary for the formation of basement membrane, a structure that is present in all
Metazoa except sponges, are type IV collagen, laminin, nidogen and perlecan (Hynes
2012).
One family of proteins that has only recently been recognized as existing outside of
Metazoa are the lysyl oxidases (LOX). While best known for their role in modelling the
extracellular matrix (by creating cross-links between collagen molecules), it was recently
shown that the conserved catalytic domain of LOX has a broad phylogenetic distribution,
and is found in both prokaryotes and eukaryotes (Grau-Bové et al. 2015). While the
specific domain arrangements of both LOX and the proteins it modifies are confined to
Metazoa, many of these domains are also found in other organisms, leaving open the
possibility that their original functions were co-opted for multicellular development in the
Metazoa.
The evolution of multicellularity also makes possible the simultaneous
differentiation of cell types, where cells specialize for different roles, often increasing the
efficiency of each of the individual roles. Differentiation may be a necessary result of

7
increased size, as once some cells are no longer in contact with the outside environment,
the organism must contain specialized nutrient transport systems to survive (Knoll 2011).
Often differentiation comes at a direct cost to individual cells: heterocysts in multicellular
cyanobacteria (Rossetti et al. 2010), and the cells that form the base and stalk in
dicyostelid slime molds (Thomason et al. 1999), are examples of cells that cannot
reproduce after differentiating.
Many of the signalling genes important for metazoan development were present in
the common ancestors of Metazoa and their unicellular relatives, but underwent domain
enrichment in metazoans, perhaps concomitant with the origins of differentiated cells in
this lineage. The metazoan Hippo signalling pathway, which regulates cell proliferation
and apoptosis as well as organ size, has been found in the filasterean Capsaspora
owczarzaki (Sebé-Pedrós et al. 2012). G-protein coupled receptors (GPCRs) are
important for responding to the environment in all eukaryotes, and the cytoplasmic
proteins that transduce these signals are conserved in Holozoa (Metazoans + unicellular
relatives; see Fig 1.2). Metazoans show a significant expansion of the number of GPCRs,
related to new functions involved in multicellularity (de Mendoza et al. 2014).
Transcription factors play an important role in development in Metazoa and land plants,
by changing the expression of other genes (de Mendoza et al. 2013). In particular the
metazoan T-box transcription factors are present in the filasterean Capsaspora; however
they have not sub-functionalized to the level present in their metazoan homologues
(Sebé-Pedrós et al. 2013a).
Programmed cell death (PCD) is a mechanism in multicellular animals by which
cells undergo a planned program of systematically destroying themselves. This is
obviously a detrimental process for an individual cell, but can have benefits for the larger
organism. Programmed cell death has evolved to prevent necrosis (which would harm
other cells), and inappropriate growth (i.e.: cancer). While processes similar to
programmed cell death are phylogenetically widespread across unicellular life (Nedelcu
et al. 2011), their functions are less clear. While kin selection, where cooperation of
closely related individuals ensures continued survival of their genes, could explain the
evolution of programmed cell death in unicellular organisms, it only applies when
populations are largely made up of one species, or in the presence of some mechanism for

8
recognizing kin (Nedelcu et al. 2011). Another option is that programmed cell death is
the result of the pleiotropic effects of genes. In this scenario, genes that act in ways
beneficial to the cell under some conditions may systematically destroy it under other
conditions (Nedelcu et al. 2011). Selection for the genes due to their beneficial effect has
the side effect of selecting for programmed cell death in some cases.
Being multicellular involves cooperating with related cells to function as an
individual. Individuals must be able to distinguish self from non-self, or else they risk
wasting resources on an unrelated neighbour. While less of an issue for multicellular
organisms that stay together through rigid cell walls (e.g.: plants, most algae), recognition
of non-self may be a greater concern for other groups such as animals, which often have
cell types that move across other cells or the ECM. For organisms with dynamic cell
adhesion, restricting this adhesion to ‘self’ cells (and hence being able to distinguish ‘self’
from ‘non-self’) could be an important factor in the origin of an immune system (Grice
and Degnan 2015) and the maintenance of multicellular tissue against the threat of
cheaters (cells that proliferate or use resources in a way that benefits the cell, but not the
larger organism).
1.3 Selection Pressures that Favour Multicellularity
The evolutionary transition from unicellular to multicellular lifestyle may be the
result of several different selection pressures. Increased size can be an advantage in
avoidance of predation (Boraas et al. 1998), and smaller surface-to-volume ratios with
increasing cell size limit the size of a single cell (Saucedo and Edgar 2002). The
transition to multicellularity has been replicated in experiments, by selecting for settling
through a liquid, favouring clumps of cells in yeast (Ratcliff et al. 2012) and in
Chlamydomonas reinhardti (Ratcliff et al. 2013). In another experiment, the unicellular
Chlorella vulgaris transitioned to an eight-cell colonial form after exposure to a flagellate
predator (Boraas et al. 1998). Another possible advantage is the improved absorption of
nutrients. For yeast, more benefit is obtained from secreting enzymes that break down
food if the cells are clumped together (Koschwanez et al. 2011), as when cells are in
clumps, the concentration of enzymes, and by extension of available nutrients, is higher
near the cell. While it may be tempting to assign selective advantages to all aspects of

9
multicellular growth, some features of multicellularity, such as the length of filamentous
bacteria, may simply represent an emergent property of processes such as cell death and
birth rates (Rossetti and Bagheri 2015).
The unicellular-to-multicellular transition is characterized by a change in the unit of
selection (Grosberg and Strathmann 2007, Maynard Smith and Szathmary 1995).
Organisms go from being single cells, each competing for their own survival, to a
collective of cells, with tasks divided among cells in ways that increase the fitness of the
group, but not necessarily the individual cells (for example, programed cell death,
discussed above). For many multicellular organisms, a genetic bottleneck in one stage of
the life cycle ensures that all the cells in the organism are closely related, meaning their
contribution to the survival of the larger organism helps pass their genes on to the next
generation (Buss 1987). While multicellular organisms have evolved mechanisms to
avoid ‘cheaters’ in the collective, they are not foolproof. As a result, cancer and cancer-
like phenomena are known amongst diverse lineages of multicellular organisms (Aktipis
et al. 2015). The complexity of animals may leave them especially susceptible to cancer,
in particular metastasis. Runaway cell growth causing tumours/galls/lesions has also been
observed in fungi, plants, red algae and brown algae (Aktipis et al. 2015). Cheaters are
also present in examples of aggregative multicellularity, and are well studied in
dictyostelid slime moulds (Bonner 2009, Fairclough et al. 2013).
One possible explanation for the persistence of multicellular forms of life, despite
their susceptibility to cheaters, is that adaptations that favour multicellularity act as a
ratchet (Libby and Ratcliff 2014). Under this process, adaptations that offer selective
advantages for multicellular organisms and disadvantages for unicellular organisms mean
that if the organism reverts to unicellularity, it is at a disadvantage compared to other
unicellular organisms. An example is found in the ‘snowflake yeast’, which evolved as a
result of artificial selection for cells or clumps of cells that settle in liquid (Ratcliff et al.
2012). Increased apoptosis is an advantage for the multicellular yeast, as more clumps of
several cells are released as propagules, but is a disadvantage for unicellular yeast, as
more of the cells die. Once a lineage has evolved multicellularity, while it may revert to
unicellularity, it is at a disadvantage compared to other unicellular lineages when it does
so. The return to a successful unicellular lifestyle depends on multiple steps going against

10
the ‘ratchet’ of the multicellular organisation, and so is not likely to happen. Cancers can
be thought of as a return to selection at the cellular level, however they can only survive
within a multicellular body, and so represent an evolutionary dead end. The genetic
factors that made the cancer successful within an organism make it hard for the cells to
survive outside a larger body. Occasionally, cancers have become transmissible, for
example is the canine transmissible venereal tumour (CTVT) (Murchison et al. 2014).
This sexually transmitted disease found in dogs began as a cancer in a single dog, but was
able to develop into a transmissible pathogen after many mutations.
Reconstructing the selective forces that led to extant multicellular groups can be
difficult, as the details of the environment of the ancestral species are usually not known.
Advantages such as avoiding predation assume the presence of larger, possibly
multicellular predatory organisms, and while this may be useful to explain the origins of
multicellularity in groups that have evolved relatively recently (for example, Volvox), it
does not explain how it first happened in organisms such as Metazoa. On the other hand,
the top of the size range of extant organisms represents a perpetually unfilled niche, just
waiting for innovations allowing for increases in size for the niche to be exploited
(Bonner 1998, Bonner 2006). Features that are necessary for the maintenance of the
complex multicellular organisms we see today may have evolved under very different
selection pressures.
1.4 Evolution of Life Histories and Multicellularity in Amorphea
Amorphea, the supergroup which contains both Amoebozoa and the Opisthokonta,
as well as other protist groups, contains many examples of multicellularity –
multicellularity by division in animals, multinucleate development in Fungi, and
aggregative multicellularity in Dictyostelids, Fonticula and others (the distribution of
multicellularity in Obazoa (Amorphea without Amoebozoa), is shown in Figure 1.2).
This distribution of multicellularity was the basis of a theory that aggregative
multicellularity may have been a precursor to multicellularity by division in Metazoans
(Mikhailov et al. 2009, Dickinson et al. 2012). Under this theory, the ancestors of
metazoans were aggregative multicellular organisms, which existed for a part of their life
cycle as single cells. In the transition to multicellularity, the single cell section of the life
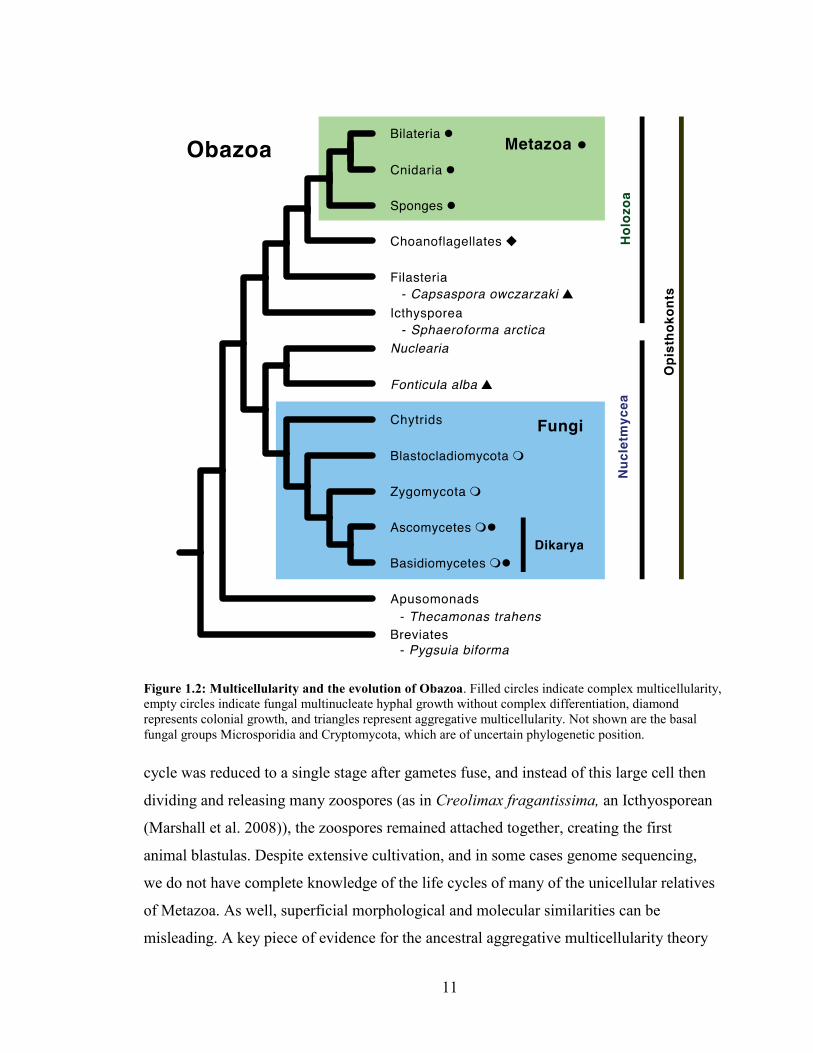
11
Figure 1.2: Multicellularity and the evolution of Obazoa. Filled circles indicate complex multicellularity,
empty circles indicate fungal multinucleate hyphal growth without complex differentiation, diamond
represents colonial growth, and triangles represent aggregative multicellularity. Not shown are the basal
fungal groups Microsporidia and Cryptomycota, which are of uncertain phylogenetic position.
cycle was reduced to a single stage after gametes fuse, and instead of this large cell then
dividing and releasing many zoospores (as in Creolimax fragantissima, an Icthyosporean
(Marshall et al. 2008)), the zoospores remained attached together, creating the first
animal blastulas. Despite extensive cultivation, and in some cases genome sequencing,
we do not have complete knowledge of the life cycles of many of the unicellular relatives
of Metazoa. As well, superficial morphological and molecular similarities can be
misleading. A key piece of evidence for the ancestral aggregative multicellularity theory

12
proposed by Dickinson et al. (2012) was the similarity in the arrangement of cells to
make a polarized epithelium in dictyostelids and metazoans. While the structure and
molecular components were indeed similar, careful phylogenetic analysis of the genes
involved proved this to be a case of molecular convergence (Parfrey and Lahr 2013).
Therefore there are multiple transitions to multicellularity within Amorphea.
There are several unicellular or colonial lineages of interest when studying the
origin of multicellularity in animals (Fig. 1.2). Obazoa is a clade that includes the
opisthokonts, and two unicellular groups – the apusomonads and the breviates (Brown et
al. 2013). As Opisthokonta contains two examples of complex multicellularity – Fungi
and Metazoa – the breviates and apusomonads could provide an important comparison
for understanding these two very different types of multicellularity. Within Opisthokonta,
Holozoa includes Metazoa and those unicellular organisms more closely related to them
than to fungi (Fig. 1.2). Unicellular holozoans such as Capsaspora and Sphaeroforma
have provided important insights into the origin of animal multicellularity (Sebé-Pedrós
et al. 2013a, Fairclough et al. 2013, King et al. 2003, de Mendoza et al. 2013).
1.5 Aims of this Thesis
With the huge range of multicellular organization present in eukaryotes, the
transitions from unicellular to multicellular lifestyles present inexhaustible scope for
research. I present estimates of when various multicellular groups evolved using
phylogenomics and relaxed molecular clocks in Chapter 2. In Chapter 3, I present the
evolutionary history and features of unicellular versions of integrins, a cell adhesion
molecule important for animal multicellularity.

13
Chapter 2: Timing the Origins of Multicellular Eukaryotes
Through Phylogenomics and Relaxed Molecular Clock Analyses
This chapter was published as Sharpe SC*, Eme L*, Brown MW, Roger AJ (2015)
Timing the origins of multicellular eukaryotes through phylogenomics and relaxed
molecular clock analyses. In Ruiz-Trillo I, Nedelcu AM (eds) Evolutionary transitions
to multicellular life: Principles and mechanisms. Springer Science+Business Media, doi:
10.1007/978-94-017-9642-2_1 ISBN 978-94-017-9641-5. Its contents have been
amended here following the suggestions of the examination committee.
* these authors contributed equally to the manuscript
2.1 Abstract
Multicellularity has evolved many times during eukaryote evolution. Deciphering
the evolutionary transitions to multicellularity requires a robust deep phylogeny of
eukaryotes to clarify the relationships amongst multicellular groups and determine their
closest unicellular relatives. Here I review progress in understanding of the phylogenetic
relationships amongst multicellular and unicellular eukaryotes, as well as estimates of the
ages of multicellular groups based on relaxed molecular clock (RMC) analyses. In
addition, I present an RMC analysis of a large phylogenomic dataset to estimate the
divergence dates of select major eukaryotic multicellular groups. My analyses (and other
recent studies) tentatively suggest that multicellular eukaryotes such as Metazoa, Fungi
and two of the major multicellular red algal taxa first emerged in the mid-Neoproterozoic,
whereas the dictyostelids arose in the Paleozoic. I also hypothesize that the first
multicellular organisms emerged within 300 – 600 Myr after the Last Eukaryotic
Common Ancestor (LECA). The age of land plants is less clear and is highly dependent
on methodology, the genes analyzed, and the nature of fossil constraints. In general, there
is great variability in all these age estimates, and their credible intervals span hundreds of
millions of years. These estimates are highly sensitive to both the models and methods of
RMC analysis, as well as the manner in which fossil calibrations are treated in these
analyses. As paleontological investigations continue to fill out the Proterozoic fossil
record, genomic data is gathered from a greater diversity of eukaryotes and RMC

14
methodology improves, estimates of the ages of multicellular eukaryotes may converge to
precise dates that can be correlated with Earth’s ancient geochemical record.
2.2 Introduction
2.2.1 Eukaryote Phylogeny
As knowledge of the deepest relationships between all extant eukaryotes improves,
there is a better understanding of how multicellularity has developed several times in
distantly related eukaryote lineages. Early phylogenies of eukaryotes based on small
subunit ribosomal RNA genes (SSU rDNA) showed the Metazoa, plants, Fungi and many
protistan groups emerging from an unresolved radiation. This radiation was preceded by
the divergence of a series of protistan lineages, with anaerobic ‘amitochondriate’ protists
emerging as the earliest branches next to the prokaryotic outgroup (Cavalier-Smith and
Chao 1996). This supported the idea that eukaryotic evolution proceeded by a gradual
increase in complexity, from simple cells without mitochondria, through more complex
unicellular organisms, to complicated multicellular organisms. This understanding of
eukaryotic evolution appeared to be founded on methodological artifacts (Roger 1999,
Roger and Hug 2006) and on an incorrect notion of the nature of so-called
‘amitochondriate’ eukaryotic lineages. It is now clear that the latter all possess homologs
of mitochondria in the form of mitochondrion-related organelles (MRO) (Tsaousis et al.
2012). Furthermore, because their SSU rDNA sequences have evolved more rapidly than
those of other eukaryotes, their deep-branching position in the eukaryote tree is likely a
result of the infamous long-branch attraction (LBA) artifact whereby they are artificially
clustering with the long branches leading to the prokaryotic outgroup (Roger and Hug
2006). With more data from multiple genes and better analytical methods it has become
clear that the apparently ‘deep-branching’ lineages on early SSU rDNA trees in fact
emerge in multiple distinct places in the eukaryote tree (Roger 1999, Roger and Hug
2006, Keeling et al. 2005, Baldauf et al. 2000) as do multicellular groups that each show
affinities to distinct ancestral unicellular protistan lineages (Burki et al. 2012).
Recent advances in our understanding of deep eukaryotic phylogeny have come
from analyses of large sets of concatenated genes that provide more information on
ancient nodes (Parfrey et al. 2010, Brown et al. 2012a, Burki et al. 2007). While the deep

15
branching order of eukaryotic lineages is still controversial (Zhao et al. 2012), a number
of relatively ‘stable’ eukaryotic supergroups have been identified. One of the earliest
recognized higher-level groupings of eukaryotes are animals, Fungi and their unicellular
relatives (Wainright et al. 1993) collectively known as the Opisthokonta. In unrooted
phylogenies of eukaryotes, opisthokonts are adjacent to the Amoebozoa, a group that
includes a wide variety of unicellular amoebae, anaerobic species previously thought to
be basal eukaryotes, and the Eumycetozoa (social amoebae, myxogastrids and relatives).
Opisthokonts, Amoebozoa, in addition to Breviata, Apusomonadida and a number of
unicellular organisms of unclear phylogenetic affiliation (Kim et al. 2006, Brown et al.
2013, Cavalier-Smith and Chao 2010) form the major division Amorphea (Adl et al.
2012), roughly equivalent to “unikonts” of Stechmann and Cavalier-Smith (2003) and
Richards and Cavalier-Smith (2005). Excavata is a possibly paraphyletic supergroup
including many long branches that contains several of the organisms originally thought to
be basal to other eukaryotes, but are now known to be united by ultrastructural
characteristics and molecular data (Simpson 2003, Simpson et al. 2006, Hampl et al.
2009). The remainder of eukaryotic diversity is encompassed in a grouping referred to as
Diaphoretickes that contains most of the photosynthetic lineages of eukaryotes (Adl et al.
2012). Within Diaphoretickes, the Archaeplastida encompasses eukaryotes with a
primary plastid, including glaucophytes, rhodophytes (red algae) and green algae (which
includes land plants). SAR is an assemblage made up of the Stramenopiles, Alveolata and
Rhizaria. These supergroups are generally well supported in phylogenomic analysis
(Brown et al. 2013, Hampl et al. 2009, Burki et al. 2012), including the 159-gene analysis
shown in Figure 2.1. Finally other lineages have more uncertain placements in the
eukaryote tree including the haptophytes, cryptophytes, telonemids, and collodictyonids
(Zhao et al. 2012, Burki et al. 2012).
It is uncertain how Diaphoretickes, Amorphea and Excavata are related, as this
depends on the location of the root of the tree of all eukaryotes. Since the position
recovered in early rDNA analyses has been discredited as an artifact of LBA, several
other possibilities for the root have emerged, and rare genomic changes have been used to
define its location. For example, a fusion between dihydrofolate reductase (DHFR) and
thymidylate synthase (TS) (Stechmann and Cavalier-Smith 2002), and the distribution of

16
myosin II, suggested that the root might lie between Opisthokonts+Amoebozoa
(Amorphea) and all other eukaryotes (Richards and Cavalier-Smith 2005). More recently,
it has become clear that the distribution of these features in various eukaryote lineages
could not be simply explained by ‘single gain’ scenarios and that so-called ‘rare’ changes
may have occurred more frequently than was once thought (Kim et al. 2006, Roger and
Simpson 2009). Using a molecular phylogenetic approach, Derelle and Lang (2012)
analysed a collection of mitochondrion-derived genes and found support for a root
between Amorphea other eukaryotes. However, analyses of another dataset with better
taxonomic sampling (He et al. 2014) supported a eukaryotic root between Discoba (a
group within Excavata) and all other eukaryotes (lack of data for other Excavates meant
this study could not conclude whether Excavates was a monophyletic group). Other root
positions have been recovered using other types of data. For example, an approach
minimizing gene family duplication and loss apparently supported a root between
Opisthokonts and other eukaryotes (Katz et al. 2012). In contrast, Cavalier-Smith has
suggested that the root lies between the Euglenozoa and all other eukaryotes because the
former lack a number of molecular and morphological features that are conserved in most
eukaryotes (Cavalier-Smith 2012). Clearly, there is no consensus on the position of the
eukaryote root and many candidate positions are plausible given the current evidence.
2.2.2 Placing Multicellular Groups on the Tree of Eukaryotes
Multicellularity represents a spectrum of organization ranging from simple colonies
of cells to complex differentiated multicellular organisms (Bonner 1998). Colonial
growth is common throughout eukaryotes and varies in complexity and the degree of
intercellular integration. Examples include diatoms, which can interlock their silica shells
to form chains, and the ciliates of the genus Zoothamnium, which have a sessile colonial
form that can contract when exposed to stimuli (Bonner 1998). In this chapter, I do not
consider simple colonial organisms; instead I focus on more complex multicellular taxa
(e.g., Metazoa, Fungi and land plants (Embryophyta), as well as less well-known forms
such as red algae and dictyostelids). Many of these possess sophisticated mechanisms for
the communication and transport of nutrients between cells. It is generally accepted that
most of these multicellular groups evolved independently from distinct unicellular
ancestors (Knoll 2011, Brown and Silberman 2013).

17
The largest and/or most familiar multicellular organisms develop through cells
dividing but not separating, followed by the differentiation of cell lineages into different
specialized types. This kind of ‘multicellularity-by-division’ is employed in both simple
organisms with a few cell types (e.g., the green algal genus Volvox) and in complex
organisms with hundreds of cell types (e.g., Metazoa) (Rokas 2008). Alternatively,
multicellular organisms known informally as ‘cellular slime moulds’ can develop through
the aggregation of single cells (Brown and Silberman 2013). In this form of simple
multicellularity, organisms exist as single cells for part of their life cycle, but come
together to form specialized organs for the distribution of spores. While the same basic
challenges of cell adhesion and communication need to be solved for both types of
multicellularity, they appear to have evolved in different types of environments.
Aggregative multicellularity has evolved in organisms that live predominantly in
terrestrial environments, while multicellularity-by-division has apparently evolved in
lineages which were originally aquatic (Bonner 1998).
Multicellular organisms face several challenges that are not relevant to strictly
unicellular organisms, including cell-to-cell communication and adhesion. The various
distinct lineages of multicellular organisms have solved these challenges in different
ways. To make inferences about the transition to multicellularity both how these
multicellular groups are related to each other and to unicellular organisms, and how the
genes involved in their multicellularity have evolved must be understood. For example,
Dickinson and colleagues have argued that biochemical and morphological similarities
between the epithelial tissues of one group of aggregative multicellular organisms
(dictyostelids) and the Metazoa indicated their common amorphean ancestor was
multicellular (Dickinson et al. 2012). However, Parfrey and Lahr (2013) conducted more
detailed evolutionary bioinformatic analyses that show the proteins involved are paralogs
that within a larger protein family, and this family is commonly found in unicellular
amorpheans. The molecular similarities are a result of convergent evolution in
Dictyostelids and Metazoa when these proteins were co-opted for functions related to
multicellularity. Dictyostelid and metazoan epithelia are therefore unlikely to be
homologous (Parfrey and Lahr 2013). In general, there is currently little reason to

18

19
Figure 2.1 Phylogenetic tree of eukaryotes based on a phylogenomic dataset. (previous page) Fossil
calibrated nodes are indicated by a filled circle, and nodes representing the divergence of multicellular
groups are indicated by letters (a: Metazoa; b: Fungi; c: dictyostelids; d: Streptophyta; e: Stomatophyta; f:
Rhodophyceae; g: Bangiales/Florideophyceae). Taxa that are multicellular by division are indicated by a
filled circle, while aggregative multicellular taxa are indicated by a triangle. The tree is shown arbitrarily
rooted at the base of Amorphea. Split with BS <100% are shown (all others are 100%).
suppose that any of the molecular mechanisms underpinning multicellularity in the
various lineages I discuss are homologous.
Multicellularity-by-division is exhibited by multiple lineages within the tree of
eukaryotes. Within Archaeplastida (Figure 2.1) this form of multicellularity has evolved
both within the red algae and green algae. Both Florideophyceae and Bangiales within the
red algae are multicellular, and a fossil Bangia-like organism, Bangiomorpha, apparently
provides the earliest fossil evidence of eukaryotic multicellularity (i.e., dated at 1198 +/-
24 Ma) (Butterfield 2000). Within the green algae, multicellularity has developed
multiple times, giving rise to a wide variety of forms, such as the nets of Hydrodictyon
(Bonner 1998) and the ball-like volvocine algae (Herron 2009). Volvox is a well-studied
example of the latter, which is useful in a comparative genomics context because many
close relatives with varying degrees of complexity exist (Herron 2009, Kirk 2005).
Finally, the Embryophyta (land plants) are the best-known and most conspicuous
multicellular organisms within the Archaeplastida.
Animals (Metazoa) include the most complex of all multicellular organisms, and
range from simple sponges to mammals with elaborate nervous systems. Besides animals,
the supergroup Opisthokonta includes another well-known multicellular-by-division
group, the Fungi. Fungi often display filamentous ‘hyphal’ growth and, complex
multicellularity with tissue differentiation occurs in the fruiting bodies of several lineages
that evolved separately in the Basidiomycota and Ascomycota (Knoll 2011, Stajich et al.
2009). Other fungal organisms have apparently experienced reductive evolution to
unicellularity (e.g., yeasts) (Stajich et al. 2009). Distantly related eukaryotes, the
Oomycetes (a stramenopile lineage) have converged on a similar lifestyle to that of Fungi
and show filamentous growth (Beakes et al. 2012). Finally, brown algae, another
stramenopile group, include large kelps and the model organism Ectocarpus (Cock et al.
2010).

20
Among organisms showing the second main type of multicellularity (i.e.,
aggregative multicellularity), the best studied are the dictyostelids. Many other organisms
that display aggregation have been discovered over the years, but only recently have they
been placed in the tree of eukaryotes using molecular data (Brown and Silberman 2013).
The dictyostelids belong to the supergroup Amoebozoa, and are closely related to the
plasmodial slime molds, which achieve a macroscopic form by growing into
multinucleate plasmodia (Schilde and Schaap 2013). Other aggregative protists include
Copromyxa, another amoebozoan (Brown et al. 2011), Capsaspora owczarzaki, a relative
of Metazoa (Sebé-Pedrós et al. 2013b), and Fonticula alba, an amoeba that groups as a
sister lineage to Fungi (Brown et al. 2009). Within the SAR clade, there are examples of
aggregative multicellularity within each of the three main groups: Guttulinopsis within
Rhizaria (Brown et al. 2012a), Sorodiplophrys in Stramenopiles (Dykstra and Olive
1975), and the ciliate Sorogena within Alveolates (Olive and Blanton 1980). Finally, the
acrasid amoebae within excavates are aggregative (Brown et al. 2012b), leaving
Archaeplastida as the only supergroup without an aggregative multicellular representative.
2.2.3 Using Molecular Data to Date the Emergence of Lineages
As well as being invaluable for the elucidation of phylogeny, molecular data can be
used to estimate the date of divergence between organisms. From molecular sequence
data it is possible to calculate an evolutionary distance, which is the product of rate of
substitution (i.e., fixed nucleotide or amino acid changes) and time. Consequently, if the
date of divergence for two taxa is known, an average rate of substitution can be inferred.
If the rates of substitution are equal across all branches on a tree (i.e., a ‘molecular clock’
holds), this rate can then be used to convert branch lengths from the rest of the tree to
dates (Zuckerkandl and Pauling 1965). Given that evolutionary rates often vary across
subgroups of the tree of life (for example, see discussion of LBA above), methods using
strict molecular clocks are not appropriate unless explicit tests are conducted to prove
that their use is justified (Welch and Bromham 2005, Takezaki et al. 1995).
Once it became clear that a strict molecular clock does not generally hold (Langley
and Fitch 1974), many efforts were made to ‘relax’ the molecular clock (Sanderson 1997,
Sanderson 2002, Kishino et al. 2001, Thorne et al. 1998, Lepage et al. 2007). Strategies
ranged from assigning subsections of the tree to evolve at different rates (Yoder and

21
Yang 2000), to employing a complex Bayesian framework to model branch-specific rates,
along with other parameters associated with the tree (Yang 2006). Substitution rates
depend on biological processes such as mutation rate and generation time (Ho 2009), and
so may be correlated on neighbouring branches. Whether the correlation is applicable
between branches that cover a large phylogenetic distance such as all of eukaryotes is less
clear. Correlated models (such as the lognormal (LogN) (Kishino et al. 2001) and Cox-
Ingersoll-Ross (CIR)(Lepage et al. 2007) used in my analyses below) draw the rate on a
particular branch from a probability distribution of rates centered on the rate of the
‘parent’ branch. Uncorrelated models (for example, the uncorrelated gamma (UGam)
model in my analyses) draw rates for each branch from one global probability
distribution, not taking into consideration the rates on adjacent branches (Drummond et al.
2006).
Another difficulty with molecular clock analysis concerns the assignment of fossil-
based time calibrations (Benton and Donoghue 2007, Parham et al. 2012). There is only
indirect evidence for the date of divergence of two species: groups under study must have
existed for some time before the right conditions occurred for preservation in the
geological record. Moreover, even if an organism fossilizes, estimates of its geological
age also have associated uncertainty. In addition, identification of fossils is often
controversial (especially in the case of simple ‘soft-bodied’ multicellular or unicellular
organisms), as they often lack characteristic features that would allow them to be
definitively assigned to an extant group. Furthermore, fossil assignments depend on
whether a fossil is a member of the ‘crown group’ (i.e., it descends from the most recent
common ancestor (MRCA) of all extant species in the group), or instead represent a
‘stem group’ lineage, (i.e., it diverged prior to the MRCA of extant members of the group,
and thus does not possess any currently living descendant) (Benton and Donoghue 2007).
Unfortunately, it is sometimes difficult to determine whether a given fossil corresponds
to an extinct crown group lineage or is a stem group organism. Clearly, this distinction is
extremely important as each of these types of fossils conveys different information about
the ages of nodes on molecular phylogenies of extant organisms. For example, stem
lineage fossils may be older or younger than the node defining the MRCA of the crown

22
group on phylogenies, whereas crown group fossils must be younger than this node (and
can therefore provide a lower bound on its age).
In addition to the difficulties associated with assigning fossil constraints to specific
nodes on phylogenetic trees, another problem relates to the fact that crown group fossil
dates must always be treated as minimum possible ages (as the MRCA of the group must
predate the appearance of the first fossil). While a few groups of protists have a
continuous fossil record that can be fairly reliably translated into minimum and maximum
dates (Berney and Pawlowski 2006), most organisms on the tree of life are only
sporadically fossilized, and so a fossil represents only a minimum restriction on the age
of that group, which is not particularly informative for subsequent analyses.
Finally, there has been much debate over how fossil dates should be treated during
RMC analyses, notably because of the uncertainty associated with the dating of the rocks
in which the fossils are found (for a detailed review on this question, see (Parham et al.
2012) and references therein). There are several ways of applying fossil constraints (Ho
and Phillips 2009). Treating calibrations as ‘hard bounds’ implies that the estimated age
of a constrained node will necessarily fall within the fixed time intervals specified by the
paleontological evidence (Kishino et al. 2001). In contrast, the ‘soft bound’ approach
uses a probabilistic treatment of fossil age data, and therefore can accommodate potential
error in calibrations. The simplest of these is the use of a uniform prior probability
distribution for the node falling within the bounds defined by the fossil age data (Yang
and Rannala 2006), leaving some probability of the node falling outside the bounds (e.g.,
a smoothly decreasing probability distribution on each side of the bounds, as
implemented in Phylobayes (Lartillot et al. 2009) and used for my analyses below).
Alternatively, fossil evidence can also be represented as parametric probability
distributions such as lognormal or gamma, with a ‘mix’ of a hard lower bound and soft
upper bound (e.g., as implemented in the software BEAST (Drummond et al. 2006)). The
manner in which fossil dates are treated by the software that is estimating dates can have
a large impact on the final results (Inoue et al. 2010).
Translating fossil and other geological evidence to a range or distribution of dates is
often subjective and has attracted much criticism (Shaul and Graur 2002). Recently,
efforts have focused on formalizing strategies for interpreting fossil data (Parham et al.

23
2012) and selecting age distributions (Nowak 2013); however, these have yet to be
widely applied.
2.3 Methods
2.3.1 Dataset Construction
In collaboration with Dr. Matthew Brown, I updated a previously developed data
set of 159 aligned proteins from diverse eukaryote lineages (Brown et al. 2013) to
provide the most possible calibrated nodes based on available fossil evidence (total of 85
taxa). BLAST was used to search reference genes against all protein data available for a
specific taxon. The top hit in each taxon was then searched using BLAST against the
ORTHOMCL database of orthologous protein families (www.orthomcl.org), and
discarded if it did not match the correct orthologous group for the gene of interest.
Single gene trees were constructed, and an in house script was used to identify taxa
branching with high support that contradict well-established phylogenetic
groupings. When manual examination of the single-gene trees revealed possible
lateral gene transfer or contamination (e.g. a single taxon from one established
group branching with high support with several taxa from a different established
group) the sequence for that gene and taxa were removed. Each gene was then re-
aligned, trimmed to remove ambiguously aligned sites using BMGE (Criscuolo and
Gribaldo 2010), and concatenated to form the final 43099 site alignment.
2.3.2 Reference Phylogeny
A maximum likelihood (ML) phylogenetic tree was obtained from 60 heuristic
searches employing RAxML version 7.2.6 (Stamatakis 2006) under the LG + Γ +F amino
acid substitution model. Bootstrap support (BS) for splits was estimated from 500
pseudoreplicates. To assess whether the reference phylogeny was robust to
methodological bias, a Bayesian estimation of the tree was also performed. Four chains
of Markov Chain Monte Carlo (MCMC) were run with Phylobayes 3.2 (Lartillot et al.
2009) for each of the CAT-GTR, CAT-POISSON and catfix C60-Poisson substitution
models. For each of the three substitution models, the four MCMC chains did not

24
converge, although the post-burnin consensus tree was identical to the ML tree except for
an unresolved multifurcation at the base of Excavata.
2.3.3 Fossil Calibrations
Fossil calibrations (Table 2.1) were taken from (Parfrey et al. 2011) with
adjustments described below. Four calibrations (Gonyaulacales, spirotrichs, Foraminifera
and euglenids) were removed due to insufficient sampling of taxa from the clade of
interest. The ‘ciliate’ tetrahymenol-based calibration (Summons and Walter 1990) was
removed, as the biomarker used, tetrahymenol, is also found in aneorobic protists
(Takishita et al. 2012). Seven calibrations were adjusted by using a different taxa of
equivalent phylogenetic position for which genomic data was available. As insufficient
data was available from Isochrysis galbana or any equivalent taxa within the haptophytes,
the coccolithophore calibration was adjusted from a narrow limit, to a wide range with an
uninformative maximum (3000 Ma). A recent discovery of the oldest known cestode
(tapeworm) (Dentzien-Dias et al. 2013) was used to add a calibration for Platyhelminths.
The minimum age (250 Ma) was taken from the youngest possible age of the fossil
(lower boundary of the Permian) and the upper boundary was taken from the limit on the
next-oldest calibrated node (Bilateria). With the ten remaining calibrations unchanged,
nineteen calibrations were used to date the phylogeny.
2.3.4 Relaxed Molecular Clock Analyses
The ML phylogeny was used for relaxed clock molecular dating analyses with
Phylobayes 3.2 (Lartillot et al. 2009). For all analyses, a birth-death tree prior was
applied, and a discrete gamma distribution was used to model among site rate variation.
Two chains were run until diagnostic stastistics from the ‘tracecomp’ function of
Phylobayes indicated convergence or until estimated dates on nodes of interest for the
two chains were < 10% different.
As it is unclear which models of evolution are most realistic, I present results
obtained with three different RMC models, two different substitution matrices, and two
ways of treating fossil calibrations, for a total of twelve sets of parameters. The RMC
models included both uncorrelated (UGam) and correlated models (LogN, CIR), where
Table 2.1 Calibrations used for relaxed molecular clock analysis. (following page)

25
Taxon Node Specification Min (Ma) Reference
Fossil Max (Ma)
Pennate diatoms Phaeodactylum 80 (Kooistra et al.
2007) Oldest pennate Thalassiosira 110
Eudicots Arabidopsis 125 (Friis et al. 2010)
Eudicot pollen Oryza 133.9 (Sun et al. 2011)
Angiosperms Arabidopsis 133.9 (Crane et al. 1994)
Oldest angio pollen Welwitschia 425
Diatoms Pelagophyceae 133.9 (Harwood et al.
2007) Earliest diatoms Thalassiosira 550
Coccolithophores Emiliania 203.6 (Bown 1998)
Earliest
Heterococcolith
Prymnesium 3000
Dinoflagellates Alexandrium 240 (Fensome et al.
1999) Earliest gonyaulacales Symbiodinium 300
Platyhelminths Taenia 250 (Dentzien-Dias et
al. 2013) Earliest cestode Schistosoma 555
Endopterygota Apis 284.4 (Dostál and Prokop
2009) Mecoptera Drosophila 350
Amniota Gallus 328.3 (Smithson and
Rolfe 1990) Westlonthania Homo 400
Ascomycetes Schizosaccharomyces 400 (Taylor et al. 1999)
Paleopyrenomycites Coprinus 1000
Trachaeophytes Physcomitrella 425 (Kenrick and Crane
1997) Earliest trachaeophytes Arabidopsis 471
Embryophytes Mesostigma 471 (Rubinstein et al.
2010) Land plant spores Oryza 600
Vertebrates Branchiostoma 520 (Shu et al. 1999)
Haikouichthys Homo 555
Bilateria Branchiostoma 555 (Martin 2000)
Kimberella Caenorhabditis 630
Arcellinida Acanthamoeba 736 (Porter et al. 2003)
Paleoarcella Copromyxa 3000
Animals Amphimedon 632 (Love et al. 2009)
LOEMs, sponge
biomarkers
Homo 3000 (Cohen et al. 2009)
Chlorophytes Volvox 700 (Butterfield et al.
1994) Palaeastrum Acetabularia 3000
Florideophyceae Chondrus 550 (Xiao et al. 2004)
Doushantuo red algae Porphyra 3000
Red algae Porphyra 1174 (Butterfield 2000)
Bangiomorpha Cyanidioschyzon 3000
26
correlated models indicate that the rate of one branch is dependant on the rate of the
parent branch. The uncorrelated gamma multipliers RMC model (UGam, Drummond et
al. (2006)) takes rates from a single gamma distribution, which is fitted to the data during
Bayesian inference. The correlated lognormal RMC model (LogN) (Thorne et al. 1998)
allows variation of rates following a lognormal distribution. The Cox-Ingersoll-Ross
(CIR) model (Lepage et al. 2007) is correlated from branch to branch as well. Under this
model changes near the mean rate are considered likely, but larger or additive changes
are penalized, pushing the value back to the mean. Two substitution matrices were
considered. The site-heterogeneous empirical profile mixture model C60-Poisson (C60)
(Le et al. 2008) considers all amino acid substitutions as equally likely, but possible
amino acids at a site are defined by sixty empirically derived site classes. The LG
substitution matrix (Le and Gascuel 2008) uses an empirically defined matrix of
probabilities of transition from one amino acid to another, and does not have different site
classes. Two ways of treating fossil calibrations were used - “soft” and “hard” bounds.
Under the hard bound parameter, the age of that node cannot fall outside of the range
defined by the calibration. Soft bounds allow a 5% probability that the node is either
older or younger than the specified range.
Dating evolutionary events requires the specification of the position of the root of
the eukaryotic tree. For this reason, three alternative positions for the root were tested: (i)
between Amorphea and the remainder of eukaryotes (i.e., the classical “unikont-bikont”
rooting (Derelle and Lang 2012); (ii) between the Obazoa (Opisthokonta + apusomonads
+ breviates) and all other taxa (Katz et al. 2012); and (iii) between Excavata and all other
eukaryotes (He et al. 2014). Interestingly, these three alternative placements had little
impact on the estimated ages of the various groups considered here (discussed further in
Eme et al. (2014)). Therefore I only discuss our RMC age estimates for major
multicellular groups obtained with the Amorphea root.
2.4 Results and Discussion
In the last few decades, many attempts have been made to date divergences deep
within the tree of life, including many of the multicellular eukaryote lineages. Here I
review the most recent attempts that employ relaxed molecular clock methods. In

27
addition I present an analysis of the age of various multicellular groups based on a
phylogenomic dataset with molecular data and fossil calibrations from representatives of
the full breadth of eukaryotic diversity. I focus specifically on multicellular groups that
are well represented in my own analyses (Figure 2.1 and below) including the Metazoa,
Fungi, embryophytes (land plants), the red algae and dictyostelids.
For my estimation of the ages of multicellular groups (nodes indicated by letters in
Figure 2.1), I used the Bayesian implementation of RMC models in Phylobayes (Lartillot
et al. 2009) to analyze a large phylogenomic dataset (159 proteins, 85 taxa). The
phylogenetic tree was obtained using maximum likelihood analysis and was calibrated by
nineteen fossil calibrations from diverse eukaryote groups, the majority of them taken
from Parfrey et al. (2011). My analyses included three different RMC models (the
uncorrelated UGam model, and the correlated LogN and CIR models), two substitution
matrices (the site-heterogeneous empirical profile mixture model C60-Poisson (C60)(Le
et al. 2008) and the more classical site-homogeneous LG substitution matrix (Le and
Gascuel 2008)), and two ways of treating fossil calibrations (“soft” and “hard” bounds).
Figure 2.2 Estimates of the age of the most recent common ancestor of Metazoa (a), Fungi (b) and
Dictyostelids (c). Results are shown for the combination of three different RMC models (UGam, LogN and
CIR) with two substitution models (C60, squares; LG, circles), and with soft (filled shapes) or hard (open
shapes) bounds. Error bars indicate 95% credible intervals. For each node with calibration, the error bar
above ‘Cal’ shows the age range used to calibrate the node. Where upper bound is not shown, it was equal
to 3000 Ma. Asterisks (*) indicate estimates where the two chains showed more than a 10% difference in
either the mean, the upper 95% limit or the lower 95% limit.

28
A few general trends can be noted in my results. First, soft bounds yielded younger
date estimates than hard bounds when other parameters (i.e., relaxed clock model,
substitution matrix) were identical (Figures 2.2 and 2.3). As the use of hard bounds is
hardly justified given the uncertainties discussed above, I will mainly focus on results
obtained with soft bounds. Second, the uncorrelated UGam relaxed molecular clock
model gave larger credible intervals (so that the range for soft and hard bounds largely
overlapped), with little change based on the substitution model. Third, analyses with the
LogN and CIR rate evolution models showed more variation, both in terms of estimated
ages of nodes, and of size of the confidence interval. This variation was often only seen
when both the type of calibration used (hard or soft bounds) and the substitution matrix
(C60 or LG) was changed, underlying the complex interaction between the various
features of RMC analyses in influencing the age estimates obtained. Fourth, in general,
the choice of the substitution matrix often did not make much of a difference (Figure 2.2
and 2.3, compare black squares to black circles for a given clock model), although more
substitution matrix-based changes were seen in CIR analyses. For further discussion on
the impact of these various parameters, see Eme et al. (2014).
2.4.1 Metazoa
There have been a large number of molecular clock-based studies attempting to
date groups within Metazoa, in particular the Bilateria. These have often sought to
illuminate the Cambrian explosion, an apparently sudden emergence of many divergent
bilaterian phyla in the fossil record at the start of the Cambrian Period (530 Ma)(Levinton
2008). While much has been made about this change in the fossil record, molecular clock
analyses often date the first Bilaterian divergence as much older (Hedges et al. 2004,
Erwin et al. 2011). Basal metazoans such as cnidarians, placozoans and sponges existed
for many years previous to this, as sponge biomarkers (Love et al. 2009) and fossil
evidence for sponges (Cohen et al. 2009) dates to 632 Ma. The transition from
unicellularity to multicellularity would have happened before the last common ancestor
of all extant Metazoans (Figure 2.1, node a) and I focus on the estimated age of this node
in the previous studies.
Hedges et al. (2004) estimated the Porifera-Animalia divergence at 1,351 ± 120 Ma
(1116–1586), more than twice as old as the first fossil evidence for Metazoa. Their 17 –

29
19 protein gene dataset (depending on the method applied) was calibrated using the bird-
mammal divergence as a primary calibration, and three additional secondary calibrations;
various molecular clock methods were used, including Bayesian RMC modeling.
Secondary calibrations involve using a date obtained from one molecular clock analyses
as a calibration for another molecular clock calculation, a practice which has been
vigourously criticized (Graur and Martin 2004) for failing to add new information to the
dating analyses, propagating earlier biases from the analyses that generated the
calibrations, and for failing to properly ‘carry forward’ the uncertainty associated with
them.
A much younger estimate was obtained with analyses using nine primary
invertebrate fossil calibrations and a dataset of seven genes (Peterson and Butterfield
2005). These molecular clock analyses (Sanderson 2003) yielded different estimates
depending on the phylogenetic method used to construct the tree. The minimum
evolution tree yielded an estimate of 664 Ma, whereas the ML tree gave 867 Ma. Later
reanalyses of this dataset (Roger and Hug 2006) found substantial variation in the
estimates (approximately 750 – 1300 Ma) and extremely broad confidence intervals
depending on the substitution models, relaxed molecular clock method/models and the
manner in which fossil constraints were applied.
Using 22 Phanerozoic minimum calibrations with only four maximum calibrations
based on fossils from a wide diversity of eukaryotic groups, Berney and Pawlowski
(2006) performed Bayesian RMC analyses of SSU rDNA sequences to date the
divergence of major eukaryotic groups. They estimated that the primary split within
Metazoa occurred 812 Ma (671 – 985).
In contrast to Berney and Pawlowski’s analyses of one gene with many fossil
calibrations, Lartillot et al. (2009) analyzed a many-gene dataset (68 genes) from 52
Holozoans (Metazoa plus unicellular opisthokont relatives) using only two fossil
calibrations (within the Metazoa) as soft bounds. Dates were estimated using the
PhyloBayes 3 software, with a CAT-GTR substitution model and lognormal
autocorrelated RMC model. An age of ~800 Ma (700 – 900) was obtained for the
MRCA of Metazoa.

30
With the goal of estimating the age of eukaryotes and their supergroups, Parfrey et
al. (2011) analyzed a 15-gene dataset with rich taxon sampling and 22 fossil calibrations
associated with different nodes throughout eukaryotic diversity. Using the uncorrelated
lognormal RMC model in BEAST (Drummond et al. 2006), they found the age of the last
common ancestor of all Metazoans to be 780 Ma (782 – 820). The estimate was about 60
Myr younger when the seven Proterozoic fossil calibrations (including Bangiomorpha)
were excluded.
In a taxon-rich analysis focused on Metazoan evolution, Erwin et al. (2011)
analyzed a 7-gene dataset with 118 metazoan taxa and 8 other taxa from Amorphea, with
24 fossil calibrations. Their Phylobayes analyses estimated the common ancestral
Metazoan node to be between 747 (690 – 825) and 1093 (962 – 1260) Ma, depending on
tree topology, RMC model (CIR or UGam), prior probability on the age of the root and
the degree of soft bound relaxation (i.e., ranging from 5-50% prior probability of the
node falling outside of the interval defined by the fossil dates).
While the geological evidence supports a bound on the youngest possible age for
animals at 632 Ma, there is lack of clear evidence for a plausible upper bound. Therefore,
for my analyses, I employed an uninformative maximum age for this node at 3000 Ma,
following Parfrey and colleagues (Parfrey et al. 2011). All of my analyses placed the last
common ancestor of Metazoa within 220 Myr of the lower calibration, with age estimates
between 698 Ma and 851 Ma, depending on the parameters used (Figure 2.2a). These
estimates fall within the range of age estimates of most of the other recent studies
discussed above; these span roughly 650 – 850 Ma (Peterson and Butterfield 2005,
Berney and Pawlowski 2006, Parfrey et al. 2011). The exceptions are the estimates
obtained by Erwin and colleagues (2011). They recovered slightly older estimates (i.e.,
~750 – 1100 Ma) that appeared to be fairly strongly influenced by the root age prior
placed on the Holozoa-Fungi split.
2.4.2 Fungi
Complex multicellularity with tissue differentiation in fruiting bodies has evolved
independently within two subgroups of the Fungi: the ascomycete lineage
Pezizomycotina and the basidiomycete lineage Agaricomycotina (Stajich et al. 2009).
Here I will focus specifically on the origin of simple filamentous ‘hyphal’ growth, which

31
was likely a feature of the common ancestor of most extant Fungi (with the possible
exception of Cryptomycota and Microsporidia)(Stajich et al. 2009). Although the
deepest branching order of the fungal tree is still controversial, I will provisionally
consider the Chytridiomycota and Blastocladiomycota to form a clade that split basally
from all other Fungi (Ebersberger et al. 2012, James et al. 2013), excluding the
Cryptomycota and Microsporidia.
There have been few efforts to apply molecular clock methods to the Fungi as a
whole, or even to specific groups of fungi, largely because of the lack of fungal fossils,
and the difficulty of classifying the fossils that do exist. Using the Langley-Fitch method
from the r8s software, Taylor and Berbee (2006) showed that age of the node uniting
Rhizopus (Mucoromycotina) and the Ascomycota + Basidiomycota group was highly
uncertain (estimates ranged from 435 – 1979 Ma depending on the calibration
used)(Taylor and Berbee 2006). When three calibrations (one each within Fungi,
Metazoa and plants) were used, an age of 792 Ma was estimated. More recently, they
used Bayesian analyses implemented in the BEAST software program to analyze a 50-
gene dataset with three primary calibrations and a prior on the age of opisthokonts
(Berbee and Taylor 2010). These analyses led to large confidence intervals for the
majority of nodes, including the Rhizopus/Ascomycota+Basidiomycota split which they
dated at ~ 750 Ma. Global eukaryotic analyses dated the deepest split in extant Fungi (i.e.,
basal Chytridiomycota versus all other Fungi, a deeper divergence than the one
considered by Berbee and Taylor (2010)) at 798 Ma (634 – 1003) (Berney and
Pawlowski 2006) and 1070 Ma (980 – 1220)(Parfrey et al. 2011).
In my analyses, the CIR model showed the greatest range of age estimates for the
split of the Chytridiomycota+Blastocladiomycota group from all other fungi (Figure 2.1,
node b). It yielded both the youngest age estimate (744 Ma, employing LG + soft bounds),
and the oldest (1152 Ma, employing C60 + hard bounds, Figure 2.2b). This range
illustrates the difficulty of separating the synergistic effects of different parameters in
molecular clock analysis. CIR also recovered wide credible intervals on the age, whereas
the LogN model had the smallest (and non-overlapping) intervals, with hard bound
estimates significantly older than the soft bound estimates. Soft bound estimates for the
age of Fungi were similar (~760 Ma) over all combinations of substitution and RMC

32
models, with the exception of the CIR + C60 combination, which was notably older (920
Ma).
My estimates for the age of Fungi are consistent with those of Berney and
Pawlowski (2006). Surprisingly, Parfrey et al. (2011) estimated an older age (980 – 1,220
Ma), despite the fact most of their calibrations were identical to those used in this study.
The paucity of fossil constraints within Fungi (i.e., only one) is likely largely responsible
for this discrepancy; because this node is not strongly constrained by ancestral or
descendant nodes, it is more susceptible to age estimate variation depending on the
dataset and methodologies used.
2.4.3 Dictyostelids
Using either a six-protein dataset or an rDNA tree, Fiz-Palacios et al. (2013)
estimated the divergence of dictyostelids using a combination of four fossil calibrations
from opisthokonts and land plants. Variation in estimates was found between those
obtained by the Bayesian package BEAST (employing the uncorrelated lognormal RMC
model) and MCMCtree (using independent rates RMC model), with most estimates
centering between 570 – 730 Ma. The one lower estimate obtained by Fiz-Palacios and
colleagues (341 Ma (247 – 699)) was obtained when only the two opisthokont fossils
were used and among site rate variation (ASRV) was modeled using a gamma
distribution (modeling ASRV is essential for model realism (Yang 1996, Roger and Hug
2006)). Their analyses showed that trees calibrated with only the two plant fossils failed
to return appropriate dates for the opisthokont fossils using fossil cross-validation (Near
and Sanderson 2004). Land plants are phylogenetically distant from Amoebozoa, and so
in absence of better sampling of fossil calibrations across the tree, using only plant fossils
may heavily distort the results.
My estimates for the age of the last common ancestor of dictyostelids were around
330 Ma (Figure 2.2c) and remained similar across most clock models and substitution
matrices (with soft bounds). However, even when restricting attention to soft bounds
analysis, confidence intervals tended to be very wide, spanning from 160 to 430 Myr. In
contrast, age estimates obtained by Fiz-Palacios and colleagues (2013) were much greater
(~530 – 730 Ma), except in the single case described above where their estimate was
closer to ours (~340 Ma).

33
Figure 2.3 Estimates of the age of the most recent common ancestor of Stomatophyta and
Stretophyta (a), and Bangiales/Florideophyceae and Rhodophyceae (b). See Figure 2.2 for details.

34
2.4.4 Embryophytes, Stomatophytes and Streptophytes
Embryophytes, the ‘land plants’, emerge from within the Streptophyta clade that
also includes a number of organisms with unicellular, colonial/filamentous and
multicellular forms (Leliaert et al. 2012). Multicellularity seems to have evolved multiple
times within the streptophytes, and reversion to simpler unicellular forms has probably
occurred as well (Becker and Marin 2009, Leliaert et al. 2012). It is therefore difficult to
pinpoint the origins of multicellularity within this group, although a key aspect of
‘complex multicellularity’ associated with embryophytes is the development of a diploid
zygote into a multicellular diploid sporophyte (Becker and Marin 2009). Here I will focus
on the crown embryophyte node (uniting liverworts with all other land plants), which
post-dates the origin of embryophyte-type multicellularity and the crown streptophyte
node which predates it. Note that many recent molecular clock studies (including ours
below) have not included liverworts (the deepest branching embryophytes), so the crown
‘land plant’ node referred to in these studies is the somewhat younger common ancestor
of the Stomatophyta (Figure 2.1, node e) that includes mosses and all other land-plants
(Clarke et al. 2011). Fossil constraints that are commonly included in molecular clock
analyses correspond to the first appearance of crown stomatophyte and embryophyte
spores at ~420 Ma and ~449 Ma and to the oldest unassignable (i.e., possibly stem or
crown) embryophyte spores at ~472 Ma (Clarke et al. 2011, Magallon et al. 2013).
Of the global eukaryotic analyses, the study by Hedges and colleagues (2004)
recovered the oldest estimate for the age of the MRCA of stomatophytes: 707 Ma (515–
899) (no streptophyte estimate was given). In contrast, Berney and Pawlowski’s (2006)
estimate for the embryophytes node was much younger 510 Ma (431 – 645), with
stomatophytes dated at ~442 Ma (again, no crown streptophyte age was available).
Parfrey et al. (2011) estimated a similar age for stomatophytes (~460 Ma with very small
credible intervals) with streptophytes dated at ~745 Ma (~625 – 850).
Although there have been many molecular clock analyses in the last two decades
that focus specifically on the streptophytes, here I discuss only two of the most recent
studies. Clarke and colleagues (2011) analyzed seven plastid genes and 17 fossil
calibrations within the embryophytes using a Bayesian RMC method (MCMCtree,
independent rates model). They examined fossil calibration consistency using cross-

35
validation (Near et al. 2005) as well as extensively explored the impact of uniform versus
Cauchy distribution priors on fossil calibrations. Uniform priors have an equal probability
that the node’s age is at any point within the given range, while a Cauchy distribution sets
maximum probability at point, with decreasing probability for progressively higher or
younger dates. Using a uniform prior with hard lower bound and a soft upper bound for
all constraints, their ‘best’ estimates for stomatophyte and embryophyte crown nodes
were 632 (548 – 750) and 670 Ma (568 – 815), respectively. However, they found that
the estimated ages of these deepest nodes were greatly influenced by the upper
calibration bound, as well as the nature of the prior distribution (i.e., uniform versus
Cauchy) on the fossil bounds. For the above estimates they used a uniform prior with an
extremely high upper bound of 1042 Ma for all three nodes (with the lower bound
defined by the first fossil evidence for each group).
Magallón et al. (2013) estimated the age of crown stomatophytes as ~458 Ma (446
– 469) and the ancestral embryophyte node at 475 Ma (471 – 480) using the uncorrelated
lognormal RMC model implemented in BEAST. While this dataset was comprehensive
in terms of taxon sampling (80 taxa) and fossil calibrations (26), only five plastid genes
were used. In contrast to the analyses by Clarke and colleagues, Magallón and colleagues
set a strong narrow lognormal prior distribution on the age of the MRCA of
embyrophytes centred at 472 Ma (Magallon et al. 2013), which likely explains the narrow
credible region from the posterior distribution they obtained for this node (spanning only
9 Myr).
My taxon sampling does not include the liverworts, the earliest branching lineage
within Embryophyta (Magallon et al. 2013). I therefore focus on the age of the common
ancestor of living stomatophytes (the split between mosses and all other land plants;
Figure 2.1 node e) as a lower bound on the age of embryophytes. I can estimate the
upper bound on the age of complex embryophyte-type multicellularity (i.e., diploid
multicellular sporophytes) by estimating the age of the basal streptophyte split
(Mesostigma versus all other land plants; Figure 2.1, node d). This divergence (i.e.,
Streptophyta, the upper bracket) was calibrated between 471 Ma (the oldest fossilized
embryophyte spores (Rubinstein et al. 2010)), and 600 Ma (following Parfrey and
colleagues (2011)). All of my analyses estimated the age of this node to be close to the

36
upper bound. In fact, the youngest estimates were obtained under the UGam model (~570
Ma) and were associated with very wide confidence intervals spanning more than half the
calibration range. In contrast, with LogN and CIR models estimates were older,
approaching the upper bound of the calibration, and in one case, just outside of it (LogN
+ C60, with soft bounds). The lower bracket (i.e., last common ancestor of stomatophytes
(Figure 2.1, node e)) shows the opposite trend: CIR and LogN estimates are grouped near
the lower calibration bound for that node (425 Ma).
My estimate of ~430 – 450 Ma for Stomatophyta is in agreement with results from
Berney and Pawlowski (2006) (~442 Ma), Parfrey et al. (2011) (~460 Ma), and Magallón
et al. (2013) (~458 Ma). This congruence is interesting given that these analyses used
fairly different age constraints on nodes from this region of the tree. In contrast, Clarke
and colleagues (2011) estimated this node to be much older (~630 Ma). However, the
results obtained by these authors seem to have been heavily influenced by the root prior,
which usually reflects that the data themselves contains little information (Felsenstein
2004, Rannala 2002, Zwickl and Holder 2004).
2.4.5 Red Algae
The first evidence of florideophyte red algae comes from fossils from the
Doushantuo Formation dated at 550 – 600 Ma (Xiao et al. 2004). These fossils have been
used by a number of molecular clock studies to provide a lower bound on the split of two
of the multicellular red algal lineages: the Bangiales and the Florideophyceae (Yoon et al.
2004, Berney and Pawlowski 2006, Parfrey et al. 2011). The second putative red algal
fossil often used is the Bangia-like Bangiomorpha pubescens from the Hunting
Formation dated at 1198 +/- 24 Ma (Butterfield 2000). As Bangiales and Florideophyceae
are a clade, and a number of red algal lineages (some of which are multicellular) branch
off before them within the Rhodophyceae (Yoon et al. 2004, Saunders and Hommersand
2004), this fossil is often used as a bound indicating the first appearance of multicellular
red algae (Yoon et al. 2004, Berney and Pawlowski 2006, Parfrey et al. 2011), although
there has been some argument about its attribution (Cavalier-Smith 2002).
In attempting to date the origin of major eukaryotic photosynthetic groups, Yoon
and colleagues (2004) used two rate-smoothing RMC approaches in r8s (Sanderson
2003) to analyze five plastid genes from a large diversity of photosynthetic eukaryote

37
lineages and seven fossil age constraints (two within the red algae, four within the
embryophytes and a maximum age on the root). Because their methods assumed hard
bound constraints (and their bounds were narrowly defined around fossil dates), they
could only obtain an unconstrained age estimate for the basal red algal split between the
bangiophyte+florideophyte clade and the unicellular Cyanidiales. Their estimate for this
node was 1,370 Ma (1,350 – 1,416). This age was much older than comparable estimates
by Berney and Pawlowski (2006) – they estimated an age of 780 Ma (680 – 950) for this
split, while the MRCA of the Floridiophyceae/Bangiales divergence was estimated to be
740 Ma (600 – 929). Note that Berney and Pawlowski did not include the Bangiomorpha
calibration in their analyses. Parfrey and colleagues (2011) obtained widely varying
estimates for the basal red algal split depending on whether they included the
Bangiomorpha and other Proterozoic fossil constraints. Without Proterozoic fossils, they
obtained a 95% credible age range for crown red algae of 625 – 959 Ma, whereas, with
them, they estimated the range to be 1180 – 1285 Ma. Their estimate for the
florideophyte/Bangiales split was ~765 Ma (~630 – 915) when Proterozoic fossil
constraints were included, and ~620 Ma (~495 – 700) when excluded.
I estimated the age of the Bangiales/Florideophyceae common ancestor as well as
the basal divergence between the unicellular Cyanidiales (Cyanidioschyzon and
Galdieria) and the Bangiales/Flordeophyceae clade. The Bangiales/Florideophyceae
divergence (Figure 2.1, node g) was calibrated by the first appearance of florideophytes
in the fossil record (Xiao et al. 2004) with a younger age bound of 550 Ma and an
uninformative maximum bound at 3000 Ma. All estimates of the age of this node were
within 210 Myr of the lower bound (with soft bounds). It is worth noting that the
estimates for this node were likely considerably affected by the estimated age of its
immediate ancestral node on our tree. The latter represents the basal divergence in the red
algae (Figure 2.1, node f) and was calibrated using the fossil Bangiomorpha pubescens
(Butterfield 2000) as a lower bound at 1174 Ma. (Note that while these fossils resemble
some Bangiales (Butterfield 2000), here I have treated it as if it were a stem multicellular
red algal lineage, following Parfrey et al. 2011). The effect of this fossil is clear when
comparing hard and soft bounds: all the hard bound estimates were within 85 Myr of the

38
minimum calibration, with small confidence intervals constrained by this calibration.
However, the soft bound analyses yielded dramatically younger estimates: LogN + C60
returned an age of 690 Ma, which is 484 Myr younger that the minimum bound set by the
fossil; the Bangiomorpha fossils seem at odds with other calibrations in my analyses, and
seem to be much older than any of the dates estimated from molecular clock data. This
discrepancy can, in theory, be explained in a number of ways. For example, either the
identification of Bangiomorpha fossils as red algae, or the estimated age of the rocks in
which they are found, could be in error (although the latter is thought to be unlikely, see
discussion in Parfrey et al. (2011) and Knoll et al. (2006)). The discrepancy may also be a
result of the stochastic nature of the fossil record. The amount of time between the
divergence between the two lineages, and the first recognizable fossil of either of the
lineages (i.e.: the fossil used as a minimum bound for that node) is unknown, and could
be relatively small or very large. It is possible that many of the fossils used to calibrate
minimum bounds in my analyses are significantly younger than the node of interest,
because no organism happened to be fossilized, no relevant fossils have been found, or
fossils that have been found are not recognizable as belonging to that lineage. By chance
Bangiomorpha fossilized relatively soon after the divergence of Bangiales/
Florideophyceae from other red alga, and its similarity to extant Bangiales allowed it to
be classified as a stem multicellular red alga. If this is the case, the older nodes suggested
in my hard bound analyses are more accurate, while soft bound estimates underestimate
the age of nodes due to the poor fossil record. Alternatively, the changes in the rates of
evolution within some lineages, including this one, might be poorly captured by the
currently available RMC models.
While my estimates of the most recent common ancestor of Bangiales/
Florideophyceae red algae are quite variable (~550 – 720 Ma, with credible intervals
spanning up to 500 Myr), they are relatively consistent with those obtained by Berney
and Pawlowski (2006) (~700 Ma), and by Parfrey and colleagues (2011) (~620 Ma) when
the latter excluded all Proterozoic fossil constraints (including Bangiomorpha). However,
Parfrey and colleagues’ estimates for this node were much older (~820 Ma) when
Proterozoic fossils were included. The basal split between Cyanidiales and the
Bangiales/Florideophyceae clade showed much greater differences. My estimates vary
39
greatly (by up to 500 Myr, with credible intervals even more extreme) depending on the
model and style of constraints (Figure 2.3b) and similar degrees of variation in age
estimates for this node were found by Parfrey and colleagues (2011) depending on the
inclusion/exclusion of Proterozoic fossils constraints. Berney and Pawlowski estimated
younger ages (680 – 950 Ma), which were similar to the lower ranges I obtained (e.g.,
639 – 771 Ma for LogN+C60) and Parfrey and colleagues (625 – 959 Ma without
Proterozoic fossils). The sensitivity of estimates associated with this and the previously
discussed node seems to be largely correlated with how ‘strongly’ the Bangiomorpha
dates are imposed on it as a constraint. The weaker the constraint (soft bounds in our
analysis or removal of the calibration by Parfrey and colleagues), the younger the age
estimate for this node.
2.4.6 Relative Ages of Multicellular Groups
According to my analysis, it appears that the Metazoa and Fungi are the oldest
groups, with similar age estimates around 700 – 800 Ma when restricted to soft bound
analyses (Figure 2.4). The credible intervals on the age of Metazoa are smaller than those
for Fungi presumably because this node, as well as many of its descendant nodes, is well
constrained by fossil data. It is worth noticing the relatively small difference (~300 – 600
Myr, depending on the RMC model used) between these two nodes and the age estimates
for LECA (~1,000 and ~1,350 Ma). This suggests that the first multicellular organisms
emerged relatively rapidly after LECA. The Bangiales/Florideophyceae split is estimated
to be the next oldest group in soft bound analyses at ~550 – 720 Ma (hard bound analyses
yielded substantially older ages because of the fossil Bangiomorpha, as discussed above).
Stomatophyte age estimates somewhat younger (430 – 450 Ma) and overlapped with the
dictyostelids, which appear to be the youngest multicellular group I considered here
(~330 Ma). It should be noted that all of the age estimates (with the exception of the
Stomatophyta) are associated with large 95% credible intervals spanning hundreds of
millions of years. Thus, despite the large size of my data set, considerable uncertainty in
the age estimates persists.

40
Figure 2.4 Age of the LECA compared to multicellular eukaryotic groups. All estimates were
calculated with the LG substitution model and soft bounds. Results are shown for the UGam (triangles),
LogN (diamonds), and CIR (crosses) relaxed molecular clock models. Error bars indicate 95% credible
intervals. For each nodes with calibration, the error bar above ‘Cal’ shows the age range used to calibrate
the node. Where upper bound is not shown, it was equal to 3000 Ma. M: Metazoa; F: Fungi; D:
Dictyostelids; S: Stomatophyta; B: Bangiales/Florideophyceae
It is important to keep in mind that the dates shown on Figure 2.4 represent age
estimates for the most recent common ancestor of each multicellular group, which,
without doubt, was not the first multicellular organism in this lineage. The time of first
emergence of multicellularity for the lineages I have discussed can be bracketed by
considering not only the age of the most recent common ancestor of the group, but also
the date of divergence of this lineage from its closest unicellular relative (as I discussed
for embryophytes and red algae in the previous section). These bracketed age estimate
ranges are given in Table 1; only UGam results are shown as they encompass the range of
estimates given by the other two models. Note that the precision of these ‘brackets’ on
the age of the emergence of multicellularity depends critically on the taxonomic sampling
of the groups. Sparse sampling of the closest unicellular relatives of groups, or the
presence of long stem lineages, will artificially inflate the age ranges.
0
200
400
600
800
1000
1200
1400
1600
Cal
Ugam
LogN
CIR
Cal
Ugam
LogN
CIR
Cal
Ugam
LogN
CIR
Cal
Ugam
LogN
CIR
Cal
Ugam
LogN
CIR
Cal
Ugam
LogN
CIR
Root M F D S B
Ag
e o
f N
od
e (
Ma)

41
Table 2.2: Limits on the age of emergence of multicellularity in different eukaryotic
groups. Lower Limit represents the date of the most recent common ancestor of all
sampled members of the multicellular group. The Upper Limit column refers to one node
deeper on the rooted tree, i.e., the date of divergence of the group from its most closely
related unicellular organism (in parentheses is the node letter(s) from Figure 2.1, where
there are two, the second letter represents the upper limit). 95% credible intervals are
indicated within the parentheses. Analyses shown were performed using soft bounds, an
LG substitution matrix and the UGam relaxed clock model.
Lower Limit (Ma) Upper Limit (Ma)
Metazoa (a) 748 (663 - 865) 872 (758 - 1024)
Fungi (b) 752 (573 - 977) 927 (738 - 1145)
Dictyostelids (c) 348 (212 - 601) 793 (542 - 1062)
Embryophytes (e, d) 574 (522 - 604) 852 (654 - 1067)
Bangiales/Florideophyceae (g, f) 721 (494 - 964) 996 (801 - 1186)
2.5 Conclusions
Here I highlighted some of the progress and difficulties in estimating the age
multicellular eukaryotic lineages using sophisticated ‘relaxed molecular clock’ (RMC)
methods. Such estimates are critical if we are to understand how these major evolutionary
transitions are correlated with major geological events, such as the oxygen rise in the
atmosphere and oceans, or the ‘snowball Earth’ glaciation periods in the Cryogenian. In
fact, the association between the origins of animals and oxygen has long been discussed
(Lenton et al. 2014, Knoll and Sperling 2014). While the emergence of Metazoa is in
broad synchrony with an increase in atmospheric oxygen and the Sturtian glaciation
period (~670 – 730 Ma), determining which of these events happened first is not a simple
task. It was long thought that a rise in atmospheric oxygen concentrations led to the
oxygenation of the ocean, and thus triggered metazoan evolution. The alternative
hypothesis would be that the Ediacaran oxygen transition was a consequence rather than
cause of animal diversification: surface oceans of dense bacterial populations would have
been consumed by filter-feeding animals, while fecal pellets from planktonic bilaterians
would have been rapidly sinking from the surface, lessening the oxygen demand(Lenton
et al. 2014). To further complicate this issue, there is no evidence for a significant rise in
atmospheric or oceanic oxygen levels before the Cryogenian glaciations (including the

42
Sturtian and Marinoan (~635 – 650 Ma) “Snowball Earth” events), and it was thought
that these glaciations posed a major barrier to the survival of eukaryotic life. Yet, the
fossil record indicates that numerous eukaryote lineages continued through the
glaciations. In fact, my results (and those of others I discuss) postulate that the last
common ancestor of metazoans and Fungi existed ~700 – 800 Ma, possibly before the
Cryogenian glaciations. Indeed, it has been argued that sponges were present during, and
perhaps, even before these glaciations (Love et al. 2009). If confirmed, this would
suggest that the origins of the first metazoans could not have occurred as a response to
increasing ocean oxygenation.
This example emphasizes the importance of being able to pinpoint precisely the
timing of the origin of multicellular lineages and correlate them with respect to the
ancient geochemical record. However, my results clearly show that the obtained
molecular dating estimates depend heavily on the models and methods used, and on the
nature and treatment of fossil calibrations. This, combined with the significant
uncertainty associated with most of the age estimates (often spanning many hundreds of
millions of years) suggests that my conclusions remain quite tentative. Hopefully, as
further investigations fill out the Proterozoic fossil record associated with protistan
eukaryotes, more genomic data is gathered from diverse eukaryote lineages and
improvements are made in relaxed molecular clock modeling and methods, we will
obtain more precise estimates of the ages of multicellular groups.
2.6 Acknowledgements
Computations were partially performed on the supercomputers at the SciNet HPC
Consortium. SciNet is funded by the Canada Foundation for Innovation under the
auspices of Compute Canada; the Government of Ontario; Ontario Research Fund -
Research Excellence; and the University of Toronto (Loken et al. 2010).
43
Chapter 3: Integrins and the Evolution of Animal Multicellularity
This chapter contains work published in Brown MW, Sharpe SC, Silberman JD, Heiss
AA, Lang BF, Simpson AGB, Roger AJ (2013) Phylogenomics demonstrates that
breviate flagellates are related to opisthokonts and apusomonads. Proceedings of the
Royal Society B: Biological Sciences 1769: 20131755 doi: 10.1098/rspb.2013.1755
3.1 Introduction
The evolution of cell adhesion was an important step in the transition from
unicellular organisms to multicellular organism, including animals. New cell adhesion
genes present in multicellular groups encode adhesion proteins, or change cell
division/cell wall formation so that cells remain attached after division (Bonner 2000,
Knoll 2011). Animals have specialized adhesion proteins, which are different from
adhesion strategies found in other multicellular groups (Abedin and King 2010). One
important class of animal cell adhesion proteins are the integrins: heterodimeric
transmembrane receptors involved in cell signaling and adhesion to the extracellular
matrix (Hynes 2002).
Early research on cell adhesion in vertebrates identified areas near the cell
membrane where fibrils of actin end together as a bundle, near points of contact between
the cell and the extracellular matrix (ECM) (Horwitz 2012). The molecule that connected
the outside ECM to the internal cytoskeleton remained unknown until 1986, with the
isolation of a cDNA clone which was sequenced for structural analysis (Tamkun et al.
1986). The protein contained a relatively large N-terminal segment outside the cell
(including three cysteine rich repeats), a transmembrane region, and a short cytoplasmic
region. This protein was termed ‘integrin’ for its integral role in connecting cells to
extracellular matrix (Tamkun et al. 1986). The discovery of this β subunit was followed
by the characterization of the α subunit, and soon a number of integrins were recognized
as a group of homologous cell receptors involved in cell adhesion, migration, thrombosis
and immune system function (Hynes 1987).

44
Structural studies of integrins (reviewed in Ginsberg (2014) and Fu et al. (2012))
show that both the α and β subunit have the general structure of a globular head domain,
a long stalk region, a single short transmembrane region and a short cytoplasmic tail.
Despite the superficial similarities in their structures, the two subunits are not observably
homologous, and differ in their domain compositions. In integrin β (ITB), the head
domain is made up of a von-Willebrand Factor A domain (Whittaker and Hynes 2002)
and the stalk is made up of 3 - 4 repeating EGF units, a domain held together by
disulphide bonds, some of which are formed by a conserved cysteine-rich motif. The
intracellular portion contains two NPXY motifs, which can be phosphorylated to
modulate interactions with other proteins (Anthis and Campbell 2011). ITB4 is an
exception: it has intracellular Calx-β domains which interact with intermediate filaments
instead of actin. Integrin α (ITA) has a head region made up of a seven-bladed β propeller
domain, each containing an FG-GAP motif. The stalk is made up of a thigh domain and
two calf domains, separated by a flexible knee region that is important for integrin
conformational regulation (Fu et al. 2012). The integrin ligand-binding site is formed at
the interface between the α and β subunits, and generally binds extracellular matrix
proteins, although some integrins have been co-opted for cell-to-cell communication in
the immune system (Humphries et al. 2006). Mammals have 18 α subunits and 8 β
subunits which combine to form 24 distinct pairs, with various functions in immune
response, cell adhesion, and cell signaling (Hynes 2002).
Integrins can exist in two conformations: a low-affinity conformation where the
stalk region is bent, causing the ligand-binding site to point towards the cell membrane,
and an active conformation where the stalks are straight, exposing the ligand-binding site
(Zhu et al. 2008, Xiong et al. 2002, Vicente-Manzanares et al. 2009). This
conformational change can be triggered by talin, which binds to the cytoplasmic region of
integrin β, or by ligand binding. As a result, integrins are important to both outside-in and
inside-out cell signaling (Anthis and Campbell 2011). Binding of integrins to the ECM
results in upregulation of proliferation genes, and both kinds of signaling may be
modulated by mechanical stress (Dufort et al. 2011).
Integrins act in cell migration or adhesion by connecting to the actin cytoskeleton
through a number of scaffolding proteins (Anthis and Campbell 2011, Vicente-

45
Manzanares et al. 2009). Talin binds the ITB cytoplasmic region with an N-terminal
FERM domain, while the rod shaped C-terminal region contains several places where α-
actinin, an actin-binding protein, can bind. ILK (integrin linked-kinase), PINCH and
paxillin make up the IPP complex, which serves as a scaffold for protein-protein
interaction and modulates signaling. Focal adhesion kinase (FAK) and c-Src (a proto-
oncogene and kinase) are involved in downstream signaling, promoting proliferation
when cells are bound to the ECM. Disruption of any of the genes that associate with them
can lead to many diseases, in particular cancer (Winograd-Katz et al. 2014).
Cell migration is important for development and immune system response, two
important functions of multicellular organisms. Integrins provide a stable connection to
the ECM that is necessary for cells to be able to move along it (Vicente-Manzanares et al.
2009). As the leading edge of the cell protrudes, new focal adhesions form when integrins
bind the ECM. Actin polymerization farther forward then pushes the edge of the cell
forward. At the trailing edge of the cell, focal adhesions disassemble, releasing the cell
and allowing it to move forward. Scaffolding proteins (for example, talin) work as a
molecular clutch to transfer traction from the integrins to movement powered by actin
polymerization.
Integrins are not present in other multicellular groups such as plants and fungi.
Choanoflagellates, the closest unicellular relative to metazoans, do not have integrins
either, which initially led to the assumption that integrins were metazoan specific.
Recently, integrins have been discovered in the holozoan Capsaspora owczarzaki and the
apusomonad Thecamonas trahens (Sebe-Pedros et al. 2010, Sebé-Pedrós and Ruiz-Trillo
2010). These findings suggest that integrins evolved not during the origin of metazoa, but
earlier, nearer to the divergence of Amoebozoa and other Unikonts, with a secondary loss
in Fungi (Figure 3.1). The function of integrins in protists is currently unknown, but
could be related to motility or predation. The relationship between Fungi and Animals,
which together form the Opisthokonts, has long been known (Wainright et al. 1993) but
more recently many newly discovered or misplaced unicellular organisms have been
included in this group (Mendoza et al. 2002). Elucidation of the phylogenetic
relationships within this group is ongoing (Torruella et al. 2015), and these organisms can

46
be valuable for determining the genetic changes necessary for the transition to a
multicellular lifestyle.
The Breviatea are an anaerobic protistan group recently found to be more closely
related to Opisthokonts than to the other supergroups. The discovery and transcriptome
sequencing of the breviate Pygsuia biforma provided enough data to confidently assign
the breviates to a position sister to the Opisthokonts + Apusomonad clade (Brown et al.
2013). Pygsuia biforma is an anaerobe which lives as two distinct cell types: swimming
cells and adherent cells. During logarithmic growth in culture, swimming cells with two
long flagella predominate, while in older cultures adherent cells with one long flagellum
and one short flagellum are more common. The adherent cell crawls along the surface
using many filose pseudopodia, which can extend behind it leaving a long trail (Brown et
al. 2013).
The newly discovered position of breviates as a sister lineage to the Opisthokonta
prompted a search in the transcriptome of Pygsuia biforma for integrins and related
proteins. I discovered homologs of an integrin α and an integrin β subunit, both with
conserved motifs required for the functions of metazoan integrins. Pygsuia also expresses
ILK, PINCH, paxillin, talin and α-actinin (Figure 3.1). To aid further work on elucidating
the functions of these proteins in protists, I obtained and tested antibodies against the
head domains of Pygsuia integrin α and β, the cytoplasmic region of integrin β, and the
FERM domain of talin.
3.2 Methods
3.2.1 Homology Searches
Bilaterian integrin-mediated adhesion complex genes were obtained from the
Homologene database (http://www.ncbi.nlm.nih.gov/homologene/). Sequences from each
Homologene group were aligned in MAFFT using the LINS-i option (Katoh and Toh
2008) Hidden Markov Model (HMM) profiles were created from the alignments using
HMMbuild of HMMER 3.0 (http://hmmer.org/). A six frame translation of the Pygsuia
biforma transcriptome and protein datasets from genomes of non-bilaterian animals and
other representative eukaryotes were searched for homologs using HMMsearch with a
full sequence threshold of 1e-5 (see (Brown et al. 2013) for details on transcriptome

47
culture conditions, library preparation, sequencing and assembly). Domains of the
HMMsearch hits were identified using the HMMpfam and SMART databases of
InterProScan (Zdobnov and Apweiler 2001). The putative homologs found by
HMMSEARCH were then screened using a reciprocal Basic Local Alignment Search Tool
(BLAST) technique; BLASTP of the putative ortholog against the National Center for
Biotechnology Information (NCBI)’s non-redundant protein database. Criteria for
homologs of each protein were then established: for some proteins, domain architecture
with minimal changes (e.g. possibly a domain missing, or different numbers of repetitive
domains) was used as an inclusion criterion; for others, domain architecture was
considered uninformative, but blast confirmed similarity to the protein of interest. HMM
searches for particular diagnostic domains (e.g: SH2 [PFAM PF00017] for SRC and
Focal_AT [PFAM PF03623] for FAK) were also performed on the transcriptome and
proteomes.
3.2.2 Pygsuia biforma cDNA Preparation
Pygsuia biforma was grown in a 250 mL tissue culture flask previously seeded with
Klebsiella pneumoniae in Sonneborn’s Paramecium medium (ATCC medium 802) made
with filtered autoclaved sea water for five days with limited headspace, and then
collected by centrifugation. 10 mL of TRIzol® (Life Technologies) was added, and the
mixture was incubated for 15 minutes at 4°C. 2 mL of chloroform was added and the
organic and aqueous layers were separated by centrifugation at 3220 g in an Eppendorf
5810R centrifuge for 75 minutes at 4°C. The aqueous layer was collected, and 5 mL of
isopropanol was added. The sample was centrifuged at 3220 g for 45 min 4°C, and the
supernatant was discarded. The pellet was washed with 75% ethanol, centrifuged for 10
minutes at 3220 g (4°C) and dried for 15 minutes at room temperature. The pellet was
then resuspended in nuclease-free water and a portion was resolved by agarose gel
electrophoresis to assess quality. The remaining RNA was precipitated with NaCl in
ethanol and stored at -80°C. Eukaryotic mRNA was selected from the total RNA sample
using the Poly A Purist MAG kit (Ambion Inc, TX), and reverse transcribed using the
SMART MMLV reverse transcriptase (Clontech Laboratories, Inc.) using poly
deoxythymidine as a primer.

48
3.2.3 Pygsuia Whole Cell Lysates
Pygsuia was grown in 15 mL conical flasks seeded with a clump of Klebsiella
pneumoniae and filled with culture medium (see above) with less than 1 mL of headspace.
Cultures were grown for 15 days and then centrifuged at 400 g and 4°C for 20 minutes,
and all but four mL of media was removed. This sample was then centrifuged for 10
minutes at 800 g and for another 10 minutes at 3220 g. All supernatant was removed, and
approximately 100 μL of 10 mM phosphate buffered saline (PBS) was added. Cells were
mechanically disrupted by syringing, and the whole cell lysate was tested for antibody
reactivity along with the recombinant protein samples, described below.
3.2.4 Expression of Recombinant Protein
DNA encoding Pygsuia integrin complex protein domains was amplified from
Pygsuia biforma cDNA (for ITB, both cytoplasmic and ‘head’ domains) or synthesized
by GeneArt (Life Technologies – for talin (FERM domain) and ITA (head domain)). TA
cloning was used to insert PCR products and synthesized DNA into the pGEM–T Easy
vector, and restriction enzymes were used to insert the protein-coding DNA into
expression plasmids. pET-16b (Novagen) was used for expression of ITB head, ITA head,
and talin FERM domains, while the cytoplasmic region of ITB was expressed in pET-32
a + (Novagen), which expresses the insert as a thioredoxin fusion protein. Proteins were
expressed in BL21(λDE3) (ITB cyto, ITA head), BL21(λDE3) pLys (ITB head) or C43
(talin FERM) cells, with induction by 1 mM isopropyl β-D-1-thiogalactopyranoside
(IPTG). Cells were mechanically disrupted by syringing, and sodium dodecyl sulphate-
polyacrylamide gel electrophoresis (SDS-PAGE) analysis of the whole cell lysate with
Coomassie staining confirmed the expression of protein. For the cytoplasmic region of
ITB, His-tagged recombinant protein was purified using Clontech’s TALON® Metal
Affinity Resin.
3.2.5 Antibody Testing on Recombinant Protein
Polyclonal rabbit antibodies were raised against peptides from Pygsuia ITA head
domain, ITB cytoplasmic region, ITB head domain and talin FERM domain by GenScript
Inc. (USA). For each target protein, immunogenic peptides that were 13 amino acids in
length were identified by GenScript, and one from each domain of interest was chosen

49
based on its degree of sequence conservation with protist homologues (i.e. highly
conserved peptides were selected, Table 3.1).
Table 3.1 Peptides used to raise antibodies. Cysteines (C) in bold were conjugated to
the peptide to aid in antibody production, and are not present in the Pygsuia sequence.
Protein Domain Position Peptide
ITB cytoplasmic 1776 CNALYEGNTQADGSQ
ITB head 117 VLEDLSGSFGDDLRC
ITA head 555 SSIPSEIPGPSTSSC
Talin FERM 86 KIRPLRLKLSDETTC
His-purified recombinant protein or whole cell lysates of E. coli expressing
recombinant protein were tested for antibody reactivity by western blotting. After
separation by SDS-PAGE, samples were transferred to a polyvinylidene difluoride
(PVDF) membrane using BioRad’s Turboblot semi-dry blotting system. Membranes were
blocked using 5% skim milk powder in Tris buffered saline (TBS) containing 0.1%
Tween 20 (TBS-T), and then incubated with primary antibody in 5% milk in TBS-T
overnight at 4°C (1:500 for ITA head antibody, 1:10,000 for other antibodies). After
washes in TBS-T, blots were incubated with 1:50,000 horseradish peroxidase (HRP)-
conjugated anti-rabbit IgG secondary antibody (Sigma) for one hour at room temperature.
After further washes with TBS-T, blots were developed with electrochemiluminescence
(ECL) reagents (Amersham), and photographed using a FluorChem E imaging system
(Protein Simple). When whole cell lysates were used, cells transformed with an empty
expression plasmid were used as negative controls.
3.3 Results
Pygusia biforma expresses a complement of integrin mediated adhesion proteins
similar to that of the apusomonad Thecamonas trahens (Fig 3.1). An α integrin, a β
integrin, and many of the associated scaffolding proteins were identified in the
transcriptome data. As in Thecamonas trahens, neither FAK nor c-Src were present,

50
Figure 3.1: Distribution of integrin adhesion machinery in eukaryotes. The integrins and related
proteins in Pygsuia biforma and Sphaeroforma arctica (red boxes) were discovered in my analysis,
although the presence of integrins in Sphaeroforma has been previously acknowledged (Sebé-Pedrós and
Ruiz-Trillo 2010). Numbers indicate number of integrin subunits, filled circles indicate presence of the
gene and empty circles indicate putative or degenerate homologs. Adapted from Sebe-Pedros et al. 2010
consistent with classifying these proteins as holozoan innovations. An ITB and associated
integrin scaffolding and signaling proteins were also found in the icthyosporean
Sphaeroforma arctica, but no ITA was found, so it is unclear how its integrin receptor
would function. While these proteins were recognizable homologs to the integrin-
mediated adhesion machinery in animals, they did show some interesting differences in
domain composition (Figures 3.2, 3.3, 3.4).
Pygsuia biforma has one integrin α and one integrin β. Both subunits are
significantly longer than their animal homologs. In each case, the expansion comes from
the stalk region of the protein. Animal β integrins contain three to four EGF, while
Capsaspora has four to seven, and Thecamonas has seven. The Sphaeroforma arctica
ITB is of a similar length to the ITBs of these organisms, with three EGF repeats. The
ITB stalk is much longer in Pygsuia biforma, which has 29 EGF repeats (Figure 3.3), as
well as 27 repeats of the CXCXXCXC motif, which in model system homologs form
disulphide bonds to maintain the structure of the domain (Table 3.2). The stalk region of

51
Figure 3.2 Domain architectures of protistan integrin β proteins. SP, signal peptide (SIGNALP-
NN(euk)); TM, transmembrane domain; ITB head, integrin b chain (PF00362); EGF, epidermal growth
factor; extracellular (IPR013111); BT, integrin-B tail (PF07965); BC, integrin-B cytoplasmic region
(PF08725). Vertical purple lines represent cysteine-rich repeats (CxCxxCxC) (PS00243). The numbers of
EGF and CxCxxCxC repeats are indicated. Adapted from Brown et al. 2013.
CxCxxCxC (3)
EGF
SP ITB head BCBCBT
27
29
SP
SP
7
6
BC
ITB head
ITB head
BC
TM
TM
TM
Homo sapiens 801 AA
Pygsuia biforma 1803AA
Thecamonas trahens 1056AA 5
3
SP BCITB head
Sphaeroforma arctica 1141AA
6
4
SP BCITB head
Capsaspora owczarzaki CAOG-5058 1056 AA
9
5
SP BCITB head
Capsaspora owczarzaki CAOG-01283 1064 AA
7
7
SP BCITB head
Capsaspora owczarzaki CAOG-2005 1189 AA
3
4
SP ITB head
Capsaspora owczarzaki CAOG-4086 854 AA
TM
TM
TM
TM
TM

52
Figure 3.3 Domain architectures of protistan integrin α proteins. SP: signal peptide; ITA head; FG:
FG-GAP repeats; TM: transmembrane region. ITA head, integrin a, b-propeller (IPR013519); FG, FG-gap
(PS51470); ITA leg, integrin a-2 (IPR013649); TM, transmembrane domain. Adapted from Brown et al.
2013.
FG
FG
FG
FG
FG
FG
FGSP
ITA head
Thecamonas trahens 2119AA
Concanavalin
TM
FG
FG
FG
FG
FG
FGSP
ITA head
Pygsuia biforma 3316AA
FG
FG
FG
FG
FG
FG
FGSP
ITA head
ITA leg
ITA head
Homo sapiens ITA1 1179AA
FG
FG
FG
FG
FG
FG
FGSP
ITA head
ITA leg
ITA head
Homo sapiens ITA5 1049AA
vWA TM
TM
FG
FG
FG
FG
FGSP
ITA head
Capsaspora owczarzaki CAOG-01284 1677 AAF
G
FG
FG
FGSP
ITA head
Capsaspora owczarzaki CAOG-02006 1922 AA
FG
FG
FG
FG
SP
ITA head
Capsaspora owczarzaki CAOG-04087 1569 AA
FG
FG
FG
FG
SP
ITA head
Capsaspora owczarzaki CAOG-05089 1721 AA
Hemopexin/matrixin
Fibronectin
TM
TM
TM
TM
TM

53
ITA is even more dramatically extended, resulting in a protein that is three times as long
as its metazoan orthologs (Figure 3.2). Animal ITAs contain an ITA leg domain (integrin
a-2 - IPR013649), which has been well studied for its effects on the conformational
regulation of integrins (Xiong et al. 2001, Luo et al. 2007). This domain is not present in
previously described protistan integrins (Sebe-Pedros et al. 2010), or the ITAs described
here. It is therefore unclear whether protistan integrins have the same kinds of regulatory
properties.
Figure 3.4 Domain architectures of protistan talins. Homo sapiens talin-2 (GENBANK NP_055874.2,
which is typical of metazoan talins), and Thecamonas trahens (updated verison of the talin ortholog noted
in Sebé-Pedrós et al. 2010, from Broad Institute locus AMSG_12193.2). Abbreviations: FERM (Pfam:
PF09379) (FERM N), PF00373 (FERM M), PF02174 (I = IRS)) TM= Talin middle (Pfam: PF09141), VBS
= Vinculin binding site (Pfam: PF08913), I/LWEQ (actin binding domain, Pfam: PF01608), P= Paired
amphipathic helix repeat (Pfam: PF02671), H= Histone deacetylase interacting (Pfam: PF08295), V= Villin
headpiece (Pfam: PF02209) Adapted from Brown et al. 2013.
Functional motifs are conserved in the ITBs of Pygsuia and Sphaeroforma (Table
3.2). The metal ion-dependent adhesion site (MIDAS) is perfectly conserved in both
protists, while the ligand-associated metal binding site (LIMBS) and adjacent to MIDAS

54
(AMIDAS) sites are recognizable with only one amino acid change. In animal integrins
MIDAS coordinates a divalent cation with an oxygen from the aspartate (D) of the RGD
motif in the ligand (Xiong et al. 2002), while the AMIDAS site binds another divalent
cation nearby. LIMBS coordinates a divalent cation when ligand is bound, stabilizing the
area of the protein that interacts with the ligand (Luo et al. 2007). The conservation of
these sites in Pygsuia and Sphaeroforma as well as in Thecamonas and Capasaspora
(Sebe-Pedros et al. 2010) suggests that protist integrins may bind ligands in a manner
similar to that of animal integrins, perhaps ones containing an RGD motif. The presence
of an NPXY motif in the cytoplasmic region of the ITBs found in Pygsuia and
Sphaeroforma suggests that interactions between the integrin receptor and other proteins
such as talin may be conserved between animals and protists.
Table 3.2 Conserved motifs in integrin β
Metazoa
Sphaeroforma
arctica
Pygsuia
biforma
Ion binding motifs Amino acid (AA) Position AA Position
MIDAS D D 119 D 120
metal ion-
dependent
adhesion site
S S 121 S 122
S S 123 S 124
E E 232 E 213
D D 260 D 241
AMIDAS S S 123 S 124
adjacent to
MIDAS
D D 126 D 127
D D 127 D 128
D D 260 D 241
A S 389 V 322
LIMBS D/E D 167 D 167
ligand-associated
metal binding site N N 227 G 208
D D 229 D 210
P P 231 P 212
E E 232 E 213
Repeated motifs Number of repeats
CXCXXCXC 3-4 5 27
NPXY 1-2 1 1

55
Many cytoplasmic integrin–related scaffolding and signaling proteins are
expressed in Pygsuia biforma. Homologs of the scaffolding proteins PINCH, paxillin,
talin and α-actinin were present, as well as integrin linked kinase (ILK). FAK and c-Src
were not present, as in Thecamonas trahens (Sebe-Pedros et al. 2010), suggesting that
these are holozoan-specific proteins. More surprising is the apparent absence of the actin
binding proteins vinculin and parvin. Consistent with the lack of a vinculin homolog in
its RNAseq data, Pygsuia’s homolog of talin lacks a vinculin-binding domain (Figure
3.4), which is present in metazoan and other protist talins.
Figure 3.5 Antibodies raised against peptides are reactive to Pygsuia proteins expressed in E. coli. Left: Coomassie stained membranes, Right: western blots; chemiluminescent signal corresponding to
antibody binding appears white, while red shows the outline of the membrane. L: ladder; +: whole cell
lysates of E. coli expressing Pygsuia recombinant protein (except for panel a – here recombinant protein
was isolated from whole cell lysates by affinity purification using the added His-tag), - : whole cell lysates
from E. coli with empty plasmid, P: Pygsuia whole cell lysates.

56
Antibodies were raised against peptides from Pygsuia integrin α (head domain),
integrin β (head domain and cytoplasmic region) and talin (FERM domain) (Table 3.1).
All four antibodies were reactive against recombinant protein constructs expressed in E.
coli (Fig 3.5), with little cross-reaction observed with other proteins. ITB cytoplasmic
region was purified using the His-tag on the recombinant protein, producing a relatively
pure band of recombinant protein in the positive control lane (Fig 3.5 a). For the other
three protein domains the chemiluminescent signal corresponds to the one band present in
the positive control lane, but not the negative control (expression with empty plasmid)
lane (Fig 3.5 b – d). For reasons yet unclear (see Discussion), tests of both the ITB head
and Talin FERM domain antibodies by western blots of whole cell lysates of Pygsuia
cultures showed no detectable signal (Fig 3.5 b and d, right-most lane).
3.4 Discussion
The discovery of integrins and related proteins in Pygsuia biforma is evidence for
an earlier emergence of the integrin mediated adhesion complex (IMAC) than previously
thought (Sebe-Pedros et al. 2010) (Fig. 3.1). With the results presented here, one can
recreate a more complete history of the evolution of the IMAC through eukaryotic
evolution. α-actinin is ubiquitous within eukaryotes as an actin binding protein (Fig. 3.1).
PINCH, paxillin and talin are amorphean proteins, as they are present in both Amoebozoa
and Obazoa. In Dictyostelium, an aggregative multicellular organism, talin has been
shown to interact with non-integrin cell adhesion proteins (Cornillon et al. 2008). Integrin
α, integrin β and ILK are obazoan innovations, as confirmed by the description of IMAC
proteins in Pygsuia. Pygsuia lost both vinculin and the vinculin binding site in talin,
which are both present in many other amorpheans. Parvin is an innovation of the
Apusomonads + Opisthokonts. Within the opisthokonts, IMAC proteins were reduced in
Fungi, and enriched in Holozoa. No Fungi have integrin α or integrin β, but the presence
of associated signalling proteins in basal fungi (Spizellomyces, Batrachochytrium and
Allomyces; Fig 3.1) suggests a gradual loss of IMAC proteins in this lineage. Holozoa
enriched the complement of IMAC proteins by adding the kinases FAK and c-Src, as
well as by increasing the numbers of integrin subunits (four integrin αs and four integrin
βs in Capsaspora, and up to eighteen integrin αs and eight integrin βs in mammals). The
57
IMAC is an obazoan innovation that has acquired particular importance in Metazoa for
its role cell adhesion.
In animals, integrins bind proteins in the extracellular matrix (ECM). As Pygsuia is
a unicellular organism, it is unclear what its integrins are binding. The same was true of
Capsaspora until the discovery of a multicellular aggregative stage in that organism’s life
cycle (Sebé-Pedrós et al. 2013b). Aggregation and the secretion of an ECM was observed,
after which cells became cysts. Upregulation of integrins, integrin-associated proteins,
tyrosine kinases and a laminin G domain containing protein were observed during
aggregation. A currently unobserved multicellular life cycle stage of Pygsuia could
explain the presence of integrins. Alternatively, integrins may function in interactions
between Pygsuia cells during sexual reproduction, where the integrin ligand is part of a
surface protein on another cell.
Another possibility for the function of integrins is motility. Animal cells use
dynamic integrin binding to attach to and move across the ECM (Vicente-Manzanares et
al. 2009). Thus Pygsuia integrins could bind substrate, creating the connection between
the environment and the actin cytoskeleton that is needed to push the cell forward.
Adherent Pygsuia cells move by extruding multiple filose pseudopodia, which remain
attached to the substrate and move along the ventral side of the cell in a conveyor belt
fashion (Brown et al. 2013) (this is similar to movement seen in another breviate,
Breviata anathema (Heiss et al. 2013)). The connections to the substrate observed in
moving Pygsuia may be mediated by integrins.
Another alternative is that Pygsuia uses integrins to interact with its bacterial prey.
Pathogens, both bacteria and viruses (Hussein et al. 2015), exploit animal integrins by
using them to adhere to host cells, or to induce phagocytosis. For example, the first steps
of Yersinia infection of host cells involves adhesion with the aid of a protein that binds to
integrins with a higher affinity than does fibronectin (Mikula et al. 2012). Mutualistic
integrin-mediated interactions between bacteria and Pygsuia are also possible.
Interactions between prokaryotes and protists that benefit both organisms have been
observed, for example in the associations of nitrogen-fixing bacteria with protists (Kneip
et al. 2007). Integrins could facilitate such interactions by adhering to bacteria, keeping
them in place on the surface of Pygsuia as symbionts.

58
Localization of integrins and related proteins within Pygsuia cells could distinguish
among these possible functions. I have obtained antibodies for four domains of three
proteins important to the function of integrin-mediated adhesion in animals, and shown
that they are reactive in western blots of recombinant protein. The antibodies did not
react with Pygsuia whole cell lysates, likely because of low density of Pygsuia, although
it is also possible that these proteins are not expressed under the culture conditions. As
Pygsuia feeds on bacteria, and bacteria greatly outnumber Pygsuia in culture, there is
much more bacterial protein compared to protistan protein in whole cell lysate, and large
culture volumes may be necessary to obtain a positive western signal. The peptides used
to raise the ITB and talin antibodies are similar to the corresponding regions in
Thecamonas and Capsaspora orthologs of these proteins, so the antibodies I developed
may be useful for elucidated the function of integrins in these organisms.
3.5 Conclusion
Pygsuia biforma, a newly described breviate, expresses both subunits of the animal
cell adhesion receptor integrin. It also expresses several proteins (ILK, paxillin, talin and
α-actinin) that in animals are associated with integrins and help make the connections
between the ECM outside the cell and the actin cytoskeleton within the cell. The
functions of these proteins in Pygsuia and other protists remain unknown, but could be
related to motility, predation or other interactions with bacteria, or with a sexual stage of
the life cycle. As tools to study these proteins further, I designed antibodies to cross-react
with conserved peptides from the head domains of Pygsuia ITA and ITB, the cytoplasmic
region of ITB, and the FERM domain of talin. Polyclonal affinity-purified antibodies
were raised against these peptides and confirmed to be reactive with recombinant proteins
in western blots. In summary, I show that integrins evolved earlier than previously
thought, and that the newly described breviate Pygsuia biforma may provide insights into
the genetic toolkit related to animal multicellularity.

59
Chapter 4: Final Conclusion
There are many independent origins of multicellularity in eukaryotes. Multicellular
organisms can form by aggregation of cells or through division of cells that subsequently
stick together; such multicellular forms account for the majority of the macroscopic
biosphere. As transitions to multicellularity in many groups occurred millions of years
ago, the steps involved in these transitions are difficult to study. However, comparisons
between various multicellular groups, and between multicellular organisms and their
unicellular relatives, help us understand how, when and why multicellularity evolved.
The evolutionary transition from unicellular to multicellular has been replicated in
several experiments (Boraas et al. 1998, Ratcliff et al. 2012, Ratcliff et al. 2013),
demonstrating that selection pressures such as predation can precipitate the transition.
Multicellularity involves a switch of the level of selection, meaning that evolutionarily
favoured traits might benefit the organism at the expense of the individual cell (Grosberg
and Strathmann 2007). To form a successful multicellular organism cells must adhere to
and communicate with one another. Using comparative genomics, one can identify the
necessary genetic changes that result from the aforementioned selection pressures to gain
an understanding of the mechanisms underpinning unicell-to-multicell transitions.
Reconstructing the evolutionary transitions from unicells to multicells requires
knowledge of the relationships between extant unicellular and multicellular organisms.
Comparisons that are made without consideration of the organismal relationships
(phylogeny) can often be misleading. For example, studies that compare model animal
systems to unicellular yeast (e.g. Nam et al. (2015), Zaidel-Bar (2009)), are comparing a
multicell to a unicell that secondarily evolved from a multicellular lineage (Fungi), and
underwent many changes to adapt to a saprotrophic lifestyle. While these comparisons
benefit from the large amount of data available from model systems, they suffer from the
lack of consideration of unicellular amorpheans, in particular unicellular holozoans,
which are more closely related to animals than is yeast. As demonstrated by the discovery
of integrins in Pygsuia and other protists, some aspects of animal cell biology may be
more similar to those of organisms outside Opisthokonta than those of the more closely
related Fungi. Increased study of protistan opisthokonts (e.g. choanoflagellates,

60
filasterians, ichyosporeans, apusomonads and breviates) has transformed how we think of
animal origins. Genes that control metazoan-specific processes, such as the development
of metazoan body plans, have now been found in unicellular organisms, changing how
we understand the genetic transition from unicellularity to multicellularity.
While relationships between multicellular groups (and within eukaryotes as a
whole) are becoming better resolved (Parfrey et al. 2010, Brown et al. 2012a, Burki et al.
2007), the time in geological history when each group diverged from its unicellular sister
taxa is less clear. As fossils are rare for any species, and in particular for unicellular
organisms, there are few fossils that can be used to calibrate ancient nodes in molecular
clock analyses. Relaxed molecular clock methods seek to answer these questions by
using paleontological evidence to calibrate points on phylogenetic trees, and providing
estimates of ages on the remainder of nodes on the tree based on fitted models of
evolutionary rate change over time. It is not clear which of these models of rate evolution
are the most accurate, so a large range of dates can be estimated for any particular
divergence. Some of this uncertainty could be remedied with more data (new fossil
calibrations and more sequence data from under-sampled lineages), but the inherent
uncertainty in fossil dates and the complexity of modeling the variation of evolutionary
rates over time means that most age estimates will continue to be associated with
relatively large uncertainty.
While each eukaryotic multicellular group is unique, and offers its own interesting
biological questions, there is much to be gained from comparisons between distantly
related organisms. Comparisons between groups that evolved multicellularity
independently help pinpoint commonalities in the conditions that led to the emergence of
multicellularity. Conversely, they illustrate the contingencies present in evolution, as
each multicellular group has its own unique features. Estimates of the timing of the
emergence of various multicellular groups add to our understanding of eukaryotic
relationships, allowing correlations of the presence of particular types of organisms with
other geological data, which provides a better understanding of ancient ecologies.
Comparisons between multicellular groups and their unicellular relatives allow the
investigation of how cells adapt to survive as a part of a larger individual, and what
original features were co-opted from the unicellular life to facilitate the multicellular

61
lifestyle. By understanding the relationships between multicellular groups and their
unicellular relatives, one is able to piece together the history of the transition from
unicellularity to multicellularity, revealing the mechanics of an important step in the
evolution of life on Earth.

62
References
Abedin M, King N (2010) Diverse evolutionary paths to cell adhesion. Trends in Cell
Biology 20(12):734-742 doi:10.1016/j.tcb.2010.08.002
Adl SM, Simpson AGB, Heiss A, et al. Smirnov A (2012) The revised classification of
eukaryotes. Journal of Eukaryotic Microbiology 59(5):429-493 doi:10.1111/j.1550-
7408.2012.00644.x
Aktipis CA, Boddy AM, Jansen G, Hibner U, Hochberg ME, Maley CC, Wilkinson GS
(2015) Cancer across the tree of life: cooperation and cheating in multicellularity.
Philosophical Transactions of the Royal Society B: Biological Sciences
370(1673):20140219 doi:10.1098/rstb.2014.0219
Anthis NJ, Campbell ID (2011) The tail of integrin activation. Trends in Biochemical
Sciences 36(4):191-198 doi:10.1016/j.tibs.2010.11.002
Baldauf SL, Roger AJ, Wenk-Siefert I, Doolittle WF (2000) A kingdom-level phylogeny
of eukaryotes based on combined protein data. Science 290(5493):972-977
doi:10.1126/science.290.5493.972
Beakes GW, Glockling SL, Sekimoto S (2012) The evolutionary phylogeny of the
oomycete “fungi”. Protoplasma 249(1):3-19 doi:10.1007/s00709-011-0269-2
Becker B, Marin B (2009) Streptophyte algae and the origin of embryophytes. Annals
of Botany 103(7):999-1004 doi:10.1093/aob/mcp044
Benton MJ, Donoghue PC (2007) Paleontological evidence to date the tree of life.
Molecular Biology and Evolution 24(1):26-53
Berbee ML, Taylor JW (2010) Dating the molecular clock in fungi – how close are
we? Fungal Biology Reviews 24(1-2):1-16 doi:10.1016/j.fbr.2010.03.001
Berney C, Pawlowski J (2006) A molecular time-scale for eukaryote evolution
recalibrated with the continuous microfossil record. Proceedings of the Royal Society
B: Biological Sciences 273(1596):1867-1872 doi:10.1098/rspb.2006.3537
Bonner JT (1998) The origins of multicellularity. Integrative Biology: Issues, News,
and Reviews 1(1):27-36 doi:10.1002/(SICI)1520-6602(1998)1:1<27::AID-
INBI4>3.0.CO;2-6
Bonner JT (2000) First signals: the evolution of multicellular development. Princeton
University Press, Princeton, N.J.
63
Bonner JT (2009) The social amoebae: the biology of cellular slime molds. Princeton
University Press, Princeton, N.J.
Bonner JT (2006) Why size matters: from bacteria to blue whales. Princeton
University Press, Princeton, N.J.
Boraas ME, Seale DB, Boxhorn JE (1998) Phagotrophy by a flagellate selects for
colonial prey: A possible origin of multicellularity. Evolutionary Ecology 12(2):153-
164 doi:10.1023/A:1006527528063
Bown P (1998) Calcareous nannofossil biostratigraphy. Chapman and Hall; Kluwer
Academic,
Brown MW, Kolisko M, Silberman JD, Roger AJ (2012a) Aggregative multicellularity
evolved independently in the eukaryotic supergroup Rhizaria. Current Biology
22(12):1123-7 doi:10.1016/j.cub.2012.04.021
Brown MW, Silberman JD (2013) The non-dictyostelid sorocarpic amoebae. In:
Romeralo M, Baldauf S, Escalante R (eds) Dictyostelids. Springer, pp 219-242
doi:10.1007/978-3-642-38487-5_12
Brown MW, Spiegel FW, Silberman JD (2009) Phylogeny of the "forgotten" cellular
slime mold, Fonticula alba, reveals a key evolutionary branch within Opisthokonta.
Molecular Biology and Evolution 26(12):2699-2709 doi:10.1093/molbev/msp185
Brown MW, Silberman JD, Spiegel FW (2011) "Slime Molds" among the Tubulinea
(Amoebozoa): molecular systematics and taxonomy of Copromyxa. Protist 162:277-
287 doi:10.1016/j.protis.2010.09.003
Brown MW, Sharpe SC, Silberman JD, Heiss AA, Lang BF, Simpson AGB, Roger AJ
(2013) Phylogenomics demonstrates that breviate flagellates are related to
opisthokonts and apusomonads. Proceedings of the Royal Society B: Biological
Sciences 280(1769):20131755 doi:10.1098/rspb.2013.1755
Brown MW, Silberman JD, Spiegel FW (2012b) A contemporary evaluation of the
acrasids (Acrasidae, Heterolobosea, Excavata). European Journal of Protistology
48(2):103-123 doi:10.1016/j.ejop.2011.10.001
Burki F, Okamoto N, Pombert JF, Keeling PJ (2012) The evolutionary history of
haptophytes and cryptophytes: phylogenomic evidence for separate origins.
Proceedings of the Royal Society B: Biological Sciences doi:10.1098/rspb.2011.2301
Burki F, Shalchian-Tabrizi K, Minge M, Skjæveland Å, Nikolaev SI, Jakobsen KS,
Pawlowski J, Butler G (2007) Phylogenomics reshuffles the eukaryotic supergroups.
PLoS ONE 2(8):e790 doi:10.1371/journal.pone.0000790
64
Buss LW (1987) The evolution of individuality. Princeton University Press, Princeton,
N.J.
Butterfield NJ, Knoll AH, Swett K (1994) Paleobiology of the Neoproterozoic
Svanbergfjellet Formation, Spitsbergen. Lethaia 27(1):76-76 doi:10.1111/j.1502-
3931.1994.tb01558.x
Butterfield NJ (2000) Bangiomorpha pubescens n. gen., n. sp.: implications for the
evolution of sex, multicellularity, and the Mesoproterozoic/Neoproterozoic radiation
of eukaryotes. Paleobiology 26(3):386-404 doi:10.1666/0094-
8373(2000)026<0386:BPNGNS>2.0.CO;2
Cavalier-Smith T, Chao EE (2010) Phylogeny and evolution of apusomonadida
(protozoa: apusozoa): new genera and species. Protist 161(4):549-576
doi:10.1016/j.protis.2010.04.002
Cavalier-Smith T (2012) Early evolution of eukaryote feeding modes, cell structural
diversity, and classification of the protozoan phyla Loukozoa, Sulcozoa, and
Choanozoa. European Journal of Protistology 49:115-178
doi:10.1016/j.ejop.2012.06.001
Cavalier-Smith T, Chao EE (1996) Molecular phylogeny of the free-living archezoan
Trepomonas agilis and the nature of the first eukaryote. Journal of Molecular
Evolution 43(6):551-562 doi:10.1007/BF02202103
Cavalier-Smith T (2002) The neomuran origin of archaebacteria, the negibacterial
root of the universal tree and bacterial megaclassification. International Journal of
Systematic and Evolutionary Microbiology 52(Pt 1):7-76 doi:10.1099/00207713-52-1-7
Cavalier-Smith T (2005) Economy, speed and size matter: evolutionary forces driving
nuclear genome miniaturization and expansion. Annals of Botany 95(1):147-175
doi:10.1093/aob/mci010
Christensen ST, Leick V, Rasmussen L, Wheatley DN (1997) Signaling in unicellular
eukaryotes. International Review of Cytology 177:181-253 doi:10.1016/S0074-
7696(08)62233-0
Claessen D, Rozen DE, Kuipers OP, Søgaard-Andersen L, van Wezel GP (2014)
Bacterial solutions to multicellularity: a tale of biofilms, filaments and fruiting
bodies. Nature Reviews Microbiology 12(2):115-124 doi:10.1038/nrmicro3178
Clarke JT, Warnock R, Donoghue PC (2011) Establishing a time‐ scale for plant
evolution. New Phytologist 192(1):266-301 doi:10.1111/j.1469-8137.2011.03794.x

65
Cock JM, Sterck L, Rouzé P, et al. Wincker P (2010) The Ectocarpus genome and the
independent evolution of multicellularity in brown algae. Nature 465(7298):617-621
doi:10.1038/nature09016
Cohen PA, Knoll AH, Kodner RB (2009) Large spinose microfossils in Ediacaran
rocks as resting stages of early animals. Proceedings of the National Academy of
Sciences of the USA 106(16):6519-6524 doi:10.1073/pnas.0902322106
Cornillon S, Froquet R, Cosson P (2008) Involvement of Sib proteins in the regulation
of cellular adhesion in Dictyostelium discoideum. Eukaryotic Cell 7(9):1600-1605
doi:10.1128/EC.00155-08
Crane PR, Friis EM, Pedersen KR (1994) The origin and early diversification of
angiosperms. Nature 374(6517):27-33 doi:10.1038/374027a0
Criscuolo A, Gribaldo S (2010) BMGE (Block Mapping and Gathering with
Entropy): a new software for selection of phylogenetic informative regions from
multiple sequence alignments. BMC Evolutionary Biology 10(1) doi:10.1186/1471-
2148-10-210
de Mendoza A, Sebé-Pedrós A, Šestak MS, Matejčić M, Torruella G, Domazet-Lošo T,
Ruiz-Trillo I (2013) Transcription factor evolution in eukaryotes and the assembly of
the regulatory toolkit in multicellular lineages. Proceedings of the National Academy
of Sciences of the USA 110(50):E4858-E4866 doi:10.1073/pnas.1311818110
de Mendoza A, Sebé-Pedrós A, Ruiz-Trillo I (2014) The evolution of the GPCR
signalling system in eukaryotes: modularity, conservation and the transition to
metazoan multicellularity. Genome Biology and Evolution 6(3):606-619
doi:10.1093/gbe/evu038
Dentzien-Dias PC, Poinar G,Jr, de Figueiredo AE, Pacheco AC, Horn BL, Schultz CL
(2013) Tapeworm eggs in a 270 million-year-old shark coprolite. PLoS ONE
8(1):e55007 doi:10.1371/journal.pone.0055007
Derelle R, Lang BF (2012) Rooting the eukaryotic tree with mitochondrial and
bacterial proteins. Molecular Biology and Evolution 29(4):1277-1289
doi:10.1093/molbev/msr295
Dickinson DJ, Nelson WJ, Weis WI (2011) A polarized epithelium organized by β-
and α-catenin predates cadherin and metazoan origins. Science 331(6022):1336-1339
doi:10.1126/science.1199633
Dickinson DJ, Nelson WJ, Weis WI (2012) An epithelial tissue in Dictyostelium
challenges the traditional origin of metazoan multicellularity. BioEssays 34(10):833-
840 doi:10.1002/bies.201100187
66
Dostál O, Prokop J (2009) New fossil insects (Diaphanopterodea: Martynoviidae)
from the Lower Permian of the Boskovice Basin, southern Moravia. Geobios
42(4):495-502 doi:10.1016/j.geobios.2009.01.004
Drummond AJ, Ho SYW, Phillips MJ, Rambaut A (2006) Relaxed Phylogenetics and
Dating with Confidence. PLoS Biology 4(5):e88 doi:10.1371/journal.pbio.0040088
Dufort CC, Paszek MJ, Weaver VM (2011) Balancing forces: Architectural control of
mechanotransduction. Nature Reviews Molecular Cell Biology 12(5):308-319
doi:10.1038/nrm3112
Dykstra MJ, Olive LS (1975) Sorodiplophrys: an unusual Sorocarp-producing protist.
Mycologia 67(4):873-879 doi:10.2307/3758346
Ebersberger I, de Matos Simoes R, Kupczok A, Gube M, Kothe E, Voigt K, von Haeseler
A (2012) A consistent phylogenetic backbone for the fungi. Molecular Biology and
Evolution 29(5):1319-1334 doi:10.1093/molbev/msr285
Eme L, Sharpe SC, Brown MW, Roger AJ (2014) On the age of eukaryotes: evaluating
evidence from fossils and molecular clocks. In: Keeling PJ, Koonin EV (eds) Origin
and evolution of eukaryotes. Cold Spring Harbour Perspectives Biology, Cold Spring
Harbor, New York, USA, pp 165-180 doi:10.1101/cshperspect.a016139
Erwin DH, Laflamme M, Tweedt SM, Sperling EA, Pisani D, Peterson KJ (2011) The
Cambrian conundrum: early divergence and later ecological success in the early
history of animals. Science 334(6059):1091-1097 doi:10.1126/science.1206375
Fairclough SR, Dayel MJ, King N (2010) Multicellular development in a
choanoflagellate. Current Biology 20(20):R875-R876
Fairclough S, Chen Z, Kramer E, et al. King N (2013) Premetazoan genome evolution
and the regulation of cell differentiation in the choanoflagellate Salpingoeca rosetta.
Genome Biology 14:R15 doi:10.1186/gb-2013-14-2-r15
Felsenstein J (2004) Inferring phylogenies. Sinauer Associates, Sunderland, Mass.
Fensome RA, Saldarriaga JF, Taylor MFJR (1999) Dinoflagellate phylogeny revisited:
reconciling morphological and molecular based phylogenies. Grana 38(2-3):66-80
doi:10.1080/00173139908559216
Fiz-Palacios O, Romeralo M, Ahmadzadeh A, Weststrand S, Ahlberg PE, Baldauf S
(2013) Did terrestrial diversification of amoebas (Amoebozoa) occur in synchrony
with land plants? PLoS ONE 8(9):e74374 doi:10.1371/journal.pone.0074374

67
Friis EM, Pedersen KR, Crane PR (2010) Diversity in obscurity: fossil flowers and the
early history of angiosperms. Philosophical Transactions of the Royal Society B:
Biological Sciences 365(1539):369-382 doi:10.1098/rstb.2009.0227
Fu G, Wang W, Luo BH (2012) Overview: structural biology of integrins. Methods in
Molecular Biology 757:81-99 doi:10.1007/978-1-61779-166-6_7
Gebeshuber I, Crawford R (2006) Micromechanics in biogenic hydrated silica: hinges
and interlocking devices in diatoms. Proceedings of the Institution of Mechanical
Engineers, Part J: Journal of Engineering Tribology 220(8):787-796
Ginsberg MH (2014) Integrin activation. BMB Reports 47(12):655-659
doi:10.5483/BMBRep.2014.47.12.241
Golden JW, Yoon H (2003) Heterocyst development in Anabaena. Current Opinion in
Microbiology 6(6):557-563 doi:10.1016/j.mib.2003.10.004
Grau-Bové X, Ruiz-Trillo I, Rodriguez-Pascual F (2015) Origin and evolution of lysyl
oxidases. Scientific Reports 5:10568 doi:10.1038/srep10568
Graur D, Martin W (2004) Reading the entrails of chickens: molecular timescales of
evolution and the illusion of precision. Trends in Genetics 20(2):80-86
doi:10.1016/j.tig.2003.12.003
Gregory T (2001) Coincidence, coevolution, or causation? DNA content, cellsize, and
the C‐ value enigma. Biological Reviews 76(1):65-101 doi:10.1111/j.1469-
185X.2000.tb00059.x
Grosberg RK, Strathmann RR (2007) The Evolution of Multicellularity: A Minor
Major Transition? Annual Review of Ecology, Evolution, and Systematics 38(1):621-
654 doi:10.1146/annurev.ecolsys.36.102403.114735
Hampl V, Hug L, Leigh JW, Dacks JB, Lang BF, Simpson AGB, Roger AJ (2009)
Phylogenomic analyses support the monophyly of Excavata and resolve
relationships among eukaryotic "supergroups". Proceedings of the National Academy
of Sciences of the USA 106(10):3859-3864 doi:10.1073/pnas.0807880106
Harwood DM, Nikolaev VA, Winter DM (2007) Cretaceous records of diatom
evolution, radiation, and expansion. Paleontological Society Papers 13:33
He D, Fiz-Palacios O, Fu C, Fehling J, Tsai C, Baldauf SL (2014) An alternative root
for the eukaryote tree of life. Current Biology 24(4):465-470
doi:10.1016/j.cub.2014.01.036

68
Hedges SB, Blair JE, Venturi ML, Shoe JL (2004) A molecular timescale of eukaryote
evolution and the rise of complex multicellular life. BMC Evolutionary Biology 4:2
doi:10.1186/1471-2148-4-2
Heiss AA, Walker G, Simpson AG (2013) The flagellar apparatus of Breviata
anathema, a eukaryote without a clear supergroup affinity. European Journal of
Protistology 49(3):354-72 doi:10.1016/j.ejop.2013.01.001
Herron M (2009) Many from one: Lessons from the volvocine algae on the evolution
of multicellularity. Communicative & Integrative Biology 2(4):368-370
doi:10.4161/cib.2.4.8611
Ho SYW (2009) An examination of phylogenetic models of substitution rate
variation among lineages. Biology Letters 5(3):421-424 doi:10.1098/rsbl.2008.0729
Ho SY, Phillips MJ (2009) Accounting for calibration uncertainty in phylogenetic
estimation of evolutionary divergence times. Systematic Biology 58(3):367-380
Horwitz AR (2012) The origins of the molecular era of adhesion research. Nature
Reviews Molecular Cell Biology 13:805-811 doi:10.1038/nrm3473
Humphries JD, Byron A, Humphries MJ (2006) Integrin ligands at a glance. Journal of
Cell Science 119(Pt):3901-3 doi:10.1242/jcs.03098
Hussein HA, Walker LR, Abdel-Raouf UM, Desouky SA, Montasser AKM, Akula SM
(2015) Beyond RGD: virus interactions with integrins. Archives of Virology
160(11):2669-2681 doi:10.1007/s00705-015-2579-8
Hynes RO (2009) The extracellular matrix: not just pretty fibrils. Science
326(5957):1216-1219 doi:10.1126/science.1176009
Hynes RO (2002) Integrins: bidirectional, allosteric signaling machines. Cell
110(6):673-87 doi:10.1016/S0092-8674(02)00971-6
Hynes RO (2012) The evolution of metazoan extracellular matrix. Journal of Cell
Biology 196(6):671-679 doi:10.1083/jcb.201109041
Hynes RO (1987) Integrins: a family of cell surface receptors. Cell 48(4):549-554
doi:10.1016/0092-8674(87)90233-9
Inoue J, Yang Z, Donoghue PCJ (2010) The impact of the representation of fossil
calibrations on bayesian estimation of species divergence times. Systematic Biology
59(1):74-89 doi:10.1093/sysbio/syp078

69
James TY, Pelin A, Bonen L, Ahrendt S, Sain D, Corradi N, Stajich JE (2013) Shared
signatures of parasitism and phylogenomics unite cryptomycota and microsporidia.
Current Biology 23(16):1548-1553 doi:10.1016/j.cub.2013.06.057
Jarvis MC, Briggs SPH, Knox JP (2003) Intercellular adhesion and cell separation in
plants. Plant, Cell & Environment 26(7):977-989 doi:10.1046/j.1365-3040.2003.01034.x
Katoh K, Toh H (2008) Recent developments in the MAFFT multiple sequence
alignment program. Briefings in Bioinformatics 9(4):286-298 doi:10.1093/bib/bbn013
Katz LA, Grant JR, Parfrey LW, Burleigh JG (2012) Turning the crown upside down:
gene tree parsimony roots the eukaryotic tree of life. Systematic Biology 61(4):653-
660 doi:10.1093/sysbio/sys026
Keeling PJ, Burger G, Durnford DG, Lang BF, Lee RW, Pearlman RE, Roger AJ, Gray
MW (2005) The tree of eukaryotes. Trends in Ecology & Evolution 20(12):670-676
doi:10.1016/j.tree.2005.09.005
Kenrick P, Crane PR (1997) The origin and early evolution of plants on land. Nature
389(6646):33-39 doi:10.1038/37918
Kim E, Simpson AG, Graham LE (2006) Evolutionary relationships of apusomonads
inferred from taxon-rich analyses of 6 nuclear encoded genes. Molecular Biology and
Evolution 23(12):2455-2466 doi:10.1093/molbev/msl120
King N, Hittinger CT, Carroll SB (2003) Evolution of key cell signaling and adhesion
protein families predates animal origins. Science 301(5631):361-363
doi:10.1126/science.1083853
Kirk DL (2005) A twelve‐ step program for evolving multicellularity and a division
of labor. BioEssays 27(3):299-310 doi:10.1002/bies.20197
Kishino H, Thorne JL, Bruno WJ (2001) Performance of a divergence time estimation
method under a probabilistic model of rate evolution. Molecular Biology and
Evolution 18(3):352-361
Kneip C, Lockhart P, Voss C, Maier UG (2007) Nitrogen fixation in eukaryotes – new
models for symbiosis. BMC Evolutionary Biology 7:55 doi:10.1186/1471-2148-7-55
Knoll AH, Javaux EJ, Hewitt D, Cohen P (2006) Eukaryotic organisms in Proterozoic
oceans. Philosophical Transactions of the Royal Society B: Biological Sciences
361(1470):1023-1038 doi:10.1098/rstb.2006.1843
Knoll AH, Sperling EA (2014) Oxygen and animals in Earth history. Proceedings of
the National Academy of Sciences of the USA 111(11):3907-3908
doi:10.1073/pnas.1401745111
70
Knoll AH (2011) The multiple origins of complex multicellularity. Annual Review of
Earth and Planetary Sciences 39(1):217-239 doi:10.1146/annurev.earth.031208.100209
Kooistra WHCF, Gersonde R, Medlin LK, Mann DG (2007) The Origin and Evolution
of the Diatoms : Their Adaptation to a Planktonic Existence. In: Falkowski PG, Knoll
AH (eds) Evolution of Primary Producers in the Sea. , pp 207-249 doi:10.1016/B978-
012370518-1/50012-6
Koschwanez JH, Foster KR, Murray AW (2011) Sucrose utilization in budding yeast
as a model for the origin of undifferentiated multicellularity. PLoS Biology 9(8):1703
doi:10.1371/journal.pbio.1001122
Langley CH, Fitch WM (1974) An examination of the constancy of the rate of
molecular evolution. Journal of Molecular Evolution 3(3):161-177
doi:10.1007/BF01797451
Lartillot N, Lepage T, Blanquart S (2009) PhyloBayes 3: a Bayesian software package
for phylogenetic reconstruction and molecular dating. Bioinformatics 25(17):2286-
2288 doi:10.1093/bioinformatics/btp368
Le SQ, Gascuel O, Lartillot N (2008) Empirical profile mixture models for
phylogenetic reconstruction. Bioinformatics 24(20):2317-2323
doi:10.1093/bioinformatics/btn445
Le SQ, Gascuel O (2008) An improved general amino acid replacement matrix.
Molecular Biology and Evolution 25(7):1307-1320 doi:10.1093/molbev/msn067
Leliaert F, Smith DR, Moreau H, Herron MD, Verbruggen H, Delwiche CF, De Clerck O
(2012) Phylogeny and molecular evolution of the green algae. Critical Reviews in
Plant Sciences 31(1):1-46 doi:10.1080/07352689.2011.615705
Lenton TM, Boyle RA, Poulton SW, Shields-Zhou GA, Butterfield NJ (2014) Co-
evolution of eukaryotes and ocean oxygenation in the Neoproterozoic era. Nature
Geoscience 7:257-265 doi:10.1038/ngeo2108
Lepage T, Bryant D, Philippe H, Lartillot N (2007) A general comparison of relaxed
molecular clock models. Molecular Biology and Evolution 24(12):2669-2680
doi:10.1093/molbev/msm193
Levinton JS (2008) The Cambrian Explosion: how do we use the evidence. Bioscience
58(9):855-864 doi:10.1641/B580912
Libby E, Ratcliff WC (2014) Ratcheting the evolution of multicellularity. Science
346(6208):426-427 doi:10.1126/science.1262053

71
Loken C, Gruner D, Groer L, et al. Van Zon R (2010) SciNet: lessons learned from
building a power-efficient top-20 system and data centre. Journal of Physics:
Conference Series 256(1) doi:10.1088/1742-6596/256/1/012026
Love GD, Grosjean E, Stalvies C, et al. Summons RE (2009) Fossil steroids record the
appearance of Demospongiae during the Cryogenian period. Nature 457(7230):718-
721 doi:10.1038/nature07673
Luo BH, Carman CV, Springer TA (2007) Structural basis of integrin regulation and
signaling. Annual Review of Immunology 25:619-47
doi:10.1146/annurev.immunol.25.022106.141618
Magallon S, Hilu KW, Quandt D (2013) Land plant evolutionary timeline: gene effects
are secondary to fossil constraints in relaxed clock estimation of age and
substitution rates. American Journal of Botany 100(3):556-573
doi:10.3732/ajb.1200416
Mandoli DF (1998) Elaboration of body plan and phase change during development
of Acetabularia: how is the complex architecture of a giant unicell built? Annual
Review of Plant Physiology and Plant Molecular Biology 49:173-198
doi:10.1146/annurev.arplant.49.1.173
Marshall WL, Celio G, McLaughlin DJ, Berbee ML (2008) Multiple isolations of a
culturable, motile ichthyosporean (Mesomycetozoa, Opisthokonta), Creolimax
fragrantissima n. gen., n. sp., from marine invertebrate digestive tracts. Protist
159(3):415-433 doi:10.1016/j.protis.2008.03.003
Martin MW (2000) Age of Neoproterozoic bilatarian body and trace fossils, White
Sea, Russia: implications for metazoan evolution. Science 288(5467):841-845
doi:10.1126/science.288.5467.841
Maynard Smith J, Szathmary E (1995) The major evolutionary transitions. Nature
374:227-232 doi:10.1038/374227a0
Mendoza L, Taylor JW, Ajello L (2002) The class Mesomycetozoea: a heterogeneous
group of microorganisms at the animal-fungal boundary. Annual Reviews in
Microbiology 56(1):315-344 doi:10.1146/annurev.micro.56.012302.160950
Mikhailov KV, Konstantinova AV, Nikitin MA, et al. Aleoshin VV (2009) The origin of
Metazoa: a transition from temporal to spatial cell differentiation. BioEssays
31(7):758-768 doi:10.1002/bies.200800214
Mikula KM, Kolodziejczyk R, Goldman A (2012) Yersinia infection tools—
characterization of structure and function of adhesins. Frontiers in Cellular and
Infection Microbiology 2(169) doi:10.3389/fcimb.2012.00169

72
Murchison EP, Wedge DC, Alexandrov LB, et al. Stratton MR (2014) Transmissible
dog cancer genome reveals the origin and history of an ancient cell lineage. Science
343(6169):437-440 doi:10.1126/science.1247167
Nam H, Kim I, Bowie JU, Kim S (2015) Metazoans evolved by taking domains from
soluble proteins to expand intercellular communication network. Scientific Reports
5:9576 doi:10.1038/srep09576
Near TJ, Meylan PA, Shaffer HB (2005) Assessing concordance of fossil calibration
points in molecular clock studies: an example using turtles. The American Naturalist
165(2):137-146 doi:10.1086/427734
Near TJ, Sanderson MJ (2004) Assessing the quality of molecular divergence time
estimates by fossil calibrations and fossil-based model selection. Philosophical
Transactions of the Royal Society B: Biological Sciences 359(1450):1477-1483
doi:10.1098/rstb.2004.1523
Nedelcu AM, Driscoll WW, Durand PM, Herron MD, Rashidi A (2011) On the
paradigm of altruistic suicide in the unicellular world. Evolution 65(1):3-20
doi:10.1111/j.1558-5646.2010.01103.x
Nowak MD (2013) A simple method for estimating informative node age priors for
the fossil calibration of molecular divergence time analyses. PLoS ONE 8(6):e66245
doi:10.1371/journal.pone.0066245
Olive L, Blanton R (1980) Aerial sorocarp development by the aggregative ciliate,
Sorogena stoianovitchae. Journal of Eukaryotic Microbiology 27(3):293-299
doi:10.1111/j.1550-7408.1980.tb04260.x
Parfrey LW, Katz LA, Grant J, Tekle YI, Lasek-Nesselquist E, Morrison HG, Sogin ML,
Patterson DJ (2010) Broadly sampled multigene analyses yield a well-resolved
eukaryotic tree of life. Systematic Biology 59(5):518-533 doi:10.1093/sysbio/syq037
Parfrey LW, Lahr DJG, Katz LA, Knoll AH (2011) Estimating the timing of early
eukaryotic diversification with multigene molecular clocks. Proceedings of the
National Academy of Sciences of the USA 108(33):13624-13629
doi:10.1073/pnas.1110633108
Parfrey LW, Lahr DJG (2013) Multicellularity arose several times in the evolution of
eukaryotes (Response to DOI 10.1002/bies.201100187). BioEssays 35(1)
doi:10.1002/bies.201200143
Parham JF, Donoghue PC, Bell CJ, et al. Benton MJ (2012) Best practices for justifying
fossil calibrations. Systematic Biology 61(2):346-359 doi:10.1093/sysbio/syr107

73
Peterson KJ, Butterfield NJ (2005) Origin of the Eumetazoa: testing ecological
predictions of molecular clocks against the Proterozoic fossil record. Proceedings of
the National Academy of Sciences of the USA 102(27):9547-9552
doi:10.1073/pnas.0503660102
Porter SM, Meisterfeld R, Knoll AH (2003) Vase-shaped microfossils from the
Neoproterozoic Chuar Group, Grand Canyon: a classification guided by modern
testate amoebae. Journal of Paleontology 77(3):409-429 doi:10.1666/0022-
3360(2003)077<0409:VMFTNC>2.0.CO;2
Rannala B (2002) Identifiability of parameters in MCMC Bayesian inference of
phylogeny. Systematic Biology 51(5):754-760 doi:10.1080/10635150290102429
Ratcliff WC, Herron MD, Howell K, Pentz JT, Rosenzweig F, Travisano M (2013)
Experimental evolution of an alternating uni-and multicellular life cycle in
Chlamydomonas reinhardtii. Nature Communications 4:2742 doi:10.1038/ncomms3742
Ratcliff WC, Denison RF, Borrello M, Travisano M (2012) Experimental evolution of
multicellularity. Proceedings of the National Academy of Sciences of the USA
109(5):1595-1600 doi:10.1073/pnas.1115323109
Richards GS, Degnan BM (2009) The dawn of developmental signaling in the
metazoa. Cold Spring Harbor Symposia on Quantitative Biology 74:81-90
doi:10.1101/sqb.2009.74.028
Richards TA, Cavalier-Smith T (2005) Myosin domain evolution and the primary
divergence of eukaryotes. Nature 436(7054):1113-1118 doi:10.1038/nature03949
Roger AJ, Hug LA (2006) The origin and diversification of eukaryotes: problems
with molecular phylogenetics and molecular clock estimation. Philosophical
Transactions of the Royal Society B: Biological Sciences 361(1470):1039-1054
doi:10.1098/rstb.2006.1845
Roger AJ (1999) Reconstructing early events in eukaryotic evolution. The American
Naturalist 154(S4):S146-S163 doi:10.1086/303290
Roger AJ, Simpson AGB (2009) Evolution: revisiting the root of the eukaryote tree.
Current Biology 19(4):R165-R167 doi:10.1016/j.cub.2008.12.032
Rokas A (2008) The origins of multicellularity and the early history of the genetic
toolkit for animal development. Annual Review of Genetics 42:235-251
doi:10.1146/annurev.genet.42.110807.091513
Rossetti V, Schirrmeister BE, Bernasconi MV, Bagheri HC (2010) The evolutionary
path to terminal differentiation and division of labor in cyanobacteria. Journal of
Theoretical Biology 262(1):23-34 doi:10.1016/j.jtbi.2009.09.009

74
Rossetti V, Bagheri HC (2015) Multicellular life cycles as an emergent property in
filamentous bacteria. In: Evolutionary Transitions to Multicellular Life. Springer, pp
189-199 doi:10.1007/978-94-017-9642-2_10
Rubinstein CV, Gerrienne P, de la Puente GS, Astini RA, Steemans P (2010) Early
Middle Ordovician evidence for land plants in Argentina (eastern Gondwana). The
New Phytologist 188(2):365-369 doi:10.1111/j.1469-8137.2010.03433.x
Sanderson MJ (1997) A nonparametric approach to estimating divergence times in
the absence of rate constancy. Molecular Biology and Evolution 14(12):1218-1231
Sanderson MJ (2002) Estimating absolute rates of molecular evolution and
divergence times: a penalized likelihood approach. Molecular Biology and Evolution
19(1):101-109
Sanderson MJ (2003) r8s: inferring absolute rates of molecular evolution and
divergence times in the absence of a molecular clock. Bioinformatics 19(2):301-302
doi:10.1093/bioinformatics/19.2.301
Saucedo LJ, Edgar BA (2002) Why size matters: altering cell size. Current Opinion in
Genetics & Development 12(5):565-571 doi:10.1016/S0959-437X(02)00341-6
Saunders GW, Hommersand MH (2004) Assessing red algal supraordinal diversity
and taxonomy in the context of contemporary systematic data. American Journal of
Botany 91(10):1494-1507 doi:10.3732/ajb.91.10.1494
Schilde C, Schaap P (2013) The Amoebozoa. In: Eichinger L, Rivero F (eds)
Dictyostelium discoideum Protocols. Methods in Molecular Biology, vol 983. Springer,
pp 1-15 doi:10.1007/978-1-62703-302-2_1
Sebé-Pedrós A, Ruiz-Trillo I (2010) Integrin-mediated adhesion complex: cooption of
signaling systems at the dawn of Metazoa. Communicative & Integrative Biology
3(5):475-7 doi:10.4161/cib.3.5.12603
Sebe-Pedros A, Ruiz-Trillo I, Roger AJ, Lang FB, King N (2010) Ancient origin of the
integrin-mediated adhesion and signaling machinery. Proceedings of the National
Academy of Sciences of the USA 107(22):10142-10147 doi:10.1073/pnas.1002257107
Sebé-Pedrós A, Zheng Y, Ruiz-Trillo I, Pan D (2012) Premetazoan origin of the Hippo
signaling pathway. Cell Reports 1(1):13-20 doi:10.1016/j.celrep.2011.11.004
Sebé-Pedrós A, Ariza-Cosano A, Weirauch MT, Leininger S, Yang A, Torruella G,
Adamski M, Adamska M, Hughes TR, Gómez-Skarmeta JL (2013a) Early evolution of
the T-box transcription factor family. Proceedings of the National Academy of
Sciences of the USA 110(40):16050-16055 doi:10.1073/pnas.1309748110

75
Sebé-Pedrós A, Irimia M, del Campo J, Parra-Acero H, Russ C, Nusbaum C, Blencowe
BJ, Ruiz-Trillo I (2013b) Regulated aggregative multicellularity in a close unicellular
relative of metazoa. eLife 2:e01287 doi:10.7554/eLife.01287
Sharpe SC, Eme L, Brown MW, Roger AJ (2015) Timing the origins of multicellular
eukaryotes through phylogenomics and relaxed molecular clock analyses. In: Ruiz-
Trillo I, Nedelcu AM (eds) Evolutionary Transitions to Multicellular Life. Springer, pp 3-
29 doi:10.1007/978-94-017-9642-2_1
Shaul S, Graur D (2002) Playing chicken (Gallus gallus): methodological
inconsistencies of molecular divergence date estimates due to secondary calibration
points. Gene 300(1-2):59-61 doi:10.1016/S0378-1119(02)00851-X
Shu D, Luo H, Conway Morris S, Zhang X, Hu S, Chen L, Han J, Zhu M, Li Y, Chen L
(1999) Lower Cambrian vertebrates from south China. Nature 402(6757):42-46
doi:10.1038/46965
Simpson AG, Inagaki Y, Roger AJ (2006) Comprehensive multigene phylogenies of
excavate protists reveal the evolutionary positions of “primitive” eukaryotes.
Molecular Biology and Evolution 23(3):615-625 doi:10.1093/molbev/msj068
Simpson AG (2003) Cytoskeletal organization, phylogenetic affinities and
systematics in the contentious taxon Excavata (Eukaryota). International Journal of
Systematic and Evolutionary Microbiology 53(6):1759-1777 doi:10.1099/ijs.0.02578-0
Smithson TR, Rolfe WDI (1990) Westlothiana gen. nov.: naming the earliest known
reptile. Scottish Journal of Geology 26(2):137-138 doi:10.1144/sjg26020137
Sogin ML, Gunderson JH, Elwood HJ, Alonso RA, Peattie DA (1989) Phylogenetic
meaning of the kingdom concept: an unusual ribosomal RNA from Giardia lamblia.
Science 243(4887):75-77 doi:10.1126/science.2911720
Stajich JE, Berbee ML, Blackwell M, Hibbett DS, James TY, Spatafora JW, Taylor JW
(2009) The fungi. Current Biology 19(18):R840-5 doi:10.1016/j.cub.2009.07.004
Stamatakis A (2006) RAxML-VI-HPC: maximum likelihood-based phylogenetic
analyses with thousands of taxa and mixed models. Bioinformatics 22(21):2688-2690
Stechmann A, Cavalier-Smith T (2003) The root of the eukaryote tree pinpointed.
Current Biology 13(17):R665-R666 doi:10.1016/S0960-9822(03)00602-X
Summons RE, Walter MR (1990) Molecular fossils and microfossils of prokaryotes
and protists from Proterozoic sediments. American Journal of Science 290-A:212-244
Sun G, Dilcher DL, Wang H, Chen Z (2011) A eudicot from the Early Cretaceous of
China. Nature 471(7340):625-628 doi:10.1038/nature09811

76
Takezaki N, Rzhetsky A, Nei M (1995) Phylogenetic test of the molecular clock and
linearized trees. Molecular Biology and Evolution 12(5):823-833
Takishita K, Chikaraishi Y, Leger MM, Kim E, Yabuki A, Ohkouchi N, Roger AJ (2012)
Lateral transfer of tetrahymanol-synthesizing genes has allowed multiple diverse
eukaryote lineages to independently adapt to environments without oxygen. Biology
direct 7:5-6150-7-5 doi:10.1186/1745-6150-7-5
Tamkun JW, DeSimone DW, Fonda D, Patel RS, Buck C, Horwitz AF, Hynes RO (1986)
Structure of integrin, a glycoprotein involved in the transmembrane linkage
between fibronectin and actin. Cell 46(2):271-282 doi:10.1016/0092-8674(86)90744-0
Taylor JW, Berbee ML (2006) Dating divergences in the fungal tree of life: review
and new analyses. Mycologia 98(6):838-849 doi:10.3852/mycologia.98.6.838
Taylor TN, Hass H, Kerp H (1999) The oldest fossil ascomycetes. Nature
399(6737):648 doi:10.1038/21349
Thomason P, Traynor D, Kay R (1999) Taking the plunge: terminal differentiation in
Dictyostelium. Trends in Genetics 15(1):15-19 doi:10.1016/S0168-9525(98)01635-7
Thorne JL, Kishino H, Painter IS (1998) Estimating the rate of evolution of the rate of
molecular evolution. Molecular Biology and Evolution 15(12):1647-1657
Torruella G, de Mendoza A, Grau-Bové X, Antó M, Chaplin MA, del Campo J, Eme L,
Pérez-Cordón G, Whipps CM, Nichols KM (2015) Phylogenomics reveals convergent
evolution of lifestyles in close relatives of animals and fungi. Current Biology
25(18):2404-2410 doi:10.1016/j.cub.2015.07.053
Tsaousis AD, Leger MM, Stairs CA, Roger AJ (2012) The biochemical adaptations of
mitochondrion-related organelles of parasitic and free-living microbial eukaryotes
to low oxygen environments. In: Altenbach A, Bernhard JM, Seckbach J (eds) Anoxia.
Cellular Origin, Life in Extreme Habitats and Astrobiology, vol 21. Springer, pp 51-81
doi:10.1007/978-94-007-1896-8_4
Vicente-Manzanares M, Choi CK, Horwitz AR (2009) Integrins in cell migration – the
actin connection. Journal of Cell Science 122(Pt):199-206 doi:10.1242/jcs.018564
Vlamakis H, Chai Y, Beauregard P, Losick R, Kolter R (2013) Sticking together:
building a biofilm the Bacillus subtilis way. Nature Reviews Microbiology 11(3):157-
168 doi:10.1038/nrmicro2960
Wainright PO, Hinkle G, Sogin ML, Stickel SK (1993) Monophyletic origins of the
metazoa: an evolutionary link with fungi. Science 260(5106):340-342
doi:10.1126/science.8469985

77
Welch JJ, Bromham L (2005) Molecular dating when rates vary. Trends in Ecology &
Evolution 20(6):320-327 doi:10.1016/j.tree.2005.02.007
Whittaker CA, Hynes RO (2002) Distribution and evolution of von
Willebrand/integrin A domains: widely dispersed domains with roles in cell
adhesion and elsewhere. Molecular Biology of the Cell 13(10):3369-3387
doi:10.1091/mbc.E02-05-0259
Williams F, Tew HA, Paul CE, Adams JC (2014) The predicted secretomes of
Monosiga brevicollis and Capsaspora owczarzaki, close unicellular relatives of
metazoans, reveal new insights into the evolution of the metazoan extracellular
matrix. Matrix Biology 37:60-68 doi:10.1016/j.matbio.2014.02.002
Winograd-Katz SE, Fässler R, Geiger B, Legate KR (2014) The integrin adhesome:
from genes and proteins to human disease. Nature Reviews Molecular Cell Biology
15(4):273-288 doi:10.1038/nrm3769
Xiao S, Knoll AH, Yuan X, Pueschel CM (2004) Phosphatized multicellular algae in
the Neoproterozoic Doushantuo Formation, China, and the early evolution of
florideophyte red algae. American Journal of Botany 91(2):214-227
doi:10.3732/ajb.91.2.214
Xiong JP, Stehle T, Diefenbach B, Zhang R, Dunker R, Scott DL, Joachimiak A,
Goodman SL, Arnaout MA (2001) Crystal structure of the extracellular segment of
integrin αVβ3. Science 294(5541):339-345 doi:10.1126/science.1064535
Xiong JP, Stehle T, Zhang R, Joachimiak A, Frech M, Goodman SL, Arnaout MA (2002)
Crystal structure of the extracellular segment of integrin αVβ3 in complex with an
Arg-Gly-Asp ligand. Science 296(5565):151-155 doi:10.1126/science.1069040
Yang Z, Rannala B (2006) Bayesian estimation of species divergence times under a
molecular clock using multiple fossil calibrations with soft bounds. Molecular
Biology and Evolution 23(1):212-226 doi:10.1093/molbev/msj024
Yang Z (1996) Among-site rate variation and its impact on phylogenetic analyses.
Trends in Ecology & Evolution 11(9):367-372 doi:10.1016/0169-5347(96)10041-0
Yang Z (2006) Computational molecular evolution. Oxford University Press, Oxford;
New York
Yoder AD, Yang Z (2000) Estimation of primate speciation dates using local
molecular clocks. Molecular Biology and Evolution 17(7):1081-1090
Yoon HS, Hackett JD, Ciniglia C, Pinto G, Bhattacharya D (2004) A molecular timeline
for the origin of photosynthetic eukaryotes. Molecular Biology and Evolution
21(5):809-818 doi:10.1093/molbev/msh075

78
Zaidel-Bar R (2009) Evolution of complexity in the integrin adhesome. Journal of Cell
Biology 186(3):317-321 doi:10.1083/jcb.200811067
Zhao S, Burki F, Bråte J, Keeling PJ, Klaveness D, Shalchian-Tabrizi K (2012)
Collodictyon—an ancient lineage in the tree of eukaryotes. Molecular Biology and
Evolution 29(6):1557-1568 doi:10.1093/molbev/mss001
Zhu J, Luo B, Xiao T, Zhang C, Nishida N, Springer TA (2008) Structure of a complete
integrin ectodomain in a physiologic resting state and activation and deactivation by
applied forces. Molecular Cell 32(6):849-861 doi:10.1016/j.molcel.2008.11.018
Zuckerkandl E, Pauling L (1965) Evolutionary divergence and convergence in
proteins. In: Bryson V, Vogel HJ (eds) Evolving genes and proteins: A Symposium (on
Evolving Genes and Proteins), Held at the Institute of Microbiology of Rutgers.
Academic Press, pp 97-166
Zwickl D, Holder M (2004) Model parameterization, prior distributions, and the
general time-reversible model in Bayesian phylogenetics. Systematic Biology
53(6):877-888 doi:10.1080/10635150490522584

79
Appendix A: Copyright Permission (Chapter 2)
SPRINGER LICENSE
TERMS AND CONDITIONS
Oct 08, 2015
This is a License Agreement between Susan C Sharpe ("You") and Springer ("Springer")
provided by Copyright Clearance Center ("CCC"). The license consists of your order details,
the terms and conditions provided by Springer, and the payment terms and conditions.
All payments must be made in full to CCC. For payment instructions, please see
information listed at the bottom of this form.
License Number 3724450855957
License date Oct 08, 2015
Licensed content publisher Springer
Licensed content publication Springer eBook
Licensed content title Timing the Origins of Multicellular Eukaryotes Through
Phylogenomics and Relaxed Molecular Clock Analyses
Licensed content author Susan C. Sharpe*
Licensed content date Jan 1, 2015
Type of Use Thesis/Dissertation
Portion Full text
Number of copies 10
Author of this Springer
article
Yes and you are the sole author of the new work
Order reference number None
Title of your thesis /
dissertation
The protistan origins of multicellularity: timing and evolution of cell
adhesion molecules
Expected completion date Nov 2015
Estimated size(pages) 80
Total 0.00 CAD
Terms and Conditions
Introduction
The publisher for this copyrighted material is Springer Science + Business Media. By
clicking "accept" in connection with completing this licensing transaction, you agree that the
following terms and conditions apply to this transaction (along with the Billing and Payment
terms and conditions established by Copyright Clearance Center, Inc. ("CCC"), at the time
that you opened your Rightslink account and that are available at any time at
http://myaccount.copyright.com).
Limited License
With reference to your request to reprint in your thesis material on which Springer Science
and Business Media control the copyright, permission is granted, free of charge, for the use
RightsLink Printable License https://s100.copyright.com/App/PrintableLicenseFrame.jsp?publis...
1 of 3 15-10-08 8:09 PM

80
indicated in your enquiry.
Licenses are for one-time use only with a maximum distribution equal to the number that
you identified in the licensing process.
This License includes use in an electronic form, provided its password protected or on the
university’s intranet or repository, including UMI (according to the definition at the Sherpa
website: http://www.sherpa.ac.uk/romeo/). For any other electronic use, please contact
Springer at ([email protected] or [email protected]).
The material can only be used for the purpose of defending your thesis limited to
university-use only. If the thesis is going to be published, permission needs to be re-obtained
(selecting "book/textbook" as the type of use).
Although Springer holds copyright to the material and is entitled to negotiate on rights, this
license is only valid, subject to a courtesy information to the author (address is given with
the article/chapter) and provided it concerns original material which does not carry
references to other sources (if material in question appears with credit to another source,
authorization from that source is required as well).
Permission free of charge on this occasion does not prejudice any rights we might have to
charge for reproduction of our copyrighted material in the future.
Altering/Modifying Material: Not Permitted
You may not alter or modify the material in any manner. Abbreviations, additions, deletions
and/or any other alterations shall be made only with prior written authorization of the
author(s) and/or Springer Science + Business Media. (Please contact Springer at
([email protected] or [email protected])
Reservation of Rights
Springer Science + Business Media reserves all rights not specifically granted in the
combination of (i) the license details provided by you and accepted in the course of this
licensing transaction, (ii) these terms and conditions and (iii) CCC's Billing and Payment
terms and conditions.
Copyright Notice:Disclaimer
You must include the following copyright and permission notice in connection with any
reproduction of the licensed material: "Springer and the original publisher /journal title,
volume, year of publication, page, chapter/article title, name(s) of author(s), figure
number(s), original copyright notice) is given to the publication in which the material was
originally published, by adding; with kind permission from Springer Science and Business
Media"
Warranties: None
Example 1: Springer Science + Business Media makes no representations or warranties with
respect to the licensed material.
Example 2: Springer Science + Business Media makes no representations or warranties with
respect to the licensed material and adopts on its own behalf the limitations and disclaimers
established by CCC on its behalf in its Billing and Payment terms and conditions for this
licensing transaction.
Indemnity
You hereby indemnify and agree to hold harmless Springer Science + Business Media and
CCC, and their respective officers, directors, employees and agents, from and against any
and all claims arising out of your use of the licensed material other than as specifically
authorized pursuant to this license.
No Transfer of License
RightsLink Printable License https://s100.copyright.com/App/PrintableLicenseFrame.jsp?publis...
2 of 3 15-10-08 8:09 PM

81
This license is personal to you and may not be sublicensed, assigned, or transferred by you
to any other person without Springer Science + Business Media's written permission.
No Amendment Except in Writing
This license may not be amended except in a writing signed by both parties (or, in the case
of Springer Science + Business Media, by CCC on Springer Science + Business Media's
behalf).
Objection to Contrary Terms
Springer Science + Business Media hereby objects to any terms contained in any purchase
order, acknowledgment, check endorsement or other writing prepared by you, which terms
are inconsistent with these terms and conditions or CCC's Billing and Payment terms and
conditions. These terms and conditions, together with CCC's Billing and Payment terms and
conditions (which are incorporated herein), comprise the entire agreement between you and
Springer Science + Business Media (and CCC) concerning this licensing transaction. In the
event of any conflict between your obligations established by these terms and conditions and
those established by CCC's Billing and Payment terms and conditions, these terms and
conditions shall control.
Jurisdiction
All disputes that may arise in connection with this present License, or the breach thereof,
shall be settled exclusively by arbitration, to be held in The Netherlands, in accordance with
Dutch law, and to be conducted under the Rules of the 'Netherlands Arbitrage Instituut'
(Netherlands Institute of Arbitration).OR:
All disputes that may arise in connection with this present License, or the breach
thereof, shall be settled exclusively by arbitration, to be held in the Federal Republic of
Germany, in accordance with German law.
Other terms and conditions:
v1.3
Questions? [email protected] or +1-855-239-3415 (toll free in the US) or
+1-978-646-2777.
RightsLink Printable License https://s100.copyright.com/App/PrintableLicenseFrame.jsp?publis...
3 of 3 15-10-08 8:09 PM