Embed Size (px)
Citation preview

Risk Based Monitoring (RBM)
Dr. JJ GarcíaDeputy General ManagerPIVOTAL
Tel-Aviv December 2014
Risk Based Monitoring (RBM)
Dr. JJ GarcíaDeputy General ManagerPIVOTAL
Tel-Aviv December 2014

A little of History, the origin
RBM Philosophy and Differences versus Traditional Monitoring
What do you need to implement RBM
123
5
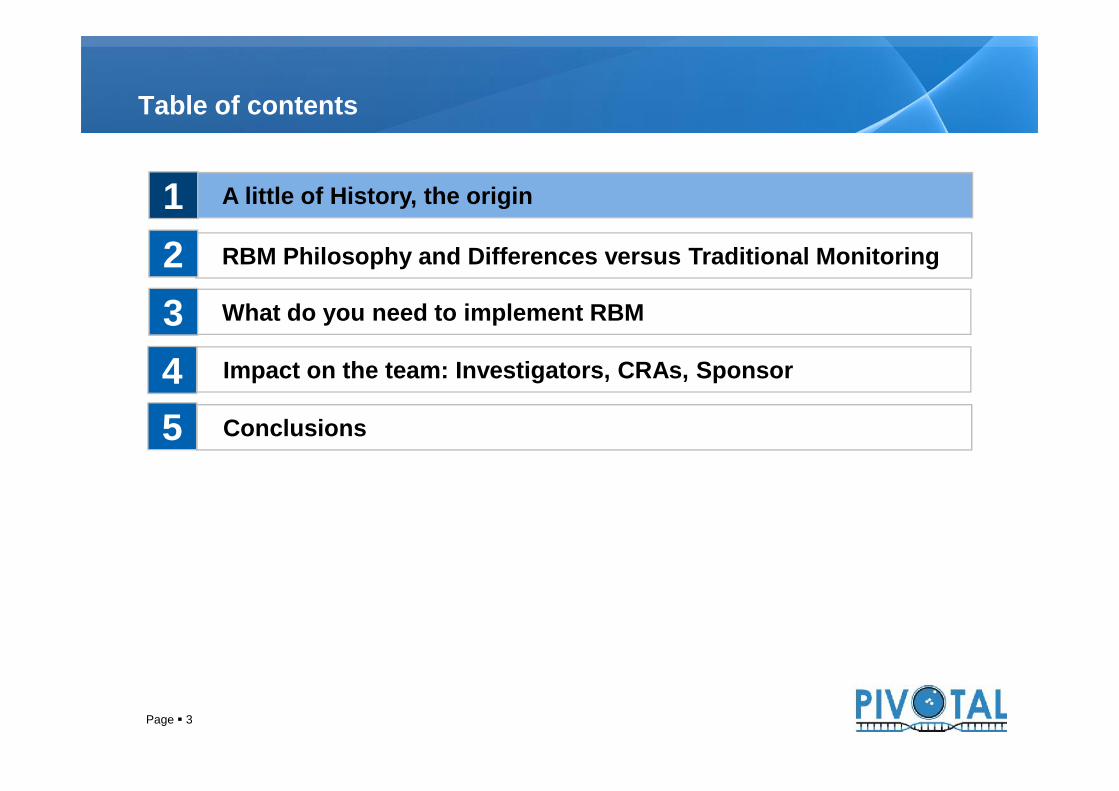
Table of contents
4 Impact on the team: Investigators, CRAs, Sponsor
Conclusions5
Page 2
A little of History, the origin
RBM Philosophy and Differences versus Traditional Monitoring
What do you need to implement RBM
23
5
Table of contents
4 Impact on the team: Investigators, CRAs, Sponsor
1
Conclusions5
Page 3
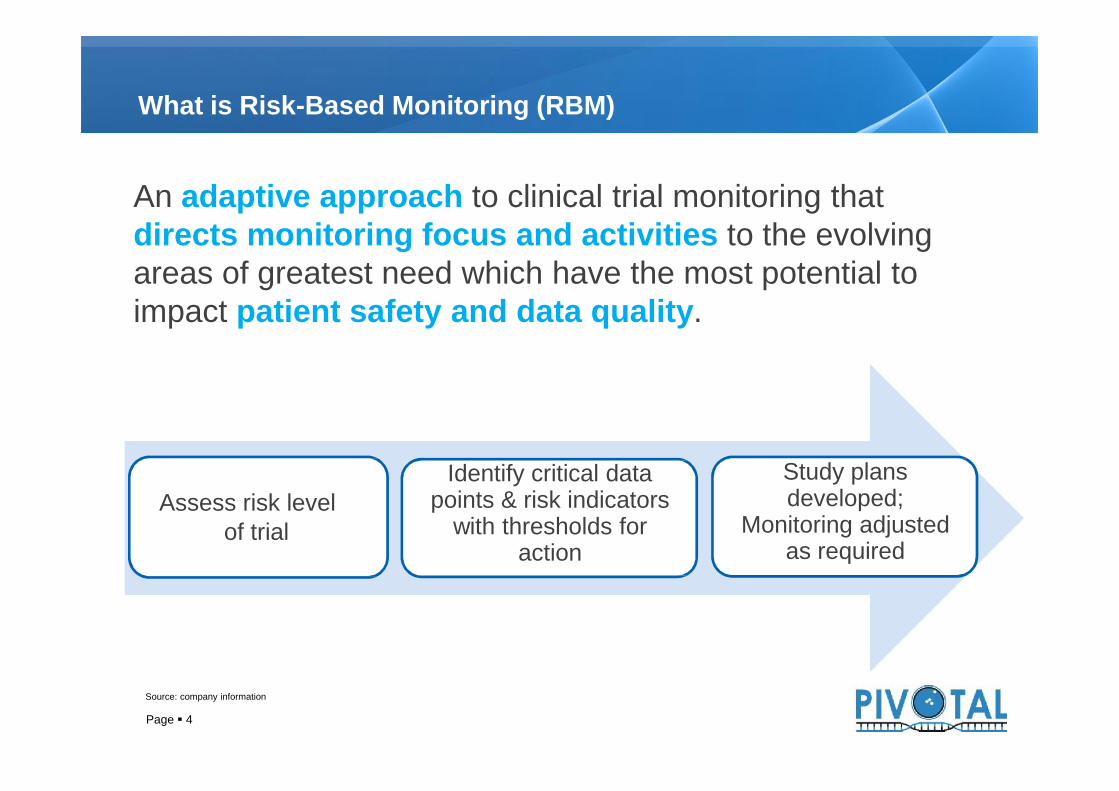
What is Risk-Based Monitoring (RBM)
An adaptive approach to clinical trial monitoring thatdirects monitoring focus and activities to the evolvingareas of greatest need which have the most potential toimpact patient safety and data quality.
Source: company information
Page 4
Assess risk levelof trial
Identify critical datapoints & risk indicators
with thresholds foraction
Study plansdeveloped;
Monitoring adjustedas required
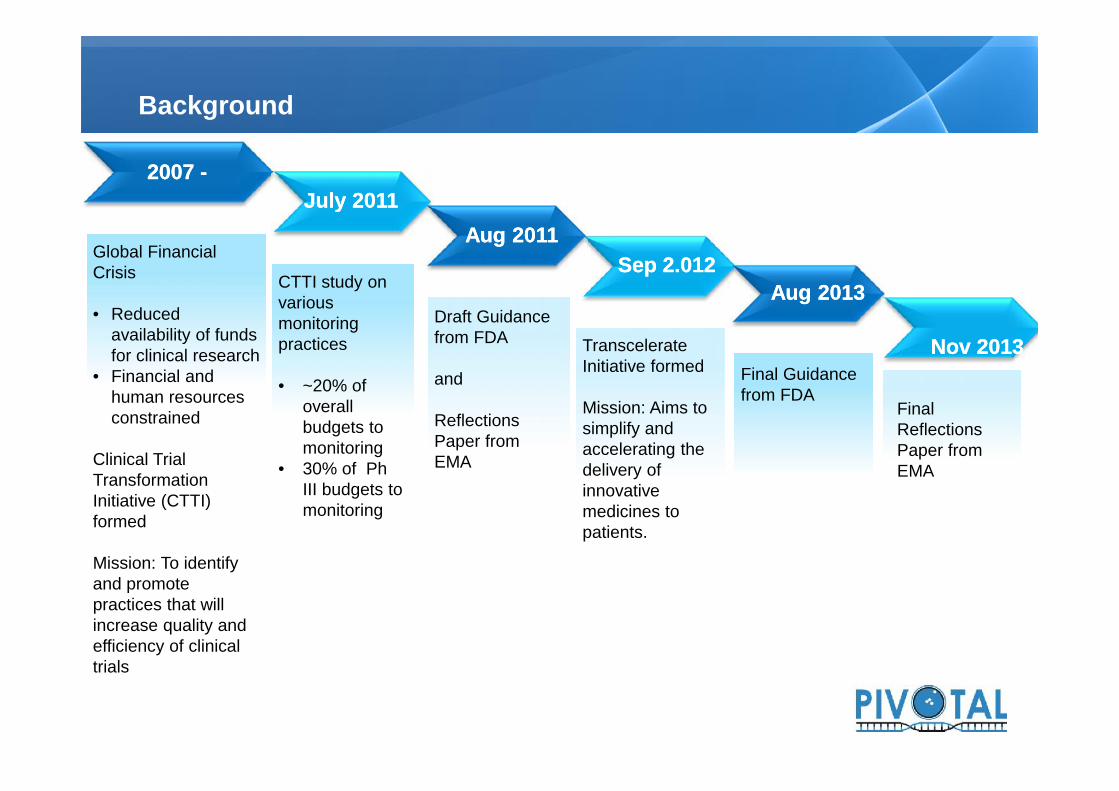
Background
20072007 --
Global FinancialCrisis
• Reducedavailability of fundsfor clinical research
• Financial andhuman resourcesconstrained
Clinical TrialTransformationInitiative (CTTI)formed
Mission: To identifyand promotepractices that willincrease quality andefficiency of clinicaltrials
SepSep 22..012012
TranscelerateInitiative formed
Mission: Aims tosimplify andaccelerating thedelivery ofinnovativemedicines topatients.
CTTI study onvariousmonitoringpractices
• ~20% ofoverallbudgets tomonitoring
• 30% of PhIII budgets tomonitoring
JulyJuly 20112011Aug 2011Aug 2011
Draft Guidancefrom FDA
and
ReflectionsPaper fromEMA
Final Guidancefrom FDA
Aug 2013Aug 2013
NovNov 20132013
FinalReflectionsPaper fromEMA
Global FinancialCrisis
• Reducedavailability of fundsfor clinical research
• Financial andhuman resourcesconstrained
Clinical TrialTransformationInitiative (CTTI)formed
Mission: To identifyand promotepractices that willincrease quality andefficiency of clinicaltrials
TranscelerateInitiative formed
Mission: Aims tosimplify andaccelerating thedelivery ofinnovativemedicines topatients.
CTTI study onvariousmonitoringpractices
• ~20% ofoverallbudgets tomonitoring
• 30% of PhIII budgets tomonitoring
Draft Guidancefrom FDA
and
ReflectionsPaper fromEMA
Final Guidancefrom FDA
FinalReflectionsPaper fromEMA

Do we have only an economical problem?
But despite 100% SDV:
1.- J&J and ICON cited for not identifying suspected fraud in studydrug administration:
• FDA Warning letter October 8, 2009 (1)
• FDA Warning letter November 27, 2009 (2)
2.- Pfizer cited for inadeqate oversight of study drug dosing:• FDA Warning letter April 09, 2010 (3)
Clearly states that…100% source data verification (SDV) was perceived tobe the FDA’s preferred way for sponsors to meet theirmonitoring obligations
Page 6
(1) Janssen: http://www.fda.gov/ICECI/EnforcementActions/WarningLetters/ucm177398.htm
(3) Pfizer: http://www.fda.gov/ICECI/EnforcementActions/WarningLetters/ucm208976.htm
(2) ICON: http://www.fda.gov/ICECI/EnforcementActions/WarningLetters/ucm193156.htm
But despite 100% SDV:
1.- J&J and ICON cited for not identifying suspected fraud in studydrug administration:
• FDA Warning letter October 8, 2009 (1)
• FDA Warning letter November 27, 2009 (2)
2.- Pfizer cited for inadeqate oversight of study drug dosing:• FDA Warning letter April 09, 2010 (3)

Overview: FDA Monitoring Guidance
Goal: To enhance human subject protection and clinical trial data quality Focuses on clinical investigators’ conduct, oversight, and reporting of an investigation Makes clear that sponsors can use a variety of approaches to fulfill monitoring responsibilities “No single approach to monitoring is appropriate or necessary for every clinical trial”
Intends to assist sponsors in developing risk‐ based monitoring strategies and plans Tailored to the specific human subject protection and data integrity risks of the trial Focuses on critical study parameters Encourages use of a combination of monitoring activities Encourages greater reliance on centralized monitoring practices, where appropriate
FDA Monitoring Recomendations
Page 7
Identify critical study data and processes, e.g. Endpoints Serious Adverse Events Randomization/ Blinding Consent Eligibility Criteria
Perform and document a risk assessment toidentify risks to these critical data andprocesses What could go wrong? What would be the impact? Could we detect it?
Risk Assessment
Conduct a risk assessment to identify and evaluate risks to critical study data and processes Design a monitoring plan tailored to address important and likely risks identified during riskassessment
FDA Monitoring Recomendations

Overview: FDA Monitoring Guidance
Goal: To enhance human subject protection and clinical trial data quality Focuses on clinical investigators’ conduct, oversight, and reporting of an investigation Makes clear that sponsors can use a variety of approaches to fulfill monitoring responsibilities “No single approach to monitoring is appropriate or necessary for every clinical trial”
Intends to assist sponsors in developing risk‐ based monitoring strategies and plans Tailored to the specific human subject protection and data integrity risks of the trial Focuses on critical study parameters Encourages use of a combination of monitoring activities Encourages greater reliance on centralized monitoring practices, where appropriate
FDA Monitoring Recomendations
“FDA believes that risk-based monitoring could
improve sponsoroversight of clinical
investigations”
Page 8
Identify critical study data and processes, e.g. Endpoints Serious Adverse Events Randomization/ Blinding Consent Eligibility Criteria
Perform and document a risk assessment toidentify risks to these critical data andprocesses What could go wrong? What would be the impact? Could we detect it?
Risk Assessment
Conduct a risk assessment to identify and evaluate risks to critical study data and processes Design a monitoring plan tailored to address important and likely risks identified during riskassessment
FDA Monitoring Recomendations
“FDA believes that risk-based monitoring could
improve sponsoroversight of clinical
investigations”

FAQs: What are the RISKs of adopting RBM?
Do we havean obligation
to adoptRBM?
Will the savings out-weigh the RISK?
Are therereally savings
associatedwith RBM?
9
Are therereally savings
associatedwith RBM?
What if we don’thave or cannot affordall that technology?
How can we besure we arecompliant?
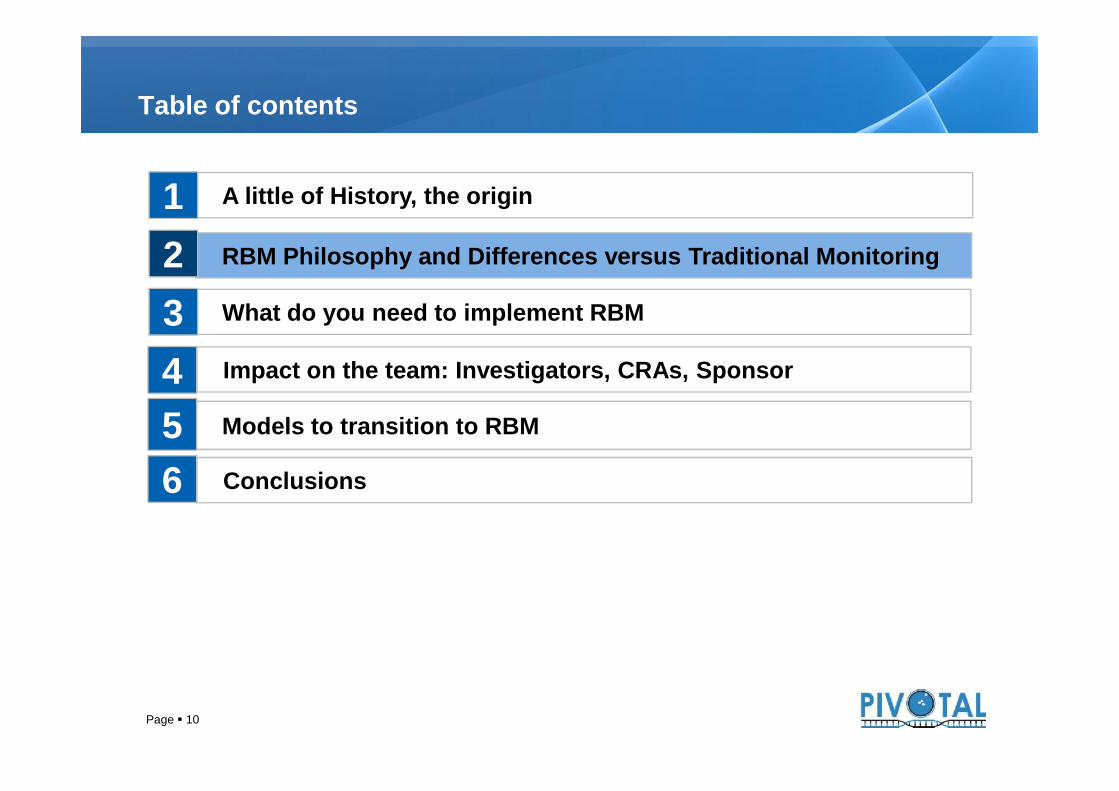
A little of History, the origin
RBM Philosophy and Differences versus Traditional Monitoring
What do you need to implement RBM
23
5
Table of contents
4 Impact on the team: Investigators, CRAs, Sponsor
1
Models to transition to RBM5Conclusions6
Page 10
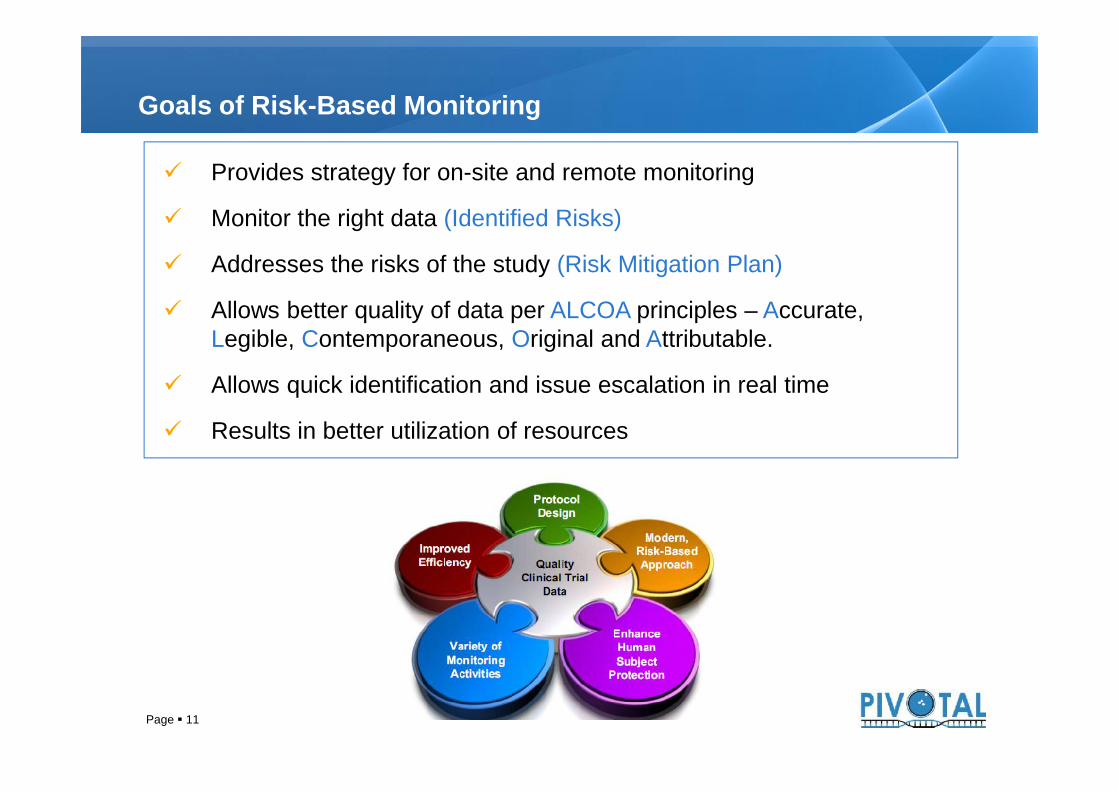
Provides strategy for on-site and remote monitoring
Monitor the right data (Identified Risks)
Addresses the risks of the study (Risk Mitigation Plan)
Allows better quality of data per ALCOA principles – Accurate,Legible, Contemporaneous, Original and Attributable.
Allows quick identification and issue escalation in real time
Results in better utilization of resources
Goals of Risk-Based Monitoring
Provides strategy for on-site and remote monitoring
Monitor the right data (Identified Risks)
Addresses the risks of the study (Risk Mitigation Plan)
Allows better quality of data per ALCOA principles – Accurate,Legible, Contemporaneous, Original and Attributable.
Allows quick identification and issue escalation in real time
Results in better utilization of resources
Page 11
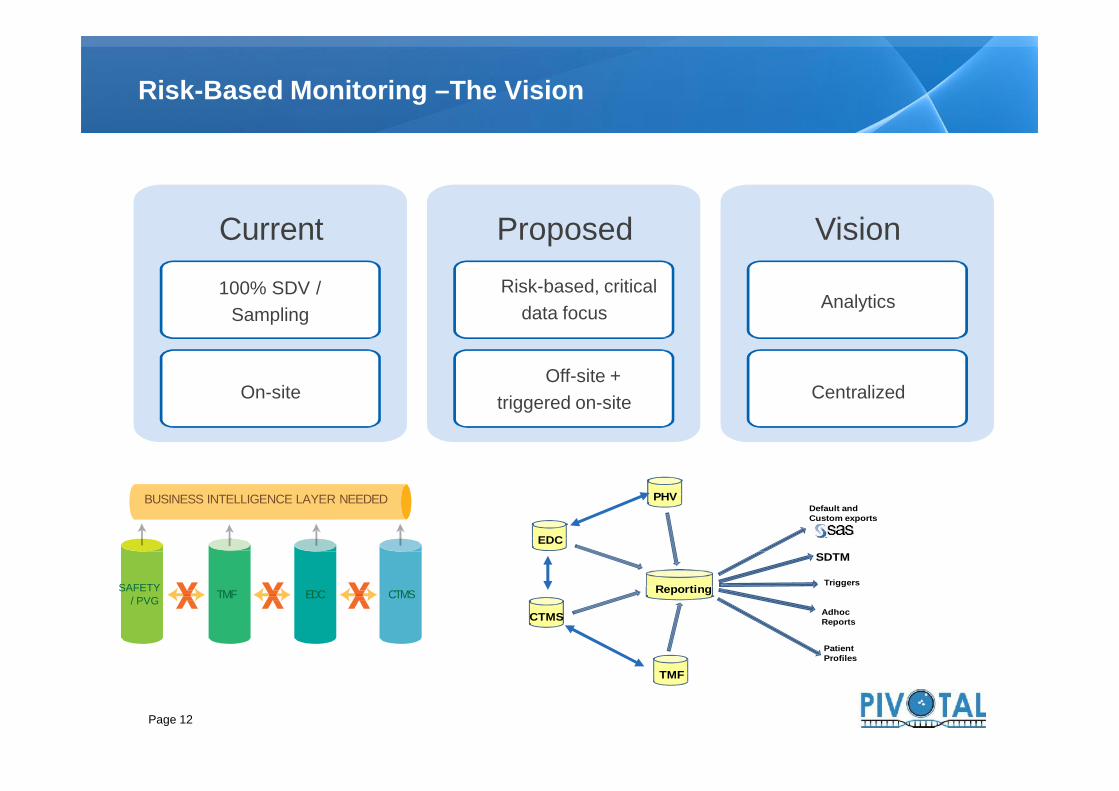
Risk-Based Monitoring –The Vision
Current
100% SDV /Sampling
On-site
ProposedRisk-based, critical
data focus
Off-site +triggered on-site
Vision
Analytics
Centralized
Page 12
On-siteOff-site +
triggered on-site Centralized
TMF EDC CTMS
BUSINESS INTELLIGENCE LAYER NEEDED
SAFETY/ PVG
Default andCustom exports
SDTMEDC
Reporting
AdhocReports
PatientProfiles
PHV
CTMS
TMF
Triggers

Comparison of Traditional versus Adaptive Risk- Based Monitoring
Standard -conduct pre- studyvisit
Standard: Conduct face to faceInvestigator Meeting and on-siteinitiation visit
On-site pre-study visits based on risks: No pre-study on-site visit if site utilized
within the last 6 months and cleancompliance history
Phone interviews with site personnelcould be used in lieu of on-site visit if siteproperly qualified
On-site initiation visit based on sitequalification:
In the compound or therapeutic area Experience with other sponsors with
similar protocols or programs Timing of their last site qualification visit Whether changes have occurred since
last assessment Site indicators which may affect quality:
high turnover, PI availability andresponsiveness
Traditional Monitoring Risk Based Monitoring
Page 13
Standard -conduct pre- studyvisit
Standard: Conduct face to faceInvestigator Meeting and on-siteinitiation visit
On-site pre-study visits based on risks: No pre-study on-site visit if site utilized
within the last 6 months and cleancompliance history
Phone interviews with site personnelcould be used in lieu of on-site visit if siteproperly qualified
On-site initiation visit based on sitequalification:
In the compound or therapeutic area Experience with other sponsors with
similar protocols or programs Timing of their last site qualification visit Whether changes have occurred since
last assessment Site indicators which may affect quality:
high turnover, PI availability andresponsiveness

Comparison of Traditional versus Adaptive Risk- Based Monitoring
100% of ICFs, Inclusion/Exclusion Criteria, AEs, Labs,EKGs, IMP
Regulatory Binder as timepermits
Focused on site-level tasks Focused on one site and one
variable at a time Query resolution per patient No emphasis placed on review
of primary and secondaryefficacy data points ascompared to review of otherdata
100% ICFs for all subjects Utilizes statistical monitoring concepts
with different algorithms e.g.:o 100% review of primary efficacy
data and SAEs for first 2 subjectso 20% sampling for SAEs and
outcome datao Targeted monitoring for sites with
significant compliance issues Remote review of labs, EKGs Receives data for centralized review
remotely as it is being generated andentered to spot issues early
Traditional Monitoring Risk Based Monitoring
Page 14
100% of ICFs, Inclusion/Exclusion Criteria, AEs, Labs,EKGs, IMP
Regulatory Binder as timepermits
Focused on site-level tasks Focused on one site and one
variable at a time Query resolution per patient No emphasis placed on review
of primary and secondaryefficacy data points ascompared to review of otherdata
100% ICFs for all subjects Utilizes statistical monitoring concepts
with different algorithms e.g.:o 100% review of primary efficacy
data and SAEs for first 2 subjectso 20% sampling for SAEs and
outcome datao Targeted monitoring for sites with
significant compliance issues Remote review of labs, EKGs Receives data for centralized review
remotely as it is being generated andentered to spot issues early
Comparison of Traditional versus Adaptive Risk- Based Monitoring
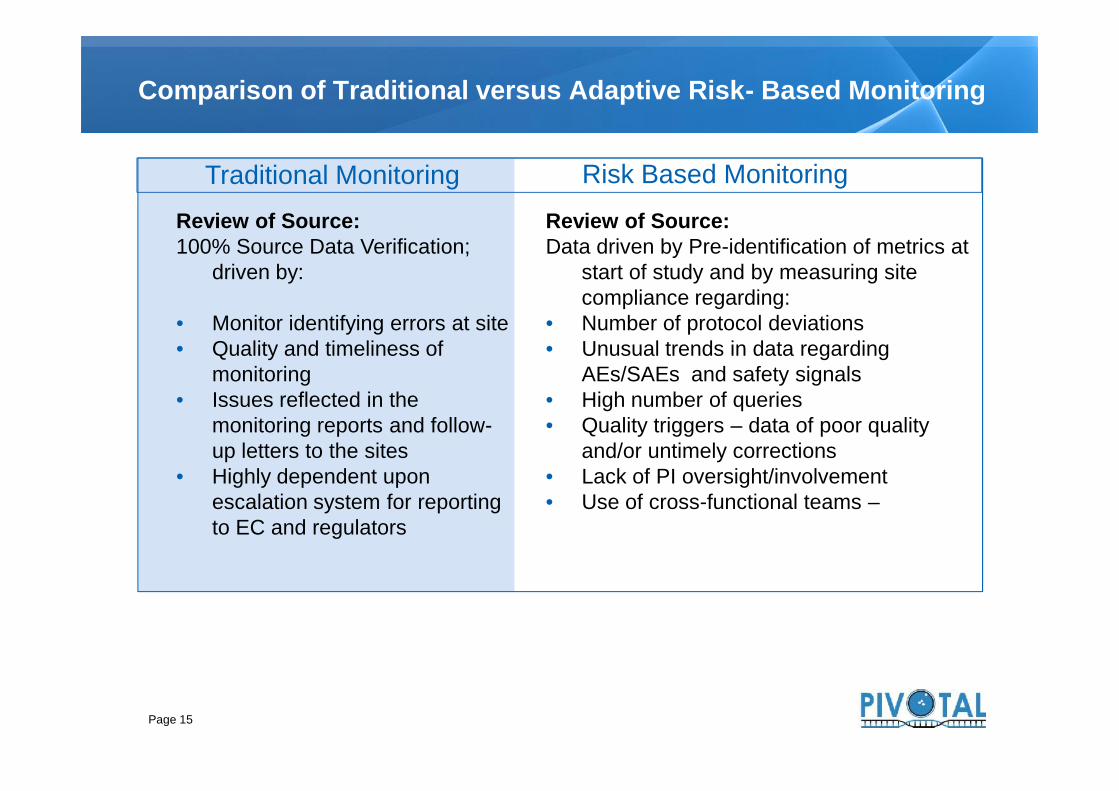
Review of Source:100% Source Data Verification;
driven by:
Monitor identifying errors at site Quality and timeliness of
monitoring Issues reflected in the
monitoring reports and follow-up letters to the sites
Highly dependent uponescalation system for reportingto EC and regulators
Review of Source:Data driven by Pre-identification of metrics at
start of study and by measuring sitecompliance regarding:
Number of protocol deviations Unusual trends in data regarding
AEs/SAEs and safety signals High number of queries Quality triggers – data of poor quality
and/or untimely corrections Lack of PI oversight/involvement Use of cross-functional teams –
Traditional Monitoring Risk Based Monitoring
Page 15
Review of Source:100% Source Data Verification;
driven by:
Monitor identifying errors at site Quality and timeliness of
monitoring Issues reflected in the
monitoring reports and follow-up letters to the sites
Highly dependent uponescalation system for reportingto EC and regulators
Review of Source:Data driven by Pre-identification of metrics at
start of study and by measuring sitecompliance regarding:
Number of protocol deviations Unusual trends in data regarding
AEs/SAEs and safety signals High number of queries Quality triggers – data of poor quality
and/or untimely corrections Lack of PI oversight/involvement Use of cross-functional teams –

Comparison of Traditional versus Adaptive Risk- Based Monitoring
Rigid, on-site monitoring visits
Scheduled at 4 – 8 week intervalsAll sites start out with the sameplan for frequency of monitoring
Monitoring visits triggered by risk-specified criteria:Based on key risk metrics and risk scoresused to trigger a visit such as…
Data quality trending issues identified:training required across sitesdata integrity issuesunusually high or low screen failure rateslab issues indicating sample integrity issueshigh number of edit checks with dataquality issuesedit checks with high number of manualqueries
Traditional Monitoring Risk Based Monitoring
Page 16
Monitoring visits triggered by risk-specified criteria:Based on key risk metrics and risk scoresused to trigger a visit such as…
Data quality trending issues identified:training required across sitesdata integrity issuesunusually high or low screen failure rateslab issues indicating sample integrity issueshigh number of edit checks with dataquality issuesedit checks with high number of manualqueries
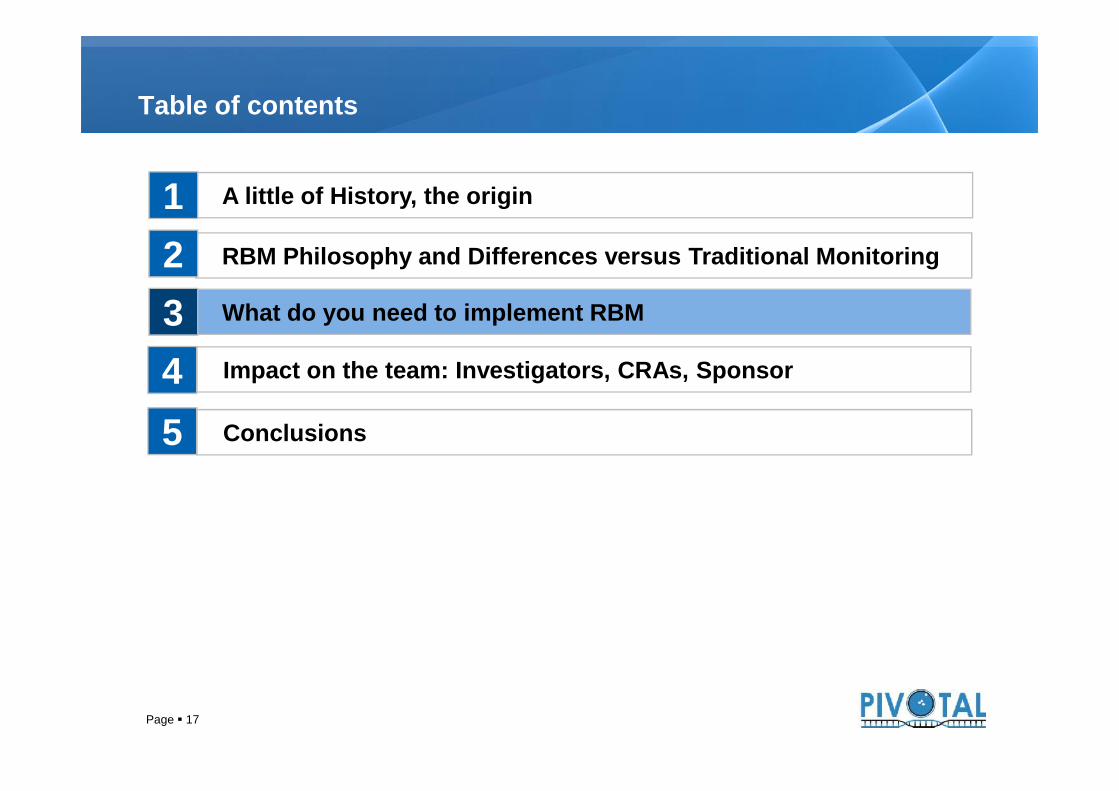
A little of History, the origin
RBM Philosophy and Differences versus Traditional Monitoring
What do you need to implement RBM
23
Table of contents
4 Impact on the team: Investigators, CRAs, Sponsor
1
Conclusions5
Page 17

Focus onCritical
Processes andData in StudyPlans
Use of RiskIndicators,Thresholds &Action Plans
Risk Indicators andThresholds
Adjustment ofmonitoringactivities
Methodology for Risk-Based Monitoring – Key Elements
Page 18
Build QbDinto trials
Early andongoing riskassessment
Focus onCritical
Processes andData in StudyPlans
RACT
CriticalData
IQRMP
Use of RiskIndicators,Thresholds &Action Plans
Risk Indicators andThresholds
Adjustment ofmonitoringactivities

People
Process:• Risks evaluation• Integrated Quality and RiskManagement Plan (MonitoringPlan)
• Define Triggers and actions• RBM algorithm
Technology
What do you need to implement RBM
People
Process:• Risks evaluation• Integrated Quality and RiskManagement Plan (MonitoringPlan)
• Define Triggers and actions• RBM algorithm
Technology
Page 19

Current model
Page 20
SDV: Actual monitoring model is tocompare size and colors between the twoimages instead documents

RBM
The newmodel is
to explorethe bigpicture
Page 21
The newmodel is
to explorethe bigpicture
Diego Velazquez; The Surrender of Breda
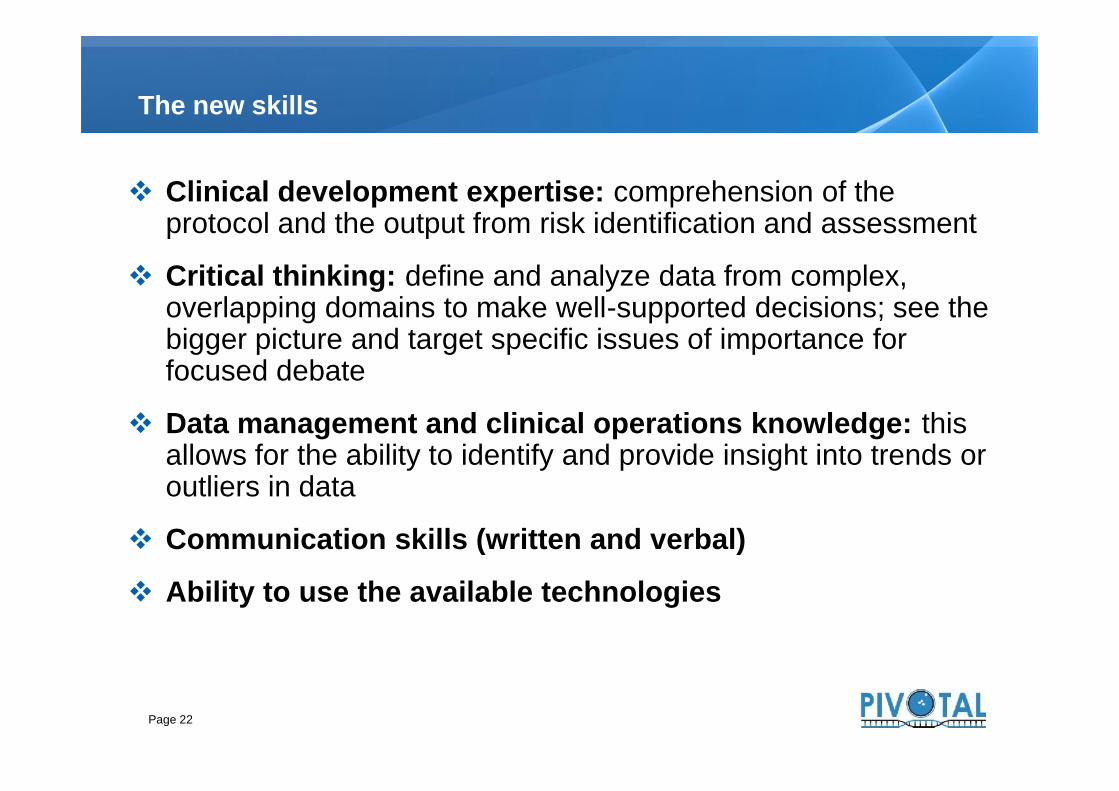
The new skills
Clinical development expertise: comprehension of theprotocol and the output from risk identification and assessment
Critical thinking: define and analyze data from complex,overlapping domains to make well-supported decisions; see thebigger picture and target specific issues of importance forfocused debate
Data management and clinical operations knowledge: thisallows for the ability to identify and provide insight into trends oroutliers in data
Communication skills (written and verbal)
Ability to use the available technologies
Page 22
Clinical development expertise: comprehension of theprotocol and the output from risk identification and assessment
Critical thinking: define and analyze data from complex,overlapping domains to make well-supported decisions; see thebigger picture and target specific issues of importance forfocused debate
Data management and clinical operations knowledge: thisallows for the ability to identify and provide insight into trends oroutliers in data
Communication skills (written and verbal)
Ability to use the available technologies
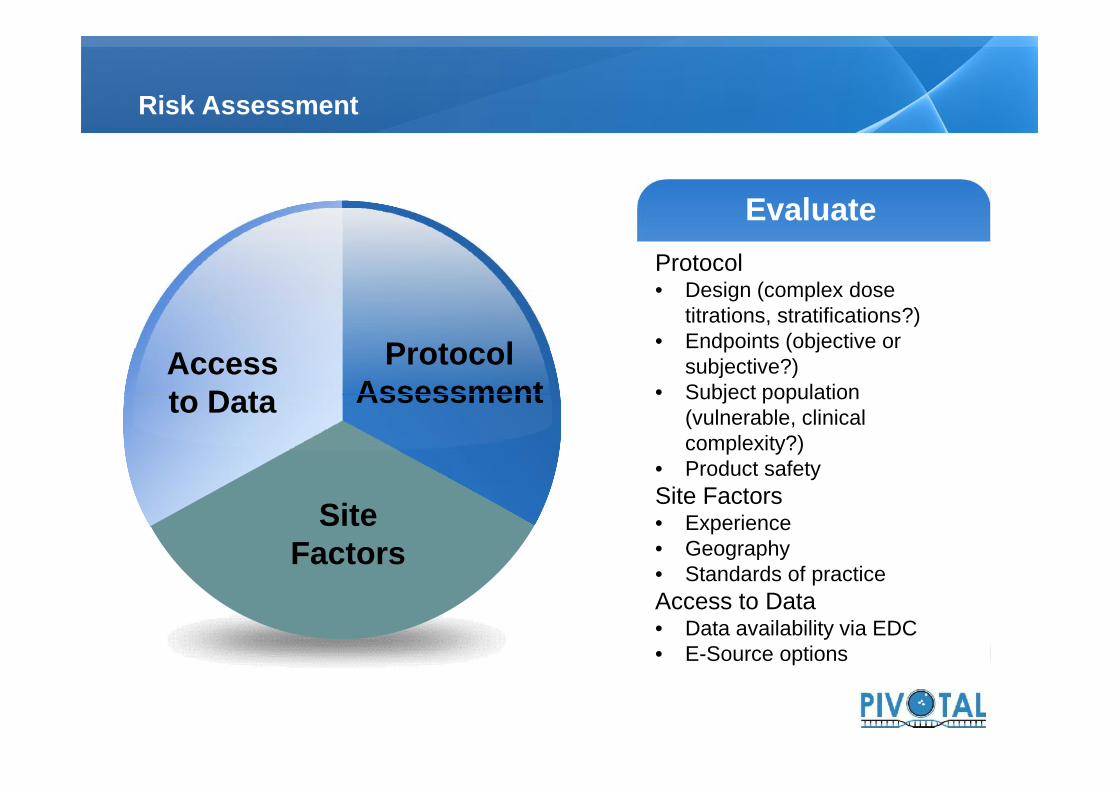
Risk Assessment
ProtocolAssessment
Accessto Data
EvaluateEvaluateProtocol• Design (complex dose
titrations, stratifications?)• Endpoints (objective or
subjective?)• Subject population
(vulnerable, clinicalcomplexity?)
• Product safetySite Factors• Experience• Geography• Standards of practiceAccess to Data• Data availability via EDC• E-Source options
Protocol• Design (complex dose
titrations, stratifications?)• Endpoints (objective or
subjective?)• Subject population
(vulnerable, clinicalcomplexity?)
• Product safetySite Factors• Experience• Geography• Standards of practiceAccess to Data• Data availability via EDC• E-Source options
EvaluateProtocol• Design (complex dose
titrations, stratifications?)• Endpoints (objective or
subjective?)• Subject population
(vulnerable, clinicalcomplexity?)
• Product safetySite Factors• Experience• Geography• Standards of practiceAccess to Data• Data availability via EDC• E-Source options
ProtocolAssessment
SiteFactors
Accessto Data
EvaluateEvaluateProtocol• Design (complex dose
titrations, stratifications?)• Endpoints (objective or
subjective?)• Subject population
(vulnerable, clinicalcomplexity?)
• Product safetySite Factors• Experience• Geography• Standards of practiceAccess to Data• Data availability via EDC• E-Source options
Protocol• Design (complex dose
titrations, stratifications?)• Endpoints (objective or
subjective?)• Subject population
(vulnerable, clinicalcomplexity?)
• Product safetySite Factors• Experience• Geography• Standards of practiceAccess to Data• Data availability via EDC• E-Source options
Protocol• Design (complex dose
titrations, stratifications?)• Endpoints (objective or
subjective?)• Subject population
(vulnerable, clinicalcomplexity?)
• Product safetySite Factors• Experience• Geography• Standards of practiceAccess to Data• Data availability via EDC• E-Source options

Examples of Risk Assesment Tools: Transcelerate Project (RACT)
Page 24

Risk Categorization and Application to Monitoring Activities
SDV and SDR do not need to beperformed on the same sample
SDV and SDR may be assigneddifferent percentages as a starting point
SDV and/or SDR can be temporarilyincreased or decreased depending onthe type of issues and risks noted at thesite, country/region, or study (duringOn-site, Central or Off-site reviews).For example, if a site is identified as anoutlier based on a lower than averagenumber of reported adverse events,consider increasing SDV of visits forthose subjects that have no AEsreported.
Page 25
SDV and SDR do not need to beperformed on the same sample
SDV and SDR may be assigneddifferent percentages as a starting point
SDV and/or SDR can be temporarilyincreased or decreased depending onthe type of issues and risks noted at thesite, country/region, or study (duringOn-site, Central or Off-site reviews).For example, if a site is identified as anoutlier based on a lower than averagenumber of reported adverse events,consider increasing SDV of visits forthose subjects that have no AEsreported.

Developing your Monitoring Plan
Res
pons
ibili
ties
Req
uire
men
ts
MethodsFor assessment of errors that could
impact the outcome of the study• Identify the data to be reviewed• Define expected outliers (and
potential impact)
ResponsibilitiesWho will carry out the various formsof monitoring (onsite versus central)
• Frequency of reviews• Documentation of review and
findings
Met
hods
Res
pons
ibili
ties
Req
uire
men
ts
Tool
s
ResponsibilitiesWho will carry out the various formsof monitoring (onsite versus central)
• Frequency of reviews• Documentation of review and
findings
Requirements• Escalation and decision making
• Impact of errors may be different,definition of outlier(s) may vary
• Describe dynamic nature of the plan(think CAPAs)
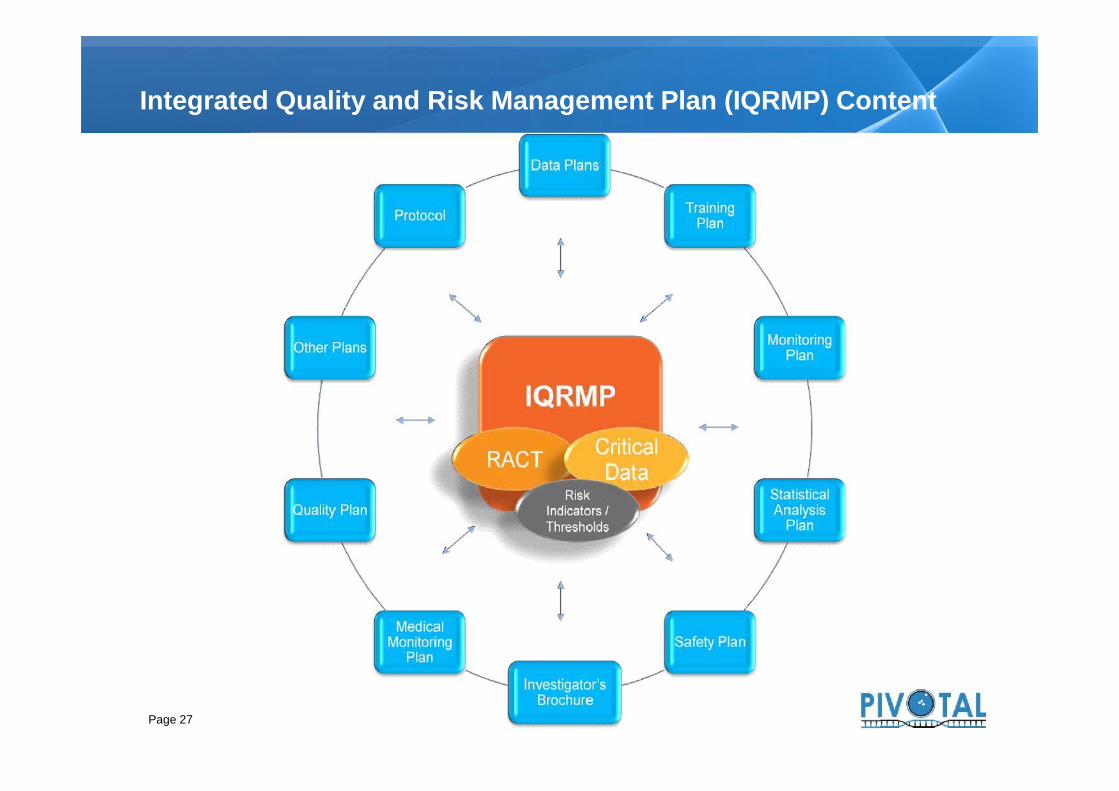
Integrated Quality and Risk Management Plan (IQRMP) Content
Page 27

Application of different types of monitoring
Page 28

Risk indicators and Triggers
Categories Variables to be Assessed (with comparabilityacross program / protocol / country / site, asoutlined in the Integrated Quality and RiskManagement Plan)
Variables to be Assessed (with comparabilityacross program / protocol / country / site, asoutlined in the Integrated Quality and RiskManagement Plan)
Safety
Suspected Unexpected Serious AdverseReactions
l Dispensation (e.g. compare CRF entries toIVRS assignments); bar code scan errors (e.g.error rate based on comparison of IVRS containernumber assigned vs. IP dispensed numbers asdocumented in CRF)
Concerns regarding processing of safety information l Compliance (e.g. amount assigned versusadministered)
l PI/designee receipt/accessing of safetydocuments
l Number of IP interruptions compared to averageacross sites
l Timeliness of reporting of safety information tosite’s local IRB/IEC (as applicable) l Incidence of temperature excursions
Non-serious Adverse Events Subject Recruitmentl Outliers / trends in number of events per subjector per site l Outliers in screen failure rate / enrollment rate
Serious Adverse Events l Number of screen failures compared to averageacross sites – protocol dependent
l Outliers / trends in number of events per subjector per site l Planned versus actual enrollment
l Timeliness of reporting (e.g. date of eventcompared to date of data entry) l Inconsistent recruitment
l Incidence of potentially unreported SAEs basedon information from data review
Subject Discontinuation
Concerns regarding accountability, dosing,administration, or compliance
l Outliers / trends in ratio of subjects discontinuedto subjects randomized
l Receipt at site (e.g. timeliness ofacknowledgement in IVRS)
l Reason for discontinuation (e.g. number pereach category vs. total number of discontinuations)
InvestigationalProduct
CLINICAL TRIAL EXECUTION PROJECTS: RISK-BASED MONITORINGRisk Indicators
Categories
InvestigationalProduct
SubjectRecruitment andDiscontinuation
Page 29
Categories Variables to be Assessed (with comparabilityacross program / protocol / country / site, asoutlined in the Integrated Quality and RiskManagement Plan)
Variables to be Assessed (with comparabilityacross program / protocol / country / site, asoutlined in the Integrated Quality and RiskManagement Plan)
Safety
Suspected Unexpected Serious AdverseReactions
l Dispensation (e.g. compare CRF entries toIVRS assignments); bar code scan errors (e.g.error rate based on comparison of IVRS containernumber assigned vs. IP dispensed numbers asdocumented in CRF)
Concerns regarding processing of safety information l Compliance (e.g. amount assigned versusadministered)
l PI/designee receipt/accessing of safetydocuments
l Number of IP interruptions compared to averageacross sites
l Timeliness of reporting of safety information tosite’s local IRB/IEC (as applicable) l Incidence of temperature excursions
Non-serious Adverse Events Subject Recruitmentl Outliers / trends in number of events per subjector per site l Outliers in screen failure rate / enrollment rate
Serious Adverse Events l Number of screen failures compared to averageacross sites – protocol dependent
l Outliers / trends in number of events per subjector per site l Planned versus actual enrollment
l Timeliness of reporting (e.g. date of eventcompared to date of data entry) l Inconsistent recruitment
l Incidence of potentially unreported SAEs basedon information from data review
Subject Discontinuation
Concerns regarding accountability, dosing,administration, or compliance
l Outliers / trends in ratio of subjects discontinuedto subjects randomized
l Receipt at site (e.g. timeliness ofacknowledgement in IVRS)
l Reason for discontinuation (e.g. number pereach category vs. total number of discontinuations)
InvestigationalProduct
CLINICAL TRIAL EXECUTION PROJECTS: RISK-BASED MONITORINGRisk Indicators
Categories
InvestigationalProduct
SubjectRecruitment andDiscontinuation
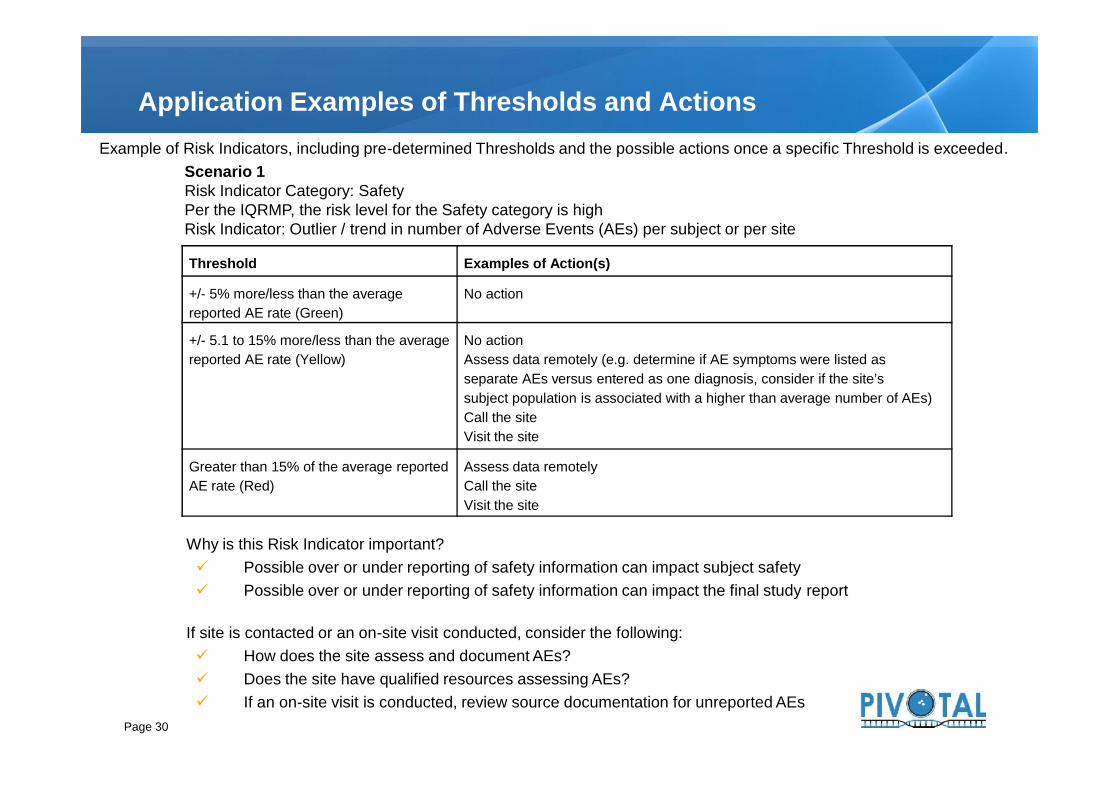
Application Examples of Thresholds and ActionsExample of Risk Indicators, including pre-determined Thresholds and the possible actions once a specific Threshold is exceeded.
Scenario 1Risk Indicator Category: SafetyPer the IQRMP, the risk level for the Safety category is highRisk Indicator: Outlier / trend in number of Adverse Events (AEs) per subject or per site
Threshold Examples of Action(s)
+/- 5% more/less than the averagereported AE rate (Green)
No action
+/- 5.1 to 15% more/less than the averagereported AE rate (Yellow)
No actionAssess data remotely (e.g. determine if AE symptoms were listed asseparate AEs versus entered as one diagnosis, consider if the site’ssubject population is associated with a higher than average number of AEs)Call the siteVisit the site
Page 30
No actionAssess data remotely (e.g. determine if AE symptoms were listed asseparate AEs versus entered as one diagnosis, consider if the site’ssubject population is associated with a higher than average number of AEs)Call the siteVisit the site
Greater than 15% of the average reportedAE rate (Red)
Assess data remotelyCall the siteVisit the site
Why is this Risk Indicator important? Possible over or under reporting of safety information can impact subject safety Possible over or under reporting of safety information can impact the final study report
If site is contacted or an on-site visit conducted, consider the following: How does the site assess and document AEs? Does the site have qualified resources assessing AEs? If an on-site visit is conducted, review source documentation for unreported AEs
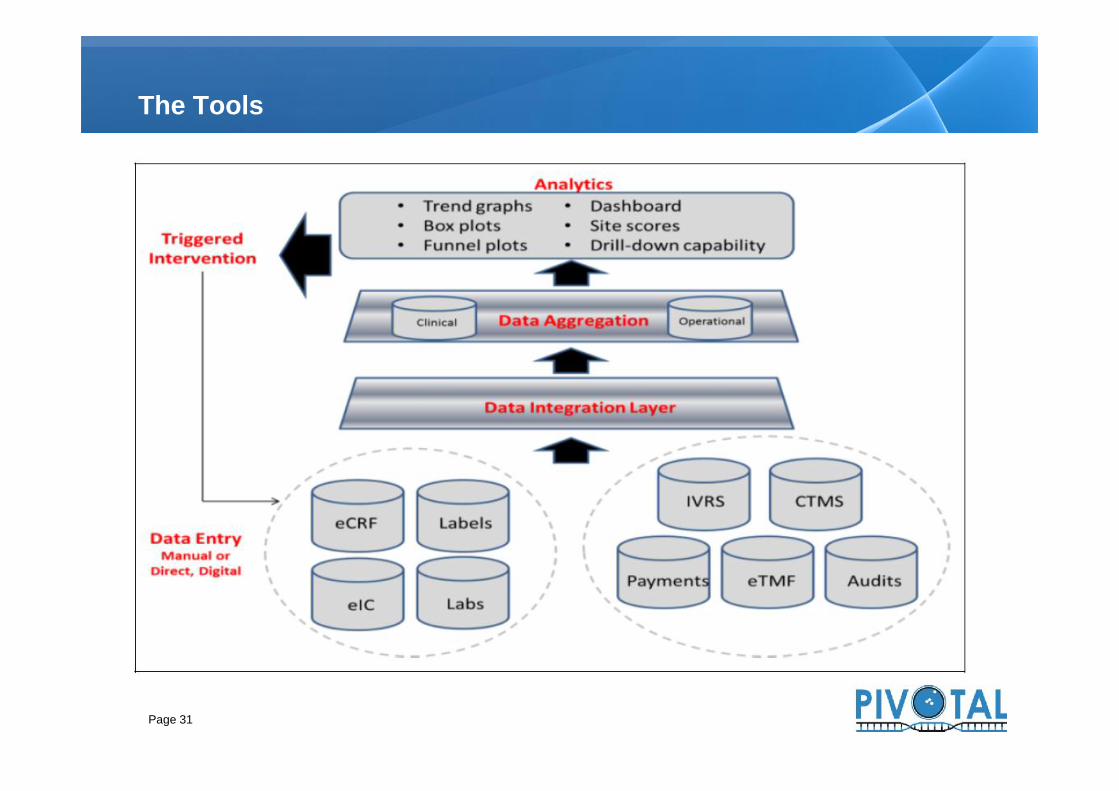
The Tools
Page 31
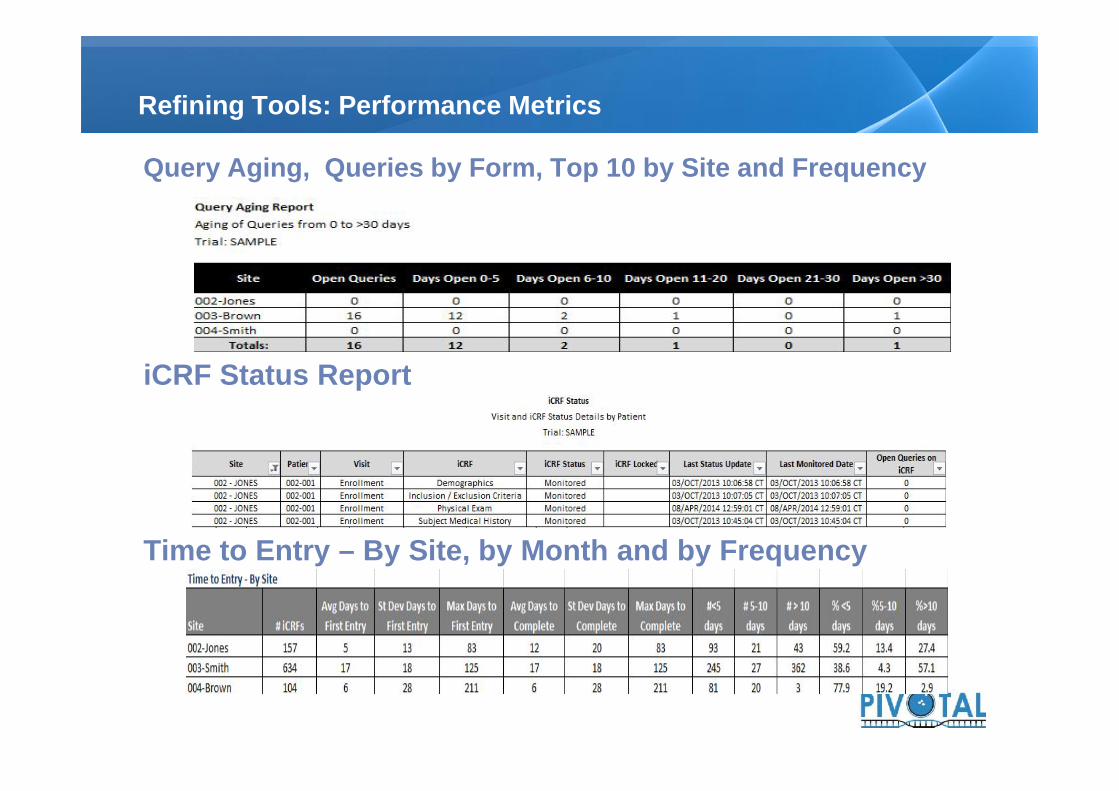
Query Aging, Queries by Form, Top 10 by Site and Frequency
iCRF Status Report
Time to Entry – By Site, by Month and by Frequency
Refining Tools: Performance Metrics
Query Aging, Queries by Form, Top 10 by Site and Frequency
iCRF Status Report
Time to Entry – By Site, by Month and by Frequency

Dashboards
Page 33

Dynamic Patient Profiles
Page 34

Adverse Events follow-up
Page 35

Triggers and statistics
Page 36
A little of History, the origin
RBM Philosophy and Differences versus Traditional Monitoring
What do you need to implement RBM
23
5
Table of contents
4 Impact on the team: Investigators, CRAs, Sponsor
1
Conclusions5
Page 37

Hybrid role combining central data review, remote site supportcoupled with on-site visits
Learning to view data from bigger picture point of view
Letting go of the compulsion to compare each data point
Time on-site spent differently• Focus on key-criteria• Overall subject eligibility and safety review• Still typically 100% ICF review• Regulatory and drug accountability• Time with PI and study staff
The Changing Role of a Monitor
Hybrid role combining central data review, remote site supportcoupled with on-site visits
Learning to view data from bigger picture point of view
Letting go of the compulsion to compare each data point
Time on-site spent differently• Focus on key-criteria• Overall subject eligibility and safety review• Still typically 100% ICF review• Regulatory and drug accountability• Time with PI and study staff
Hard to teach “an old dog new tricks”• Daunting to decide how much is enough• Inconsistencies from CRA to CRA based upon onsite findings
Many like the idea of less travel
As they continue to see the benefits…“…things they pick up on using centralized tools that they might nothave seen otherwise…”
…acceptance may improve
Shift in remote site management activities to includeregular discussion of safety reporting, regulatorysubmissions and approvals
Thoughts from our Monitors
Hard to teach “an old dog new tricks”• Daunting to decide how much is enough• Inconsistencies from CRA to CRA based upon onsite findings
Many like the idea of less travel
As they continue to see the benefits…“…things they pick up on using centralized tools that they might nothave seen otherwise…”
…acceptance may improve
Shift in remote site management activities to includeregular discussion of safety reporting, regulatorysubmissions and approvals

Many sites do not have existing quality assuranceprograms, rely on monitors to serve in this role
Upcoming visit cannot be trigger to enter data – this is acommon performance metric
Perception of more work• Ask, up front, what will be expected of you• If reality, e.g., requests for scanned copies of source, negotiate
appropriately
eSource will eventually reduce work• Future holds promise for EMR to EDC direct uploads, but rare to
non existent at present• IRT, IVR, eTMF, image and lab data uploads and more now
serving as eSource
More on Site’s Perspective
Many sites do not have existing quality assuranceprograms, rely on monitors to serve in this role
Upcoming visit cannot be trigger to enter data – this is acommon performance metric
Perception of more work• Ask, up front, what will be expected of you• If reality, e.g., requests for scanned copies of source, negotiate
appropriately
eSource will eventually reduce work• Future holds promise for EMR to EDC direct uploads, but rare to
non existent at present• IRT, IVR, eTMF, image and lab data uploads and more now
serving as eSource
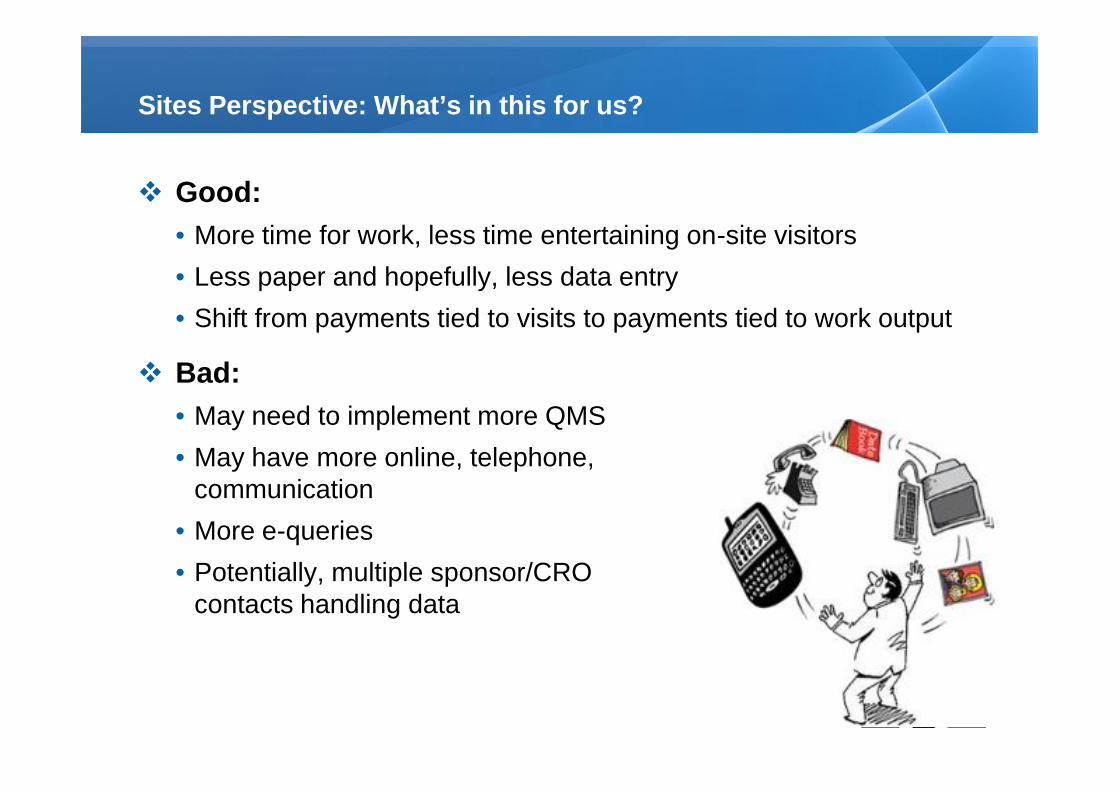
Good:• More time for work, less time entertaining on-site visitors• Less paper and hopefully, less data entry• Shift from payments tied to visits to payments tied to work output
Bad:• May need to implement more QMS• May have more online, telephone, and/or text
communication• More e-queries• Potentially, multiple sponsor/CRO
contacts handling data
Sites Perspective: What’s in this for us?
Good:• More time for work, less time entertaining on-site visitors• Less paper and hopefully, less data entry• Shift from payments tied to visits to payments tied to work output
Bad:• May need to implement more QMS• May have more online, telephone, and/or text
communication• More e-queries• Potentially, multiple sponsor/CRO
contacts handling data

Sponsor Perspective
Implement!
42
Does myjob
dependon it!?”
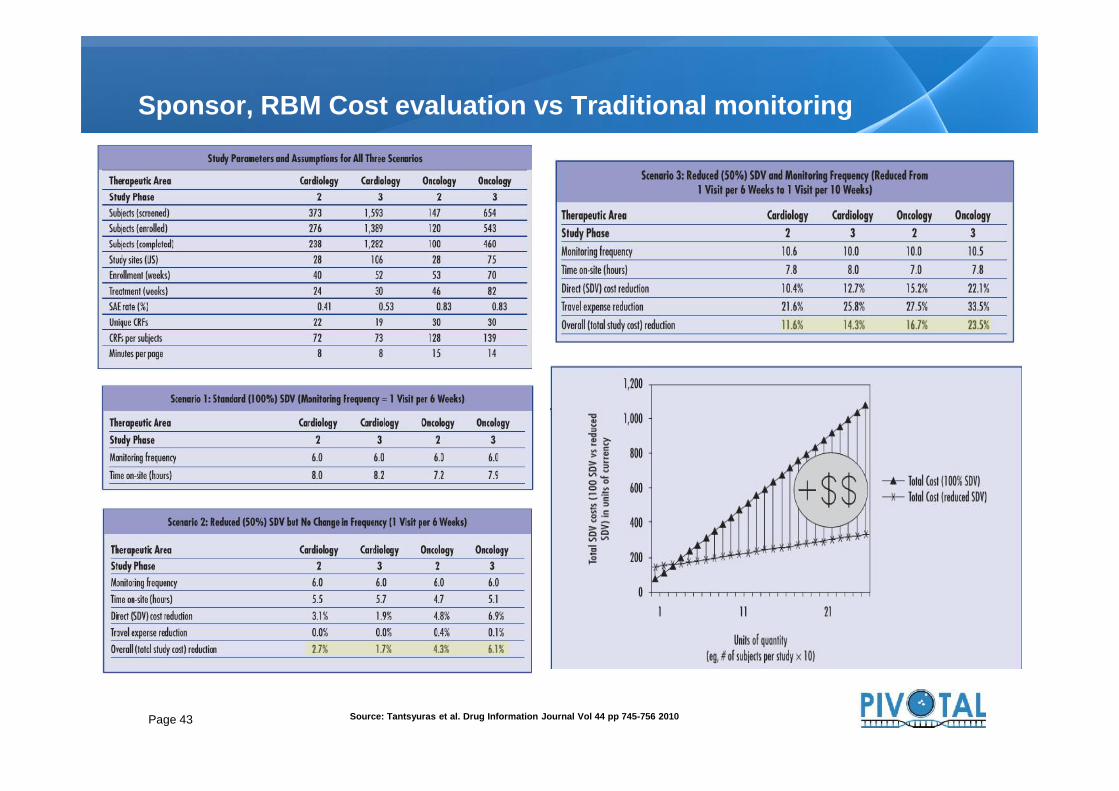
Sponsor, RBM Cost evaluation vs Traditional monitoring
Page 43 Source: Tantsyuras et al. Drug Information Journal Vol 44 pp 745-756 2010

Rapid enrollment impededimplementation
Tools and trainingdeprioritized due to patientvolume
When they could haveused it most, they missedthe opportunity
Enrollment Impacted Implementation
Rapid enrollment impededimplementation
Tools and trainingdeprioritized due to patientvolume
When they could haveused it most, they missedthe opportunity

Lessons Learned: Need to Haves vs Nice to Haves
Improvementsshould include:• Electronic data capture• Centralized monitoring of
eCRF data: additional,analytics-enabled dataevaluation
• Frequent communication(email, webconferencing, onlinetraining, etc.)
And may include:• Integrated systems• Automated workflows• Customizable graphical
options• Other sophisticated
reporting tools
45
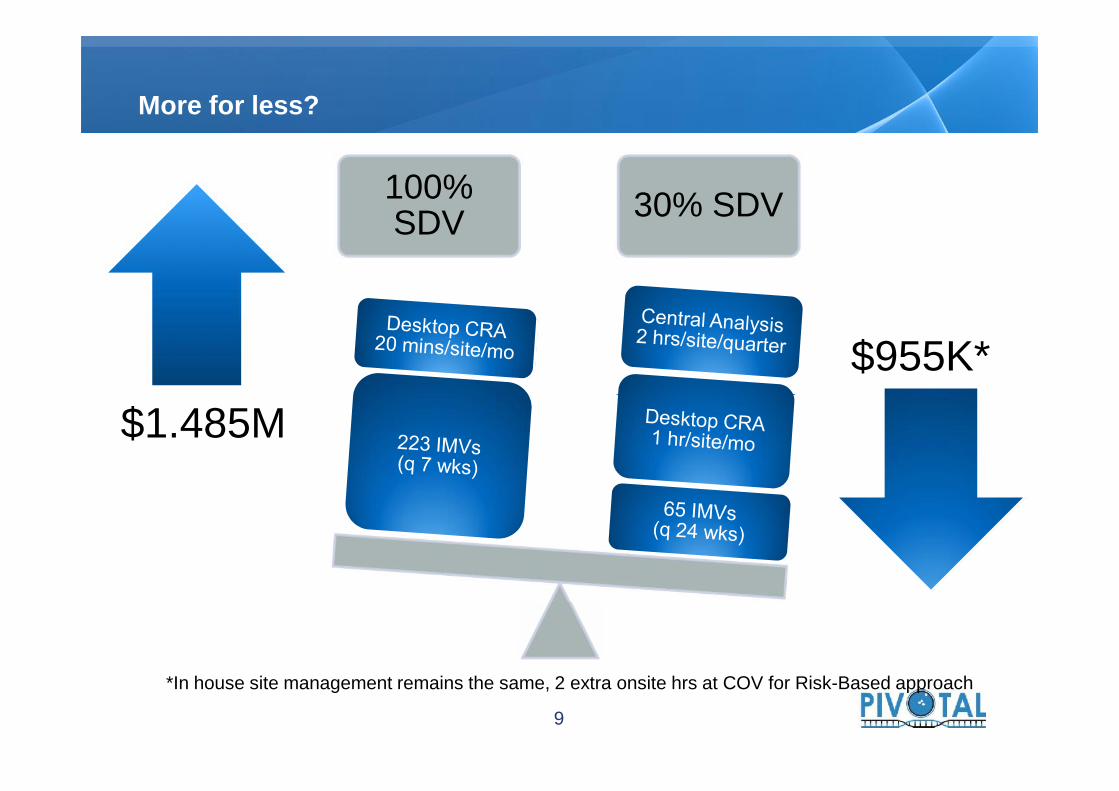
$1.485M$955K*
100%SDV 30% SDV
More for less?
$1.485M
*In house site management remains the same, 2 extra onsite hrs at COV for Risk-Based approach
9
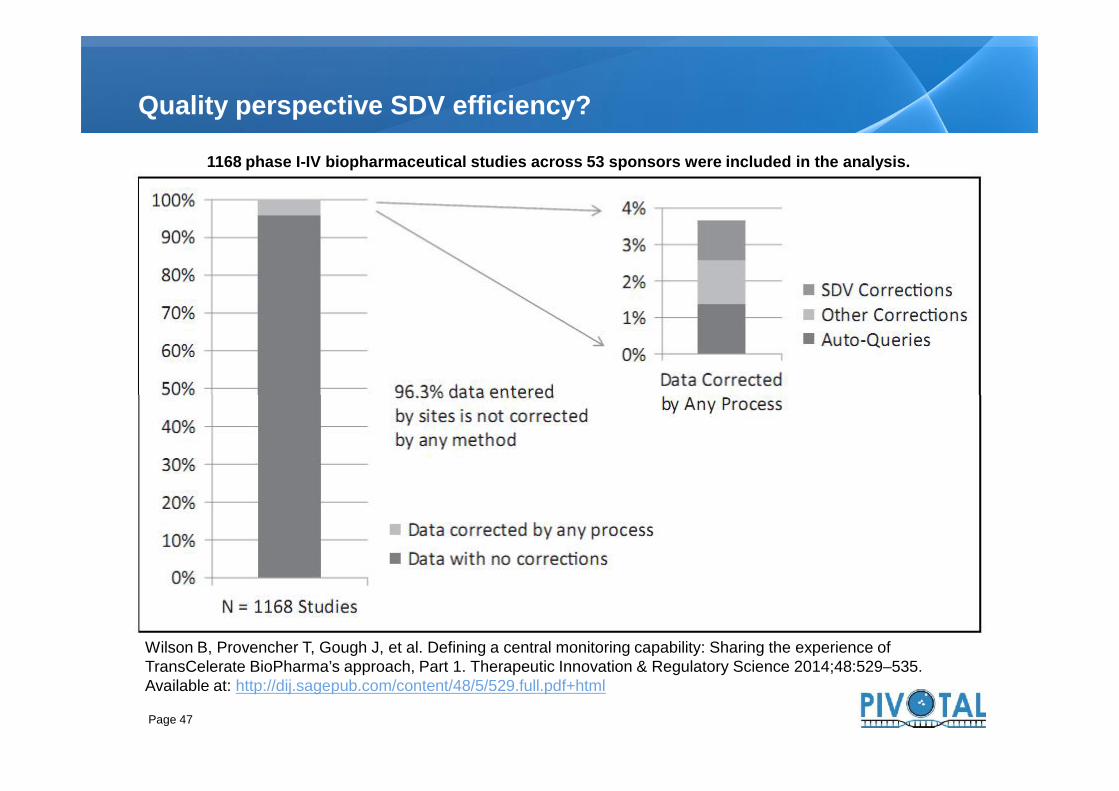
Quality perspective SDV efficiency?
1168 phase I-IV biopharmaceutical studies across 53 sponsors were included in the analysis.
Page 47
Wilson B, Provencher T, Gough J, et al. Defining a central monitoring capability: Sharing the experience ofTransCelerate BioPharma’s approach, Part 1. Therapeutic Innovation & Regulatory Science 2014;48:529–535.Available at: http://dij.sagepub.com/content/48/5/529.full.pdf+html
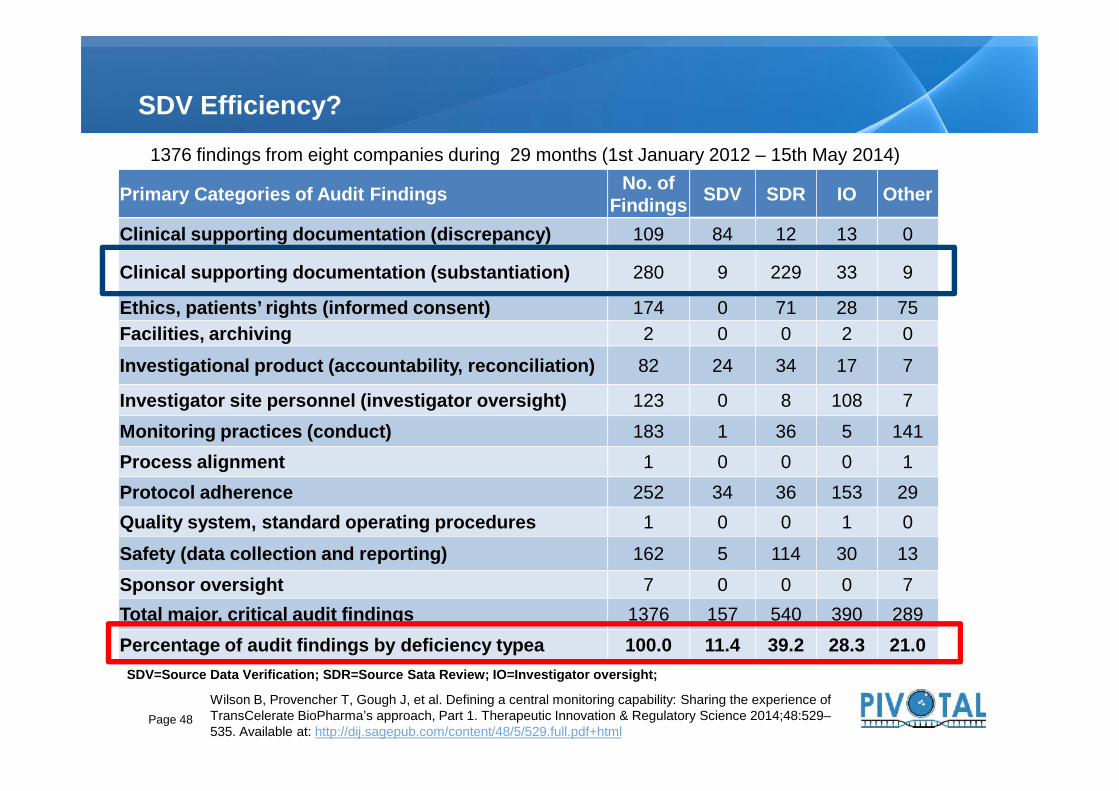
SDV Efficiency?
Primary Categories of Audit Findings No. ofFindings SDV SDR IO Other
Clinical supporting documentation (discrepancy) 109 84 12 13 0
Clinical supporting documentation (substantiation) 280 9 229 33 9
Ethics, patients’ rights (informed consent) 174 0 71 28 75Facilities, archiving 2 0 0 2 0
Investigational product (accountability, reconciliation) 82 24 34 17 7
Investigator site personnel (investigator oversight) 123 0 8 108 7
1376 findings from eight companies during 29 months (1st January 2012 – 15th May 2014)
Page 48
Investigator site personnel (investigator oversight) 123 0 8 108 7Monitoring practices (conduct) 183 1 36 5 141Process alignment 1 0 0 0 1Protocol adherence 252 34 36 153 29Quality system, standard operating procedures 1 0 0 1 0
Safety (data collection and reporting) 162 5 114 30 13Sponsor oversight 7 0 0 0 7Total major, critical audit findings 1376 157 540 390 289Percentage of audit findings by deficiency typea 100.0 11.4 39.2 28.3 21.0
Wilson B, Provencher T, Gough J, et al. Defining a central monitoring capability: Sharing the experience ofTransCelerate BioPharma’s approach, Part 1. Therapeutic Innovation & Regulatory Science 2014;48:529–535. Available at: http://dij.sagepub.com/content/48/5/529.full.pdf+html
SDV=Source Data Verification; SDR=Source Sata Review; IO=Investigator oversight;

A little of History, the origin
RBM Philosophy and Differences versus Traditional Monitoring
What do you need to implement RBM
23
5
Table of contents
4 Impact on the team: Investigators, CRAs, Sponsor
1
Conclusions5
Page 49

Conclusions
RBM is an adaptive approach to clinical trialmonitoring
RBM provides better oversight of clinical trialsRBM is not:
• An increase to the “risks” involved in your trial• Reducing costs at the “risk” of quality in your trial• "Phoning it in” from the sites’ standpoint
Quality: the absence of errors that matter
Page 50
RBM is an adaptive approach to clinical trialmonitoring
RBM provides better oversight of clinical trialsRBM is not:
• An increase to the “risks” involved in your trial• Reducing costs at the “risk” of quality in your trial• "Phoning it in” from the sites’ standpoint
Quality: the absence of errors that matter

FDA, Guidance for Industry: Oversight of Clinical Investigations- A Risk- Based Approach toMonitoring; August 2013
EMA. Reflection paper on risk-based quality management in clinical trials(EMA/INS/GCP/397194/2011)
MRC/DH/MHRA Joint Project: Risk-adapted Approaches to the Management of Clinical Trials,October 2011
OECD Recommendation on the Governance of Clinical Trials, 2013 TransCelerate Position Paper: Risk-Based Monitoring Methodology, 2013 ECRIN, Risk-Adapted Monitoring in Clinical, 2011 FDA: Q9 Quality Risk Management ICH – Guidance for Industry: Q9 Quality Risk Management FDA Guidance for Industry; Computerized systems used in clinical trials, May 2007 Tantsyura V. et al; Risk-based Sourde Data Verifications: Pros and Cons; Drug Information
Journal Vol 44, pp.745-756; 2010 Wilson B. et al, Approach, Part 1 Defining a Central Monitoring Capability: Sharing the
Experience of TransCelerate BioPharma’s Therapeutic Innovation & Regulatory ScienceAugust 2014, Vol. 48(5) 529-535
Barnes, S. et al, Technology Considerations to Enable the Risk-Based MonitoringMethodology; Therapeutic Innovation & Regulatory Science August 2014, Vol. 48(5) 536-545
Sheetz N. et al, Evaluating Source Data Verification as a Quality Control Measure in ClinicalTrials; Therapeutic Innovation & Regulatory Science October 2014, Vol. 48(6) 671-680
Bibliography
Page 51
FDA, Guidance for Industry: Oversight of Clinical Investigations- A Risk- Based Approach toMonitoring; August 2013
EMA. Reflection paper on risk-based quality management in clinical trials(EMA/INS/GCP/397194/2011)
MRC/DH/MHRA Joint Project: Risk-adapted Approaches to the Management of Clinical Trials,October 2011
OECD Recommendation on the Governance of Clinical Trials, 2013 TransCelerate Position Paper: Risk-Based Monitoring Methodology, 2013 ECRIN, Risk-Adapted Monitoring in Clinical, 2011 FDA: Q9 Quality Risk Management ICH – Guidance for Industry: Q9 Quality Risk Management FDA Guidance for Industry; Computerized systems used in clinical trials, May 2007 Tantsyura V. et al; Risk-based Sourde Data Verifications: Pros and Cons; Drug Information
Journal Vol 44, pp.745-756; 2010 Wilson B. et al, Approach, Part 1 Defining a Central Monitoring Capability: Sharing the
Experience of TransCelerate BioPharma’s Therapeutic Innovation & Regulatory ScienceAugust 2014, Vol. 48(5) 529-535
Barnes, S. et al, Technology Considerations to Enable the Risk-Based MonitoringMethodology; Therapeutic Innovation & Regulatory Science August 2014, Vol. 48(5) 536-545
Sheetz N. et al, Evaluating Source Data Verification as a Quality Control Measure in ClinicalTrials; Therapeutic Innovation & Regulatory Science October 2014, Vol. 48(6) 671-680