Embed Size (px)
Citation preview

1
Higher Specificity of NASBA Isothermal Technology Versus Real-Time PCR for HIV-1
1 RNA Quantification on Dried Blood Spots 2
3 S Mercier┽Delarueな┸ M Vrayに┸ JC Plantierぬ┸ T Maillardな┸ Z Adjoutな┸ F de Oliveraに┸ N 4 Schnepfな┸ S Maylinな┸ F Simonな and C Delaugerreな 5 6 な┽ Laboratoire de Virologie┸ AP┽(P┽(ôpital Saint Louis┸ )NSERM Uひねな┽Université Paris 7 Diderot┸ Sorbonne Paris Cité┸ Fばのねばの┸ Paris┸ France 8 に┽ Unité d╆Epidémiologie des Maladies Emergentes┸ )nstitut Pasteur┸ )NSERM┸ Paris┸ 9 France 10 ぬ┽Laboratoire associé au CNR du V)( hôpital Ch┻ Nicolle┸ C(U de Rouen┸ EAにはのは┽GRAM┻ 11 Université de Rouen┸ Rouen┸ France 12
13
Corresponding author 14 Dr Constance Delaugerre 15 Laboratoire de Virologie 16 (ôpital Saint Louis 17 な avenue Claude Vellefaux 18 ばのどなど Paris┸ France 19 Phone┺ ぬぬ ゅどょ なねにねひひねひど 20 Fax┺ ぬぬ ゅどょ なねにねひひにどど 21 constance┻delaugerrehsls┻aphp┻fr 22 23 Running head┺ ()V┽な RNA Quantification in Dried Blood Spots 24 Key words┺ ()V┽な┸ viral load┸ NASBA┸ PCR┸ DBS┸ whole blood┸ plasma 25 26 Number of words┺ text┺ ぬなひひ┸ abstract┺ にひぬ 27 28
29
JCM Accepts, published online ahead of print on 16 October 2013J. Clin. Microbiol. doi:10.1128/JCM.01848-13Copyright © 2013, American Society for Microbiology. All Rights Reserved.
on March 23, 2020 by guest
http://jcm.asm
.org/D
ownloaded from

2
Abstract 30 Dried blood spots ゅDBSょ are widely proposed as a plasma surrogate for monitoring 31 antiretroviral treatment efficacy based on the ()V┽な RNA level ゅviral load┸ VLょ in 32 resource┽limited settings┻ )nterfering co┽amplification of cell┽associated ()V┽な DNA 33 during RT┽PCR could be avoided by using NASBA technology┸ which is based on an RNA 34 template and isothermic conditions┻ We analyzed VL values obtained with DBS and 35 plasma samples analyzed using isotherm NASBA ゅNucliSENS EasyQk ()V┽な Vに┻ど┸ 36 BioMérieuxょ by comparison with real┽time RT┽PCR ゅCOBASk Taqman ()V┽な Vに┻ど┸ 37 Rocheょ┻ Samples from なひば ()V┽な┽infected patients were tested ゅnon┽B subtypes in のなガ 38 of casesょ┻ Nucleic acids extractions were performed Nuclisens EasyMAGk ゅbioMérieuxょ 39 and COBASkAmpliPrep ゅRocheょ before the NASBA and the RT┽PCR quantification┸ 40 respectively┻ Both quantification assays have lower detection limits of にど ゅな┻ぬょ and ぱどど 41 ゅに┻ひょ logなど copies【ml ゅlogょ in plasma and DBS┸ respectively┻ The mean ゅDBS┽plasmaょ 42 difference was ┽ど┻ぬひ and ┽ど┻ねは log┸ respectively┸ for RT┽PCR and NASBA┻ RT┽PCR on DBS 43 identified virological failure in なにに of なには patients ゅsensitivity ひばガょ and viral 44 suppression in のぱ of ばど patients ゅspecificity ぱぬガょ┸ yielding なに false┽positive results 45 ゅmedian ぬ┻に logょ┻ NASBA on DBS identified virological failure in ぱの of ひは patients 46 ゅsensitivity ぱひガょ and viral suppression in ひの of ひば patients ゅspecificity ひぱガょ┸ yielding に 47 false┽positive results ゅぬ┻ど log for bothょ┻ Both technologies detected ()Vな┽RNA in DBS at a 48 threshold of ぱどど copies【ml┻ This higher specificity of NASBA technology could avoid 49 overestimation of poor compliance or the emergence of resistance when monitoring 50 antiretroviral efficacy with the DBS method┻ 51
52
on March 23, 2020 by guest
http://jcm.asm
.org/D
ownloaded from

3
Introduction 53 The increasing availability of antiretroviral drugs for ()V┽infected populations in 54 developing countries calls for more field┽friendly methods for ()V┽な viral load 55 monitoring during treatment┻ 56 The gold standard for ()V┽な viral load measurement is analysis of plasma samples by 57 means of reverse transcription┽polymerase chain reaction ゅRT┽PCRょ┸ isothermal nucleic 58 acid┽based amplification assay ゅNASBAょ┸ or branched DNA signal amplification assay 59 ゅbDNAょ┻ As viral load assay currently requires adequate facilities with complex 60 equipment and specialized personnel┸ shipment of plasma samples to reference 61 laboratories has been proposed as an alternative┻ (owever┸ this requires cool storage 62 and compliance with strict regulations governing the transport of infectious substances┻ 63 Dried fluid spot specimens have been shown to be a viable alternative to plasma 64 specimens for PCR┽based early diagnosis of ()V┽な infection in infants ゅな‒ぬょ┻ Dried blood 65 spot ゅDBSょ specimens are particularly suited to resource┽limited settings┸ because they 66 require minimal training to prepare┻ Furthermore┸ DBS are stable at ambient 67 temperature for several weeks ゅねょ┸ are deemed nonhazardous once dried┸ and can be 68 shipped by regular mail to specialized reference laboratories for ()V┽な RNA 69 quantification ゅの‒ひょ┻ 70 The sensitivity of viral load analysis on DBS is an important factor┸ especially for 71 detecting viral rebound in ART┽experienced patients┻ Four main commercial assays for 72 ()V┽な RNA quantification have been evaluated on DBS samples┺ NASBA ゅOrganon 73 Technika┸ Durham┸NCょ┸ NucliSens ゅBioMerieux┸ Lyon┸ Franceょ┸ Amplicor ()V┽な Monitor 74 ゅRoche Diagnostics Molecular Systems┸ Alameda┸ CAょ and Abbott Real┽Time ()V┽な 75 ゅAbbott Diagnostics Des Plaines┸ Chicago┸ )Lょ┸ with detection thresholds between ぬ┻の and 76
on March 23, 2020 by guest
http://jcm.asm
.org/D
ownloaded from
4
ね log copies per milliliter ゅは┸ ば┸ ひょ┻ Sensitivity is lower with DBS than with plasma 77 samples┸ by around ┽ど┻ぬ to ┽ど┻ぱ log ゅなど‒なにょ┻ 78 Recent evaluation of NucliSENS EasyQ ()V┽な Vに┻ど ゅbased on NASBA technologyょ on DBS 79 and plasma samples in different storage conditions ゅtemperature┸ humidity and 80 durationょ showed that DBS samples yielded などどガ specificity┸ linear results over a wide 81 range of viral loads┸ and a detection limit of ぱどど copies【mlゅなぬょ┻ This complies with 82 recent W(O guidelines defining virological failure as plasma ()Vな RNA above などどど 83 copies【ml ゅなねょ┻ 84 Most relevant studies have been performed on samples from patients living in Africa┸ 85 where ()V┽な viral diversity is very high┻ (owever┸ the accuracy of ()V┽な quantification 86 in DBS versus plasma samples has not been studied according to different ()V┽な 87 subtypes┻ 88 89 )n whole blood┸ ()V nucleic acids are present as RNA in the plasma matrix and as DNA in 90 the cell matrix┻ Most platforms used to after acid nucleics extraction┸ RT┽PCR to amplify 91 conserved regions of the ()V┽な genome┻ RT┽PCR may thus co┽amplify both RNA and 92 DNA┸ if present┸ potentially leading to false┽positive results for virological failure┻ 93 Conversely┸ NASBA technology is based on the use of an RNA template to initiate 94 amplification in isothermic conditions┸ thus avoiding amplification of any viral DNA┻ The 95 frequency of false┽positive results for virological failure has not been compared between 96 RT┽PCR and NASBA┻ 97 (ere we compared the isotherm NASBA assay ゅNucliSENS EasyQk ()V┽な Vに┻ど┸ 98 BioMérieuxょ with a real┽time RT┽PCR based assay ゅCOBASk Taqman ()V┽な Vに┻ど┸ Rocheょ 99 for ()V┽な RNA quantification in a large number of DBS and plasma specimens containing 100 a broad range of viral loads and ()V┽な subtypes┻ 101
on March 23, 2020 by guest
http://jcm.asm
.org/D
ownloaded from

5
102
Methods 103
Ethics statements 104 This was a non┽interventional study with no addition to usual procedures┻ Biological 105 specimens were obtained only for standard viral diagnosis requested by physicians ゅno 106 specific sampling┸ no modification of the sampling protocol┸ no supplementary questions 107 in the national standardized questionnaireょ┻ The results were analyzed using an 108 anonymized database┻ French Public (ealth Law CSP Art┻ L ななにな┽な┻な states that such 109 studies without supplemental blood sampling do not require ethical approval┸ and only 110 oral informed consent┻ The CPP )le de France )V ethics committee waived the 111 requirement for ethical approval ゅagreement number )RB どどどどぬぱぬのょ┻ 112 113
Preparation of DBS samples 114 We prospectively collected なひば plasma and whole┽blood samples from EDTA tubes sent 115 to the laboratory for ()V┽な resistance genotyping┸ as recommended in antiretroviral┽116 naïve patients and in patients with suspected treatment failure ゅplasma viral load ゅpVLょ 117 above のど copies【mlょ┻ This yielded a wide range of pVL values and allowed us to take 118 ()V┽な strain diversity into account┻ Before centrifugation┸ fresh blood was thoroughly 119 homogenized┻ Aliquots of のど ヅl of whole blood from each patient were spotted on filter 120 paper ゅno┻ ひどぬ Protein SaverTM cards┸ Whatman┸ five spots per cardょ then air┽dried and 121 stored in sealed bags at ambient temperature┻ 122 Plasma┸ collected after にど minutes of centrifugation at ぬどどど g┸ was stored at ‒ ぱどソC in 123 な┻の┽mL aliquots for batch testing┻ One ml of each plasma sample was processed 124 according to the instructions of the manufacturers of the NucliSENS EasyMAG and 125 COBASkAmpliPrep assays┻ 126
on March 23, 2020 by guest
http://jcm.asm
.org/D
ownloaded from

6
127
Viral load determination by NASBA 128 Each DBS on each card was cut out using sterile scissors┻ For each analysis┸ two spots 129 from each patient ゅtotal などど ヅlょ were eluted in に ml of NucliSENS Lysis Buffer and 130 incubated on a roller mixer for に hours at room temperature┻ The filter paper was then 131 removed from the tube and the lysate was further processed using NucliSENS 132 EasyMAGk according to the manufacturer╆s instructions┹the total lysate volume of に mL 133 was used for extraction ゅbioMerieux┸ょ┻ Nucleic acids were isolated using Boom╆s silica┽134 based technology┻ 135 Viral load was also quantified with NucliSENS EasyQk ()V┽な Vに┻ど ゅbioMerieux┸ Lyon┸ 136 Franceょ according to the manufacturer╆s instructions┻ The linear dynamic range of this 137 assay spans にの ゅな┻ね logなどょ to ぬ どどど どどど ゅは┻ね logなどょ ()V RNA copies【ml when な ml of 138 plasma is used┻ The lower limit of quantification is ぱどど copies【ml when に spots of のど ヅl 139 of whole blood are used ゅなぬょ┻ The limit of detection is などど copies【ml┸ and qualitative 140 results are obtained below ぱどど copies【ml ゅnegative ジなどど copies【ml┸ positive between 141 などど and ぱどど copies【mlょ┻ 142 143
Viral load determination by RT-PCR 144 Two spots per patient were eluted as described above for the NASBA method┻ One 145 milliliter of lysis buffer was extracted using COBASkAmpliPrep┸ leading to a doubling of 146 real pVL values throughout the analysis┻ 147 Total nucleic acids were extracted from plasma and DBS samples by using the 148 COBASkAmpliPrep ゅRocheょ system┸ which uses a generic silica┽based capture method┻ 149 Viral load was then measured with COBASk Taqman ()V┽な Vに┻ど ゅRocheょ according to 150 the manufacturer╆s instructions┻ The linear dynamic range of the assay spans にど ゅな┻ぬ 151
on March 23, 2020 by guest
http://jcm.asm
.org/D
ownloaded from
7
logなどょ to など どどど どどど ゅば logなどょ ()V RNA copies【ml when な ml of plasma is used┻ As no 152 information was available for its use on DBS┸ we decided to use the same limit of 153 quantification and detection cutoffs of ぱどど and などど copies【ml┸ respectively┸ as for the 154 NucliSENS EasyQk ()V┽な Vに┻ど assay┻ 155
156
Determination of HIV-1 subtypes 157 The ()V┽な subtype was determined by sequencing the Pol region ゅprotease and reverse 158 transcriptaseょ on a なは┽capillary sequencer ゅAB) PR)SM Genetic Analyzer┸ Applied 159 Biosystems┸ Les Ulis┸ Franceょ┸ with respect to the Los Alamos ()V sequence database 160 ゅ()V BLAST┸ URL┺ http┺【【www┻hiv┻lanl┻gov【ょ┻ When this sequencing method failed┸ 161 serotyping was performed as previously described ゅなのょ and the results were expressed 162 as subtype B or non┽B┻ 163
164
Statistical analysis (MV) 165 To evaluate correlations between the different technologies┸ all viral RNA values were 166 recorded as logなど transformed copy numbers of ()V┽な RNA per milliliter of DBS or 167 plasma┻ Negative samples and samples below the detection threshold were attributed 168 the lower threshold value┸ while those above など どどど どどど copies were attributed a value 169 of など どどど どどど copies【ml┻ Results obtained for DBS specimens were not corrected for the 170 hematocrit┻ 171 172 For each method┸ pVL was expressed as logなど copies【ml┸ together with the median┸ 173 interquartile ranges にの and ばの┸ and mean グ SD┸ both for all the plasma and DBS samples 174 and also according to the ()V┽な subtype ゅB versus non┽Bょ┻ The Mann┽Whitney two┽175 sample test was used to compare median VL values according to the viral subtype┻ 176
on March 23, 2020 by guest
http://jcm.asm
.org/D
ownloaded from

8
The Spearman rank correlation test and intra┽class correlation coefficient were used to 177 measure the correlation between RNA values obtained for DBS and plasma samples with 178 each technology┻ The concordance between DBS and plasma samples was assessed by 179 using the Bland and Altman approach┸ in which the differences in VL ゅequal and above 180 に┻ひ logょ in the two sample types were plotted against the mean VL of each technology┻ 181 Agreement on the detection of virological failure┸ using a threshold of ぱどど copies【ml 182 ゅに┻ひ logなどょ┸ in DBS and plasma samples with each technology was assessed by using 183 kappa statistics and the Landis┽Koch interpretation scale ゅkappa values ジど┻ねど サ poor 184 agreement┹ values スど┻ねど and ジど┻ばの サ fair to good agreement┹ and values スど┻ばの サ 185 excellent agreementょ┻ P values were determined using Fisher╆s exact test┻ 186 All analyses were performed with STATA statistical software ゅversion なにょ┻ Differences 187 were considered significant when P values were below ど┻どの┻ 188
189
Results 190
HIV-1 quantification according to the viral subtype 191 Paired plasma┽DBS specimens from なひば patients were collected and tested with both 192 technologies┻ ()V┽な subtype results were available for なぱば ゅひね┻ねガょ patients and were in 193 keeping with the subtype diversity in France ゅなはょ┻ Among these なぱば patients┸ ひな ゅねひガょ 194 were infected by B subtype and ひは ゅのなガょ by non┽B subtypes┸ as follows┺ にぱ ゅなのガょ 195 CRFどにeAG┸ なば ゅひガょ complex recombinants┸ ね ゅにガょ G┸ ね ゅにガょ F┸ ぬ ゅな┻はガょ A┸ ぬ ゅな┻はガょ (┸ に 196 ゅなガょ CRFどなeAE┸ に ゅなガょ CRFににeどなAな┸ な ゅど┻のガょ CRFなぱecpx┸ な ゅど┻のガょ CRFぬはecpx and な 197 ゅど┻のガょ CRFねのecpx┻ The remaining ぬど samples ゅなはガょ could not be genotyped but were 198 classified as non┽B by serotyping┻ The viral subtypes were grouped together as B or non┽199 B for subsequent analysis┻ 200 201
on March 23, 2020 by guest
http://jcm.asm
.org/D
ownloaded from

9
Table な shows the median ゅ)QRにの┽ばのょ VL values obtained on DBS and plasma samples 202 with the two technologies┸ both for all samples and according to the B and nonB subtype┻ 203 Overall┸ median VL values in plasma and DBS were ぬ┻に and ぬ┻ね log copies【ml┸ 204 respectively┸ with the RT┽PCR method┸ and に┻ぱ and に┻ひ log copies【ml┸ respectively┸ with 205 the NASBA method┻ No difference was found between B and non B subtypes with either 206 method ゅpジ ど┻の for all comparisonsょ┻ 207 208
Correlation between DBS and plasma values obtained by RT-PCR 209 Among the などの samples with plasma VL スに┻ひ log by RT┽PCR┸ the mean ギ SD values for 210 plasma and DBS samples┸ respectively┸ were ね┻ば グ ど┻ぱは log copies【ml and ね┻ぬ グ ど┻ぱど log 211 copies【ml┸ and the medians い)QRう were ね┻ぱ いね┻に┹ の┻にう log and ね┻ぬ いぬ┻ば┹ ね┻ひう log┻ 212 The correlation coefficient for plasma and DBS VL values was rに サ ど┻ばは ゅfigure なa┸ 213 Spearman rank correlation testょ and the intra┽class correlation coefficient ゅconfidence 214 interval┸ C)ょ was ど┻ばば ゅど┻はひ ‒ ど┻ぱのょ┻ The Bland Altman plot in figure なb shows that the 215 mean of the difference between DBS and plasma was ┽ど┻ぬひ log ゅlimits of agreement from 216 ┽な┻には to ど┻ねばょ┸ regardless of the VL level and viral subtype┻ A significant difference was 217 observed for は samples ゅの┻ばガょ┸ with の ゅぬ non┽B and に B subtypesょ above the upper limit 218 ゅど┻ねば logょ in DBS compared to plasma┸ and な non┽B subtype above the lower limit ゅ┽な┻には 219 logょ in plasma compared to DBS ゅFigure なbょ┻ 220 221
Correlation between DBS and plasma values obtained by NASBA 222 Using NASBA technology┸ among the ひぬ samples with pVL スに┻ひ log┸ the mean ギ SD values 223 for plasma and DBS┸ respectively┸ were ね┻の グ ど┻ぱな logなど copies【ml and ね┻ど グ ど┻ばひ log 224 copies【ml┸ and the medians い)QRう were ね┻の いぬ┻ひ┹ の┻にう log and ね┻ど いぬ┻ね┹ ね┻はう log┻ 225
on March 23, 2020 by guest
http://jcm.asm
.org/D
ownloaded from

10
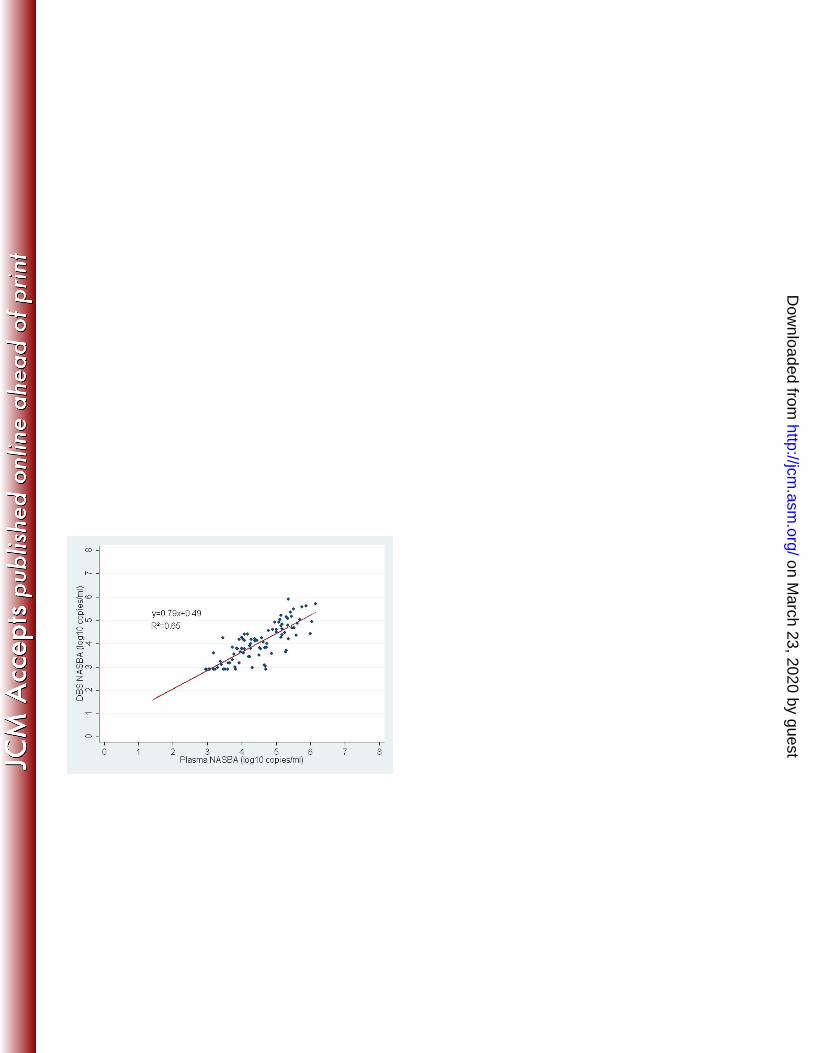
The correlation coefficient for viral loads in plasma versus DBS was ど┻はの ゅfigure にa┸ 226 Spearman rank correlation testょ and the intra┽class correlation coefficient ゅC)ょ was ど┻はば 227 ゅど┻のは ‒ ど┻ばぱょ┻ The Bland Altman plot in figure にb shows that the mean of the difference 228 between DBS and plasma was ┽ど┻ねは log ゅlimits of agreement from ┽な┻ねは to ど┻ののょ┸ 229 regardless of the VL level and viral subtype┻ A significant difference was observed for ば 230 ゅば┻のガょ samples┸ with two B subtypes above ど┻のの log on DBS compared to plasma┸ and の 231 ゅぬ B and に non┽B subtypesょ above ┽な┻ねは log in plasma compared to DBS┻ 232
233
Concordance of RNA viral loads measured in DBS and plasma with RT-PCR and NASBA 234 The reliability of DBS specimens for detecting virological failure was evaluated by using 235 plasma specimens as the reference for each method┸ and the recommended threshold 236 ゅぱどど copies【mlょ┻ As shown in Table に┸ there was excellent overall agreement between 237 DBS and plasma specimens for detecting VL above ぱどど copies【ml┸ with P values of 238 ジど┻どどな for both methods and kappa statistics of ど┻ぱに ゅRT┽PCRょ and ど┻ぱは ゅNASBAょ┻ RT┽239 PCR correctly identified virological failure on DBS specimens from なにに of the なには 240 patients concerned ゅsensitivity┸ ひばガ┸ positive predictive value┸ ひなガょ and viral 241 suppression on DBS specimens from のぱ of ばど patients ゅspecificity┸ ぱぬガ┹ negative 242 predictive value┸ ひねガょ┻ PCR on DBS specimens yielded なに false┽positive results ゅmedian 243 ぬ┻に ゅrange に┻ひ┽ぬ┻はょ log┸ with ぱ B┸ one non┽B┸ and ぬ undetermined subtypesょ┻ 244 Likewise┸ NASBA correctly identified virological failure on DBS specimens from ぱの of the 245 ひは patients concerned and viral suppression in ひの of ひば patients ゅpositive predictive 246 value┸ ひぱガ┹ negative predictive value┸ ひどガょ┻ NASBA on DBS yielded に false┽positive 247 results ゅに B subtypes┸ ぬ┻ど log for bothょ┻ 248 249
250
on March 23, 2020 by guest
http://jcm.asm
.org/D
ownloaded from

11
Discussion 251 The NASBA and RT┽PCR methods each gave similar VL values for DBS and plasma 252 specimens┸ with high correlation coefficients ゅスど┻ぱどょ and few values outside the 253 agreement limits of the Bland Altman plot ゅジば┻のガょ┻ )n keeping with previous data 254 obtained in countries with strong ()V diversity ゅなばょ┸ we found no significant difference 255 in VL values between B and non B subtypes ゅぱ┸ ひ┸ なに┸ なぱょ┸ although it should be noted 256 that we grouped together all non┽B subtypes for analysis┸ while these subtypes 257 encompass broad genetic diversity┻ 258 259 Overall┸ VL values obtained with DBS specimens tended to be lower than those obtained 260 with the corresponding plasma samples┸ with a mean difference of around ど┻ね logなど 261 copies【ml┻ This difference has previously been noted with the Nuclisens┸ Abbott and 262 Roche methods ゅなど┸ ななょ and is due likely to differences in specimen volume and in the 263 quality of nucleic acid extraction┻ VL values obtained with DBS specimens should not 264 thus be compared with VL values previously obtained on plasma samples when 265 monitoring therapeutic efficacy in a given patient┻ 266 A lower limit of ()V┽な RNA detection above のどどど copies【mL has been reported for DBS 267 specimens ゅなど┸ ななょ┻ This was in keeping with にどなに World (ealth Organization ゅW(Oょ 268 recommendations in which persistent VL above のどどど copies【mL was considered to 269 confirm treatment failure┻ (owever┸ the new W(O guideline presented in June にどなぬ 270 defines virological failure as a plasma VL above などどど copies【mL ゅなねょ┻ We therefore 271 analyzed the performance of DBS and plasma samples for detecting virological failure at 272 a threshold of ぱどど copies【ml┸ a threshold validated for the NucliSENS EasyQ ()V┽な Vに┻ど 273 test┻ Excellent overall agreement was obtained between DBS and plasma specimens for 274 detecting VL above ぱどど copies【ml┻ Both methods detected virological failure on DBS 275
on March 23, 2020 by guest
http://jcm.asm
.org/D
ownloaded from

12
specimens with high sensitivity ゅfrom ぱひガ to ひばガょ┻ (owever┸ specificity was lower 276 with RT┽PCR ゅぱぬガょ than with NASBA ゅひぱガょ┸ leading to more false┽positive results for 277 virological failure┻ This is in keeping with a previous study of whole┽blood samples ゅなぱょ┸ 278 in which はね ゅにぬガょ of にばぱ ╅undetectable╆ plasma specimens ゅジ のどど copies【mlょ analyzed 279 with COBAS Taqman real┽time RT PCR ゅRocheょ were positive on their corresponding 280 DBS samples┻ PCR co┽amplifies cell┽associated ()V DNA with ()V RNA┸ whereas the 281 NASBA method with its isothermal amplification design minimizes the contribution of 282 proviral DNA to VL measurement┻ Our study confirms this higher rate of false┽positives 283 with RT┽PCR ゅななガょ than with NASBA ゅにガょ┸ at a threshold of ぱどど copies【ml┻ A modified 284 extraction procedure specific for RNA has recently been proposed to avoid this DNA co┽285 amplification┻ Using the ABBOT RealTime ()V┽な assay based on RT┽PCR technology┸ 286 Mbida et al found a lower rate of false┽positive amplification┸ as all plasma samples that 287 were ╅undetectable╊ were also undetectable on the corresponding DBS ゅひょ┻ As RT┽PCR is 288 widely available in developing countries┸ DNA co┽amplification could be avoided by 289 specific RNA extraction┸ the use of DNAse┸ or raising the VL quantification threshold 290 above ぬ log┻ )n contrast┸ co┽amplification of ()V DNA and RNA by PCR may be useful for 291 diagnosing ()V infection in newborns receiving preventive antiretroviral treatment┻ 292 293 )n conclusion┸ dried blood specimens are a suitable alternative to plasma samples for 294 ()V┽な viral load measurement┻ )ndeed┸ both PCR and NASBA gave satisfactory results on 295 DBS by comparison with plasma┸ for both B and non┽B subtypes┸ the latter being most 296 prevalent in resource┽limited settings ゅなばょ┻ DBS correctly identified virological failure at 297 the new W(O threshold of などどど copies【ml┸ but the NucliSENS EasyQ ()V┽な vに┻ど assay 298 showed better specificity than RT┽PCR┻ This NASBA method can thus accurately detect 299
on March 23, 2020 by guest
http://jcm.asm
.org/D
ownloaded from

13
treatment failure at an early stage┸ allowing rescue intervention to avoid accumulation 300 of drug resistance mutations┻ 301 302
303
on March 23, 2020 by guest
http://jcm.asm
.org/D
ownloaded from

14
Acknowledgments 304 We thank BioMerieux and Roche for kindly providing reagents┻ 305 306
References 307 な┻ Comeau AM, Pitt J, Hillyer GV, Landesman S, Bremer J, Chang BH, Lew J, 308
Moye J, Grady GF, McIntosh K┻ なひひは┻ Early detection of human immunodeficiency virus 309 on dried blood spot specimens┺ sensitivity across serial specimens┻ Women and )nfants 310 Transmission Study Group┻ J┻ Pediatr┻ 129┺ななな‒ななぱ┻ 311 に┻ Sherman GG, Stevens G, Jones SA, Horsfield P, Stevens WS┻ にどどの┻ Dried blood 312 spots improve access to ()V diagnosis and care for infants in low┽resource settings┻ J┻ 313 Acquir┻ )mmune Defic┻ Syndr┻ 38┺はなの‒はなば┻ 314 ぬ┻ Stevens W, Erasmus L, Moloi M, Taleng T, Sarang S┻ にどどぱ┻ Performance of a 315 novel human immunodeficiency virus ゅ()Vょ type な total nucleic acid┽based real┽time 316 PCR assay using whole blood and dried blood spots for diagnosis of ()V in infants┻ J┻ Clin┻ 317 Microbiol┻ 46┺ぬひねな‒ぬひねの┻ 318 ね┻ Monleau M, Butel C, Delaporte E, Boillot F, Peeters M┻ にどなど┻ Effect of storage 319 conditions of dried plasma and blood spots on ()V┽な RNA quantification and PCR 320 amplification for drug resistance genotyping┻ J┻ Antimicrob┻ Chemother┻ 65┺なのはに‒なのはは┻ 321 の┻ Alvarez-Muñoz MT, Zaragoza-Rodríguez S, Rojas-Montes O, Palacios-322
Saucedo G, Vázquez-Rosales G, Gómez-Delgado A, Torres J, Muñoz O┻ にどどの┻ (igh 323 correlation of human immunodeficiency virus type┽な viral load measured in dried┽blood 324 spot samples and in plasma under different storage conditions┻ Arch┻ Med┻ Res┻ 36┺ぬぱに‒325 ぬぱは┻ 326 は┻ Amellal B, Katlama C, Calvez V┻ にどどば┻ Evaluation of the use of dried spots and of 327 different storage conditions of plasma for ()V┽な RNA quantification┻ ()V Med┻ 8┺ぬひは‒328 ねどど┻ 329 ば┻ Brambilla D, Jennings C, Aldrovandi G, Bremer J, Comeau AM, Cassol SA, 330
Dickover R, Jackson JB, Pitt J, Sullivan JL, Butcher A, Grosso L, Reichelderfer P, 331
Fiscus SA┻ にどどぬ┻ Multicenter evaluation of use of dried blood and plasma spot 332 specimens in quantitative assays for human immunodeficiency virus RNA┺ 333 measurement┸ precision┸ and RNA stability┻ J┻ Clin┻ Microbiol┻ 41┺なぱぱぱ‒なぱひぬ┻ 334
on March 23, 2020 by guest
http://jcm.asm
.org/D
ownloaded from

15
ぱ┻ Mwaba P, Cassol S, Nunn A, Pilon R, Chintu C, Janes M, Zumla A┻ にどどぬ┻ Whole 335 blood versus plasma spots for measurement of ()V┽な viral load in ()V┽infected African 336 patients┻ Lancet 362┺にどはば‒にどはぱ┻ 337 ひ┻ Mbida AD, Sosso S, Flori P, Saoudin H, Lawrence P, Monny-Lobé M, Oyono Y, 338
Ndzi E, Cappelli G, Lucht F, Pozzetto B, Oukem-Boyer OOM, Bourlet T┻ にどどひ┻ 339 Measure of viral load by using the Abbott Real┽Time ()V┽な assay on dried blood and 340 plasma spot specimens collected in に rural dispensaries in Cameroon┻ J┻ Acquir┻ )mmune 341 Defic┻ Syndr┻ 52┺ひ‒なは┻ 342 など┻ Monleau M, Montavon C, Laurent C, Segondy M, Montes B, Delaporte E, 343
Boillot F, Peeters M┻ にどどひ┻ Evaluation of different RNA extraction methods and storage 344 conditions of dried plasma or blood spots for human immunodeficiency virus type な 345 RNA quantification and PCR amplification for drug resistance testing┻ J┻ Clin┻ Microbiol┻ 346
47┺ななどば‒なななぱ┻ 347 なな┻ Garrido C, Zahonero N, Corral A, Arredondo M, Soriano V, De Mendoza C┻ 348 にどどひ┻ Correlation between human immunodeficiency virus type な ゅ()V┽なょ RNA 349 measurements obtained with dried blood spots and those obtained with plasma by use 350 of Nuclisens EasyQ ()V┽な and Abbott RealTime ()V load tests┻ J┻ Clin┻ Microbiol┻ 351
47┺などぬな‒などぬは┻ 352 なに┻ Rottinghaus EK, Ugbena R, Diallo K, Bassey O, Azeez A, Devos J, Zhang G, 353
Aberle-Grasse J, Nkengasong J, Yang C┻ にどなに┻ Dried blood spot specimens are a 354 suitable alternative sample type for ()V┽な viral load measurement and drug resistance 355 genotyping in patients receiving first┽line antiretroviral therapy┻ Clin┻ )nfect┻ Dis┻ 356
54┺ななぱば‒ななひの┻ 357 なぬ┻ Van Deursen P, Oosterlaken T, Andre P, Verhoeven A, Bertens L, Trabaud 358
MA, Ligeon V, De Jong J┻ にどなど┻ Measuring human immunodeficiency virus type な RNA 359 loads in dried blood spot specimens using NucliSENS EasyQ ()V┽な vに┻ど┻ J┻ Clin┻ Virol┻ 360
47┺なにど‒なにの┻ 361 なね┻ World Health Organization┻ にどなぬ┻ Consolidated guidelines on the use of 362 antiretroviral drugs for treating and preventing ()V infection┻ 363 http┺【【www┻who┻int【hiv【pub【guidelines【arvにどなぬ【download【en【index┻html┻ 364 なの┻ Barin F, Plantier J-C, Brand D, Brunet S, Moreau A, Liandier B, Thierry D, 365
Cazein F, Lot F, Semaille C, Desenclos J-C┻ にどどは┻ (uman immunodeficiency virus 366
on March 23, 2020 by guest
http://jcm.asm
.org/D
ownloaded from

16
serotyping on dried serum spots as a screening tool for the surveillance of the A)DS 367 epidemic┻ J┻ Med┻ Virol┻ 78 Suppl 1┺Sなぬ‒なぱ┻ 368 なは┻ Chaix M-L, Seng R, Frange P, Tran L, Avettand-Fenoël V, Ghosn J, Reynes J, 369
Yazdanpanah Y, Raffi F, Goujard C, Rouzioux C, Meyer L, ANRS PRIMO Cohort Study 370
Group┻ にどなぬ┻ )ncreasing ()V┽な non┽B subtype primary infections in patients in France 371 and effect of ()V subtypes on virological and immunological responses to combined 372 antiretroviral therapy┻ Clin┻ )nfect┻ Dis┻ 56┺ぱぱど‒ぱぱば┻ 373 なば┻ Taylor BS, Sobieszczyk ME, McCutchan FE, Hammer SM┻ にどどぱ┻ The challenge 374 of ()V┽な subtype diversity┻ N┻ Engl┻ J┻ Med┻ 358┺なのひど‒なはどに┻ 375 なぱ┻ Waters L, Kambugu A, Tibenderana H, Meya D, John L, Mandalia S, 376
Nabankema M, Namugga I, Quinn TC, Gazzard B, Reynolds SJ, Nelson M┻ にどどば┻ 377 Evaluation of filter paper transfer of whole┽blood and plasma samples for quantifying 378 ()V RNA in subjects on antiretroviral therapy in Uganda┻ J┻ Acquir┻ )mmune Defic┻ Syndr┻ 379
46┺のひど‒のひぬ┻ 380 381 382
383
on March 23, 2020 by guest
http://jcm.asm
.org/D
ownloaded from

17
Legends 384
Figures 385
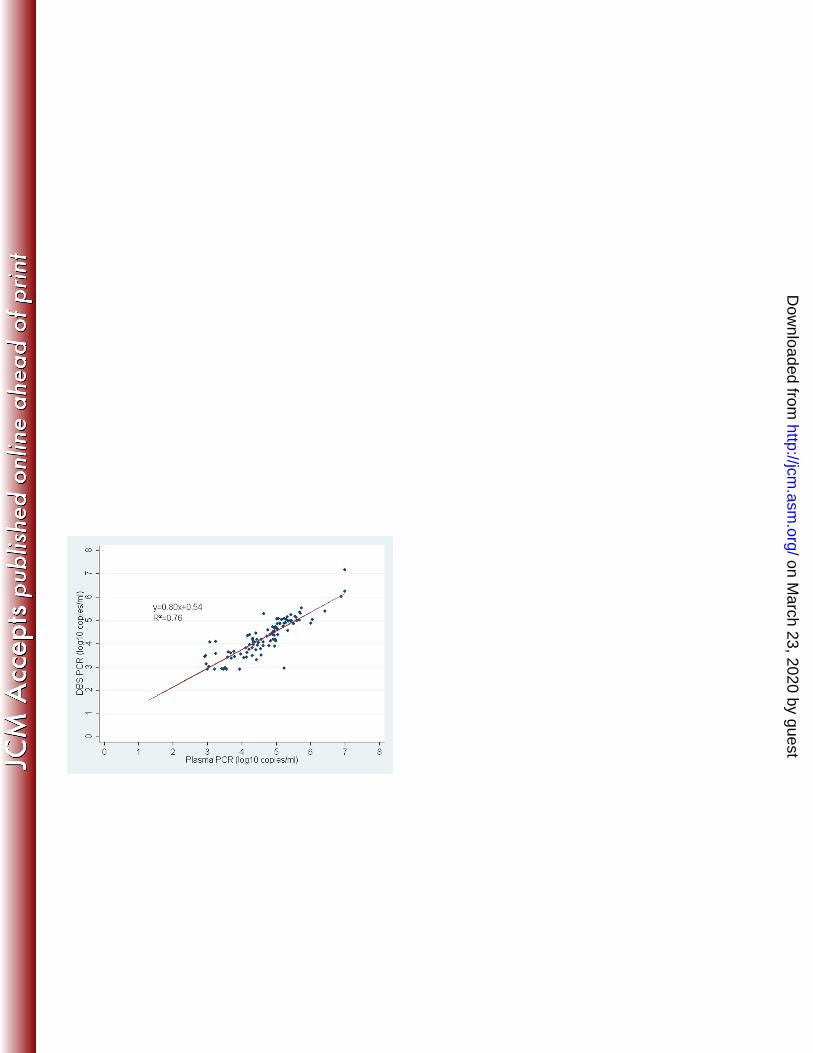
Figure 1a: Correlation curve for VL on plasma and DBS using RT-PCR 386
Figure 1b: Bland Altman representation of VL in plasma and DBS using RT-PCR 387
388
Figure 2a: Correlation curve for VL on plasma and DBS using NASBA 389
Figure 2b: Bland Altman representation of VL in plasma and DBS using NASBA 390
391
392
Tables 393
Table 1: HIV-1 viral load (Log) by RT-PCR and NASBA on DBS and plasma samples, 394
according to the viral subtype (B versus non-B) 395
396
Table 2: Concordance between RT-PCR and NASBA for identifying virological 397
failure on plasma and DBS 398 PPV┺ positive predictive value┸ NPV┺ negative predictive value 399
400
401
on March 23, 2020 by guest
http://jcm.asm
.org/D
ownloaded from

18
402
Table 1: HIV-1 viral load (Log) determined by RT-PCR and NASBA on DBS and plasma, for 403
all samples and according to the viral subtype (B or non-B) 404
median (IQR) log10 copies/ml 405
406
Total
(N = 197)
B
(N = 91)
Non-B
(N = 96)
PCR
Plasma 3.2 (1.7-4.9) 3.5 (1.8-4.9) 3.3 (2.1-5)
DBS 3.4 (2.9-4.4) 3.4 (2.9-4.4) 3.6 (2.9-4.5)
NASBA
Plasma 2.8 (1.4-4.4) 2.8 (1.4-4.6) 3.4 (1.4-4.2)
DBS 2.9 (2.9-3.9) 2.9 (2.9-4.0) 2.9 (2.9-4.1)
on March 23, 2020 by guest
http://jcm.asm
.org/D
ownloaded from

19
Table 2: Concordance between RT-PCR and NASBA on plasma and DBS for identifying 407
virological failure 408
409 Plasma
Assay Type
and VL (log
copies/ml)
on DBS
specimens
VL < 2.9
log
copies/ml
VL > 2.9
log
copies/ml
Total
K Value, mean + SE
(95% Confidence
interval)
P Performance of
PCR and NASBA
assays,%
RT-PCR 0.82 + 0.04
(0.74 – 0.90)
<.001 Sensitivity, 97;
Specificity, 83;
PPV, 91; NPV 94
VL< 2.9 58 4 62
VL > 2.9 12 122 134
Total 70 126 196
NASBA 0.86 + 0.04
(0.78 – 0.94)
<.001 Sensitivity, 89;
Specificity, 98; PPV
98; NPV 90
VL< 2.9 95 11 106
VL > 2.9 2 85 87
Total 97 96 193
410
411
412
413
414
415 416 on March 23, 2020 by guest
http://jcm.asm
.org/D
ownloaded from

![Hacia la madurez espiritual - CC Eben-Ezer · À t } v v ] } (/ &$0,12 +$&,$ /$ 0$'85(= (63,5,78$/ ä ä ä ä ä ä ä ä ä ä ä ä ä ä ä ä ä ä ä ä ä ä ä ä ä ä ä](https://img.dokumen.tips/doc/110x75/5ee31624ad6a402d666d2e39/hacia-la-madurez-espiritual-cc-eben-t-v-v-012-.jpg)


![ºU º ØÑ¿É Ü RZ -AW3000M...MsMT¬ Ýb . Ø >± u>± Ô , g~ Ð gw ²t~hC ä XqÓè Äz à>± Í µ `o Ðy +q +t]x srw úU ÇMoMsM\q ¬ Ýb y hzÓè Äz à>± Í µ h ct ÇZ y¢](https://img.dokumen.tips/doc/110x75/5f877854dde559734e6c9165/u-oe-rz-aw3000m-msmt-b-u-g-gw.jpg)


![Psychometric properties of the Persian version of physical ...pejouhesh.sbmu.ac.ir/article-1-1741-fa.pdf · ʼ md»Z¸ Ä»ZÀ aÊ Z§Äz ¿ÊnÀ ½YÁ ÉZÅʳ ËÁÊ ] 6 µ P](https://img.dokumen.tips/doc/110x75/5f02c3cf7e708231d405e60d/psychometric-properties-of-the-persian-version-of-physical-mdz-z.jpg)
![, Äz ¿, à Z/¼ ,¹Á{µZ/ Ã|Ì/°qjast.modares.ac.ir/article-38-18897-en.pdf · 8zó~g28 8 ¼ IG¤$ 9 G 9 x{"®Î ÕY Äf ¾Ì]Ö Å Á a Ö¼¸ Ä» ZÀ¸ §, Äz ¿, à Z/¼](https://img.dokumen.tips/doc/110x75/5f993338f201192b740d5071/-z-f-z-z-foeqjast-8zg28-8-ig-9-g-9-x.jpg)


![[ lâ^]åz ^ú ¾W0e¹~ÆR Oá`oQl mO ÈN u( - zj.gov.cn](https://img.dokumen.tips/doc/110x75/61c56f650f69c34e676a7b83/-lz-w0er-ooql-mo-n-u-zjgovcn.jpg)