Double-digit gains in Net Sales and Op EBIT both YoY and sequentially
Net Sales up in all segments and regions YoY and sequential sales increase led by pricing gains in all segments
and regions
Volume in-line YoY ndash gains in construction mobility electronics and consumer durables end markets offset by supply constraints from Uri
Op EBIT up gt$700MM led by Packaging amp Specialty Plastics and Industrial Intermediates amp Infrastructure
Generated gt$750MM of cash flow from operating activities ndashcontinuing operations1 excluding the $1B elective pension contribution
2021 cash tailwind of ~$350MM YoY will be provided to Dow by Sadara debt reprofiling Sadara expected to be cash flow self-sufficient
1Q | 2021 HIGHLIGHTS
Net Sales up YoY
22
gt$310MM increase in YoY Equity Earnings
+450 bps Op EBIT Margin
Improvement YoY
3
$521MMReturned to shareholders
1 Cash used for operating activities ndash continuing operations was $228 million in the quarter
Y-o-
Y
Op EBIT uarr 112 Margin uarr 760bps
Driven by margin improvement and increased equity earnings
Q-o
-Q
Op EBIT uarr 57 Margins uarr 500bps
Local price gains in industrial and consumer packaging and flexible food and beverage
packaging margin uplift in HampE
1Q21 OPERATING SEGMENT PERFORMANCE
4609 5126 6082
30 00
35 00
40 00
45 00
50 00
55 00
60 00
65 00
1Q20 4Q20 1Q21
126152
202580
780
1228
0
200 00
400 00
600 00
800 00
100 000
120 000
140 000
1Q20 4Q20 1Q21
REVENUE ($MM) Op EBIT ($MM) amp Op EBIT Margin
Y-o-
Y
Sales uarr 32 Volume uarr 5 Price uarr 24
Strong supplydemand fundamentals local price gains in all regions volume growth in
both businesses and most regions
Q-o
-Q
Sales uarr 19 Volume darr 1 Price uarr 19
Continued pricing momentum across all regions and most applications particularly in
consumer packaging
Y-o-
Y
Op EBIT uarr 86 Margin uarr 330bps
Led by improved equity earnings and local price gains in both businesses
Q-o
-Q
Op EBIT uarr 10 Margins uarr 50bps
Driven by higher equity earnings including continued improvement at Sadara
3045 3501 3607
22 00
24 00
26 00
28 00
30 00
32 00
34 00
36 00
38 00
40 00
1Q20 4Q20 1Q21
175
296 326
57
85 90
60
110
160
210
260
310
360
0
1
2
3
4
5
6
7
8
9
10
1Q20 4Q20 1Q21
REVENUE ($MM)
Y-o-
Y
Sales uarr 18 Volume darr 6 Price uarr 21Local price gains in all regions increased consumer durable goods and appliances
demand partly offset by impacts from Winter Storm Uri
Q-o
-QSales uarr 3 Volume darr 10 Price uarr 12
Local price gains more than offset volume declines due to Winter Storm Uri impacts
Y-o-
Y
Op EBIT darr 62 Margin darr 490bps
Price gains and strong demand in coatings and silicones more than offset by the impact of the winter storm and planned maintenance
Q-o
-Q
Op EBIT uarr 24 Margins uarr 40bpsMargin expansion in performance silicones and coatings applications partially offset by
planned maintenance and winter storm impacts
2065 2029 2123
10 00
12 00
14 00
16 00
18 00
20 00
22 00
24 00
26 00
28 00
30 00
1Q20 4Q20 1Q21
78
25 29
162
50 62
0
500 0
100 00
150 00
200 00
250 00
300 00
350 00
400 00
450 00
500 00
1Q20 4Q20 1Q21
REVENUE ($MM)
Y-o-
Y
Sales uarr 3 Volume darr 4 Price uarr 4Price gains in all regions positive impacts from currency strong demand for silicone applications and DIY coatings more than
offset by supply constraints
Q-o
-Q
Sales uarr 5 Volume darr 1 Price uarr 5
Strong local price gains for acrylic monomers and siloxanes more than offset supply
constraints
Pack
agin
g amp
Spec
ialty
Pla
stic
sIn
d In
term
edia
tes
amp In
fras
truc
ture
Perf
Mat
eria
ls
amp C
oatin
gs
Op EBIT ($MM) amp Op EBIT Margin
Op EBIT ($MM) amp Op EBIT Margin
4
Winter Storm Uri amp Planned
Maintenance Impact
2Q21 MODELING GUIDANCE
5
Net Sales ~$124 ndash $129B Depreciation amp Amortization ~$715MM
Quarterly Operational Tax Rate ~21 ndash 25 Net Interest Expense (Net of Int Income) ~$185MM
Net Income Attrib to Non-Controlling Int ~$20MM Share Count ~750MM
Top-Line Ranges (2Q21 vs 1Q21)
Base Case Op EBIT Drivers(2Q21 vs 1Q21)
Sales ∆ QoQ
Low High
Packaging amp Specialty Plastics +3 +7
Add-Back 1Q21 Winter Storm Uri Impact (~$200MM tailwind) Continued strong demand for packaging applications globally further supported by seasonal increases Low inventory levels tight supply from industry outages Increased spend entering turnaround season USGC cracker planned maintenance activity (~$175MM headwind)
IndustrialIntermediates amp Infrastructure
+5 +10
Add-Back 1Q21 Winter Storm Uri Impact (~$150MM tailwind) Durable goods demand remains robust with industrial construction auto and oil amp gas end-markets continuing to improve Impact from third-party outages (~$100MM headwind) Increased turnaround spending at USGC sites primarily in polyurethanes (~$50MM headwind)
Performance Materials amp Coatings +5 +10
Add-Back 1Q21 Winter Storm Uri Impact (~$50MM tailwind) Demand strength for electronics mobility and home care applications in silicones Continued sequential demand improvement for architectural coatings Add-Back Turnarounds completed in Deer Park and Zhangjiagang (~$100MM tailwind)
Corporate Sales of $50MM Op EBIT of $(75)MM and Op EBITDA of $(65)MM
Recovery from Winter Storm Uri and continuation of robust demand leading to favorable market fundamentals
Corporate Op EBIT of ~$(275)MM and Op EBITDA of ~$(250)MM
Turnaround Costs Up ~$500MM YoY incl JVs incremental $100MM increase due to Winter Storm Uri impacts
Restructuring ~$300MM expected to be substantially complete by YE21 ~50 by mid-2021
Cash Flow Considerations in 2021
Dividends from Equity Companies ~$200MM (down ~$200MM YoY)
Sadara No cash outflow (~$350MM tailwind YoY)
DWDP Integration Separation and Synergy Costs
No cash outflow ($350MM tailwind YoY)
Pension Contributions
~$12B total cash outflow ($10B elective contribution completed in 1Q21)
Liability Management
~$10B elective contribution to pension reduces rating agency adjusted leverage
CapEx ~$16B (~350MM higher YoY)
2020 Restructuring Program ~$350MM cash outflow
Digital Initiative ~$150MM cash outflow
Other Income Statement Considerations
Net Interest Expense ~$775MM
DampA ~$29B
Net Income Attribto Non-Controlling Int ~$75MM (reduction to reported Net Income)
Share Count ~750MM
Op Tax Rate 21-25
POINTS OF DISTINCTION ENABLE CONTINUED OUTPERFORMANCE
7
End-market recovery benefits Dowrsquos consumer-led portfolio further enhancing performance and shareholder returns
Leading Cash Flow and Shareholder Remuneration Yield Attractive End Market Growth
Dow Continues to be a Compelling Investment Opportunity
bull ~$9B in Free Cash Flow1 generated
bull Disciplined focus drove 93 op cash flow conversion17
bull Free cash flow yield27 of ~11 best-in-class and well ahead of peers sector and overall market average
bull Best-in-class shareholder yield vs peers3
bull Top quartile cost management amp margin performance
1
Packaging ~15x GDP
Addressable Market$650B
Infrastructure ~13x GDP
Consumer ~15x GDP
Mobility ~15x GDP
Dow Peer Range4 SampP 500 Chemicals SampP 500
EVEBITDA NTM56 79x 50x ndash 99x 133x 146x
Free Cash Flow Yield27 106 22 - 79 36 46
Dividend Yield6 45 23 - 48 19 15
Net Debt Change8 darr ~$5B darr ~$3B to uarr ~$5B - -
Differentiated Portfolio with Leading Positions
1 Siloxanes
1 Acrylic Binders
1 Propylene Oxide
1 Propylene Glycol
1 Polyols
1 Purified Ethylene Oxide
1 Amines
1 Solvents
1 Ethylene
2 Polyethylene
1 Ethylene Copolymers
1 Polyethylene Licensing
1 Polyolefins Elastomers
1 Polyolefins Plastomers
(1) 2019 and 2020 total(2) 2019-2020 average(3) 2020
(4) Benchmarking peer set includes Arkema BASF Covestro Eastman Huntsman Lyondell Wacker
(5) NTM is defined as Next Twelve Months
(6) As of 03312021 FactSet (7) 2019 Dow data is on a pro forma basis (8) YE2020 vs YE2018
0
300
600
900
1200
2020 2022 2024 2026 2028 2030
MM
Mill
ion
Tonn
es Mechanical Recycling OtherPartnershipsAdvanced Recycling
PLASTIC CIRCULARITY ROADMAP DRIVES NEAR- AND LONG-TERM GROWTH
Through innovation collaboration and partnerships Dow is leading the way for sustainability in plastics
By 2030 Dow will STOP THE WASTE by enabling 1 million metric tons of plastic to be collected reused or recycled through its direct actions and partnerships
By 2035 Dow will CLOSE THE LOOP by enabling 100 of Dow products sold into packaging applications to be reusable or recyclable
1MM mta Target Plastic collected reused recycled
80
90
100
2020 2025 2030 2035
P
rodu
cts S
old Advanced Recycling
Application Development
100 Target Packaging products reusable or recyclable
Collaborating to drive innovation
and action
Integrating recycled and bio-based
feedstocks
Demonstrating innovative applications
for recycled plastics
Helping customers design for
recyclability
Innovating new products with post-consumer material
Dow is uniquely advantaged by a broad and differentiated portfolio to capture favorable industry supply-demand dynamics
Consumer spending drives ~1-15x GDP demand growth for Industrial Solutions and Polyurethanes
Renewables amp energy efficiency are key growth drivers
Incremental investments in US Gulf Coast Europe and China expect ~$200MMyear EBITDA run-rate
Broad participation in industrial and infrastructure end markets support long-term growth
High value end markets growing ~15-2x GDP upstream capacity availability enables high-value derivative growth
Rapid adoption of EV 5G Cloud Computing drives demand for innovation products
Lower-cost higher-return expansions expected to enable downstream growth of gt$350MMyear EBITDA run-rate
Infrastructure plan COVID-19 recovery expansion benefits
Incremental investments keep pace with ~13-15x GDP demand growth
Continue product mix upgrade to higher return end markets and applications
Canada cracker expansion and debottlenecking PE capacity expect ~$400MMyear EBITDA run-rate
Functional Polymers for infrastructure automotive and photovoltaics delivers outperformance vs peers
0
10
20
30
40
50
60
70
80
90
100
2022E 2023E 2024E 2025E 2026E0
4000
8000
12000
16000
0
10
20
30
40
50
60
70
80
90
100
2022E 2023E 2024E 2025E 2026E0
1000
2000
3000
4000
5000
6000
lsquo000 MTs lsquo000 MTs lsquo000 MTs
Polyethylene MDI Siloxane
30
40
50
60
70
80
90
100
2022E 2023E 2024E 2025E 2026E0
50000
100000
150000
200000
250000
Constructive near-term supply-demand balances Further tightening with expected capacity delays cancellations and typical outages
Adjusted Operating Rate s include typical industry planned outages and delayedcancelled new capacity additions based on historical averages
IHS SAGSI and other company annual reports and disclosuresIndustry consultant views use industry nameplate capacity and include all announced capacity additionsNote Industry operating rate estimates are based on views as of April 2021 and subject to change
1Q 2021 FINANCIAL HIGHLIGHTS
YoY Operating EPS Reconciliation Key Drivers in the Quarter YoYbull Pricing momentum across all segments and
regions led by polyethylene and polyurethane applications
bull Resilient demand in packaging and demand growth in construction mobility electronics and consumer durables end markets
bull Improved equity earnings led by Sadara and the Kuwait joint ventures
bull Lower tax rate on earnings recovery and geographic mix
bull Lower DampA and interest expense offset share count increase
bull Increased turnaround spending on delays from 2020 due to impacts of the pandemic
bull Impact of supply constraints and repair expenses related to Winter Storm Uri on the US Gulf Coast
Financial Summary($ millions unless otherwise noted)
Operating EBITDA $2271 $1567 $704 $1780 $491Earnings per share ndash GAAP $132 $032 $100 $165 $(033)Operating earnings per share $136 $059 $077 $081 $055Cash Provided by (Used for) Op Activities ndashCont Ops1
Op EBITDA to CFFO (Cash Flow Conversion1 )
$(228)(10)
$123679
$(1464) $165693
$(1884)
$059
$136
1Q20 MarginExpansion
Winter Storm Uri Turnarounds Tax Rate Equity Earnings 1Q21
111 Cash Provided by (Used for) Operating Activities ndash Continuing Operations and Cash Flow Conversion include a $1 billion elective pension contribution in the first quarter of 2021
PRINCIPAL JOINT VENTURE DETAIL
1Q 2021 1Q 2020 4Q 2020
$ millions (unaudited)Sadara
KuwaitJVs
ThaiJVs Sadara
KuwaitJVs
ThaiJVs Sadara
KuwaitJVs
ThaiJVs
EBITDA $163 $183 $52 $9 $110 $4 $137 $152 $28
EBIT $106 $144 $44 $(78) $65 $(6) $34 $104 $19
Net IncomeEquity Earnings (Losses) to Dow $55 $119 $34 $(116) $40 $(9) $3 $86 $15
EBITDA in Excess of Eq Earnings $108 $64 $18 $125 $70 $13 $134 $66 $13
Dowrsquos Proportional Share of Principal JV Financial Results
Kuwait JVs Margin expansion from price increases in MEG
Thai JVs Polyethylene margin expansion
Sadara Margin expansion in polyurethane and polyethylene applications
Drivers of YoY and PQ Changes
12Note 4Q2020 values were revised to reflect audited JV financial statements for Sadara
Dow FY20 Benchmarking Update
14
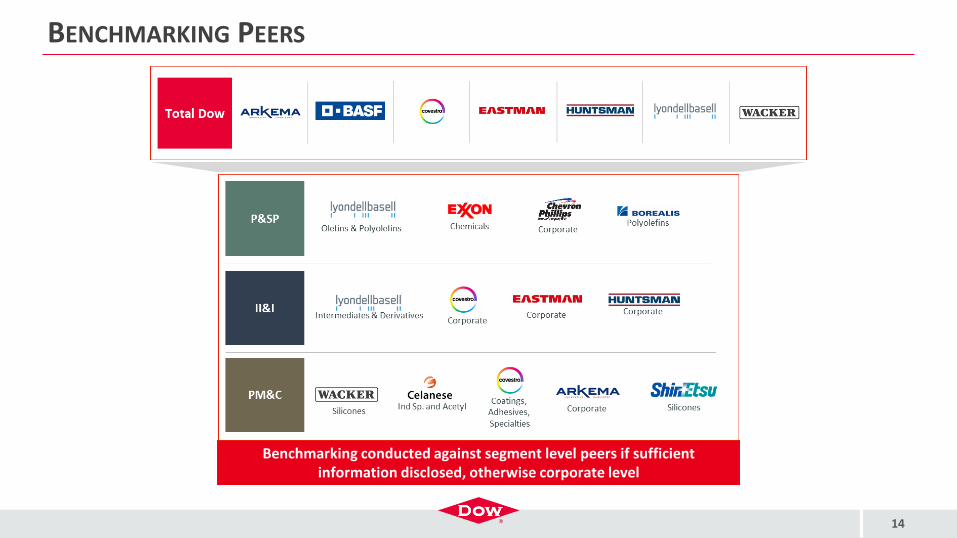
BENCHMARKING PEERS
Benchmarking conducted against segment level peers if sufficient information disclosed otherwise corporate level
15
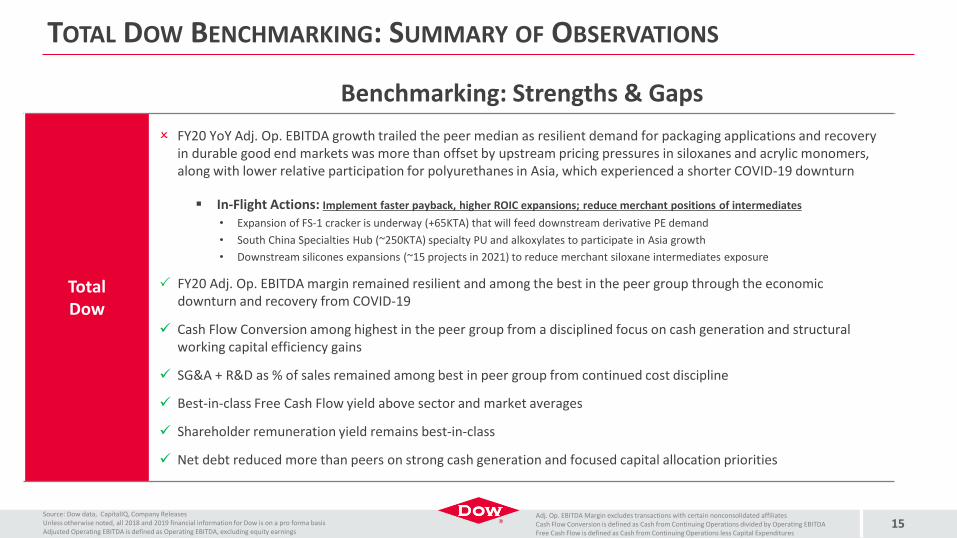
TOTAL DOW BENCHMARKING SUMMARY OF OBSERVATIONS
Benchmarking Strengths amp Gaps
TotalDow
FY20 YoY Adj Op EBITDA growth trailed the peer median as resilient demand for packaging applications and recovery in durable good end markets was more than offset by upstream pricing pressures in siloxanes and acrylic monomers along with lower relative participation for polyurethanes in Asia which experienced a shorter COVID-19 downturn
In-Flight Actions Implement faster payback higher ROIC expansions reduce merchant positions of intermediatesbull Expansion of FS-1 cracker is underway (+65KTA) that will feed downstream derivative PE demandbull South China Specialties Hub (~250KTA) specialty PU and alkoxylates to participate in Asia growth bull Downstream silicones expansions (~15 projects in 2021) to reduce merchant siloxane intermediates exposure
FY20 Adj Op EBITDA margin remained resilient and among the best in the peer group through the economic downturn and recovery from COVID-19
Cash Flow Conversion among highest in the peer group from a disciplined focus on cash generation and structural working capital efficiency gains
SGampA + RampD as of sales remained among best in peer group from continued cost discipline
Best-in-class Free Cash Flow yield above sector and market averages
Net debt reduced more than peers on strong cash generation and focused capital allocation priorities
Source Dow data CapitalIQ Company ReleasesUnless otherwise noted all 2018 and 2019 financial information for Dow is on a pro forma basisAdjusted Operating EBITDA is defined as Operating EBITDA excluding equity earnings
Adj Op EBITDA Margin excludes transactions with certain nonconsolidated affiliates Cash Flow Conversion is defined as Cash from Continuing Operations divided by Operating EBITDAFree Cash Flow is defined as Cash from Continuing Operations less Capital Expenditures
16
TOTAL DOW
(1) Adjusted Operating EBITDA is defined as Operating EBITDA excluding equity earnings Adj Op EBITDA Margin excludes transactions with certain nonconsolidated affiliates
(2) Benchmarking peer set range includes Arkema BASF Covestro Eastman Huntsman Lyondell Wacker(3) Cash Flow Conversion is defined as Cash From Continuing Operations divided by Operating EBITDA(4) Median excludes Dow
Adj Op EBITDA Growth
Adj Op EBITDA Margin Cash Flow Conversion SGampA + RampD
(as a of Sales)FY20 vs FY19
FY20
Median Excl Dow
Median Excl Dow
BENCHMARKING SNAPSHOT (1234)
FY20 UPDATE amp FY19
FY19
-60
-50
-40
-30
-20
-10
0
10
FY19 vs FY18
FY20 FY19 FY20 FY19
Median Excl Dow
Median Excl Dow
5
10
15
20
25
Median Excl Dow
Median Excl Dow
30
50
70
90
110
130
150
Median Excl Dow Median
Excl Dow
0
5
10
15
20
25
Median Excl Dow
Median Excl Dow
Source Dow data CapitalIQ Company disclosures
Unless otherwise noted all 2018 and 2019 financial information for Dow is on a pro forma basisFor further unaudited pro forma financial information refer to the Companyrsquos Current Report on Form 8-K dated June 3 2019 and 4Q20 Earnings materials included in the Current Report on Form 8-K dated January 28 2021
bull Hallmark safety performance and operational excellence
bull Focused portfolio with market leading positions in key value chains
bull Consumer tilted portfolio in growing end-market verticals
bull Global footprint with integrated value chains that provide differentiated product offerings
CORE STRENGTHSbull Maintain focus on cash
generation and low-cost curve position
bull Continued disciplined capital allocation
bull Use innovation pipeline to collaborate with customers and capture growth trends
bull Invest in incremental higher return faster payback growth opportunities
bull Deliver sustainable future through Industry leading ESG position
Average Annual Free Cash Flow (2019-2020)as of 2020 Market Cap
17
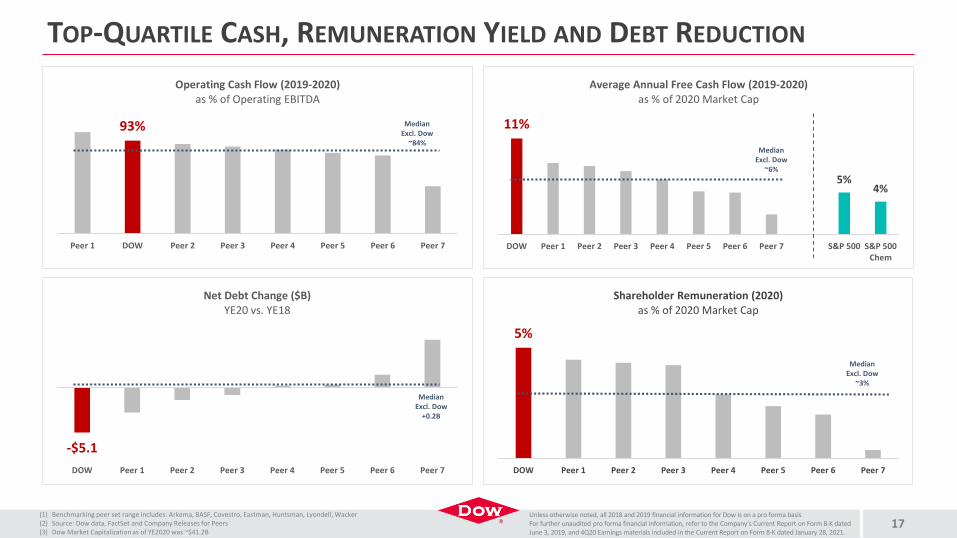
TOP-QUARTILE CASH REMUNERATION YIELD AND DEBT REDUCTION
Median Excl Dow
~84
Median Excl Dow
+02B
Median Excl Dow
~6
Median Excl Dow
~3
(1) Benchmarking peer set range includes Arkema BASF Covestro Eastman Huntsman Lyondell Wacker(2) Source Dow data FactSet and Company Releases for Peers(3) Dow Market Capitalization as of YE2020 was ~$412B
Unless otherwise noted all 2018 and 2019 financial information for Dow is on a pro forma basisFor further unaudited pro forma financial information refer to the Companyrsquos Current Report on Form 8-K dated June 3 2019 and 4Q20 Earnings materials included in the Current Report on Form 8-K dated January 28 2021
18
CULTURE OF BENCHMARKING SUMMARY OF OBSERVATIONS
Segment FY20 Benchmarking Strengths amp Gaps
PampSP
FY20 YoY Adj Op EBITDA growth tracked the peer median as peers with more exposure to naphtha rebounded from a lower 2019 performance from cost pressures
FY20 Adj Op EBITDA margin more resilient than most peers Op EBITDA per pound polyolefin capacity ahead of peers advantage continues to widen Free Cash Conversion continued to improve and is best-in-class among the peer set SGampA + RampD as of sales remained among lowest in the peer group
IIampI
FY20 YoY Adj Op EBITDA growth and Adj Op EBITDA margin trailed the peer median as strengthening durable good end-markets in 2H20 were offset by decisive actions taken earlier in 1H20 to match production to demand as well as lower relative participation in Asia which experienced a shorter COVID-19 demand downturn
Free Cash Conversion is best-in-class among the peer set SGampA + RampD as of sales remained among lowest in the peer group
PMampC
FY20 YoY Adj Op EBITDA growth trailed the peer median due to greater exposure to siloxanes and acrylic monomers that were more heavily impacted by demand downturn and competitive pricing actions
FY20 Adj Op EBITDA margin trailed the peer median as strong demand for home care and DIY coatings was more than offset by personal care and automotive applications that lagged broader recovery
Free Cash Conversion among highest in the peer group SGampA + RampD as of sales best-in-class expanded advantage vs next closest peer
Source Dow data CapitalIQ Company ReleasesAdjusted Operating EBITDA is defined as Operating EBITDA excluding equity earnings Adj Op EBITDA Margin excludes transactions with certain nonconsolidated affiliatesFree Cash Conversion for Dow is defined as Adj Op EBITDA less Capex divided by Adj Op EBITDA
Unless otherwise noted all 2018 and 2019 financial information for Dow is on a pro forma basisFor further unaudited pro forma financial information refer to the Companyrsquos Current Report on Form 8-K dated June 3 2019 and 4Q20 Earnings materials included in the Current Report on Form 8-K dated January 28 2021
19
PACKAGING amp SPECIALTY PLASTICS
Adj Op EBITDA Growth(7)
Adj Op EBITDA Margin Free Cash Conversion SGampA + RampD
(as a of Sales)bull World-class packaging
franchise
bull Most flexible feedstock capability in the industry
bull Flexible polyolefins assets
bull Proprietary catalyst and process technology
bull Differentiated co-monomer capability
bull Global low-cost footprint
bull Maintain focus on cash conversion and cost discipline
bull Leverage differentiated product offerings and innovation pipeline to meet growing demand
bull Accelerate sell-up opportunities of higher margin product mix
bull Incremental quick payback investments and capacity expansions
bull Plastics circularity energy intensity CO2 footprint
CORE STRENGTHS FOCUS AREASFY20 vs FY19
FY20
Median Excl Dow
Median Excl Dow
FY19
-80
-60
-40
-20
0
20
40
FY19 vs FY18
FY20 FY19 FY20 FY19
Median Excl Dow
Median Excl Dow
5
10
15
20
25
Median Excl Dow
Median Excl Dow
0
20
40
60
80
Median Excl Dow
Median Excl Dow
0
5
10
15
Median Excl Dow
Median Excl Dow
Source Dow data CapitalIQ Company disclosures
(1) Adjusted Operating EBITDA is defined as Operating EBITDA excluding equity earningsAdj Op EBITDA Margin excludes transactions with certain nonconsolidated affiliates
(2) Benchmarking peer set range includes LyondellBasell Olefins amp Polyolefins Chevron Phillip Chemical Borealis Polyolefins ExxonMobil Chemicals (entire segment)
(3) Free Cash Conversion for Dow is defined as Adj Op EBITDA less Capex divided by Adj Op EBITDA(4) Median excludes Dow(5) SGampA + RampD reflects corporate level for peers where segment level data is unavailable
BENCHMARKING SNAPSHOT (123456)
FY20 UPDATE amp FY19
(6) CPChem results are as of 3Q20 TTM(7) Adj Op EBITDA Growth chart capped for visual purposes top peer was ~90
Unless otherwise noted all 2018 and 2019 financial information for Dow is on a pro forma basisFor further unaudited pro forma financial information refer to the Companyrsquos Current Report on Form 8-K dated June 3 2019 and 4Q20 Earnings materials included in the Current Report on Form 8-K dated January 28 2021
bull Full feedstock-to-polymer integration continues to deliver enhanced value
(1) Segment Op EBITDA based on FY20 reported figures including equity income from affiliatesJVs Capacity based on latest company reported nameplate for PE and PP (2019 for Dow 2020 10-K for Lyondell) including share of JVs or ICIS reported capacity for 2019 including share of JVs if not available (Borealis)
(2) Borealis Polyolefins EBITDA adjusted for equity earnings from JVsUnless otherwise noted all 2018 and 2019 financial information for Dow is on a pro forma basisFor further unaudited pro forma financial information refer to the Companyrsquos Current Report on Form 8-K dated June 3 2019 and 4Q20 Earnings materials included in the Current Report on Form 8-K dated January 28 2021
21
INDUSTRIAL INTERMEDIATES amp INFRASTRUCTURE
bull Top global producer of key raw materials (EO PO)
bull Flexible manufacturing model through integration
bull Top 3 PU Systems House business
bull Industrial Solutions contains products with some of the highest returns to ethylene
bull Maintain focus on cash conversion and cost discipline
bull Drive PU mix towards higher margin Perf Polyols amp Systems
bull Implement faster payback higher ROIC expansions (China Specialties hub differentiated PU applications and DIS alkoxylates)
FOCUS AREASAdj Op EBITDA Growth
Adj Op EBITDA Margin Free Cash Conversion SGampA + RampD
(as a of Sales)
Median Excl Dow
Median Excl Dow Median
Excl Dow
Median Excl Dow
CORE STRENGTHS
Source Dow data CapitalIQ Company disclosures
FY20 vs FY19 FY20 FY19
FY19 vs FY18 FY20 FY19 FY20 FY19
-60
-40
-20
0
20
Median Excl Dow
Median Excl Dow
0
5
10
15
20
25
Median Excl Dow
Median Excl Dow
-10
10
30
50
70
90
Median Excl Dow Median
Excl Dow
0
5
10
15
20
Median Excl Dow Median
Excl Dow
(1) Adjusted Operating EBITDA is defined as Operating EBITDA excluding equity earnings Adj Op EBITDA Margin excludes transactions with certain nonconsolidated affiliates
(2) Benchmarking peer set range includes Eastman Huntsman Covestro LyondellBasell Intermediates amp Derivatives segment(3) Free Cash Conversion for Dow is defined as Adj Op EBITDA less Capex divided by Adj Op EBITDA(4) Median excludes Dow(5) SGampA + RampD reflects corporate level for peers where segment level data is unavailable
BENCHMARKING SNAPSHOT (12345)
FY20 UPDATE amp FY19
Unless otherwise noted all 2018 and 2019 financial information for Dow is on a pro forma basisFor further unaudited pro forma financial information refer to the Companyrsquos Current Report on Form 8-K dated June 3 2019 and 4Q20 Earnings materials included in the Current Report on Form 8-K dated January 28 2021
22
PERFORMANCE MATERIALS amp COATINGS
Adj Op EBITDA Growth
Adj Op EBITDA Margin
SGampA + RampD (as a of Sales) FOCUS AREAS
bull Maintain focus on cash conversion and cost discipline
bull Accelerate organic growth and explore bolt-on inorganic growth
bull Innovate with customers on sustainable solutions
bull Improve acrylic monomer and siloxane margins drive more captive use
bull Grow industrial coatings in prioritized end markets
bull World-class silicones franchise
bull Lowest cost siloxanes producer
bull Leading coatings solutions provider
bull World-scale acrylic monomer assets
bull One of the largest B2B digital platforms
bull Unique hybrid chemistry opportunities
bull Leading SGampA and RampD efficiency
Free Cash Conversion
Median Excl Dow
Median Excl Dow
Median Excl Dow
CORE STRENGTHSFY20 vs FY19 FY20 FY19
FY19 vs FY18 FY20 FY19 FY20 FY19
-40
-30
-20
-10
0
10
Median Excl Dow
Median Excl Dow
5
10
15
20
25
30
35
Median Excl Dow Median
Excl Dow
40
50
60
70
80
Median Excl Dow
Median Excl Dow
5
10
15
20
Median Excl Dow
Median Excl Dow
Source Dow data CapitalIQ Company disclosures
(1) Adjusted Operating EBITDA is defined as Operating EBITDA excluding equity earnings Adj Op EBITDA Margin excludes transactions with certain nonconsolidated affiliates
(2) Benchmarking peer set range includes Celanese Acetyl Chain Wacker Silicones segment Shin-Etsu Silicones segment Arkema Covestro Coatings segment
(3) Free Cash Conversion for Dow is defined as Adj Op EBITDA less Capex divided by Adj Op EBITDA(4) Median excludes Dow(5) SGampA + RampD reflects corporate level for peers where segment level data is unavailable
BENCHMARKING SNAPSHOT (1234)
FY20 UPDATE amp FY19
Unless otherwise noted all 2018 and 2019 financial information for Dow is on a pro forma basisFor further unaudited pro forma financial information refer to the Companyrsquos Current Report on Form 8-K dated June 3 2019 and 4Q20 Earnings materials included in the Current Report on Form 8-K dated January 28 2021
Appendix
OPERATING EARNINGS PER SHARE (EPS) RECONCILIATION
24
In millions except per share amounts (Unaudited) Pretax 1 Net Income 2 EPS 3
Significant Items Impacting Results for the Three Months Ended Mar 31 2021
Significant Items Impacting Results for the Three Months Ended Mar 31 2020
2 Net income available for Dow Inc common stockholders The income tax effect on signif icant items w as calculated based upon the enacted tax law s and statutory income tax rates applicable in the tax jurisdiction(s) of the underlying non-GAAP adjustment
1 Income before income taxes
3 Earnings per common share - diluted
Non-GAAP - Sig Items
DOW CONFIDENTIAL - Do not share without permission
Non-GAAP - EBITDA Recon
DOW CONFIDENTIAL - Do not share without permission
Non-GAAP - Segment Info
DOW CONFIDENTIAL - Do not share without permission
Non-GAAP - Cash Flow Measures
DOW CONFIDENTIAL - Do not share without permission
Non-GAAP - Net Debt
DOW CONFIDENTIAL - Do not share without permission
RECONCILIATION OF NET INCOME (LOSS) TO OPERATING EBIT amp OPERATING EBITDA
25
In millions (Unaudited)
Net income (loss) $ 258 $ (217) $ (1) $ 1254 $ 1006 + Provision for income taxes 138 34 43 562 317Income (loss) before income taxes $ 396 $ (183) $ 42 $ 1816 $ 1323 - Interest income 15 6 6 11 8+ Interest expense and amortization of debt discount 215 200 202 210 196- Significant items (247) (46) (523) 961 (43)Operating EBIT 1 $ 843 $ 57 $ 761 $ 1054 $ 1554 + Depreciation and amortization 724 700 724 726 717Operating EBITDA 2 $ 1567 $ 757 $ 1485 $ 1780 $ 2271 Operating EBITDA - Trailing Twelve Months (TTM) basis $ 6971 $ 5926 $ 5555 $ 5589 $ 6293 1 Operating EBIT is defined as earnings (ie Income (loss) before income taxes) before interest excluding the impact of signif icant items2 Operating EBITDA is defined as earnings (ie Income (loss) before income taxes) before interest depreciation and amortization excluding the impact of signif icant items
Reconciliation of Net income (loss) to Operating EBIT and Operating EBITDA
March 31 2020
Three Months Ended
September 30 2020June 30 2020 March 31 2021December 31 2020
Non-GAAP - Sig Items
DOW CONFIDENTIAL - Do not share without permission
Non-GAAP - EBITDA Recon
DOW CONFIDENTIAL - Do not share without permission
Non-GAAP - Segment Info
DOW CONFIDENTIAL - Do not share without permission
Non-GAAP - Cash Flow Measures
DOW CONFIDENTIAL - Do not share without permission
Non-GAAP - Net Debt
DOW CONFIDENTIAL - Do not share without permission
SEGMENT INFORMATION
26
Net Sales by Segment
In millions (Unaudited) March 31 2021 March 31 2020
2 Free cash f low in the f irst quarter of 2021 reflects a $1 billion elective pension contribution
Three Months Ended
1 Cash f low conversion is defined as Cash provided by (used for) operating activities - continuing operations divided by Operating EBITDA
Three Months Ended
1 Free cash f low is defined as Cash provided by (used for) operating activities - continuing operations less capital expenditures Under this definition free cash f low represents the cash generated by the Company from operations after investing in its asset base Free cash f low combined w ith cash balances and other sources of liquidity represent the cash available to fund obligations and provide returns to shareholders Free cash f low is an integral f inancial measure used in the Companys f inancial planning process
2 Cash f low conversion in the f irst quarter of 2021 reflects a $1 billion elective pension contribution
Non-GAAP - Sig Items
DOW CONFIDENTIAL - Do not share without permission
Non-GAAP - EBITDA Recon
DOW CONFIDENTIAL - Do not share without permission
Non-GAAP - Segment Info
DOW CONFIDENTIAL - Do not share without permission
Non-GAAP - Cash Flow Measures
DOW CONFIDENTIAL - Do not share without permission
Non-GAAP - Net Debt
DOW CONFIDENTIAL - Do not share without permission
RECONCILIATION OF NET DEBT
29
Reconciliation of Net Debt
In millions (Unaudited)Notes payable $ 152 $ 156 Long-term debt due within one year 492 460Long-term debt 16200 16491
DOW CONFIDENTIAL - Do not share without permission
Non-GAAP - EBITDA Recon
DOW CONFIDENTIAL - Do not share without permission
Non-GAAP - Segment Info
DOW CONFIDENTIAL - Do not share without permission
Non-GAAP - Cash Flow Measures
DOW CONFIDENTIAL - Do not share without permission
Non-GAAP - Net Debt
DOW CONFIDENTIAL - Do not share without permission
Background On April 1 2019 DowDuPont completed the separation of its materials science business and Dow Inc became the direct parent company of TDCC owning all of the outstanding common shares of TDCC For filings related to the period commencing April 1 2019 and thereafter TDCC was deemed the predecessor to Dow Inc and the historical results of TDCC are deemed the historical results of Dow Inc for periods prior to and including March 31 2019
The separation was contemplated by the merger of equals transaction effective August 31 2017 under the Agreement and Plan of Merger dated as of December 11 2015 as amended on March 31 2017 TDCC and Historical DuPont each merged with subsidiaries of DowDuPont and as a result TDCC and Historical DuPont became subsidiaries of DowDuPont (the ldquoMergerrdquo) Subsequent to the Merger TDCC and Historical DuPont engaged in a series of internal reorganization and realignment steps to realign their businesses into three subgroups agriculture materials science and specialty products Dow Inc was formed as a wholly owned subsidiary of DowDuPont to serve as the holding company for the materials science business
Unaudited Pro Forma Financial InformationIn order to provide the most meaningful comparison of results of operations and results by segment supplemental unaudited pro forma financial information has been included in the following financial schedules The unaudited pro forma financial information is based on the consolidated financial statements of TDCC adjusted to give effect to the separation from DowDuPont as if it had been consummated on January 1 2017 For the twelve months ended December 31 2019 and 2018 pro forma adjustments have been made for (1) the margin impact of various manufacturing supply and service related agreements entered into with DuPont and Corteva in connection with the separation which provide for different pricing than the historical intercompany and intracompany pricing practices of TDCC and Historical DuPont and (2) the elimination of the impact of events directly attributable to the Merger internal reorganization and business realignment separation distribution and other related transactions (eg one-time transaction costs)
The unaudited pro forma financial information has been presented for informational purposes only and is not necessarily indicative of what Dows results of operations actually would have been had the separation from DowDuPont been completed as of January 1 2017 nor is it indicative of the future operating results of Dow The unaudited pro forma information does not reflect restructuring or integration activities or other costs following the separation from DowDuPont that may be incurred to achieve cost or growth synergies of Dow For further information on the unaudited pro forma financial information please refer to the Companys Current Report on Form 8-K dated June 3 2019
General CommentsUnless otherwise specified all financial measures in this presentation where applicable exclude significant items
GENERAL COMMENTS
30
SAFE HARBORCautionary Statement about Forward-Looking Statements
This presentation contains ldquoforward-looking statementsrdquo within the meaning of the federal securities laws including Section 27A of the Securities Act of 1933 as amended and Section 21E of the Securities Exchange Act of 1934 as amended Such statements often address expected future business and financial performance financial condition and other matters and often contain words or phrases such as ldquoanticipaterdquo ldquobelieverdquo ldquoestimaterdquo ldquoexpectrdquo ldquointendrdquo ldquomayrdquo ldquoopportunityrdquo ldquooutlookrdquo ldquoplanrdquo ldquoprojectrdquo ldquoseekrdquo ldquoshouldrdquo ldquostrategyrdquo ldquotargetrdquo ldquowillrdquo ldquowill berdquo ldquowill continuerdquo ldquowill likely resultrdquo ldquowouldrdquo and similar expressions and variations or negatives of these words or phrases
Forward-looking statements are based on current assumptions and expectations of future events that are subject to risks uncertainties and other factors that are beyond Dowrsquos control which may cause actual results to differ materially from those projected anticipated or implied in the forward-looking statements and speak only as of the date the statements were made These factors include but are not limited to sales of Dowrsquos products Dowrsquos expenses future revenues and profitability the continuing global and regional economic impacts of the coronavirus disease 2019 (ldquoCOVID-19rdquo) pandemic and other public health-related risks and events on Dowrsquos business capital requirements and need for and availability of financing size of the markets for Dowrsquos products and services and ability to compete in such markets failure to develop and market new products and optimally manage product life cycles the rate and degree of market acceptance of Dowrsquos products significant litigation and environmental matters and related contingencies and unexpected expenses the success of competing technologies that are or may become available the ability to protect Dowrsquos intellectual property in the United States and abroad developments related to contemplated restructuring activities and proposed divestitures or acquisitions such as workforce reduction manufacturing facility andor asset closure and related exit and disposal activities and the benefits and costs associated with each of the foregoing fluctuations in energy and raw material prices management of process safety and product stewardship changes in relationships with Dowrsquos significant customers and suppliers changes in consumer preferences and demand changes in laws and regulations political conditions or industry development global economic and capital markets conditions such as inflation market uncertainty interest and currency exchange rates and equity and commodity prices business or supply disruptions security threats such as acts of sabotage terrorism or war weather events and natural disasters and disruptions in Dowrsquos information technology networks and systems
Risks related to Dowrsquos separation from DowDuPont Inc include but are not limited to (i) Dowrsquos inability to achieve some or all of the benefits that it expects to receive from the separation from DowDuPont Inc (ii) certain tax risks associated with the separation (iii) the failure of Dowrsquos pro forma financial information to be a reliable indicator of Dowrsquos future results (iv) non-compete restrictions under the separation agreement (v) receipt of less favorable terms in the commercial agreements Dow entered into with DuPont and Corteva Inc (ldquoCortevardquo) including restrictions under intellectual property cross-license agreements than Dow would have received from an unaffiliated third party and (vi) Dowrsquos obligation to indemnify DuPont andor Corteva for certain liabilities
Where in any forward-looking statement an expectation or belief as to future results or events is expressed such expectation or belief is based on the current plans and expectations of management and expressed in good faith and believed to have a reasonable basis but there can be no assurance that the expectation or belief will result or be achieved or accomplished A detailed discussion of principal risks and uncertainties which may cause actual results and events to differ materially from such forward-looking statements is included in the section titled ldquoRisk Factorsrdquo contained in the Companyrsquos Annual Report on Form 10-K for the year ended December 31 2020 These are not the only risks and uncertainties that Dow faces There may be other risks and uncertainties that Dow is unable to identify at this time or that Dow does not currently expect to have a material impact on its business If any of those risks or uncertainties develops into an actual event it could have a material adverse effect on Dowrsquos business Dow assumes no obligation to update or revise publicly any forward-looking statements whether because of new information future events or otherwise except as required by securities and other applicable laws
31
Non-GAAP Financial MeasuresThis presentation includes information that does not conform to US GAAP and are considered non-GAAP measures Management uses these measures internally for planning forecasting and evaluating the performance of the Companys segments including allocating resources Dows management believes that these non-GAAP measures best reflect the ongoing performance of the Company during the periods presented and provide more relevant and meaningful information to investors as they provide insight with respect to ongoing operating results of the Company and a more useful comparison of year-over-year results These non-GAAP measures supplement the Companys US GAAP disclosures and should not be viewed as alternatives to US GAAP measures of performance Furthermore such non-GAAP measures may not be consistent with similar measures provided or used by other companies Dow does not provide forward-looking US GAAP financial measures or a reconciliation of forward-looking non-GAAP financial measures to the most comparable US GAAP financial measures on a forward-looking basis because the Company is unable to predict with reasonable certainty the ultimate outcome of pending litigation unusual gains and losses foreign currency exchange gains or losses and potential future asset impairments as well as discrete taxable events without unreasonable effort These items are uncertain depend on various factors and could have a material impact on US GAAP results for the guidance period
TrademarksThe Dow Diamond logo and all products unless otherwise noted denoted with trade or reg are trademarks service marks or registered trademarks of The Dow Chemical Company or its respective subsidiaries or affiliates Solely for convenience the trademarks service marks and trade names referred to in this communication may appear without the trade or reg symbols but such references are not intended to indicate in any way that we will not assert to the fullest extent under applicable law our rights or the right of the applicable licensor to these trademarks service marks and trade names This presentation may also contain trademarks service marks and trade names of certain third parties which are the property of their respective owners Our use or display of third partiesrsquo trademarks service marks trade names or products in this communication is not intended to and should not be read to imply a relationship with or endorsement or sponsorship of us
DefinitionsOperating EBIT is defined as earnings (ie ldquoIncome (loss) from continuing operations before taxesrdquo) before interest excluding the impact of significant itemsOperating EBITDA is defined as earnings (ie ldquoIncome (loss) from continuing operations before taxesrdquo) before interest depreciation and amortization excluding the impact of significant itemsOperating EBIT Margin is defined as Operating EBIT divided by net salesAdjusted Operating EBIT is defined as Operating EBIT less equity earningsAdjusted Operating EBIT Margin is defined as Operating EBIT less equity earnings divided by net salesAdjusted Operating EBITDA is defined as Operating EBITDA less equity earningsAdjusted Operating EBITDA Margin is defined as Adjusted Operating EBITDA divided by net sales excluding certain transactions with nonconsolidated affiliates Operating earnings per share is defined as Earnings (loss) per common share from continuing operations - dilutedldquo excluding the after-tax impact of significant items Operational Tax Rate is defined as the effective tax rate (ie GAAP ldquoProvision for income taxesrdquo divided by ldquoIncome (loss) from continuing operations before income taxesrdquo) excluding the impact of significant itemsFree cash flow (FCF) is defined as ldquoCash provided by (used for) operating activities - continuing operationsrdquo less capital expenditures Under this definition free cash flow represents the cash generated by the Company from operations after investing in its asset base Free cash flow combined with cash balances and other sources of liquidity represent the cash available to fund obligations and provide returns to shareholders Free cash flow is an integral financial measure used in the Companys financial planning processFree Cash Flow Yield is defined as Free cash flow divided by market capitalizationShareholder Remuneration is defined as Dividends paid to stockholders plus Purchases of treasury stockShareholder Yield is defined as Shareholder Remuneration divided by market capitalizationCash Flow Conversion is defined as ldquoCash provided by (used for) operating activities ndash continuing operationsrdquo divided by Operating EBITDA or Pro Forma Operating EBITDA Management believes cash flow conversion is an important financial metric as it helps the Company determine how efficiently it is converting its earnings to cash flowFree cash conversion is defined as Adjusted Operating EBITDA less capital expenditures divided by Adjusted Operating EBITDANet Debt is defined as ldquoNotes payablerdquo plus ldquoLong-term debt due within one yearrdquo plus ldquoLong-term debtrdquo less ldquoCash and cash equivalentsrdquo and ldquoMarketable securitiesrdquoKuwait Joint Ventures (JVs) refers to EQUATE Petrochemical Company KSCC The Kuwait Olefins Company KSCC and The Kuwait Styrene Company KSCCThai Joint Ventures (JVs) refers to Map Ta Phut Olefins Company Limited and The SCG-Dow Group (Siam Polyethylene Company Limited Siam Polystyrene Company Limited Siam Styrene Monomer Co Ltd Siam Synthetic Latex Company Limited)
1 Free cash flow is defined as Cash provided by (used for) operating activities - continuing operations less capital expenditures Under this definition free cash flow represents the cash generated by the Company from operations after investing in its asset base Free cash flow combined with cash balances and other sources of liquidity represent the cash available to fund obligations and provide returns to shareholders Free cash flow is an integral financial measure used in the Companys financial planning process
Net Sales by Segment
Three Months EndedDec 31 2020
Three Months Ended
In millions (Unaudited)
March 31 2021
March 31 2020
Packaging amp Specialty Plastics
$ 5126
$ 6082
$ 4609
Industrial Intermediates amp Infrastructure
3501
3607
3045
Performance Materials amp Coatings
2029
2123
2065
Corporate
50
70
51
Total
$ 10706
$ 11882
9770
Operating EBIT by Segment
Three Months EndedDec 31 2020
Three Months Ended
In millions (Unaudited)
March 31 2021
March 31 2020
Packaging amp Specialty Plastics
$ 780
$ 1228
$ 580
Industrial Intermediates amp Infrastructure
296
326
175
Performance Materials amp Coatings
50
62
162
Corporate
(72)
(62)
(74)
Total
$ 1054
$ 1554
843
Equity in Earnings (Losses) of Nonconsolidated Affiliates by Segment
Three Months EndedDec 31 2020
Three Months Ended
In millions (Unaudited)
March 31 2021
March 31 2020
Packaging amp Specialty Plastics
$ 77
$ 106
$ 5
Industrial Intermediates amp Infrastructure
36
115
(76)
Performance Materials amp Coatings
2
2
1
Corporate
(9)
1
(19)
Total
$ 106
$ 224
(89)
Adjusted Operating EBIT by Segment
Three Months EndedDec 31 2020
Three Months Ended
In millions (Unaudited)
March 31 2021
March 31 2020
Packaging amp Specialty Plastics
$ 703
$ 1122
$ 575
Industrial Intermediates amp Infrastructure
260
211
251
Performance Materials amp Coatings
48
60
161
Corporate
(63)
(63)
(55)
Total
$ 948
$ 1330
932
Operating Margin by Segment
Three Months EndedDec 31 2020
Three Months Ended
In millions (Unaudited)
March 31 2021
March 31 2020
Packaging amp Specialty Plastics
152
202
126
Industrial Intermediates amp Infrastructure
85
90
57
Performance Materials amp Coatings
25
29
78
Total
98
131
86
Adjusted Operating EBIT Margin by Segment
Three Months EndedDec 31 2020
Three Months Ended
In millions (Unaudited)
March 31 2021
March 31 2020
Packaging amp Specialty Plastics
137
184
125
Industrial Intermediates amp Infrastructure
74
58
82
Performance Materials amp Coatings
24
28
78
Total
89
112
95
Reconciliation of Income (loss) from continuing operations net of tax to Operating EBIT and Operating EBITDA
Three Months Ended
Nine Months Ended
March 31 2020
June 30 2020
September 30 2020
December 31 2020
March 31 2021
September 30 2020
September 30 2019
In millions (Unaudited)
As Reported
Pro Forma
Income (loss) from continuing operations net of tax
$ 258
$ (217)
$ (1)
$ 1254
$ 1006
$ 1006
$ 258
+ Provision for income taxes on continuing operations
138
34
43
562
317
317
138
Income (loss) from continuing operations before income taxes
$ 396
$ (183)
$ 42
$ 1816
$ 1323
$ 1323
$ 396
- Interest income
15
6
6
11
8
8
15
+ Interest expense and amortization of debt discount
1 Operating EBIT is defined as earnings (ie Income (loss) from continuing operations before income taxes) before interest excluding the impact of significant items
2 Operating EBITDA is defined as earnings (ie Income (loss) from continuing operations before income taxes) before interest depreciation and amortization excluding the impact of significant items
Significant Items Impacting Results for the Three Months Ended Mar 31 2021
In millions except per share amounts (Unaudited)
Pretax 1
Net Income 2
EPS 3
Reported results
$ 1323
$ 991
$ 132
Less Significant items
Restructuring implementation costs
(10)
(8)
(001)
Digitalization program costs
(33)
(25)
(003)
Total significant items
$ (43)
$ (33)
$ (004)
Operating results (non-GAAP)
$ 1366
$ 1024
$ 136
Significant Items Impacting Results for the Three Months Ended Mar 31 2020
In millions except per share amounts (Unaudited)
Pretax 1
Net Income 2
EPS 3
Reported results
$ 396
$ 239
$ 032
Less Significant items
Integration and separation costs
(65)
(51)
(007)
Restructuring and asset related charges - net
(96)
(79)
(011)
Loss on early extinguishment of debt
(86)
(70)
(009)
Total significant items
$ (247)
$ (200)
$ (027)
Operating results (non-GAAP)
$ 643
$ 439
$ 059
1 Income before income taxes
2 Net income (loss) available for Dow Inc common stockholders The income tax effect on significant items was calculated based upon the enacted tax laws and statutory income tax rates applicable in the tax jurisdiction(s) of the underlying non-GAAP adjustment
1 Free cash flow is defined as Cash provided by (used for) operating activities - continuing operations less capital expenditures Under this definition free cash flow represents the cash generated by the Company from operations after investing in its asset base Free cash flow combined with cash balances and other sources of liquidity represent the cash available to fund obligations and provide returns to shareholders Free cash flow is an integral financial measure used in the Companys financial planning process
2 Free cash flow in the first quarter of 2021 reflects a $1 billion elective pension contribution
Net Sales by Segment
Three Months EndedDec 31 2020
Three Months Ended
In millions (Unaudited)
March 31 2021
March 31 2020
Packaging amp Specialty Plastics
$ 5126
$ 6082
$ 4609
Industrial Intermediates amp Infrastructure
3501
3607
3045
Performance Materials amp Coatings
2029
2123
2065
Corporate
50
70
51
Total
$ 10706
$ 11882
9770
Operating EBIT by Segment
Three Months EndedDec 31 2020
Three Months Ended
In millions (Unaudited)
March 31 2021
March 31 2020
Packaging amp Specialty Plastics
$ 780
$ 1228
$ 580
Industrial Intermediates amp Infrastructure
296
326
175
Performance Materials amp Coatings
50
62
162
Corporate
(72)
(62)
(74)
Total
$ 1054
$ 1554
843
Equity in Earnings (Losses) of Nonconsolidated Affiliates by Segment
Three Months EndedDec 31 2020
Three Months Ended
In millions (Unaudited)
March 31 2021
March 31 2020
Packaging amp Specialty Plastics
$ 77
$ 106
$ 5
Industrial Intermediates amp Infrastructure
36
115
(76)
Performance Materials amp Coatings
2
2
1
Corporate
(9)
1
(19)
Total
$ 106
$ 224
(89)
Adjusted Operating EBIT by Segment
Three Months EndedDec 31 2020
Three Months Ended
In millions (Unaudited)
March 31 2021
March 31 2020
Packaging amp Specialty Plastics
$ 703
$ 1122
$ 575
Industrial Intermediates amp Infrastructure
260
211
251
Performance Materials amp Coatings
48
60
161
Corporate
(63)
(63)
(55)
Total
$ 948
$ 1330
932
Operating Margin by Segment
Three Months EndedDec 31 2020
Three Months Ended
In millions (Unaudited)
March 31 2021
March 31 2020
Packaging amp Specialty Plastics
152
202
126
Industrial Intermediates amp Infrastructure
85
90
57
Performance Materials amp Coatings
25
29
78
Total
98
131
86
Adjusted Operating EBIT Margin by Segment
Three Months EndedDec 31 2020
Three Months Ended
In millions (Unaudited)
March 31 2021
March 31 2020
Packaging amp Specialty Plastics
137
184
125
Industrial Intermediates amp Infrastructure
74
58
82
Performance Materials amp Coatings
24
28
78
Total
89
112
95
Reconciliation of Income (loss) from continuing operations net of tax to Operating EBIT and Operating EBITDA
Three Months Ended
Nine Months Ended
March 31 2020
June 30 2020
September 30 2020
December 31 2020
March 31 2021
September 30 2020
September 30 2019
In millions (Unaudited)
As Reported
Pro Forma
Income (loss) from continuing operations net of tax
$ 258
$ (217)
$ (1)
$ 1254
$ 1006
$ 1006
$ 258
+ Provision for income taxes on continuing operations
138
34
43
562
317
317
138
Income (loss) from continuing operations before income taxes
$ 396
$ (183)
$ 42
$ 1816
$ 1323
$ 1323
$ 396
- Interest income
15
6
6
11
8
8
15
+ Interest expense and amortization of debt discount
1 Operating EBIT is defined as earnings (ie Income (loss) from continuing operations before income taxes) before interest excluding the impact of significant items
2 Operating EBITDA is defined as earnings (ie Income (loss) from continuing operations before income taxes) before interest depreciation and amortization excluding the impact of significant items
Significant Items Impacting Results for the Three Months Ended Mar 31 2021
In millions except per share amounts (Unaudited)
Pretax 1
Net Income 2
EPS 3
Reported results
$ 1323
$ 991
$ 132
Less Significant items
Restructuring implementation costs
(10)
(8)
(001)
Digitalization program costs
(33)
(25)
(003)
Total significant items
$ (43)
$ (33)
$ (004)
Operating results (non-GAAP)
$ 1366
$ 1024
$ 136
Significant Items Impacting Results for the Three Months Ended Mar 31 2020
In millions except per share amounts (Unaudited)
Pretax 1
Net Income 2
EPS 3
Reported results
$ 396
$ 239
$ 032
Less Significant items
Integration and separation costs
(65)
(51)
(007)
Restructuring and asset related charges - net
(96)
(79)
(011)
Loss on early extinguishment of debt
(86)
(70)
(009)
Total significant items
$ (247)
$ (200)
$ (027)
Operating results (non-GAAP)
$ 643
$ 439
$ 059
1 Income before income taxes
2 Net income available for Dow Inc common stockholders The income tax effect on significant items was calculated based upon the enacted tax laws and statutory income tax rates applicable in the tax jurisdiction(s) of the underlying non-GAAP adjustment
1 Free cash flow is defined as Cash provided by (used for) operating activities - continuing operations less capital expenditures Under this definition free cash flow represents the cash generated by the Company from operations after investing in its asset base Free cash flow combined with cash balances and other sources of liquidity represent the cash available to fund obligations and provide returns to shareholders Free cash flow is an integral financial measure used in the Companys financial planning process
Net Sales by Segment
Three Months EndedDec 31 2020
Three Months Ended
In millions (Unaudited)
March 31 2021
March 31 2020
Packaging amp Specialty Plastics
$ 5126
$ 6082
$ 4609
Industrial Intermediates amp Infrastructure
3501
3607
3045
Performance Materials amp Coatings
2029
2123
2065
Corporate
50
70
51
Total
$ 10706
$ 11882
9770
Operating EBIT by Segment
Three Months EndedDec 31 2020
Three Months Ended
In millions (Unaudited)
March 31 2021
March 31 2020
Packaging amp Specialty Plastics
$ 780
$ 1228
$ 580
Industrial Intermediates amp Infrastructure
296
326
175
Performance Materials amp Coatings
50
62
162
Corporate
(72)
(62)
(74)
Total
$ 1054
$ 1554
843
Equity in Earnings (Losses) of Nonconsolidated Affiliates by Segment
Three Months EndedDec 31 2020
Three Months Ended
In millions (Unaudited)
March 31 2021
March 31 2020
Packaging amp Specialty Plastics
$ 77
$ 106
$ 5
Industrial Intermediates amp Infrastructure
36
115
(76)
Performance Materials amp Coatings
2
2
1
Corporate
(9)
1
(19)
Total
$ 106
$ 224
(89)
Adjusted Operating EBIT by Segment
Three Months EndedDec 31 2020
Three Months Ended
In millions (Unaudited)
March 31 2021
March 31 2020
Packaging amp Specialty Plastics
$ 703
$ 1122
$ 575
Industrial Intermediates amp Infrastructure
260
211
251
Performance Materials amp Coatings
48
60
161
Corporate
(63)
(63)
(55)
Total
$ 948
$ 1330
932
Operating Margin by Segment
Three Months EndedDec 31 2020
Three Months Ended
In millions (Unaudited)
March 31 2021
March 31 2020
Packaging amp Specialty Plastics
152
202
126
Industrial Intermediates amp Infrastructure
85
90
57
Performance Materials amp Coatings
25
29
78
Total
98
131
86
Adjusted Operating EBIT Margin by Segment
Three Months EndedDec 31 2020
Three Months Ended
In millions (Unaudited)
March 31 2021
March 31 2020
Packaging amp Specialty Plastics
137
184
125
Industrial Intermediates amp Infrastructure
74
58
82
Performance Materials amp Coatings
24
28
78
Total
89
112
95
Reconciliation of Income (loss) from continuing operations net of tax to Operating EBIT and Operating EBITDA
Three Months Ended
Nine Months Ended
March 31 2020
June 30 2020
September 30 2020
December 31 2020
March 31 2021
September 30 2020
September 30 2019
In millions (Unaudited)
As Reported
Pro Forma
Income (loss) from continuing operations net of tax
$ 258
$ (217)
$ (1)
$ 1254
$ 1006
$ 1006
$ 258
+ Provision for income taxes on continuing operations
138
34
43
562
317
317
138
Income (loss) from continuing operations before income taxes
$ 396
$ (183)
$ 42
$ 1816
$ 1323
$ 1323
$ 396
- Interest income
15
6
6
11
8
8
15
+ Interest expense and amortization of debt discount
1 Operating EBIT is defined as earnings (ie Income (loss) from continuing operations before income taxes) before interest excluding the impact of significant items
2 Operating EBITDA is defined as earnings (ie Income (loss) from continuing operations before income taxes) before interest depreciation and amortization excluding the impact of significant items
Significant Items Impacting Results for the Three Months Ended Mar 31 2021
In millions except per share amounts (Unaudited)
Pretax 1
Net Income 2
EPS 3
Reported results
$ 1323
$ 991
$ 132
Less Significant items
Restructuring implementation costs
(10)
(8)
(001)
Digitalization program costs
(33)
(25)
(003)
Total significant items
$ (43)
$ (33)
$ (004)
Operating results (non-GAAP)
$ 1366
$ 1024
$ 136
Significant Items Impacting Results for the Three Months Ended Mar 31 2020
In millions except per share amounts (Unaudited)
Pretax 1
Net Income 2
EPS 3
Reported results
$ 396
$ 239
$ 032
Less Significant items
Integration and separation costs
(65)
(51)
(007)
Restructuring and asset related charges - net
(96)
(79)
(011)
Loss on early extinguishment of debt
(86)
(70)
(009)
Total significant items
$ (247)
$ (200)
$ (027)
Operating results (non-GAAP)
$ 643
$ 439
$ 059
1 Income before income taxes
2 Net income (loss) available for Dow Inc common stockholders The income tax effect on significant items was calculated based upon the enacted tax laws and statutory income tax rates applicable in the tax jurisdiction(s) of the underlying non-GAAP adjustment
1 Free cash flow is defined as Cash provided by (used for) operating activities - continuing operations less capital expenditures Under this definition free cash flow represents the cash generated by the Company from operations after investing in its asset base Free cash flow combined with cash balances and other sources of liquidity represent the cash available to fund obligations and provide returns to shareholders Free cash flow is an integral financial measure used in the Companys financial planning process
2 Free cash flow in the first quarter of 2021 reflects a $1 billion elective pension contribution
Net Sales by Segment
Three Months EndedDec 31 2020
Three Months Ended
In millions (Unaudited)
March 31 2021
March 31 2020
Packaging amp Specialty Plastics
$ 5126
$ 6082
$ 4609
Industrial Intermediates amp Infrastructure
3501
3607
3045
Performance Materials amp Coatings
2029
2123
2065
Corporate
50
70
51
Total
$ 10706
$ 11882
9770
Operating EBIT by Segment
Three Months EndedDec 31 2020
Three Months Ended
In millions (Unaudited)
March 31 2021
March 31 2020
Packaging amp Specialty Plastics
$ 780
$ 1228
$ 580
Industrial Intermediates amp Infrastructure
296
326
175
Performance Materials amp Coatings
50
62
162
Corporate
(72)
(62)
(74)
Total
$ 1054
$ 1554
843
Equity in Earnings (Losses) of Nonconsolidated Affiliates by Segment
Three Months EndedDec 31 2020
Three Months Ended
In millions (Unaudited)
March 31 2021
March 31 2020
Packaging amp Specialty Plastics
$ 77
$ 106
$ 5
Industrial Intermediates amp Infrastructure
36
115
(76)
Performance Materials amp Coatings
2
2
1
Corporate
(9)
1
(19)
Total
$ 106
$ 224
(89)
Adjusted Operating EBIT by Segment
Three Months EndedDec 31 2020
Three Months Ended
In millions (Unaudited)
March 31 2021
March 31 2020
Packaging amp Specialty Plastics
$ 703
$ 1122
$ 575
Industrial Intermediates amp Infrastructure
260
211
251
Performance Materials amp Coatings
48
60
161
Corporate
(63)
(63)
(55)
Total
$ 948
$ 1330
932
Operating Margin by Segment
Three Months EndedDec 31 2020
Three Months Ended
In millions (Unaudited)
March 31 2021
March 31 2020
Packaging amp Specialty Plastics
152
202
126
Industrial Intermediates amp Infrastructure
85
90
57
Performance Materials amp Coatings
25
29
78
Total
98
131
86
Adjusted Operating EBIT Margin by Segment
Three Months EndedDec 31 2020
Three Months Ended
In millions (Unaudited)
March 31 2021
March 31 2020
Packaging amp Specialty Plastics
137
184
125
Industrial Intermediates amp Infrastructure
74
58
82
Performance Materials amp Coatings
24
28
78
Total
89
112
95
Reconciliation of Net income (loss) to Operating EBIT and Operating EBITDA
Three Months Ended
Nine Months Ended
March 31 2020
June 30 2020
September 30 2020
December 31 2020
March 31 2021
September 30 2020
September 30 2019
In millions (Unaudited)
As Reported
Pro Forma
Net income (loss)
$ 258
$ (217)
$ (1)
$ 1254
$ 1006
$ 1006
$ 258
+ Provision for income taxes
138
34
43
562
317
317
138
Income (loss) before income taxes
$ 396
$ (183)
$ 42
$ 1816
$ 1323
$ 1323
$ 396
- Interest income
15
6
6
11
8
8
15
+ Interest expense and amortization of debt discount
1 Operating EBIT is defined as earnings (ie Income (loss) before income taxes) before interest excluding the impact of significant items
2 Operating EBITDA is defined as earnings (ie Income (loss) before income taxes) before interest depreciation and amortization excluding the impact of significant items
Significant Items Impacting Results for the Three Months Ended Mar 31 2021
In millions except per share amounts (Unaudited)
Pretax 1
Net Income 2
EPS 3
Reported results
$ 1323
$ 991
$ 132
Less Significant items
Restructuring implementation costs
(10)
(8)
(001)
Digitalization program costs
(33)
(25)
(003)
Total significant items
$ (43)
$ (33)
$ (004)
Operating results (non-GAAP)
$ 1366
$ 1024
$ 136
Significant Items Impacting Results for the Three Months Ended Mar 31 2020
In millions except per share amounts (Unaudited)
Pretax 1
Net Income 2
EPS 3
Reported results
$ 396
$ 239
$ 032
Less Significant items
Integration and separation costs
(65)
(51)
(007)
Restructuring and asset related charges - net
(96)
(79)
(011)
Loss on early extinguishment of debt
(86)
(70)
(009)
Total significant items
$ (247)
$ (200)
$ (027)
Operating results (non-GAAP)
$ 643
$ 439
$ 059
1 Income before income taxes
2 Net income available for Dow Inc common stockholders The income tax effect on significant items was calculated based upon the enacted tax laws and statutory income tax rates applicable in the tax jurisdiction(s) of the underlying non-GAAP adjustment
1 Free cash flow is defined as Cash provided by (used for) operating activities - continuing operations less capital expenditures Under this definition free cash flow represents the cash generated by the Company from operations after investing in its asset base Free cash flow combined with cash balances and other sources of liquidity represent the cash available to fund obligations and provide returns to shareholders Free cash flow is an integral financial measure used in the Companys financial planning process
Net Sales by Segment
Three Months EndedDec 31 2020
Three Months Ended
In millions (Unaudited)
March 31 2021
March 31 2020
Packaging amp Specialty Plastics
$ 5126
$ 6082
$ 4609
Industrial Intermediates amp Infrastructure
3501
3607
3045
Performance Materials amp Coatings
2029
2123
2065
Corporate
50
70
51
Total
$ 10706
$ 11882
9770
Operating EBIT by Segment
Three Months EndedDec 31 2020
Three Months Ended
In millions (Unaudited)
March 31 2021
March 31 2020
Packaging amp Specialty Plastics
$ 780
$ 1228
$ 580
Industrial Intermediates amp Infrastructure
296
326
175
Performance Materials amp Coatings
50
62
162
Corporate
(72)
(62)
(74)
Total
$ 1054
$ 1554
843
Equity in Earnings (Losses) of Nonconsolidated Affiliates by Segment
Three Months EndedDec 31 2020
Three Months Ended
In millions (Unaudited)
March 31 2021
March 31 2020
Packaging amp Specialty Plastics
$ 77
$ 106
$ 5
Industrial Intermediates amp Infrastructure
36
115
(76)
Performance Materials amp Coatings
2
2
1
Corporate
(9)
1
(19)
Total
$ 106
$ 224
(89)
Adjusted Operating EBIT by Segment
Three Months EndedDec 31 2020
Three Months Ended
In millions (Unaudited)
March 31 2021
March 31 2020
Packaging amp Specialty Plastics
$ 703
$ 1122
$ 575
Industrial Intermediates amp Infrastructure
260
211
251
Performance Materials amp Coatings
48
60
161
Corporate
(63)
(63)
(55)
Total
$ 948
$ 1330
932
Operating Margin by Segment
Three Months EndedDec 31 2020
Three Months Ended
In millions (Unaudited)
March 31 2021
March 31 2020
Packaging amp Specialty Plastics
152
202
126
Industrial Intermediates amp Infrastructure
85
90
57
Performance Materials amp Coatings
25
29
78
Total
98
131
86
Adjusted Operating EBIT Margin by Segment
Three Months EndedDec 31 2020
Three Months Ended
In millions (Unaudited)
March 31 2021
March 31 2020
Packaging amp Specialty Plastics
137
184
125
Industrial Intermediates amp Infrastructure
74
58
82
Performance Materials amp Coatings
24
28
78
Total
89
112
95
Reconciliation of Income (loss) from continuing operations net of tax to Operating EBIT and Operating EBITDA
Three Months Ended
Nine Months Ended
March 31 2020
June 30 2020
September 30 2020
December 31 2020
March 31 2021
September 30 2020
September 30 2019
In millions (Unaudited)
As Reported
Pro Forma
Income (loss) from continuing operations net of tax
$ 258
$ (217)
$ (1)
$ 1254
$ 1006
$ 1006
$ 258
+ Provision for income taxes on continuing operations
138
34
43
562
317
317
138
Income (loss) from continuing operations before income taxes
$ 396
$ (183)
$ 42
$ 1816
$ 1323
$ 1323
$ 396
- Interest income
15
6
6
11
8
8
15
+ Interest expense and amortization of debt discount
1 Operating EBIT is defined as earnings (ie Income (loss) from continuing operations before income taxes) before interest excluding the impact of significant items
2 Operating EBITDA is defined as earnings (ie Income (loss) from continuing operations before income taxes) before interest depreciation and amortization excluding the impact of significant items
Significant Items Impacting Results for the Three Months Ended Mar 31 2021
In millions except per share amounts (Unaudited)
Pretax 1
Net Income 2
EPS 3
Reported results
$ 1323
$ 991
$ 132
Less Significant items
Restructuring implementation costs
(10)
(8)
(001)
Digitalization program costs
(33)
(25)
(003)
Total significant items
$ (43)
$ (33)
$ (004)
Operating results (non-GAAP)
$ 1366
$ 1024
$ 136
Significant Items Impacting Results for the Three Months Ended Mar 31 2020
In millions except per share amounts (Unaudited)
Pretax 1
Net Income 2
EPS 3
Reported results
$ 396
$ 239
$ 032
Less Significant items
Integration and separation costs
(65)
(51)
(007)
Restructuring and asset related charges - net
(96)
(79)
(011)
Loss on early extinguishment of debt
(86)
(70)
(009)
Total significant items
$ (247)
$ (200)
$ (027)
Operating results (non-GAAP)
$ 643
$ 439
$ 059
1 Income before income taxes
2 Net income available for Dow Inc common stockholders The income tax effect on significant items was calculated based upon the enacted tax laws and statutory income tax rates applicable in the tax jurisdiction(s) of the underlying non-GAAP adjustment
3 Earnings per common share - diluted
AGENDA
Operating Segment PerformanceQuarterly Highlights
Outlook Positioned for Long-term Value Creation
1 2
3 4
2
Double-digit gains in Net Sales and Op EBIT both YoY and sequentially
Net Sales up in all segments and regions YoY and sequential sales increase led by pricing gains in all segments
and regions
Volume in-line YoY ndash gains in construction mobility electronics and consumer durables end markets offset by supply constraints from Uri
Op EBIT up gt$700MM led by Packaging amp Specialty Plastics and Industrial Intermediates amp Infrastructure
Generated gt$750MM of cash flow from operating activities ndashcontinuing operations1 excluding the $1B elective pension contribution
2021 cash tailwind of ~$350MM YoY will be provided to Dow by Sadara debt reprofiling Sadara expected to be cash flow self-sufficient
1Q | 2021 HIGHLIGHTS
Net Sales up YoY
22
gt$310MM increase in YoY Equity Earnings
+450 bps Op EBIT Margin
Improvement YoY
3
$521MMReturned to shareholders
1 Cash used for operating activities ndash continuing operations was $228 million in the quarter
Y-o-
Y
Op EBIT uarr 112 Margin uarr 760bps
Driven by margin improvement and increased equity earnings
Q-o
-Q
Op EBIT uarr 57 Margins uarr 500bps
Local price gains in industrial and consumer packaging and flexible food and beverage
packaging margin uplift in HampE
1Q21 OPERATING SEGMENT PERFORMANCE
4609 5126 6082
30 00
35 00
40 00
45 00
50 00
55 00
60 00
65 00
1Q20 4Q20 1Q21
126152
202580
780
1228
0
200 00
400 00
600 00
800 00
100 000
120 000
140 000
1Q20 4Q20 1Q21
REVENUE ($MM) Op EBIT ($MM) amp Op EBIT Margin
Y-o-
Y
Sales uarr 32 Volume uarr 5 Price uarr 24
Strong supplydemand fundamentals local price gains in all regions volume growth in
both businesses and most regions
Q-o
-Q
Sales uarr 19 Volume darr 1 Price uarr 19
Continued pricing momentum across all regions and most applications particularly in
consumer packaging
Y-o-
Y
Op EBIT uarr 86 Margin uarr 330bps
Led by improved equity earnings and local price gains in both businesses
Q-o
-Q
Op EBIT uarr 10 Margins uarr 50bps
Driven by higher equity earnings including continued improvement at Sadara
3045 3501 3607
22 00
24 00
26 00
28 00
30 00
32 00
34 00
36 00
38 00
40 00
1Q20 4Q20 1Q21
175
296 326
57
85 90
60
110
160
210
260
310
360
0
1
2
3
4
5
6
7
8
9
10
1Q20 4Q20 1Q21
REVENUE ($MM)
Y-o-
Y
Sales uarr 18 Volume darr 6 Price uarr 21Local price gains in all regions increased consumer durable goods and appliances
demand partly offset by impacts from Winter Storm Uri
Q-o
-QSales uarr 3 Volume darr 10 Price uarr 12
Local price gains more than offset volume declines due to Winter Storm Uri impacts
Y-o-
Y
Op EBIT darr 62 Margin darr 490bps
Price gains and strong demand in coatings and silicones more than offset by the impact of the winter storm and planned maintenance
Q-o
-Q
Op EBIT uarr 24 Margins uarr 40bpsMargin expansion in performance silicones and coatings applications partially offset by
planned maintenance and winter storm impacts
2065 2029 2123
10 00
12 00
14 00
16 00
18 00
20 00
22 00
24 00
26 00
28 00
30 00
1Q20 4Q20 1Q21
78
25 29
162
50 62
0
500 0
100 00
150 00
200 00
250 00
300 00
350 00
400 00
450 00
500 00
1Q20 4Q20 1Q21
REVENUE ($MM)
Y-o-
Y
Sales uarr 3 Volume darr 4 Price uarr 4Price gains in all regions positive impacts from currency strong demand for silicone applications and DIY coatings more than
offset by supply constraints
Q-o
-Q
Sales uarr 5 Volume darr 1 Price uarr 5
Strong local price gains for acrylic monomers and siloxanes more than offset supply
constraints
Pack
agin
g amp
Spec
ialty
Pla
stic
sIn
d In
term
edia
tes
amp In
fras
truc
ture
Perf
Mat
eria
ls
amp C
oatin
gs
Op EBIT ($MM) amp Op EBIT Margin
Op EBIT ($MM) amp Op EBIT Margin
4
Winter Storm Uri amp Planned
Maintenance Impact
2Q21 MODELING GUIDANCE
5
Net Sales ~$124 ndash $129B Depreciation amp Amortization ~$715MM
Quarterly Operational Tax Rate ~21 ndash 25 Net Interest Expense (Net of Int Income) ~$185MM
Net Income Attrib to Non-Controlling Int ~$20MM Share Count ~750MM
Top-Line Ranges (2Q21 vs 1Q21)
Base Case Op EBIT Drivers(2Q21 vs 1Q21)
Sales ∆ QoQ
Low High
Packaging amp Specialty Plastics +3 +7
Add-Back 1Q21 Winter Storm Uri Impact (~$200MM tailwind) Continued strong demand for packaging applications globally further supported by seasonal increases Low inventory levels tight supply from industry outages Increased spend entering turnaround season USGC cracker planned maintenance activity (~$175MM headwind)
IndustrialIntermediates amp Infrastructure
+5 +10
Add-Back 1Q21 Winter Storm Uri Impact (~$150MM tailwind) Durable goods demand remains robust with industrial construction auto and oil amp gas end-markets continuing to improve Impact from third-party outages (~$100MM headwind) Increased turnaround spending at USGC sites primarily in polyurethanes (~$50MM headwind)
Performance Materials amp Coatings +5 +10
Add-Back 1Q21 Winter Storm Uri Impact (~$50MM tailwind) Demand strength for electronics mobility and home care applications in silicones Continued sequential demand improvement for architectural coatings Add-Back Turnarounds completed in Deer Park and Zhangjiagang (~$100MM tailwind)
Corporate Sales of $50MM Op EBIT of $(75)MM and Op EBITDA of $(65)MM
Recovery from Winter Storm Uri and continuation of robust demand leading to favorable market fundamentals
Corporate Op EBIT of ~$(275)MM and Op EBITDA of ~$(250)MM
Turnaround Costs Up ~$500MM YoY incl JVs incremental $100MM increase due to Winter Storm Uri impacts
Restructuring ~$300MM expected to be substantially complete by YE21 ~50 by mid-2021
Cash Flow Considerations in 2021
Dividends from Equity Companies ~$200MM (down ~$200MM YoY)
Sadara No cash outflow (~$350MM tailwind YoY)
DWDP Integration Separation and Synergy Costs
No cash outflow ($350MM tailwind YoY)
Pension Contributions
~$12B total cash outflow ($10B elective contribution completed in 1Q21)
Liability Management
~$10B elective contribution to pension reduces rating agency adjusted leverage
CapEx ~$16B (~350MM higher YoY)
2020 Restructuring Program ~$350MM cash outflow
Digital Initiative ~$150MM cash outflow
Other Income Statement Considerations
Net Interest Expense ~$775MM
DampA ~$29B
Net Income Attribto Non-Controlling Int ~$75MM (reduction to reported Net Income)
Share Count ~750MM
Op Tax Rate 21-25
POINTS OF DISTINCTION ENABLE CONTINUED OUTPERFORMANCE
7
End-market recovery benefits Dowrsquos consumer-led portfolio further enhancing performance and shareholder returns
Leading Cash Flow and Shareholder Remuneration Yield Attractive End Market Growth
Dow Continues to be a Compelling Investment Opportunity
bull ~$9B in Free Cash Flow1 generated
bull Disciplined focus drove 93 op cash flow conversion17
bull Free cash flow yield27 of ~11 best-in-class and well ahead of peers sector and overall market average
bull Best-in-class shareholder yield vs peers3
bull Top quartile cost management amp margin performance
1
Packaging ~15x GDP
Addressable Market$650B
Infrastructure ~13x GDP
Consumer ~15x GDP
Mobility ~15x GDP
Dow Peer Range4 SampP 500 Chemicals SampP 500
EVEBITDA NTM56 79x 50x ndash 99x 133x 146x
Free Cash Flow Yield27 106 22 - 79 36 46
Dividend Yield6 45 23 - 48 19 15
Net Debt Change8 darr ~$5B darr ~$3B to uarr ~$5B - -
Differentiated Portfolio with Leading Positions
1 Siloxanes
1 Acrylic Binders
1 Propylene Oxide
1 Propylene Glycol
1 Polyols
1 Purified Ethylene Oxide
1 Amines
1 Solvents
1 Ethylene
2 Polyethylene
1 Ethylene Copolymers
1 Polyethylene Licensing
1 Polyolefins Elastomers
1 Polyolefins Plastomers
(1) 2019 and 2020 total(2) 2019-2020 average(3) 2020
(4) Benchmarking peer set includes Arkema BASF Covestro Eastman Huntsman Lyondell Wacker
(5) NTM is defined as Next Twelve Months
(6) As of 03312021 FactSet (7) 2019 Dow data is on a pro forma basis (8) YE2020 vs YE2018
0
300
600
900
1200
2020 2022 2024 2026 2028 2030
MM
Mill
ion
Tonn
es Mechanical Recycling OtherPartnershipsAdvanced Recycling
PLASTIC CIRCULARITY ROADMAP DRIVES NEAR- AND LONG-TERM GROWTH
Through innovation collaboration and partnerships Dow is leading the way for sustainability in plastics
By 2030 Dow will STOP THE WASTE by enabling 1 million metric tons of plastic to be collected reused or recycled through its direct actions and partnerships
By 2035 Dow will CLOSE THE LOOP by enabling 100 of Dow products sold into packaging applications to be reusable or recyclable
1MM mta Target Plastic collected reused recycled
80
90
100
2020 2025 2030 2035
P
rodu
cts S
old Advanced Recycling
Application Development
100 Target Packaging products reusable or recyclable
Collaborating to drive innovation
and action
Integrating recycled and bio-based
feedstocks
Demonstrating innovative applications
for recycled plastics
Helping customers design for
recyclability
Innovating new products with post-consumer material
Dow is uniquely advantaged by a broad and differentiated portfolio to capture favorable industry supply-demand dynamics
Consumer spending drives ~1-15x GDP demand growth for Industrial Solutions and Polyurethanes
Renewables amp energy efficiency are key growth drivers
Incremental investments in US Gulf Coast Europe and China expect ~$200MMyear EBITDA run-rate
Broad participation in industrial and infrastructure end markets support long-term growth
High value end markets growing ~15-2x GDP upstream capacity availability enables high-value derivative growth
Rapid adoption of EV 5G Cloud Computing drives demand for innovation products
Lower-cost higher-return expansions expected to enable downstream growth of gt$350MMyear EBITDA run-rate
Infrastructure plan COVID-19 recovery expansion benefits
Incremental investments keep pace with ~13-15x GDP demand growth
Continue product mix upgrade to higher return end markets and applications
Canada cracker expansion and debottlenecking PE capacity expect ~$400MMyear EBITDA run-rate
Functional Polymers for infrastructure automotive and photovoltaics delivers outperformance vs peers
0
10
20
30
40
50
60
70
80
90
100
2022E 2023E 2024E 2025E 2026E0
4000
8000
12000
16000
0
10
20
30
40
50
60
70
80
90
100
2022E 2023E 2024E 2025E 2026E0
1000
2000
3000
4000
5000
6000
lsquo000 MTs lsquo000 MTs lsquo000 MTs
Polyethylene MDI Siloxane
30
40
50
60
70
80
90
100
2022E 2023E 2024E 2025E 2026E0
50000
100000
150000
200000
250000
Constructive near-term supply-demand balances Further tightening with expected capacity delays cancellations and typical outages
Adjusted Operating Rate s include typical industry planned outages and delayedcancelled new capacity additions based on historical averages
IHS SAGSI and other company annual reports and disclosuresIndustry consultant views use industry nameplate capacity and include all announced capacity additionsNote Industry operating rate estimates are based on views as of April 2021 and subject to change
1Q 2021 FINANCIAL HIGHLIGHTS
YoY Operating EPS Reconciliation Key Drivers in the Quarter YoYbull Pricing momentum across all segments and
regions led by polyethylene and polyurethane applications
bull Resilient demand in packaging and demand growth in construction mobility electronics and consumer durables end markets
bull Improved equity earnings led by Sadara and the Kuwait joint ventures
bull Lower tax rate on earnings recovery and geographic mix
bull Lower DampA and interest expense offset share count increase
bull Increased turnaround spending on delays from 2020 due to impacts of the pandemic
bull Impact of supply constraints and repair expenses related to Winter Storm Uri on the US Gulf Coast
Financial Summary($ millions unless otherwise noted)
Operating EBITDA $2271 $1567 $704 $1780 $491Earnings per share ndash GAAP $132 $032 $100 $165 $(033)Operating earnings per share $136 $059 $077 $081 $055Cash Provided by (Used for) Op Activities ndashCont Ops1
Op EBITDA to CFFO (Cash Flow Conversion1 )
$(228)(10)
$123679
$(1464) $165693
$(1884)
$059
$136
1Q20 MarginExpansion
Winter Storm Uri Turnarounds Tax Rate Equity Earnings 1Q21
111 Cash Provided by (Used for) Operating Activities ndash Continuing Operations and Cash Flow Conversion include a $1 billion elective pension contribution in the first quarter of 2021
PRINCIPAL JOINT VENTURE DETAIL
1Q 2021 1Q 2020 4Q 2020
$ millions (unaudited)Sadara
KuwaitJVs
ThaiJVs Sadara
KuwaitJVs
ThaiJVs Sadara
KuwaitJVs
ThaiJVs
EBITDA $163 $183 $52 $9 $110 $4 $137 $152 $28
EBIT $106 $144 $44 $(78) $65 $(6) $34 $104 $19
Net IncomeEquity Earnings (Losses) to Dow $55 $119 $34 $(116) $40 $(9) $3 $86 $15
EBITDA in Excess of Eq Earnings $108 $64 $18 $125 $70 $13 $134 $66 $13
Dowrsquos Proportional Share of Principal JV Financial Results
Kuwait JVs Margin expansion from price increases in MEG
Thai JVs Polyethylene margin expansion
Sadara Margin expansion in polyurethane and polyethylene applications
Drivers of YoY and PQ Changes
12Note 4Q2020 values were revised to reflect audited JV financial statements for Sadara
Dow FY20 Benchmarking Update
14
BENCHMARKING PEERS
Benchmarking conducted against segment level peers if sufficient information disclosed otherwise corporate level
15
TOTAL DOW BENCHMARKING SUMMARY OF OBSERVATIONS
Benchmarking Strengths amp Gaps
TotalDow
FY20 YoY Adj Op EBITDA growth trailed the peer median as resilient demand for packaging applications and recovery in durable good end markets was more than offset by upstream pricing pressures in siloxanes and acrylic monomers along with lower relative participation for polyurethanes in Asia which experienced a shorter COVID-19 downturn
In-Flight Actions Implement faster payback higher ROIC expansions reduce merchant positions of intermediatesbull Expansion of FS-1 cracker is underway (+65KTA) that will feed downstream derivative PE demandbull South China Specialties Hub (~250KTA) specialty PU and alkoxylates to participate in Asia growth bull Downstream silicones expansions (~15 projects in 2021) to reduce merchant siloxane intermediates exposure
FY20 Adj Op EBITDA margin remained resilient and among the best in the peer group through the economic downturn and recovery from COVID-19
Cash Flow Conversion among highest in the peer group from a disciplined focus on cash generation and structural working capital efficiency gains
SGampA + RampD as of sales remained among best in peer group from continued cost discipline
Best-in-class Free Cash Flow yield above sector and market averages
Net debt reduced more than peers on strong cash generation and focused capital allocation priorities
Source Dow data CapitalIQ Company ReleasesUnless otherwise noted all 2018 and 2019 financial information for Dow is on a pro forma basisAdjusted Operating EBITDA is defined as Operating EBITDA excluding equity earnings
Adj Op EBITDA Margin excludes transactions with certain nonconsolidated affiliates Cash Flow Conversion is defined as Cash from Continuing Operations divided by Operating EBITDAFree Cash Flow is defined as Cash from Continuing Operations less Capital Expenditures
16
TOTAL DOW
(1) Adjusted Operating EBITDA is defined as Operating EBITDA excluding equity earnings Adj Op EBITDA Margin excludes transactions with certain nonconsolidated affiliates
(2) Benchmarking peer set range includes Arkema BASF Covestro Eastman Huntsman Lyondell Wacker(3) Cash Flow Conversion is defined as Cash From Continuing Operations divided by Operating EBITDA(4) Median excludes Dow
Adj Op EBITDA Growth
Adj Op EBITDA Margin Cash Flow Conversion SGampA + RampD
(as a of Sales)FY20 vs FY19
FY20
Median Excl Dow
Median Excl Dow
BENCHMARKING SNAPSHOT (1234)
FY20 UPDATE amp FY19
FY19
-60
-50
-40
-30
-20
-10
0
10
FY19 vs FY18
FY20 FY19 FY20 FY19
Median Excl Dow
Median Excl Dow
5
10
15
20
25
Median Excl Dow
Median Excl Dow
30
50
70
90
110
130
150
Median Excl Dow Median
Excl Dow
0
5
10
15
20
25
Median Excl Dow
Median Excl Dow
Source Dow data CapitalIQ Company disclosures
Unless otherwise noted all 2018 and 2019 financial information for Dow is on a pro forma basisFor further unaudited pro forma financial information refer to the Companyrsquos Current Report on Form 8-K dated June 3 2019 and 4Q20 Earnings materials included in the Current Report on Form 8-K dated January 28 2021
bull Hallmark safety performance and operational excellence
bull Focused portfolio with market leading positions in key value chains
bull Consumer tilted portfolio in growing end-market verticals
bull Global footprint with integrated value chains that provide differentiated product offerings
CORE STRENGTHSbull Maintain focus on cash
generation and low-cost curve position
bull Continued disciplined capital allocation
bull Use innovation pipeline to collaborate with customers and capture growth trends
bull Invest in incremental higher return faster payback growth opportunities
bull Deliver sustainable future through Industry leading ESG position
Average Annual Free Cash Flow (2019-2020)as of 2020 Market Cap
17
TOP-QUARTILE CASH REMUNERATION YIELD AND DEBT REDUCTION
Median Excl Dow
~84
Median Excl Dow
+02B
Median Excl Dow
~6
Median Excl Dow
~3
(1) Benchmarking peer set range includes Arkema BASF Covestro Eastman Huntsman Lyondell Wacker(2) Source Dow data FactSet and Company Releases for Peers(3) Dow Market Capitalization as of YE2020 was ~$412B
Unless otherwise noted all 2018 and 2019 financial information for Dow is on a pro forma basisFor further unaudited pro forma financial information refer to the Companyrsquos Current Report on Form 8-K dated June 3 2019 and 4Q20 Earnings materials included in the Current Report on Form 8-K dated January 28 2021
18
CULTURE OF BENCHMARKING SUMMARY OF OBSERVATIONS
Segment FY20 Benchmarking Strengths amp Gaps
PampSP
FY20 YoY Adj Op EBITDA growth tracked the peer median as peers with more exposure to naphtha rebounded from a lower 2019 performance from cost pressures
FY20 Adj Op EBITDA margin more resilient than most peers Op EBITDA per pound polyolefin capacity ahead of peers advantage continues to widen Free Cash Conversion continued to improve and is best-in-class among the peer set SGampA + RampD as of sales remained among lowest in the peer group
IIampI
FY20 YoY Adj Op EBITDA growth and Adj Op EBITDA margin trailed the peer median as strengthening durable good end-markets in 2H20 were offset by decisive actions taken earlier in 1H20 to match production to demand as well as lower relative participation in Asia which experienced a shorter COVID-19 demand downturn
Free Cash Conversion is best-in-class among the peer set SGampA + RampD as of sales remained among lowest in the peer group
PMampC
FY20 YoY Adj Op EBITDA growth trailed the peer median due to greater exposure to siloxanes and acrylic monomers that were more heavily impacted by demand downturn and competitive pricing actions
FY20 Adj Op EBITDA margin trailed the peer median as strong demand for home care and DIY coatings was more than offset by personal care and automotive applications that lagged broader recovery
Free Cash Conversion among highest in the peer group SGampA + RampD as of sales best-in-class expanded advantage vs next closest peer
Source Dow data CapitalIQ Company ReleasesAdjusted Operating EBITDA is defined as Operating EBITDA excluding equity earnings Adj Op EBITDA Margin excludes transactions with certain nonconsolidated affiliatesFree Cash Conversion for Dow is defined as Adj Op EBITDA less Capex divided by Adj Op EBITDA
Unless otherwise noted all 2018 and 2019 financial information for Dow is on a pro forma basisFor further unaudited pro forma financial information refer to the Companyrsquos Current Report on Form 8-K dated June 3 2019 and 4Q20 Earnings materials included in the Current Report on Form 8-K dated January 28 2021
19
PACKAGING amp SPECIALTY PLASTICS
Adj Op EBITDA Growth(7)
Adj Op EBITDA Margin Free Cash Conversion SGampA + RampD
(as a of Sales)bull World-class packaging
franchise
bull Most flexible feedstock capability in the industry
bull Flexible polyolefins assets
bull Proprietary catalyst and process technology
bull Differentiated co-monomer capability
bull Global low-cost footprint
bull Maintain focus on cash conversion and cost discipline
bull Leverage differentiated product offerings and innovation pipeline to meet growing demand
bull Accelerate sell-up opportunities of higher margin product mix
bull Incremental quick payback investments and capacity expansions
bull Plastics circularity energy intensity CO2 footprint
CORE STRENGTHS FOCUS AREASFY20 vs FY19
FY20
Median Excl Dow
Median Excl Dow
FY19
-80
-60
-40
-20
0
20
40
FY19 vs FY18
FY20 FY19 FY20 FY19
Median Excl Dow
Median Excl Dow
5
10
15
20
25
Median Excl Dow
Median Excl Dow
0
20
40
60
80
Median Excl Dow
Median Excl Dow
0
5
10
15
Median Excl Dow
Median Excl Dow
Source Dow data CapitalIQ Company disclosures
(1) Adjusted Operating EBITDA is defined as Operating EBITDA excluding equity earningsAdj Op EBITDA Margin excludes transactions with certain nonconsolidated affiliates
(2) Benchmarking peer set range includes LyondellBasell Olefins amp Polyolefins Chevron Phillip Chemical Borealis Polyolefins ExxonMobil Chemicals (entire segment)
(3) Free Cash Conversion for Dow is defined as Adj Op EBITDA less Capex divided by Adj Op EBITDA(4) Median excludes Dow(5) SGampA + RampD reflects corporate level for peers where segment level data is unavailable
BENCHMARKING SNAPSHOT (123456)
FY20 UPDATE amp FY19
(6) CPChem results are as of 3Q20 TTM(7) Adj Op EBITDA Growth chart capped for visual purposes top peer was ~90
Unless otherwise noted all 2018 and 2019 financial information for Dow is on a pro forma basisFor further unaudited pro forma financial information refer to the Companyrsquos Current Report on Form 8-K dated June 3 2019 and 4Q20 Earnings materials included in the Current Report on Form 8-K dated January 28 2021
bull Full feedstock-to-polymer integration continues to deliver enhanced value
(1) Segment Op EBITDA based on FY20 reported figures including equity income from affiliatesJVs Capacity based on latest company reported nameplate for PE and PP (2019 for Dow 2020 10-K for Lyondell) including share of JVs or ICIS reported capacity for 2019 including share of JVs if not available (Borealis)
(2) Borealis Polyolefins EBITDA adjusted for equity earnings from JVsUnless otherwise noted all 2018 and 2019 financial information for Dow is on a pro forma basisFor further unaudited pro forma financial information refer to the Companyrsquos Current Report on Form 8-K dated June 3 2019 and 4Q20 Earnings materials included in the Current Report on Form 8-K dated January 28 2021
21
INDUSTRIAL INTERMEDIATES amp INFRASTRUCTURE
bull Top global producer of key raw materials (EO PO)
bull Flexible manufacturing model through integration
bull Top 3 PU Systems House business
bull Industrial Solutions contains products with some of the highest returns to ethylene
bull Maintain focus on cash conversion and cost discipline
bull Drive PU mix towards higher margin Perf Polyols amp Systems
bull Implement faster payback higher ROIC expansions (China Specialties hub differentiated PU applications and DIS alkoxylates)
FOCUS AREASAdj Op EBITDA Growth
Adj Op EBITDA Margin Free Cash Conversion SGampA + RampD
(as a of Sales)
Median Excl Dow
Median Excl Dow Median
Excl Dow
Median Excl Dow
CORE STRENGTHS
Source Dow data CapitalIQ Company disclosures
FY20 vs FY19 FY20 FY19
FY19 vs FY18 FY20 FY19 FY20 FY19
-60
-40
-20
0
20
Median Excl Dow
Median Excl Dow
0
5
10
15
20
25
Median Excl Dow
Median Excl Dow
-10
10
30
50
70
90
Median Excl Dow Median
Excl Dow
0
5
10
15
20
Median Excl Dow Median
Excl Dow
(1) Adjusted Operating EBITDA is defined as Operating EBITDA excluding equity earnings Adj Op EBITDA Margin excludes transactions with certain nonconsolidated affiliates
(2) Benchmarking peer set range includes Eastman Huntsman Covestro LyondellBasell Intermediates amp Derivatives segment(3) Free Cash Conversion for Dow is defined as Adj Op EBITDA less Capex divided by Adj Op EBITDA(4) Median excludes Dow(5) SGampA + RampD reflects corporate level for peers where segment level data is unavailable
BENCHMARKING SNAPSHOT (12345)
FY20 UPDATE amp FY19
Unless otherwise noted all 2018 and 2019 financial information for Dow is on a pro forma basisFor further unaudited pro forma financial information refer to the Companyrsquos Current Report on Form 8-K dated June 3 2019 and 4Q20 Earnings materials included in the Current Report on Form 8-K dated January 28 2021
22
PERFORMANCE MATERIALS amp COATINGS
Adj Op EBITDA Growth
Adj Op EBITDA Margin
SGampA + RampD (as a of Sales) FOCUS AREAS
bull Maintain focus on cash conversion and cost discipline
bull Accelerate organic growth and explore bolt-on inorganic growth
bull Innovate with customers on sustainable solutions
bull Improve acrylic monomer and siloxane margins drive more captive use
bull Grow industrial coatings in prioritized end markets
bull World-class silicones franchise
bull Lowest cost siloxanes producer
bull Leading coatings solutions provider
bull World-scale acrylic monomer assets
bull One of the largest B2B digital platforms
bull Unique hybrid chemistry opportunities
bull Leading SGampA and RampD efficiency
Free Cash Conversion
Median Excl Dow
Median Excl Dow
Median Excl Dow
CORE STRENGTHSFY20 vs FY19 FY20 FY19
FY19 vs FY18 FY20 FY19 FY20 FY19
-40
-30
-20
-10
0
10
Median Excl Dow
Median Excl Dow
5
10
15
20
25
30
35
Median Excl Dow Median
Excl Dow
40
50
60
70
80
Median Excl Dow
Median Excl Dow
5
10
15
20
Median Excl Dow
Median Excl Dow
Source Dow data CapitalIQ Company disclosures
(1) Adjusted Operating EBITDA is defined as Operating EBITDA excluding equity earnings Adj Op EBITDA Margin excludes transactions with certain nonconsolidated affiliates
(2) Benchmarking peer set range includes Celanese Acetyl Chain Wacker Silicones segment Shin-Etsu Silicones segment Arkema Covestro Coatings segment
(3) Free Cash Conversion for Dow is defined as Adj Op EBITDA less Capex divided by Adj Op EBITDA(4) Median excludes Dow(5) SGampA + RampD reflects corporate level for peers where segment level data is unavailable
BENCHMARKING SNAPSHOT (1234)
FY20 UPDATE amp FY19
Unless otherwise noted all 2018 and 2019 financial information for Dow is on a pro forma basisFor further unaudited pro forma financial information refer to the Companyrsquos Current Report on Form 8-K dated June 3 2019 and 4Q20 Earnings materials included in the Current Report on Form 8-K dated January 28 2021
Appendix
OPERATING EARNINGS PER SHARE (EPS) RECONCILIATION
24
In millions except per share amounts (Unaudited) Pretax 1 Net Income 2 EPS 3
Significant Items Impacting Results for the Three Months Ended Mar 31 2021
Significant Items Impacting Results for the Three Months Ended Mar 31 2020
2 Net income available for Dow Inc common stockholders The income tax effect on signif icant items w as calculated based upon the enacted tax law s and statutory income tax rates applicable in the tax jurisdiction(s) of the underlying non-GAAP adjustment
1 Income before income taxes
3 Earnings per common share - diluted
Non-GAAP - Sig Items
DOW CONFIDENTIAL - Do not share without permission
Non-GAAP - EBITDA Recon
DOW CONFIDENTIAL - Do not share without permission
Non-GAAP - Segment Info
DOW CONFIDENTIAL - Do not share without permission
Non-GAAP - Cash Flow Measures
DOW CONFIDENTIAL - Do not share without permission
Non-GAAP - Net Debt
DOW CONFIDENTIAL - Do not share without permission
RECONCILIATION OF NET INCOME (LOSS) TO OPERATING EBIT amp OPERATING EBITDA
25
In millions (Unaudited)
Net income (loss) $ 258 $ (217) $ (1) $ 1254 $ 1006 + Provision for income taxes 138 34 43 562 317Income (loss) before income taxes $ 396 $ (183) $ 42 $ 1816 $ 1323 - Interest income 15 6 6 11 8+ Interest expense and amortization of debt discount 215 200 202 210 196- Significant items (247) (46) (523) 961 (43)Operating EBIT 1 $ 843 $ 57 $ 761 $ 1054 $ 1554 + Depreciation and amortization 724 700 724 726 717Operating EBITDA 2 $ 1567 $ 757 $ 1485 $ 1780 $ 2271 Operating EBITDA - Trailing Twelve Months (TTM) basis $ 6971 $ 5926 $ 5555 $ 5589 $ 6293 1 Operating EBIT is defined as earnings (ie Income (loss) before income taxes) before interest excluding the impact of signif icant items2 Operating EBITDA is defined as earnings (ie Income (loss) before income taxes) before interest depreciation and amortization excluding the impact of signif icant items
Reconciliation of Net income (loss) to Operating EBIT and Operating EBITDA
March 31 2020
Three Months Ended
September 30 2020June 30 2020 March 31 2021December 31 2020
Non-GAAP - Sig Items
DOW CONFIDENTIAL - Do not share without permission
Non-GAAP - EBITDA Recon
DOW CONFIDENTIAL - Do not share without permission
Non-GAAP - Segment Info
DOW CONFIDENTIAL - Do not share without permission
Non-GAAP - Cash Flow Measures
DOW CONFIDENTIAL - Do not share without permission
Non-GAAP - Net Debt
DOW CONFIDENTIAL - Do not share without permission
SEGMENT INFORMATION
26
Net Sales by Segment
In millions (Unaudited) March 31 2021 March 31 2020
2 Free cash f low in the f irst quarter of 2021 reflects a $1 billion elective pension contribution
Three Months Ended
1 Cash f low conversion is defined as Cash provided by (used for) operating activities - continuing operations divided by Operating EBITDA
Three Months Ended
1 Free cash f low is defined as Cash provided by (used for) operating activities - continuing operations less capital expenditures Under this definition free cash f low represents the cash generated by the Company from operations after investing in its asset base Free cash f low combined w ith cash balances and other sources of liquidity represent the cash available to fund obligations and provide returns to shareholders Free cash f low is an integral f inancial measure used in the Companys f inancial planning process
2 Cash f low conversion in the f irst quarter of 2021 reflects a $1 billion elective pension contribution
Non-GAAP - Sig Items
DOW CONFIDENTIAL - Do not share without permission
Non-GAAP - EBITDA Recon
DOW CONFIDENTIAL - Do not share without permission
Non-GAAP - Segment Info
DOW CONFIDENTIAL - Do not share without permission
Non-GAAP - Cash Flow Measures
DOW CONFIDENTIAL - Do not share without permission
Non-GAAP - Net Debt
DOW CONFIDENTIAL - Do not share without permission
RECONCILIATION OF NET DEBT
29
Reconciliation of Net Debt
In millions (Unaudited)Notes payable $ 152 $ 156 Long-term debt due within one year 492 460Long-term debt 16200 16491
DOW CONFIDENTIAL - Do not share without permission
Non-GAAP - EBITDA Recon
DOW CONFIDENTIAL - Do not share without permission
Non-GAAP - Segment Info
DOW CONFIDENTIAL - Do not share without permission
Non-GAAP - Cash Flow Measures
DOW CONFIDENTIAL - Do not share without permission
Non-GAAP - Net Debt
DOW CONFIDENTIAL - Do not share without permission
Background On April 1 2019 DowDuPont completed the separation of its materials science business and Dow Inc became the direct parent company of TDCC owning all of the outstanding common shares of TDCC For filings related to the period commencing April 1 2019 and thereafter TDCC was deemed the predecessor to Dow Inc and the historical results of TDCC are deemed the historical results of Dow Inc for periods prior to and including March 31 2019
The separation was contemplated by the merger of equals transaction effective August 31 2017 under the Agreement and Plan of Merger dated as of December 11 2015 as amended on March 31 2017 TDCC and Historical DuPont each merged with subsidiaries of DowDuPont and as a result TDCC and Historical DuPont became subsidiaries of DowDuPont (the ldquoMergerrdquo) Subsequent to the Merger TDCC and Historical DuPont engaged in a series of internal reorganization and realignment steps to realign their businesses into three subgroups agriculture materials science and specialty products Dow Inc was formed as a wholly owned subsidiary of DowDuPont to serve as the holding company for the materials science business
Unaudited Pro Forma Financial InformationIn order to provide the most meaningful comparison of results of operations and results by segment supplemental unaudited pro forma financial information has been included in the following financial schedules The unaudited pro forma financial information is based on the consolidated financial statements of TDCC adjusted to give effect to the separation from DowDuPont as if it had been consummated on January 1 2017 For the twelve months ended December 31 2019 and 2018 pro forma adjustments have been made for (1) the margin impact of various manufacturing supply and service related agreements entered into with DuPont and Corteva in connection with the separation which provide for different pricing than the historical intercompany and intracompany pricing practices of TDCC and Historical DuPont and (2) the elimination of the impact of events directly attributable to the Merger internal reorganization and business realignment separation distribution and other related transactions (eg one-time transaction costs)
The unaudited pro forma financial information has been presented for informational purposes only and is not necessarily indicative of what Dows results of operations actually would have been had the separation from DowDuPont been completed as of January 1 2017 nor is it indicative of the future operating results of Dow The unaudited pro forma information does not reflect restructuring or integration activities or other costs following the separation from DowDuPont that may be incurred to achieve cost or growth synergies of Dow For further information on the unaudited pro forma financial information please refer to the Companys Current Report on Form 8-K dated June 3 2019
General CommentsUnless otherwise specified all financial measures in this presentation where applicable exclude significant items
GENERAL COMMENTS
30
SAFE HARBORCautionary Statement about Forward-Looking Statements
This presentation contains ldquoforward-looking statementsrdquo within the meaning of the federal securities laws including Section 27A of the Securities Act of 1933 as amended and Section 21E of the Securities Exchange Act of 1934 as amended Such statements often address expected future business and financial performance financial condition and other matters and often contain words or phrases such as ldquoanticipaterdquo ldquobelieverdquo ldquoestimaterdquo ldquoexpectrdquo ldquointendrdquo ldquomayrdquo ldquoopportunityrdquo ldquooutlookrdquo ldquoplanrdquo ldquoprojectrdquo ldquoseekrdquo ldquoshouldrdquo ldquostrategyrdquo ldquotargetrdquo ldquowillrdquo ldquowill berdquo ldquowill continuerdquo ldquowill likely resultrdquo ldquowouldrdquo and similar expressions and variations or negatives of these words or phrases
Forward-looking statements are based on current assumptions and expectations of future events that are subject to risks uncertainties and other factors that are beyond Dowrsquos control which may cause actual results to differ materially from those projected anticipated or implied in the forward-looking statements and speak only as of the date the statements were made These factors include but are not limited to sales of Dowrsquos products Dowrsquos expenses future revenues and profitability the continuing global and regional economic impacts of the coronavirus disease 2019 (ldquoCOVID-19rdquo) pandemic and other public health-related risks and events on Dowrsquos business capital requirements and need for and availability of financing size of the markets for Dowrsquos products and services and ability to compete in such markets failure to develop and market new products and optimally manage product life cycles the rate and degree of market acceptance of Dowrsquos products significant litigation and environmental matters and related contingencies and unexpected expenses the success of competing technologies that are or may become available the ability to protect Dowrsquos intellectual property in the United States and abroad developments related to contemplated restructuring activities and proposed divestitures or acquisitions such as workforce reduction manufacturing facility andor asset closure and related exit and disposal activities and the benefits and costs associated with each of the foregoing fluctuations in energy and raw material prices management of process safety and product stewardship changes in relationships with Dowrsquos significant customers and suppliers changes in consumer preferences and demand changes in laws and regulations political conditions or industry development global economic and capital markets conditions such as inflation market uncertainty interest and currency exchange rates and equity and commodity prices business or supply disruptions security threats such as acts of sabotage terrorism or war weather events and natural disasters and disruptions in Dowrsquos information technology networks and systems
Risks related to Dowrsquos separation from DowDuPont Inc include but are not limited to (i) Dowrsquos inability to achieve some or all of the benefits that it expects to receive from the separation from DowDuPont Inc (ii) certain tax risks associated with the separation (iii) the failure of Dowrsquos pro forma financial information to be a reliable indicator of Dowrsquos future results (iv) non-compete restrictions under the separation agreement (v) receipt of less favorable terms in the commercial agreements Dow entered into with DuPont and Corteva Inc (ldquoCortevardquo) including restrictions under intellectual property cross-license agreements than Dow would have received from an unaffiliated third party and (vi) Dowrsquos obligation to indemnify DuPont andor Corteva for certain liabilities
Where in any forward-looking statement an expectation or belief as to future results or events is expressed such expectation or belief is based on the current plans and expectations of management and expressed in good faith and believed to have a reasonable basis but there can be no assurance that the expectation or belief will result or be achieved or accomplished A detailed discussion of principal risks and uncertainties which may cause actual results and events to differ materially from such forward-looking statements is included in the section titled ldquoRisk Factorsrdquo contained in the Companyrsquos Annual Report on Form 10-K for the year ended December 31 2020 These are not the only risks and uncertainties that Dow faces There may be other risks and uncertainties that Dow is unable to identify at this time or that Dow does not currently expect to have a material impact on its business If any of those risks or uncertainties develops into an actual event it could have a material adverse effect on Dowrsquos business Dow assumes no obligation to update or revise publicly any forward-looking statements whether because of new information future events or otherwise except as required by securities and other applicable laws
31
Non-GAAP Financial MeasuresThis presentation includes information that does not conform to US GAAP and are considered non-GAAP measures Management uses these measures internally for planning forecasting and evaluating the performance of the Companys segments including allocating resources Dows management believes that these non-GAAP measures best reflect the ongoing performance of the Company during the periods presented and provide more relevant and meaningful information to investors as they provide insight with respect to ongoing operating results of the Company and a more useful comparison of year-over-year results These non-GAAP measures supplement the Companys US GAAP disclosures and should not be viewed as alternatives to US GAAP measures of performance Furthermore such non-GAAP measures may not be consistent with similar measures provided or used by other companies Dow does not provide forward-looking US GAAP financial measures or a reconciliation of forward-looking non-GAAP financial measures to the most comparable US GAAP financial measures on a forward-looking basis because the Company is unable to predict with reasonable certainty the ultimate outcome of pending litigation unusual gains and losses foreign currency exchange gains or losses and potential future asset impairments as well as discrete taxable events without unreasonable effort These items are uncertain depend on various factors and could have a material impact on US GAAP results for the guidance period
TrademarksThe Dow Diamond logo and all products unless otherwise noted denoted with trade or reg are trademarks service marks or registered trademarks of The Dow Chemical Company or its respective subsidiaries or affiliates Solely for convenience the trademarks service marks and trade names referred to in this communication may appear without the trade or reg symbols but such references are not intended to indicate in any way that we will not assert to the fullest extent under applicable law our rights or the right of the applicable licensor to these trademarks service marks and trade names This presentation may also contain trademarks service marks and trade names of certain third parties which are the property of their respective owners Our use or display of third partiesrsquo trademarks service marks trade names or products in this communication is not intended to and should not be read to imply a relationship with or endorsement or sponsorship of us
DefinitionsOperating EBIT is defined as earnings (ie ldquoIncome (loss) from continuing operations before taxesrdquo) before interest excluding the impact of significant itemsOperating EBITDA is defined as earnings (ie ldquoIncome (loss) from continuing operations before taxesrdquo) before interest depreciation and amortization excluding the impact of significant itemsOperating EBIT Margin is defined as Operating EBIT divided by net salesAdjusted Operating EBIT is defined as Operating EBIT less equity earningsAdjusted Operating EBIT Margin is defined as Operating EBIT less equity earnings divided by net salesAdjusted Operating EBITDA is defined as Operating EBITDA less equity earningsAdjusted Operating EBITDA Margin is defined as Adjusted Operating EBITDA divided by net sales excluding certain transactions with nonconsolidated affiliates Operating earnings per share is defined as Earnings (loss) per common share from continuing operations - dilutedldquo excluding the after-tax impact of significant items Operational Tax Rate is defined as the effective tax rate (ie GAAP ldquoProvision for income taxesrdquo divided by ldquoIncome (loss) from continuing operations before income taxesrdquo) excluding the impact of significant itemsFree cash flow (FCF) is defined as ldquoCash provided by (used for) operating activities - continuing operationsrdquo less capital expenditures Under this definition free cash flow represents the cash generated by the Company from operations after investing in its asset base Free cash flow combined with cash balances and other sources of liquidity represent the cash available to fund obligations and provide returns to shareholders Free cash flow is an integral financial measure used in the Companys financial planning processFree Cash Flow Yield is defined as Free cash flow divided by market capitalizationShareholder Remuneration is defined as Dividends paid to stockholders plus Purchases of treasury stockShareholder Yield is defined as Shareholder Remuneration divided by market capitalizationCash Flow Conversion is defined as ldquoCash provided by (used for) operating activities ndash continuing operationsrdquo divided by Operating EBITDA or Pro Forma Operating EBITDA Management believes cash flow conversion is an important financial metric as it helps the Company determine how efficiently it is converting its earnings to cash flowFree cash conversion is defined as Adjusted Operating EBITDA less capital expenditures divided by Adjusted Operating EBITDANet Debt is defined as ldquoNotes payablerdquo plus ldquoLong-term debt due within one yearrdquo plus ldquoLong-term debtrdquo less ldquoCash and cash equivalentsrdquo and ldquoMarketable securitiesrdquoKuwait Joint Ventures (JVs) refers to EQUATE Petrochemical Company KSCC The Kuwait Olefins Company KSCC and The Kuwait Styrene Company KSCCThai Joint Ventures (JVs) refers to Map Ta Phut Olefins Company Limited and The SCG-Dow Group (Siam Polyethylene Company Limited Siam Polystyrene Company Limited Siam Styrene Monomer Co Ltd Siam Synthetic Latex Company Limited)
1 Free cash flow is defined as Cash provided by (used for) operating activities - continuing operations less capital expenditures Under this definition free cash flow represents the cash generated by the Company from operations after investing in its asset base Free cash flow combined with cash balances and other sources of liquidity represent the cash available to fund obligations and provide returns to shareholders Free cash flow is an integral financial measure used in the Companys financial planning process
Net Sales by Segment
Three Months EndedDec 31 2020
Three Months Ended
In millions (Unaudited)
March 31 2021
March 31 2020
Packaging amp Specialty Plastics
$ 5126
$ 6082
$ 4609
Industrial Intermediates amp Infrastructure
3501
3607
3045
Performance Materials amp Coatings
2029
2123
2065
Corporate
50
70
51
Total
$ 10706
$ 11882
9770
Operating EBIT by Segment
Three Months EndedDec 31 2020
Three Months Ended
In millions (Unaudited)
March 31 2021
March 31 2020
Packaging amp Specialty Plastics
$ 780
$ 1228
$ 580
Industrial Intermediates amp Infrastructure
296
326
175
Performance Materials amp Coatings
50
62
162
Corporate
(72)
(62)
(74)
Total
$ 1054
$ 1554
843
Equity in Earnings (Losses) of Nonconsolidated Affiliates by Segment
Three Months EndedDec 31 2020
Three Months Ended
In millions (Unaudited)
March 31 2021
March 31 2020
Packaging amp Specialty Plastics
$ 77
$ 106
$ 5
Industrial Intermediates amp Infrastructure
36
115
(76)
Performance Materials amp Coatings
2
2
1
Corporate
(9)
1
(19)
Total
$ 106
$ 224
(89)
Adjusted Operating EBIT by Segment
Three Months EndedDec 31 2020
Three Months Ended
In millions (Unaudited)
March 31 2021
March 31 2020
Packaging amp Specialty Plastics
$ 703
$ 1122
$ 575
Industrial Intermediates amp Infrastructure
260
211
251
Performance Materials amp Coatings
48
60
161
Corporate
(63)
(63)
(55)
Total
$ 948
$ 1330
932
Operating Margin by Segment
Three Months EndedDec 31 2020
Three Months Ended
In millions (Unaudited)
March 31 2021
March 31 2020
Packaging amp Specialty Plastics
152
202
126
Industrial Intermediates amp Infrastructure
85
90
57
Performance Materials amp Coatings
25
29
78
Total
98
131
86
Adjusted Operating EBIT Margin by Segment
Three Months EndedDec 31 2020
Three Months Ended
In millions (Unaudited)
March 31 2021
March 31 2020
Packaging amp Specialty Plastics
137
184
125
Industrial Intermediates amp Infrastructure
74
58
82
Performance Materials amp Coatings
24
28
78
Total
89
112
95
Reconciliation of Income (loss) from continuing operations net of tax to Operating EBIT and Operating EBITDA
Three Months Ended
Nine Months Ended
March 31 2020
June 30 2020
September 30 2020
December 31 2020
March 31 2021
September 30 2020
September 30 2019
In millions (Unaudited)
As Reported
Pro Forma
Income (loss) from continuing operations net of tax
$ 258
$ (217)
$ (1)
$ 1254
$ 1006
$ 1006
$ 258
+ Provision for income taxes on continuing operations
138
34
43
562
317
317
138
Income (loss) from continuing operations before income taxes
$ 396
$ (183)
$ 42
$ 1816
$ 1323
$ 1323
$ 396
- Interest income
15
6
6
11
8
8
15
+ Interest expense and amortization of debt discount
1 Operating EBIT is defined as earnings (ie Income (loss) from continuing operations before income taxes) before interest excluding the impact of significant items
2 Operating EBITDA is defined as earnings (ie Income (loss) from continuing operations before income taxes) before interest depreciation and amortization excluding the impact of significant items
Significant Items Impacting Results for the Three Months Ended Mar 31 2021
In millions except per share amounts (Unaudited)
Pretax 1
Net Income 2
EPS 3
Reported results
$ 1323
$ 991
$ 132
Less Significant items
Restructuring implementation costs
(10)
(8)
(001)
Digitalization program costs
(33)
(25)
(003)
Total significant items
$ (43)
$ (33)
$ (004)
Operating results (non-GAAP)
$ 1366
$ 1024
$ 136
Significant Items Impacting Results for the Three Months Ended Mar 31 2020
In millions except per share amounts (Unaudited)
Pretax 1
Net Income 2
EPS 3
Reported results
$ 396
$ 239
$ 032
Less Significant items
Integration and separation costs
(65)
(51)
(007)
Restructuring and asset related charges - net
(96)
(79)
(011)
Loss on early extinguishment of debt
(86)
(70)
(009)
Total significant items
$ (247)
$ (200)
$ (027)
Operating results (non-GAAP)
$ 643
$ 439
$ 059
1 Income before income taxes
2 Net income (loss) available for Dow Inc common stockholders The income tax effect on significant items was calculated based upon the enacted tax laws and statutory income tax rates applicable in the tax jurisdiction(s) of the underlying non-GAAP adjustment
1 Free cash flow is defined as Cash provided by (used for) operating activities - continuing operations less capital expenditures Under this definition free cash flow represents the cash generated by the Company from operations after investing in its asset base Free cash flow combined with cash balances and other sources of liquidity represent the cash available to fund obligations and provide returns to shareholders Free cash flow is an integral financial measure used in the Companys financial planning process
2 Free cash flow in the first quarter of 2021 reflects a $1 billion elective pension contribution
Net Sales by Segment
Three Months EndedDec 31 2020
Three Months Ended
In millions (Unaudited)
March 31 2021
March 31 2020
Packaging amp Specialty Plastics
$ 5126
$ 6082
$ 4609
Industrial Intermediates amp Infrastructure
3501
3607
3045
Performance Materials amp Coatings
2029
2123
2065
Corporate
50
70
51
Total
$ 10706
$ 11882
9770
Operating EBIT by Segment
Three Months EndedDec 31 2020
Three Months Ended
In millions (Unaudited)
March 31 2021
March 31 2020
Packaging amp Specialty Plastics
$ 780
$ 1228
$ 580
Industrial Intermediates amp Infrastructure
296
326
175
Performance Materials amp Coatings
50
62
162
Corporate
(72)
(62)
(74)
Total
$ 1054
$ 1554
843
Equity in Earnings (Losses) of Nonconsolidated Affiliates by Segment
Three Months EndedDec 31 2020
Three Months Ended
In millions (Unaudited)
March 31 2021
March 31 2020
Packaging amp Specialty Plastics
$ 77
$ 106
$ 5
Industrial Intermediates amp Infrastructure
36
115
(76)
Performance Materials amp Coatings
2
2
1
Corporate
(9)
1
(19)
Total
$ 106
$ 224
(89)
Adjusted Operating EBIT by Segment
Three Months EndedDec 31 2020
Three Months Ended
In millions (Unaudited)
March 31 2021
March 31 2020
Packaging amp Specialty Plastics
$ 703
$ 1122
$ 575
Industrial Intermediates amp Infrastructure
260
211
251
Performance Materials amp Coatings
48
60
161
Corporate
(63)
(63)
(55)
Total
$ 948
$ 1330
932
Operating Margin by Segment
Three Months EndedDec 31 2020
Three Months Ended
In millions (Unaudited)
March 31 2021
March 31 2020
Packaging amp Specialty Plastics
152
202
126
Industrial Intermediates amp Infrastructure
85
90
57
Performance Materials amp Coatings
25
29
78
Total
98
131
86
Adjusted Operating EBIT Margin by Segment
Three Months EndedDec 31 2020
Three Months Ended
In millions (Unaudited)
March 31 2021
March 31 2020
Packaging amp Specialty Plastics
137
184
125
Industrial Intermediates amp Infrastructure
74
58
82
Performance Materials amp Coatings
24
28
78
Total
89
112
95
Reconciliation of Income (loss) from continuing operations net of tax to Operating EBIT and Operating EBITDA
Three Months Ended
Nine Months Ended
March 31 2020
June 30 2020
September 30 2020
December 31 2020
March 31 2021
September 30 2020
September 30 2019
In millions (Unaudited)
As Reported
Pro Forma
Income (loss) from continuing operations net of tax
$ 258
$ (217)
$ (1)
$ 1254
$ 1006
$ 1006
$ 258
+ Provision for income taxes on continuing operations
138
34
43
562
317
317
138
Income (loss) from continuing operations before income taxes
$ 396
$ (183)
$ 42
$ 1816
$ 1323
$ 1323
$ 396
- Interest income
15
6
6
11
8
8
15
+ Interest expense and amortization of debt discount
1 Operating EBIT is defined as earnings (ie Income (loss) from continuing operations before income taxes) before interest excluding the impact of significant items
2 Operating EBITDA is defined as earnings (ie Income (loss) from continuing operations before income taxes) before interest depreciation and amortization excluding the impact of significant items
Significant Items Impacting Results for the Three Months Ended Mar 31 2021
In millions except per share amounts (Unaudited)
Pretax 1
Net Income 2
EPS 3
Reported results
$ 1323
$ 991
$ 132
Less Significant items
Restructuring implementation costs
(10)
(8)
(001)
Digitalization program costs
(33)
(25)
(003)
Total significant items
$ (43)
$ (33)
$ (004)
Operating results (non-GAAP)
$ 1366
$ 1024
$ 136
Significant Items Impacting Results for the Three Months Ended Mar 31 2020
In millions except per share amounts (Unaudited)
Pretax 1
Net Income 2
EPS 3
Reported results
$ 396
$ 239
$ 032
Less Significant items
Integration and separation costs
(65)
(51)
(007)
Restructuring and asset related charges - net
(96)
(79)
(011)
Loss on early extinguishment of debt
(86)
(70)
(009)
Total significant items
$ (247)
$ (200)
$ (027)
Operating results (non-GAAP)
$ 643
$ 439
$ 059
1 Income before income taxes
2 Net income available for Dow Inc common stockholders The income tax effect on significant items was calculated based upon the enacted tax laws and statutory income tax rates applicable in the tax jurisdiction(s) of the underlying non-GAAP adjustment
1 Free cash flow is defined as Cash provided by (used for) operating activities - continuing operations less capital expenditures Under this definition free cash flow represents the cash generated by the Company from operations after investing in its asset base Free cash flow combined with cash balances and other sources of liquidity represent the cash available to fund obligations and provide returns to shareholders Free cash flow is an integral financial measure used in the Companys financial planning process
Net Sales by Segment
Three Months EndedDec 31 2020
Three Months Ended
In millions (Unaudited)
March 31 2021
March 31 2020
Packaging amp Specialty Plastics
$ 5126
$ 6082
$ 4609
Industrial Intermediates amp Infrastructure
3501
3607
3045
Performance Materials amp Coatings
2029
2123
2065
Corporate
50
70
51
Total
$ 10706
$ 11882
9770
Operating EBIT by Segment
Three Months EndedDec 31 2020
Three Months Ended
In millions (Unaudited)
March 31 2021
March 31 2020
Packaging amp Specialty Plastics
$ 780
$ 1228
$ 580
Industrial Intermediates amp Infrastructure
296
326
175
Performance Materials amp Coatings
50
62
162
Corporate
(72)
(62)
(74)
Total
$ 1054
$ 1554
843
Equity in Earnings (Losses) of Nonconsolidated Affiliates by Segment
Three Months EndedDec 31 2020
Three Months Ended
In millions (Unaudited)
March 31 2021
March 31 2020
Packaging amp Specialty Plastics
$ 77
$ 106
$ 5
Industrial Intermediates amp Infrastructure
36
115
(76)
Performance Materials amp Coatings
2
2
1
Corporate
(9)
1
(19)
Total
$ 106
$ 224
(89)
Adjusted Operating EBIT by Segment
Three Months EndedDec 31 2020
Three Months Ended
In millions (Unaudited)
March 31 2021
March 31 2020
Packaging amp Specialty Plastics
$ 703
$ 1122
$ 575
Industrial Intermediates amp Infrastructure
260
211
251
Performance Materials amp Coatings
48
60
161
Corporate
(63)
(63)
(55)
Total
$ 948
$ 1330
932
Operating Margin by Segment
Three Months EndedDec 31 2020
Three Months Ended
In millions (Unaudited)
March 31 2021
March 31 2020
Packaging amp Specialty Plastics
152
202
126
Industrial Intermediates amp Infrastructure
85
90
57
Performance Materials amp Coatings
25
29
78
Total
98
131
86
Adjusted Operating EBIT Margin by Segment
Three Months EndedDec 31 2020
Three Months Ended
In millions (Unaudited)
March 31 2021
March 31 2020
Packaging amp Specialty Plastics
137
184
125
Industrial Intermediates amp Infrastructure
74
58
82
Performance Materials amp Coatings
24
28
78
Total
89
112
95
Reconciliation of Income (loss) from continuing operations net of tax to Operating EBIT and Operating EBITDA
Three Months Ended
Nine Months Ended
March 31 2020
June 30 2020
September 30 2020
December 31 2020
March 31 2021
September 30 2020
September 30 2019
In millions (Unaudited)
As Reported
Pro Forma
Income (loss) from continuing operations net of tax
$ 258
$ (217)
$ (1)
$ 1254
$ 1006
$ 1006
$ 258
+ Provision for income taxes on continuing operations
138
34
43
562
317
317
138
Income (loss) from continuing operations before income taxes
$ 396
$ (183)
$ 42
$ 1816
$ 1323
$ 1323
$ 396
- Interest income
15
6
6
11
8
8
15
+ Interest expense and amortization of debt discount
1 Operating EBIT is defined as earnings (ie Income (loss) from continuing operations before income taxes) before interest excluding the impact of significant items
2 Operating EBITDA is defined as earnings (ie Income (loss) from continuing operations before income taxes) before interest depreciation and amortization excluding the impact of significant items
Significant Items Impacting Results for the Three Months Ended Mar 31 2021
In millions except per share amounts (Unaudited)
Pretax 1
Net Income 2
EPS 3
Reported results
$ 1323
$ 991
$ 132
Less Significant items
Restructuring implementation costs
(10)
(8)
(001)
Digitalization program costs
(33)
(25)
(003)
Total significant items
$ (43)
$ (33)
$ (004)
Operating results (non-GAAP)
$ 1366
$ 1024
$ 136
Significant Items Impacting Results for the Three Months Ended Mar 31 2020
In millions except per share amounts (Unaudited)
Pretax 1
Net Income 2
EPS 3
Reported results
$ 396
$ 239
$ 032
Less Significant items
Integration and separation costs
(65)
(51)
(007)
Restructuring and asset related charges - net
(96)
(79)
(011)
Loss on early extinguishment of debt
(86)
(70)
(009)
Total significant items
$ (247)
$ (200)
$ (027)
Operating results (non-GAAP)
$ 643
$ 439
$ 059
1 Income before income taxes
2 Net income (loss) available for Dow Inc common stockholders The income tax effect on significant items was calculated based upon the enacted tax laws and statutory income tax rates applicable in the tax jurisdiction(s) of the underlying non-GAAP adjustment
1 Free cash flow is defined as Cash provided by (used for) operating activities - continuing operations less capital expenditures Under this definition free cash flow represents the cash generated by the Company from operations after investing in its asset base Free cash flow combined with cash balances and other sources of liquidity represent the cash available to fund obligations and provide returns to shareholders Free cash flow is an integral financial measure used in the Companys financial planning process
Net Sales by Segment
Three Months EndedDec 31 2020
Three Months Ended
In millions (Unaudited)
March 31 2021
March 31 2020
Packaging amp Specialty Plastics
$ 5126
$ 6082
$ 4609
Industrial Intermediates amp Infrastructure
3501
3607
3045
Performance Materials amp Coatings
2029
2123
2065
Corporate
50
70
51
Total
$ 10706
$ 11882
9770
Operating EBIT by Segment
Three Months EndedDec 31 2020
Three Months Ended
In millions (Unaudited)
March 31 2021
March 31 2020
Packaging amp Specialty Plastics
$ 780
$ 1228
$ 580
Industrial Intermediates amp Infrastructure
296
326
175
Performance Materials amp Coatings
50
62
162
Corporate
(72)
(62)
(74)
Total
$ 1054
$ 1554
843
Equity in Earnings (Losses) of Nonconsolidated Affiliates by Segment
Three Months EndedDec 31 2020
Three Months Ended
In millions (Unaudited)
March 31 2021
March 31 2020
Packaging amp Specialty Plastics
$ 77
$ 106
$ 5
Industrial Intermediates amp Infrastructure
36
115
(76)
Performance Materials amp Coatings
2
2
1
Corporate
(9)
1
(19)
Total
$ 106
$ 224
(89)
Adjusted Operating EBIT by Segment
Three Months EndedDec 31 2020
Three Months Ended
In millions (Unaudited)
March 31 2021
March 31 2020
Packaging amp Specialty Plastics
$ 703
$ 1122
$ 575
Industrial Intermediates amp Infrastructure
260
211
251
Performance Materials amp Coatings
48
60
161
Corporate
(63)
(63)
(55)
Total
$ 948
$ 1330
932
Operating Margin by Segment
Three Months EndedDec 31 2020
Three Months Ended
In millions (Unaudited)
March 31 2021
March 31 2020
Packaging amp Specialty Plastics
152
202
126
Industrial Intermediates amp Infrastructure
85
90
57
Performance Materials amp Coatings
25
29
78
Total
98
131
86
Adjusted Operating EBIT Margin by Segment
Three Months EndedDec 31 2020
Three Months Ended
In millions (Unaudited)
March 31 2021
March 31 2020
Packaging amp Specialty Plastics
137
184
125
Industrial Intermediates amp Infrastructure
74
58
82
Performance Materials amp Coatings
24
28
78
Total
89
112
95
Reconciliation of Income (loss) from continuing operations net of tax to Operating EBIT and Operating EBITDA
Three Months Ended
Nine Months Ended
March 31 2020
June 30 2020
September 30 2020
December 31 2020
March 31 2021
September 30 2020
September 30 2019
In millions (Unaudited)
As Reported
Pro Forma
Income (loss) from continuing operations net of tax
$ 258
$ (217)
$ (1)
$ 1254
$ 1006
$ 1006
$ 258
+ Provision for income taxes on continuing operations
138
34
43
562
317
317
138
Income (loss) from continuing operations before income taxes
$ 396
$ (183)
$ 42
$ 1816
$ 1323
$ 1323
$ 396
- Interest income
15
6
6
11
8
8
15
+ Interest expense and amortization of debt discount
1 Operating EBIT is defined as earnings (ie Income (loss) from continuing operations before income taxes) before interest excluding the impact of significant items
2 Operating EBITDA is defined as earnings (ie Income (loss) from continuing operations before income taxes) before interest depreciation and amortization excluding the impact of significant items
Significant Items Impacting Results for the Three Months Ended Mar 31 2021
In millions except per share amounts (Unaudited)
Pretax 1
Net Income 2
EPS 3
Reported results
$ 1323
$ 991
$ 132
Less Significant items
Restructuring implementation costs
(10)
(8)
(001)
Digitalization program costs
(33)
(25)
(003)
Total significant items
$ (43)
$ (33)
$ (004)
Operating results (non-GAAP)
$ 1366
$ 1024
$ 136
Significant Items Impacting Results for the Three Months Ended Mar 31 2020
In millions except per share amounts (Unaudited)
Pretax 1
Net Income 2
EPS 3
Reported results
$ 396
$ 239
$ 032
Less Significant items
Integration and separation costs
(65)
(51)
(007)
Restructuring and asset related charges - net
(96)
(79)
(011)
Loss on early extinguishment of debt
(86)
(70)
(009)
Total significant items
$ (247)
$ (200)
$ (027)
Operating results (non-GAAP)
$ 643
$ 439
$ 059
1 Income before income taxes
2 Net income (loss) available for Dow Inc common stockholders The income tax effect on significant items was calculated based upon the enacted tax laws and statutory income tax rates applicable in the tax jurisdiction(s) of the underlying non-GAAP adjustment
1 Free cash flow is defined as Cash provided by (used for) operating activities - continuing operations less capital expenditures Under this definition free cash flow represents the cash generated by the Company from operations after investing in its asset base Free cash flow combined with cash balances and other sources of liquidity represent the cash available to fund obligations and provide returns to shareholders Free cash flow is an integral financial measure used in the Companys financial planning process
2 Free cash flow in the first quarter of 2021 reflects a $1 billion elective pension contribution
Net Sales by Segment
Three Months EndedDec 31 2020
Three Months Ended
In millions (Unaudited)
March 31 2021
March 31 2020
Packaging amp Specialty Plastics
$ 5126
$ 6082
$ 4609
Industrial Intermediates amp Infrastructure
3501
3607
3045
Performance Materials amp Coatings
2029
2123
2065
Corporate
50
70
51
Total
$ 10706
$ 11882
9770
Operating EBIT by Segment
Three Months EndedDec 31 2020
Three Months Ended
In millions (Unaudited)
March 31 2021
March 31 2020
Packaging amp Specialty Plastics
$ 780
$ 1228
$ 580
Industrial Intermediates amp Infrastructure
296
326
175
Performance Materials amp Coatings
50
62
162
Corporate
(72)
(62)
(74)
Total
$ 1054
$ 1554
843
Equity in Earnings (Losses) of Nonconsolidated Affiliates by Segment
Three Months EndedDec 31 2020
Three Months Ended
In millions (Unaudited)
March 31 2021
March 31 2020
Packaging amp Specialty Plastics
$ 77
$ 106
$ 5
Industrial Intermediates amp Infrastructure
36
115
(76)
Performance Materials amp Coatings
2
2
1
Corporate
(9)
1
(19)
Total
$ 106
$ 224
(89)
Adjusted Operating EBIT by Segment
Three Months EndedDec 31 2020
Three Months Ended
In millions (Unaudited)
March 31 2021
March 31 2020
Packaging amp Specialty Plastics
$ 703
$ 1122
$ 575
Industrial Intermediates amp Infrastructure
260
211
251
Performance Materials amp Coatings
48
60
161
Corporate
(63)
(63)
(55)
Total
$ 948
$ 1330
932
Operating Margin by Segment
Three Months EndedDec 31 2020
Three Months Ended
In millions (Unaudited)
March 31 2021
March 31 2020
Packaging amp Specialty Plastics
152
202
126
Industrial Intermediates amp Infrastructure
85
90
57
Performance Materials amp Coatings
25
29
78
Total
98
131
86
Adjusted Operating EBIT Margin by Segment
Three Months EndedDec 31 2020
Three Months Ended
In millions (Unaudited)
March 31 2021
March 31 2020
Packaging amp Specialty Plastics
137
184
125
Industrial Intermediates amp Infrastructure
74
58
82
Performance Materials amp Coatings
24
28
78
Total
89
112
95
Reconciliation of Net income (loss) to Operating EBIT and Operating EBITDA
Three Months Ended
Nine Months Ended
March 31 2020
June 30 2020
September 30 2020
December 31 2020
March 31 2021
September 30 2020
September 30 2019
In millions (Unaudited)
As Reported
Pro Forma
Net income (loss)
$ 258
$ (217)
$ (1)
$ 1254
$ 1006
$ 1006
$ 258
+ Provision for income taxes
138
34
43
562
317
317
138
Income (loss) before income taxes
$ 396
$ (183)
$ 42
$ 1816
$ 1323
$ 1323
$ 396
- Interest income
15
6
6
11
8
8
15
+ Interest expense and amortization of debt discount
1 Operating EBIT is defined as earnings (ie Income (loss) before income taxes) before interest excluding the impact of significant items
2 Operating EBITDA is defined as earnings (ie Income (loss) before income taxes) before interest depreciation and amortization excluding the impact of significant items
Significant Items Impacting Results for the Three Months Ended Mar 31 2021
In millions except per share amounts (Unaudited)
Pretax 1
Net Income 2
EPS 3
Reported results
$ 1323
$ 991
$ 132
Less Significant items
Restructuring implementation costs
(10)
(8)
(001)
Digitalization program costs
(33)
(25)
(003)
Total significant items
$ (43)
$ (33)
$ (004)
Operating results (non-GAAP)
$ 1366
$ 1024
$ 136
Significant Items Impacting Results for the Three Months Ended Mar 31 2020
In millions except per share amounts (Unaudited)
Pretax 1
Net Income 2
EPS 3
Reported results
$ 396
$ 239
$ 032
Less Significant items
Integration and separation costs
(65)
(51)
(007)
Restructuring and asset related charges - net
(96)
(79)
(011)
Loss on early extinguishment of debt
(86)
(70)
(009)
Total significant items
$ (247)
$ (200)
$ (027)
Operating results (non-GAAP)
$ 643
$ 439
$ 059
1 Income before income taxes
2 Net income available for Dow Inc common stockholders The income tax effect on significant items was calculated based upon the enacted tax laws and statutory income tax rates applicable in the tax jurisdiction(s) of the underlying non-GAAP adjustment
1 Free cash flow is defined as Cash provided by (used for) operating activities - continuing operations less capital expenditures Under this definition free cash flow represents the cash generated by the Company from operations after investing in its asset base Free cash flow combined with cash balances and other sources of liquidity represent the cash available to fund obligations and provide returns to shareholders Free cash flow is an integral financial measure used in the Companys financial planning process
Net Sales by Segment
Three Months EndedDec 31 2020
Three Months Ended
In millions (Unaudited)
March 31 2021
March 31 2020
Packaging amp Specialty Plastics
$ 5126
$ 6082
$ 4609
Industrial Intermediates amp Infrastructure
3501
3607
3045
Performance Materials amp Coatings
2029
2123
2065
Corporate
50
70
51
Total
$ 10706
$ 11882
9770
Operating EBIT by Segment
Three Months EndedDec 31 2020
Three Months Ended
In millions (Unaudited)
March 31 2021
March 31 2020
Packaging amp Specialty Plastics
$ 780
$ 1228
$ 580
Industrial Intermediates amp Infrastructure
296
326
175
Performance Materials amp Coatings
50
62
162
Corporate
(72)
(62)
(74)
Total
$ 1054
$ 1554
843
Equity in Earnings (Losses) of Nonconsolidated Affiliates by Segment
Three Months EndedDec 31 2020
Three Months Ended
In millions (Unaudited)
March 31 2021
March 31 2020
Packaging amp Specialty Plastics
$ 77
$ 106
$ 5
Industrial Intermediates amp Infrastructure
36
115
(76)
Performance Materials amp Coatings
2
2
1
Corporate
(9)
1
(19)
Total
$ 106
$ 224
(89)
Adjusted Operating EBIT by Segment
Three Months EndedDec 31 2020
Three Months Ended
In millions (Unaudited)
March 31 2021
March 31 2020
Packaging amp Specialty Plastics
$ 703
$ 1122
$ 575
Industrial Intermediates amp Infrastructure
260
211
251
Performance Materials amp Coatings
48
60
161
Corporate
(63)
(63)
(55)
Total
$ 948
$ 1330
932
Operating Margin by Segment
Three Months EndedDec 31 2020
Three Months Ended
In millions (Unaudited)
March 31 2021
March 31 2020
Packaging amp Specialty Plastics
152
202
126
Industrial Intermediates amp Infrastructure
85
90
57
Performance Materials amp Coatings
25
29
78
Total
98
131
86
Adjusted Operating EBIT Margin by Segment
Three Months EndedDec 31 2020
Three Months Ended
In millions (Unaudited)
March 31 2021
March 31 2020
Packaging amp Specialty Plastics
137
184
125
Industrial Intermediates amp Infrastructure
74
58
82
Performance Materials amp Coatings
24
28
78
Total
89
112
95
Reconciliation of Income (loss) from continuing operations net of tax to Operating EBIT and Operating EBITDA
Three Months Ended
Nine Months Ended
March 31 2020
June 30 2020
September 30 2020
December 31 2020
March 31 2021
September 30 2020
September 30 2019
In millions (Unaudited)
As Reported
Pro Forma
Income (loss) from continuing operations net of tax
$ 258
$ (217)
$ (1)
$ 1254
$ 1006
$ 1006
$ 258
+ Provision for income taxes on continuing operations
138
34
43
562
317
317
138
Income (loss) from continuing operations before income taxes
$ 396
$ (183)
$ 42
$ 1816
$ 1323
$ 1323
$ 396
- Interest income
15
6
6
11
8
8
15
+ Interest expense and amortization of debt discount
1 Operating EBIT is defined as earnings (ie Income (loss) from continuing operations before income taxes) before interest excluding the impact of significant items
2 Operating EBITDA is defined as earnings (ie Income (loss) from continuing operations before income taxes) before interest depreciation and amortization excluding the impact of significant items
Significant Items Impacting Results for the Three Months Ended Mar 31 2021
In millions except per share amounts (Unaudited)
Pretax 1
Net Income 2
EPS 3
Reported results
$ 1323
$ 991
$ 132
Less Significant items
Restructuring implementation costs
(10)
(8)
(001)
Digitalization program costs
(33)
(25)
(003)
Total significant items
$ (43)
$ (33)
$ (004)
Operating results (non-GAAP)
$ 1366
$ 1024
$ 136
Significant Items Impacting Results for the Three Months Ended Mar 31 2020
In millions except per share amounts (Unaudited)
Pretax 1
Net Income 2
EPS 3
Reported results
$ 396
$ 239
$ 032
Less Significant items
Integration and separation costs
(65)
(51)
(007)
Restructuring and asset related charges - net
(96)
(79)
(011)
Loss on early extinguishment of debt
(86)
(70)
(009)
Total significant items
$ (247)
$ (200)
$ (027)
Operating results (non-GAAP)
$ 643
$ 439
$ 059
1 Income before income taxes
2 Net income available for Dow Inc common stockholders The income tax effect on significant items was calculated based upon the enacted tax laws and statutory income tax rates applicable in the tax jurisdiction(s) of the underlying non-GAAP adjustment
3 Earnings per common share - diluted
Y-o-
Y
Op EBIT uarr 112 Margin uarr 760bps
Driven by margin improvement and increased equity earnings
Q-o
-Q
Op EBIT uarr 57 Margins uarr 500bps
Local price gains in industrial and consumer packaging and flexible food and beverage
packaging margin uplift in HampE
1Q21 OPERATING SEGMENT PERFORMANCE
4609 5126 6082
30 00
35 00
40 00
45 00
50 00
55 00
60 00
65 00
1Q20 4Q20 1Q21
126152
202580
780
1228
0
200 00
400 00
600 00
800 00
100 000
120 000
140 000
1Q20 4Q20 1Q21
REVENUE ($MM) Op EBIT ($MM) amp Op EBIT Margin
Y-o-
Y
Sales uarr 32 Volume uarr 5 Price uarr 24
Strong supplydemand fundamentals local price gains in all regions volume growth in
both businesses and most regions
Q-o
-Q
Sales uarr 19 Volume darr 1 Price uarr 19
Continued pricing momentum across all regions and most applications particularly in
consumer packaging
Y-o-
Y
Op EBIT uarr 86 Margin uarr 330bps
Led by improved equity earnings and local price gains in both businesses
Q-o
-Q
Op EBIT uarr 10 Margins uarr 50bps
Driven by higher equity earnings including continued improvement at Sadara
3045 3501 3607
22 00
24 00
26 00
28 00
30 00
32 00
34 00
36 00
38 00
40 00
1Q20 4Q20 1Q21
175
296 326
57
85 90
60
110
160
210
260
310
360
0
1
2
3
4
5
6
7
8
9
10
1Q20 4Q20 1Q21
REVENUE ($MM)
Y-o-
Y
Sales uarr 18 Volume darr 6 Price uarr 21Local price gains in all regions increased consumer durable goods and appliances
demand partly offset by impacts from Winter Storm Uri
Q-o
-QSales uarr 3 Volume darr 10 Price uarr 12
Local price gains more than offset volume declines due to Winter Storm Uri impacts
Y-o-
Y
Op EBIT darr 62 Margin darr 490bps
Price gains and strong demand in coatings and silicones more than offset by the impact of the winter storm and planned maintenance
Q-o
-Q
Op EBIT uarr 24 Margins uarr 40bpsMargin expansion in performance silicones and coatings applications partially offset by
planned maintenance and winter storm impacts
2065 2029 2123
10 00
12 00
14 00
16 00
18 00
20 00
22 00
24 00
26 00
28 00
30 00
1Q20 4Q20 1Q21
78
25 29
162
50 62
0
500 0
100 00
150 00
200 00
250 00
300 00
350 00
400 00
450 00
500 00
1Q20 4Q20 1Q21
REVENUE ($MM)
Y-o-
Y
Sales uarr 3 Volume darr 4 Price uarr 4Price gains in all regions positive impacts from currency strong demand for silicone applications and DIY coatings more than
offset by supply constraints
Q-o
-Q
Sales uarr 5 Volume darr 1 Price uarr 5
Strong local price gains for acrylic monomers and siloxanes more than offset supply
constraints
Pack
agin
g amp
Spec
ialty
Pla
stic
sIn
d In
term
edia
tes
amp In
fras
truc
ture
Perf
Mat
eria
ls
amp C
oatin
gs
Op EBIT ($MM) amp Op EBIT Margin
Op EBIT ($MM) amp Op EBIT Margin
4
Winter Storm Uri amp Planned
Maintenance Impact
2Q21 MODELING GUIDANCE
5
Net Sales ~$124 ndash $129B Depreciation amp Amortization ~$715MM
Quarterly Operational Tax Rate ~21 ndash 25 Net Interest Expense (Net of Int Income) ~$185MM
Net Income Attrib to Non-Controlling Int ~$20MM Share Count ~750MM
Top-Line Ranges (2Q21 vs 1Q21)
Base Case Op EBIT Drivers(2Q21 vs 1Q21)
Sales ∆ QoQ
Low High
Packaging amp Specialty Plastics +3 +7
Add-Back 1Q21 Winter Storm Uri Impact (~$200MM tailwind) Continued strong demand for packaging applications globally further supported by seasonal increases Low inventory levels tight supply from industry outages Increased spend entering turnaround season USGC cracker planned maintenance activity (~$175MM headwind)
IndustrialIntermediates amp Infrastructure
+5 +10
Add-Back 1Q21 Winter Storm Uri Impact (~$150MM tailwind) Durable goods demand remains robust with industrial construction auto and oil amp gas end-markets continuing to improve Impact from third-party outages (~$100MM headwind) Increased turnaround spending at USGC sites primarily in polyurethanes (~$50MM headwind)
Performance Materials amp Coatings +5 +10
Add-Back 1Q21 Winter Storm Uri Impact (~$50MM tailwind) Demand strength for electronics mobility and home care applications in silicones Continued sequential demand improvement for architectural coatings Add-Back Turnarounds completed in Deer Park and Zhangjiagang (~$100MM tailwind)
Corporate Sales of $50MM Op EBIT of $(75)MM and Op EBITDA of $(65)MM
Recovery from Winter Storm Uri and continuation of robust demand leading to favorable market fundamentals
Corporate Op EBIT of ~$(275)MM and Op EBITDA of ~$(250)MM
Turnaround Costs Up ~$500MM YoY incl JVs incremental $100MM increase due to Winter Storm Uri impacts
Restructuring ~$300MM expected to be substantially complete by YE21 ~50 by mid-2021
Cash Flow Considerations in 2021
Dividends from Equity Companies ~$200MM (down ~$200MM YoY)
Sadara No cash outflow (~$350MM tailwind YoY)
DWDP Integration Separation and Synergy Costs
No cash outflow ($350MM tailwind YoY)
Pension Contributions
~$12B total cash outflow ($10B elective contribution completed in 1Q21)
Liability Management
~$10B elective contribution to pension reduces rating agency adjusted leverage
CapEx ~$16B (~350MM higher YoY)
2020 Restructuring Program ~$350MM cash outflow
Digital Initiative ~$150MM cash outflow
Other Income Statement Considerations
Net Interest Expense ~$775MM
DampA ~$29B
Net Income Attribto Non-Controlling Int ~$75MM (reduction to reported Net Income)
Share Count ~750MM
Op Tax Rate 21-25
POINTS OF DISTINCTION ENABLE CONTINUED OUTPERFORMANCE
7
End-market recovery benefits Dowrsquos consumer-led portfolio further enhancing performance and shareholder returns
Leading Cash Flow and Shareholder Remuneration Yield Attractive End Market Growth
Dow Continues to be a Compelling Investment Opportunity
bull ~$9B in Free Cash Flow1 generated
bull Disciplined focus drove 93 op cash flow conversion17
bull Free cash flow yield27 of ~11 best-in-class and well ahead of peers sector and overall market average
bull Best-in-class shareholder yield vs peers3
bull Top quartile cost management amp margin performance
1
Packaging ~15x GDP
Addressable Market$650B
Infrastructure ~13x GDP
Consumer ~15x GDP
Mobility ~15x GDP
Dow Peer Range4 SampP 500 Chemicals SampP 500
EVEBITDA NTM56 79x 50x ndash 99x 133x 146x
Free Cash Flow Yield27 106 22 - 79 36 46
Dividend Yield6 45 23 - 48 19 15
Net Debt Change8 darr ~$5B darr ~$3B to uarr ~$5B - -
Differentiated Portfolio with Leading Positions
1 Siloxanes
1 Acrylic Binders
1 Propylene Oxide
1 Propylene Glycol
1 Polyols
1 Purified Ethylene Oxide
1 Amines
1 Solvents
1 Ethylene
2 Polyethylene
1 Ethylene Copolymers
1 Polyethylene Licensing
1 Polyolefins Elastomers
1 Polyolefins Plastomers
(1) 2019 and 2020 total(2) 2019-2020 average(3) 2020
(4) Benchmarking peer set includes Arkema BASF Covestro Eastman Huntsman Lyondell Wacker
(5) NTM is defined as Next Twelve Months
(6) As of 03312021 FactSet (7) 2019 Dow data is on a pro forma basis (8) YE2020 vs YE2018
0
300
600
900
1200
2020 2022 2024 2026 2028 2030
MM
Mill
ion
Tonn
es Mechanical Recycling OtherPartnershipsAdvanced Recycling
PLASTIC CIRCULARITY ROADMAP DRIVES NEAR- AND LONG-TERM GROWTH
Through innovation collaboration and partnerships Dow is leading the way for sustainability in plastics
By 2030 Dow will STOP THE WASTE by enabling 1 million metric tons of plastic to be collected reused or recycled through its direct actions and partnerships
By 2035 Dow will CLOSE THE LOOP by enabling 100 of Dow products sold into packaging applications to be reusable or recyclable
1MM mta Target Plastic collected reused recycled
80
90
100
2020 2025 2030 2035
P
rodu
cts S
old Advanced Recycling
Application Development
100 Target Packaging products reusable or recyclable
Collaborating to drive innovation
and action
Integrating recycled and bio-based
feedstocks
Demonstrating innovative applications
for recycled plastics
Helping customers design for
recyclability
Innovating new products with post-consumer material
Dow is uniquely advantaged by a broad and differentiated portfolio to capture favorable industry supply-demand dynamics
Consumer spending drives ~1-15x GDP demand growth for Industrial Solutions and Polyurethanes
Renewables amp energy efficiency are key growth drivers
Incremental investments in US Gulf Coast Europe and China expect ~$200MMyear EBITDA run-rate
Broad participation in industrial and infrastructure end markets support long-term growth
High value end markets growing ~15-2x GDP upstream capacity availability enables high-value derivative growth
Rapid adoption of EV 5G Cloud Computing drives demand for innovation products
Lower-cost higher-return expansions expected to enable downstream growth of gt$350MMyear EBITDA run-rate
Infrastructure plan COVID-19 recovery expansion benefits
Incremental investments keep pace with ~13-15x GDP demand growth
Continue product mix upgrade to higher return end markets and applications
Canada cracker expansion and debottlenecking PE capacity expect ~$400MMyear EBITDA run-rate
Functional Polymers for infrastructure automotive and photovoltaics delivers outperformance vs peers
0
10
20
30
40
50
60
70
80
90
100
2022E 2023E 2024E 2025E 2026E0
4000
8000
12000
16000
0
10
20
30
40
50
60
70
80
90
100
2022E 2023E 2024E 2025E 2026E0
1000
2000
3000
4000
5000
6000
lsquo000 MTs lsquo000 MTs lsquo000 MTs
Polyethylene MDI Siloxane
30
40
50
60
70
80
90
100
2022E 2023E 2024E 2025E 2026E0
50000
100000
150000
200000
250000
Constructive near-term supply-demand balances Further tightening with expected capacity delays cancellations and typical outages
Adjusted Operating Rate s include typical industry planned outages and delayedcancelled new capacity additions based on historical averages
IHS SAGSI and other company annual reports and disclosuresIndustry consultant views use industry nameplate capacity and include all announced capacity additionsNote Industry operating rate estimates are based on views as of April 2021 and subject to change
1Q 2021 FINANCIAL HIGHLIGHTS
YoY Operating EPS Reconciliation Key Drivers in the Quarter YoYbull Pricing momentum across all segments and
regions led by polyethylene and polyurethane applications
bull Resilient demand in packaging and demand growth in construction mobility electronics and consumer durables end markets
bull Improved equity earnings led by Sadara and the Kuwait joint ventures
bull Lower tax rate on earnings recovery and geographic mix
bull Lower DampA and interest expense offset share count increase
bull Increased turnaround spending on delays from 2020 due to impacts of the pandemic
bull Impact of supply constraints and repair expenses related to Winter Storm Uri on the US Gulf Coast
Financial Summary($ millions unless otherwise noted)
Operating EBITDA $2271 $1567 $704 $1780 $491Earnings per share ndash GAAP $132 $032 $100 $165 $(033)Operating earnings per share $136 $059 $077 $081 $055Cash Provided by (Used for) Op Activities ndashCont Ops1
Op EBITDA to CFFO (Cash Flow Conversion1 )
$(228)(10)
$123679
$(1464) $165693
$(1884)
$059
$136
1Q20 MarginExpansion
Winter Storm Uri Turnarounds Tax Rate Equity Earnings 1Q21
111 Cash Provided by (Used for) Operating Activities ndash Continuing Operations and Cash Flow Conversion include a $1 billion elective pension contribution in the first quarter of 2021
PRINCIPAL JOINT VENTURE DETAIL
1Q 2021 1Q 2020 4Q 2020
$ millions (unaudited)Sadara
KuwaitJVs
ThaiJVs Sadara
KuwaitJVs
ThaiJVs Sadara
KuwaitJVs
ThaiJVs
EBITDA $163 $183 $52 $9 $110 $4 $137 $152 $28
EBIT $106 $144 $44 $(78) $65 $(6) $34 $104 $19
Net IncomeEquity Earnings (Losses) to Dow $55 $119 $34 $(116) $40 $(9) $3 $86 $15
EBITDA in Excess of Eq Earnings $108 $64 $18 $125 $70 $13 $134 $66 $13
Dowrsquos Proportional Share of Principal JV Financial Results
Kuwait JVs Margin expansion from price increases in MEG
Thai JVs Polyethylene margin expansion
Sadara Margin expansion in polyurethane and polyethylene applications
Drivers of YoY and PQ Changes
12Note 4Q2020 values were revised to reflect audited JV financial statements for Sadara
Dow FY20 Benchmarking Update
14
BENCHMARKING PEERS
Benchmarking conducted against segment level peers if sufficient information disclosed otherwise corporate level
15
TOTAL DOW BENCHMARKING SUMMARY OF OBSERVATIONS
Benchmarking Strengths amp Gaps
TotalDow
FY20 YoY Adj Op EBITDA growth trailed the peer median as resilient demand for packaging applications and recovery in durable good end markets was more than offset by upstream pricing pressures in siloxanes and acrylic monomers along with lower relative participation for polyurethanes in Asia which experienced a shorter COVID-19 downturn
In-Flight Actions Implement faster payback higher ROIC expansions reduce merchant positions of intermediatesbull Expansion of FS-1 cracker is underway (+65KTA) that will feed downstream derivative PE demandbull South China Specialties Hub (~250KTA) specialty PU and alkoxylates to participate in Asia growth bull Downstream silicones expansions (~15 projects in 2021) to reduce merchant siloxane intermediates exposure
FY20 Adj Op EBITDA margin remained resilient and among the best in the peer group through the economic downturn and recovery from COVID-19
Cash Flow Conversion among highest in the peer group from a disciplined focus on cash generation and structural working capital efficiency gains
SGampA + RampD as of sales remained among best in peer group from continued cost discipline
Best-in-class Free Cash Flow yield above sector and market averages
Net debt reduced more than peers on strong cash generation and focused capital allocation priorities
Source Dow data CapitalIQ Company ReleasesUnless otherwise noted all 2018 and 2019 financial information for Dow is on a pro forma basisAdjusted Operating EBITDA is defined as Operating EBITDA excluding equity earnings
Adj Op EBITDA Margin excludes transactions with certain nonconsolidated affiliates Cash Flow Conversion is defined as Cash from Continuing Operations divided by Operating EBITDAFree Cash Flow is defined as Cash from Continuing Operations less Capital Expenditures
16
TOTAL DOW
(1) Adjusted Operating EBITDA is defined as Operating EBITDA excluding equity earnings Adj Op EBITDA Margin excludes transactions with certain nonconsolidated affiliates
(2) Benchmarking peer set range includes Arkema BASF Covestro Eastman Huntsman Lyondell Wacker(3) Cash Flow Conversion is defined as Cash From Continuing Operations divided by Operating EBITDA(4) Median excludes Dow
Adj Op EBITDA Growth
Adj Op EBITDA Margin Cash Flow Conversion SGampA + RampD
(as a of Sales)FY20 vs FY19
FY20
Median Excl Dow
Median Excl Dow
BENCHMARKING SNAPSHOT (1234)
FY20 UPDATE amp FY19
FY19
-60
-50
-40
-30
-20
-10
0
10
FY19 vs FY18
FY20 FY19 FY20 FY19
Median Excl Dow
Median Excl Dow
5
10
15
20
25
Median Excl Dow
Median Excl Dow
30
50
70
90
110
130
150
Median Excl Dow Median
Excl Dow
0
5
10
15
20
25
Median Excl Dow
Median Excl Dow
Source Dow data CapitalIQ Company disclosures
Unless otherwise noted all 2018 and 2019 financial information for Dow is on a pro forma basisFor further unaudited pro forma financial information refer to the Companyrsquos Current Report on Form 8-K dated June 3 2019 and 4Q20 Earnings materials included in the Current Report on Form 8-K dated January 28 2021
bull Hallmark safety performance and operational excellence
bull Focused portfolio with market leading positions in key value chains
bull Consumer tilted portfolio in growing end-market verticals
bull Global footprint with integrated value chains that provide differentiated product offerings
CORE STRENGTHSbull Maintain focus on cash
generation and low-cost curve position
bull Continued disciplined capital allocation
bull Use innovation pipeline to collaborate with customers and capture growth trends
bull Invest in incremental higher return faster payback growth opportunities
bull Deliver sustainable future through Industry leading ESG position
Average Annual Free Cash Flow (2019-2020)as of 2020 Market Cap
17
TOP-QUARTILE CASH REMUNERATION YIELD AND DEBT REDUCTION
Median Excl Dow
~84
Median Excl Dow
+02B
Median Excl Dow
~6
Median Excl Dow
~3
(1) Benchmarking peer set range includes Arkema BASF Covestro Eastman Huntsman Lyondell Wacker(2) Source Dow data FactSet and Company Releases for Peers(3) Dow Market Capitalization as of YE2020 was ~$412B
Unless otherwise noted all 2018 and 2019 financial information for Dow is on a pro forma basisFor further unaudited pro forma financial information refer to the Companyrsquos Current Report on Form 8-K dated June 3 2019 and 4Q20 Earnings materials included in the Current Report on Form 8-K dated January 28 2021
18
CULTURE OF BENCHMARKING SUMMARY OF OBSERVATIONS
Segment FY20 Benchmarking Strengths amp Gaps
PampSP
FY20 YoY Adj Op EBITDA growth tracked the peer median as peers with more exposure to naphtha rebounded from a lower 2019 performance from cost pressures
FY20 Adj Op EBITDA margin more resilient than most peers Op EBITDA per pound polyolefin capacity ahead of peers advantage continues to widen Free Cash Conversion continued to improve and is best-in-class among the peer set SGampA + RampD as of sales remained among lowest in the peer group
IIampI
FY20 YoY Adj Op EBITDA growth and Adj Op EBITDA margin trailed the peer median as strengthening durable good end-markets in 2H20 were offset by decisive actions taken earlier in 1H20 to match production to demand as well as lower relative participation in Asia which experienced a shorter COVID-19 demand downturn
Free Cash Conversion is best-in-class among the peer set SGampA + RampD as of sales remained among lowest in the peer group
PMampC
FY20 YoY Adj Op EBITDA growth trailed the peer median due to greater exposure to siloxanes and acrylic monomers that were more heavily impacted by demand downturn and competitive pricing actions
FY20 Adj Op EBITDA margin trailed the peer median as strong demand for home care and DIY coatings was more than offset by personal care and automotive applications that lagged broader recovery
Free Cash Conversion among highest in the peer group SGampA + RampD as of sales best-in-class expanded advantage vs next closest peer
Source Dow data CapitalIQ Company ReleasesAdjusted Operating EBITDA is defined as Operating EBITDA excluding equity earnings Adj Op EBITDA Margin excludes transactions with certain nonconsolidated affiliatesFree Cash Conversion for Dow is defined as Adj Op EBITDA less Capex divided by Adj Op EBITDA
Unless otherwise noted all 2018 and 2019 financial information for Dow is on a pro forma basisFor further unaudited pro forma financial information refer to the Companyrsquos Current Report on Form 8-K dated June 3 2019 and 4Q20 Earnings materials included in the Current Report on Form 8-K dated January 28 2021
19
PACKAGING amp SPECIALTY PLASTICS
Adj Op EBITDA Growth(7)
Adj Op EBITDA Margin Free Cash Conversion SGampA + RampD
(as a of Sales)bull World-class packaging
franchise
bull Most flexible feedstock capability in the industry
bull Flexible polyolefins assets
bull Proprietary catalyst and process technology
bull Differentiated co-monomer capability
bull Global low-cost footprint
bull Maintain focus on cash conversion and cost discipline
bull Leverage differentiated product offerings and innovation pipeline to meet growing demand
bull Accelerate sell-up opportunities of higher margin product mix
bull Incremental quick payback investments and capacity expansions
bull Plastics circularity energy intensity CO2 footprint
CORE STRENGTHS FOCUS AREASFY20 vs FY19
FY20
Median Excl Dow
Median Excl Dow
FY19
-80
-60
-40
-20
0
20
40
FY19 vs FY18
FY20 FY19 FY20 FY19
Median Excl Dow
Median Excl Dow
5
10
15
20
25
Median Excl Dow
Median Excl Dow
0
20
40
60
80
Median Excl Dow
Median Excl Dow
0
5
10
15
Median Excl Dow
Median Excl Dow
Source Dow data CapitalIQ Company disclosures
(1) Adjusted Operating EBITDA is defined as Operating EBITDA excluding equity earningsAdj Op EBITDA Margin excludes transactions with certain nonconsolidated affiliates
(2) Benchmarking peer set range includes LyondellBasell Olefins amp Polyolefins Chevron Phillip Chemical Borealis Polyolefins ExxonMobil Chemicals (entire segment)
(3) Free Cash Conversion for Dow is defined as Adj Op EBITDA less Capex divided by Adj Op EBITDA(4) Median excludes Dow(5) SGampA + RampD reflects corporate level for peers where segment level data is unavailable
BENCHMARKING SNAPSHOT (123456)
FY20 UPDATE amp FY19
(6) CPChem results are as of 3Q20 TTM(7) Adj Op EBITDA Growth chart capped for visual purposes top peer was ~90
Unless otherwise noted all 2018 and 2019 financial information for Dow is on a pro forma basisFor further unaudited pro forma financial information refer to the Companyrsquos Current Report on Form 8-K dated June 3 2019 and 4Q20 Earnings materials included in the Current Report on Form 8-K dated January 28 2021
bull Full feedstock-to-polymer integration continues to deliver enhanced value
(1) Segment Op EBITDA based on FY20 reported figures including equity income from affiliatesJVs Capacity based on latest company reported nameplate for PE and PP (2019 for Dow 2020 10-K for Lyondell) including share of JVs or ICIS reported capacity for 2019 including share of JVs if not available (Borealis)
(2) Borealis Polyolefins EBITDA adjusted for equity earnings from JVsUnless otherwise noted all 2018 and 2019 financial information for Dow is on a pro forma basisFor further unaudited pro forma financial information refer to the Companyrsquos Current Report on Form 8-K dated June 3 2019 and 4Q20 Earnings materials included in the Current Report on Form 8-K dated January 28 2021
21
INDUSTRIAL INTERMEDIATES amp INFRASTRUCTURE
bull Top global producer of key raw materials (EO PO)
bull Flexible manufacturing model through integration
bull Top 3 PU Systems House business
bull Industrial Solutions contains products with some of the highest returns to ethylene
bull Maintain focus on cash conversion and cost discipline
bull Drive PU mix towards higher margin Perf Polyols amp Systems
bull Implement faster payback higher ROIC expansions (China Specialties hub differentiated PU applications and DIS alkoxylates)
FOCUS AREASAdj Op EBITDA Growth
Adj Op EBITDA Margin Free Cash Conversion SGampA + RampD
(as a of Sales)
Median Excl Dow
Median Excl Dow Median
Excl Dow
Median Excl Dow
CORE STRENGTHS
Source Dow data CapitalIQ Company disclosures
FY20 vs FY19 FY20 FY19
FY19 vs FY18 FY20 FY19 FY20 FY19
-60
-40
-20
0
20
Median Excl Dow
Median Excl Dow
0
5
10
15
20
25
Median Excl Dow
Median Excl Dow
-10
10
30
50
70
90
Median Excl Dow Median
Excl Dow
0
5
10
15
20
Median Excl Dow Median
Excl Dow
(1) Adjusted Operating EBITDA is defined as Operating EBITDA excluding equity earnings Adj Op EBITDA Margin excludes transactions with certain nonconsolidated affiliates
(2) Benchmarking peer set range includes Eastman Huntsman Covestro LyondellBasell Intermediates amp Derivatives segment(3) Free Cash Conversion for Dow is defined as Adj Op EBITDA less Capex divided by Adj Op EBITDA(4) Median excludes Dow(5) SGampA + RampD reflects corporate level for peers where segment level data is unavailable
BENCHMARKING SNAPSHOT (12345)
FY20 UPDATE amp FY19
Unless otherwise noted all 2018 and 2019 financial information for Dow is on a pro forma basisFor further unaudited pro forma financial information refer to the Companyrsquos Current Report on Form 8-K dated June 3 2019 and 4Q20 Earnings materials included in the Current Report on Form 8-K dated January 28 2021
22
PERFORMANCE MATERIALS amp COATINGS
Adj Op EBITDA Growth
Adj Op EBITDA Margin
SGampA + RampD (as a of Sales) FOCUS AREAS
bull Maintain focus on cash conversion and cost discipline
bull Accelerate organic growth and explore bolt-on inorganic growth
bull Innovate with customers on sustainable solutions
bull Improve acrylic monomer and siloxane margins drive more captive use
bull Grow industrial coatings in prioritized end markets
bull World-class silicones franchise
bull Lowest cost siloxanes producer
bull Leading coatings solutions provider
bull World-scale acrylic monomer assets
bull One of the largest B2B digital platforms
bull Unique hybrid chemistry opportunities
bull Leading SGampA and RampD efficiency
Free Cash Conversion
Median Excl Dow
Median Excl Dow
Median Excl Dow
CORE STRENGTHSFY20 vs FY19 FY20 FY19
FY19 vs FY18 FY20 FY19 FY20 FY19
-40
-30
-20
-10
0
10
Median Excl Dow
Median Excl Dow
5
10
15
20
25
30
35
Median Excl Dow Median
Excl Dow
40
50
60
70
80
Median Excl Dow
Median Excl Dow
5
10
15
20
Median Excl Dow
Median Excl Dow
Source Dow data CapitalIQ Company disclosures
(1) Adjusted Operating EBITDA is defined as Operating EBITDA excluding equity earnings Adj Op EBITDA Margin excludes transactions with certain nonconsolidated affiliates
(2) Benchmarking peer set range includes Celanese Acetyl Chain Wacker Silicones segment Shin-Etsu Silicones segment Arkema Covestro Coatings segment
(3) Free Cash Conversion for Dow is defined as Adj Op EBITDA less Capex divided by Adj Op EBITDA(4) Median excludes Dow(5) SGampA + RampD reflects corporate level for peers where segment level data is unavailable
BENCHMARKING SNAPSHOT (1234)
FY20 UPDATE amp FY19
Unless otherwise noted all 2018 and 2019 financial information for Dow is on a pro forma basisFor further unaudited pro forma financial information refer to the Companyrsquos Current Report on Form 8-K dated June 3 2019 and 4Q20 Earnings materials included in the Current Report on Form 8-K dated January 28 2021
Appendix
OPERATING EARNINGS PER SHARE (EPS) RECONCILIATION
24
In millions except per share amounts (Unaudited) Pretax 1 Net Income 2 EPS 3
Significant Items Impacting Results for the Three Months Ended Mar 31 2021
Significant Items Impacting Results for the Three Months Ended Mar 31 2020
2 Net income available for Dow Inc common stockholders The income tax effect on signif icant items w as calculated based upon the enacted tax law s and statutory income tax rates applicable in the tax jurisdiction(s) of the underlying non-GAAP adjustment
1 Income before income taxes
3 Earnings per common share - diluted
Non-GAAP - Sig Items
DOW CONFIDENTIAL - Do not share without permission
Non-GAAP - EBITDA Recon
DOW CONFIDENTIAL - Do not share without permission
Non-GAAP - Segment Info
DOW CONFIDENTIAL - Do not share without permission
Non-GAAP - Cash Flow Measures
DOW CONFIDENTIAL - Do not share without permission
Non-GAAP - Net Debt
DOW CONFIDENTIAL - Do not share without permission
RECONCILIATION OF NET INCOME (LOSS) TO OPERATING EBIT amp OPERATING EBITDA
25
In millions (Unaudited)
Net income (loss) $ 258 $ (217) $ (1) $ 1254 $ 1006 + Provision for income taxes 138 34 43 562 317Income (loss) before income taxes $ 396 $ (183) $ 42 $ 1816 $ 1323 - Interest income 15 6 6 11 8+ Interest expense and amortization of debt discount 215 200 202 210 196- Significant items (247) (46) (523) 961 (43)Operating EBIT 1 $ 843 $ 57 $ 761 $ 1054 $ 1554 + Depreciation and amortization 724 700 724 726 717Operating EBITDA 2 $ 1567 $ 757 $ 1485 $ 1780 $ 2271 Operating EBITDA - Trailing Twelve Months (TTM) basis $ 6971 $ 5926 $ 5555 $ 5589 $ 6293 1 Operating EBIT is defined as earnings (ie Income (loss) before income taxes) before interest excluding the impact of signif icant items2 Operating EBITDA is defined as earnings (ie Income (loss) before income taxes) before interest depreciation and amortization excluding the impact of signif icant items
Reconciliation of Net income (loss) to Operating EBIT and Operating EBITDA
March 31 2020
Three Months Ended
September 30 2020June 30 2020 March 31 2021December 31 2020
Non-GAAP - Sig Items
DOW CONFIDENTIAL - Do not share without permission
Non-GAAP - EBITDA Recon
DOW CONFIDENTIAL - Do not share without permission
Non-GAAP - Segment Info
DOW CONFIDENTIAL - Do not share without permission
Non-GAAP - Cash Flow Measures
DOW CONFIDENTIAL - Do not share without permission
Non-GAAP - Net Debt
DOW CONFIDENTIAL - Do not share without permission
SEGMENT INFORMATION
26
Net Sales by Segment
In millions (Unaudited) March 31 2021 March 31 2020
2 Free cash f low in the f irst quarter of 2021 reflects a $1 billion elective pension contribution
Three Months Ended
1 Cash f low conversion is defined as Cash provided by (used for) operating activities - continuing operations divided by Operating EBITDA
Three Months Ended
1 Free cash f low is defined as Cash provided by (used for) operating activities - continuing operations less capital expenditures Under this definition free cash f low represents the cash generated by the Company from operations after investing in its asset base Free cash f low combined w ith cash balances and other sources of liquidity represent the cash available to fund obligations and provide returns to shareholders Free cash f low is an integral f inancial measure used in the Companys f inancial planning process
2 Cash f low conversion in the f irst quarter of 2021 reflects a $1 billion elective pension contribution
Non-GAAP - Sig Items
DOW CONFIDENTIAL - Do not share without permission
Non-GAAP - EBITDA Recon
DOW CONFIDENTIAL - Do not share without permission
Non-GAAP - Segment Info
DOW CONFIDENTIAL - Do not share without permission
Non-GAAP - Cash Flow Measures
DOW CONFIDENTIAL - Do not share without permission
Non-GAAP - Net Debt
DOW CONFIDENTIAL - Do not share without permission
RECONCILIATION OF NET DEBT
29
Reconciliation of Net Debt
In millions (Unaudited)Notes payable $ 152 $ 156 Long-term debt due within one year 492 460Long-term debt 16200 16491
DOW CONFIDENTIAL - Do not share without permission
Non-GAAP - EBITDA Recon
DOW CONFIDENTIAL - Do not share without permission
Non-GAAP - Segment Info
DOW CONFIDENTIAL - Do not share without permission
Non-GAAP - Cash Flow Measures
DOW CONFIDENTIAL - Do not share without permission
Non-GAAP - Net Debt
DOW CONFIDENTIAL - Do not share without permission
Background On April 1 2019 DowDuPont completed the separation of its materials science business and Dow Inc became the direct parent company of TDCC owning all of the outstanding common shares of TDCC For filings related to the period commencing April 1 2019 and thereafter TDCC was deemed the predecessor to Dow Inc and the historical results of TDCC are deemed the historical results of Dow Inc for periods prior to and including March 31 2019
The separation was contemplated by the merger of equals transaction effective August 31 2017 under the Agreement and Plan of Merger dated as of December 11 2015 as amended on March 31 2017 TDCC and Historical DuPont each merged with subsidiaries of DowDuPont and as a result TDCC and Historical DuPont became subsidiaries of DowDuPont (the ldquoMergerrdquo) Subsequent to the Merger TDCC and Historical DuPont engaged in a series of internal reorganization and realignment steps to realign their businesses into three subgroups agriculture materials science and specialty products Dow Inc was formed as a wholly owned subsidiary of DowDuPont to serve as the holding company for the materials science business
Unaudited Pro Forma Financial InformationIn order to provide the most meaningful comparison of results of operations and results by segment supplemental unaudited pro forma financial information has been included in the following financial schedules The unaudited pro forma financial information is based on the consolidated financial statements of TDCC adjusted to give effect to the separation from DowDuPont as if it had been consummated on January 1 2017 For the twelve months ended December 31 2019 and 2018 pro forma adjustments have been made for (1) the margin impact of various manufacturing supply and service related agreements entered into with DuPont and Corteva in connection with the separation which provide for different pricing than the historical intercompany and intracompany pricing practices of TDCC and Historical DuPont and (2) the elimination of the impact of events directly attributable to the Merger internal reorganization and business realignment separation distribution and other related transactions (eg one-time transaction costs)
The unaudited pro forma financial information has been presented for informational purposes only and is not necessarily indicative of what Dows results of operations actually would have been had the separation from DowDuPont been completed as of January 1 2017 nor is it indicative of the future operating results of Dow The unaudited pro forma information does not reflect restructuring or integration activities or other costs following the separation from DowDuPont that may be incurred to achieve cost or growth synergies of Dow For further information on the unaudited pro forma financial information please refer to the Companys Current Report on Form 8-K dated June 3 2019
General CommentsUnless otherwise specified all financial measures in this presentation where applicable exclude significant items
GENERAL COMMENTS
30
SAFE HARBORCautionary Statement about Forward-Looking Statements
This presentation contains ldquoforward-looking statementsrdquo within the meaning of the federal securities laws including Section 27A of the Securities Act of 1933 as amended and Section 21E of the Securities Exchange Act of 1934 as amended Such statements often address expected future business and financial performance financial condition and other matters and often contain words or phrases such as ldquoanticipaterdquo ldquobelieverdquo ldquoestimaterdquo ldquoexpectrdquo ldquointendrdquo ldquomayrdquo ldquoopportunityrdquo ldquooutlookrdquo ldquoplanrdquo ldquoprojectrdquo ldquoseekrdquo ldquoshouldrdquo ldquostrategyrdquo ldquotargetrdquo ldquowillrdquo ldquowill berdquo ldquowill continuerdquo ldquowill likely resultrdquo ldquowouldrdquo and similar expressions and variations or negatives of these words or phrases
Forward-looking statements are based on current assumptions and expectations of future events that are subject to risks uncertainties and other factors that are beyond Dowrsquos control which may cause actual results to differ materially from those projected anticipated or implied in the forward-looking statements and speak only as of the date the statements were made These factors include but are not limited to sales of Dowrsquos products Dowrsquos expenses future revenues and profitability the continuing global and regional economic impacts of the coronavirus disease 2019 (ldquoCOVID-19rdquo) pandemic and other public health-related risks and events on Dowrsquos business capital requirements and need for and availability of financing size of the markets for Dowrsquos products and services and ability to compete in such markets failure to develop and market new products and optimally manage product life cycles the rate and degree of market acceptance of Dowrsquos products significant litigation and environmental matters and related contingencies and unexpected expenses the success of competing technologies that are or may become available the ability to protect Dowrsquos intellectual property in the United States and abroad developments related to contemplated restructuring activities and proposed divestitures or acquisitions such as workforce reduction manufacturing facility andor asset closure and related exit and disposal activities and the benefits and costs associated with each of the foregoing fluctuations in energy and raw material prices management of process safety and product stewardship changes in relationships with Dowrsquos significant customers and suppliers changes in consumer preferences and demand changes in laws and regulations political conditions or industry development global economic and capital markets conditions such as inflation market uncertainty interest and currency exchange rates and equity and commodity prices business or supply disruptions security threats such as acts of sabotage terrorism or war weather events and natural disasters and disruptions in Dowrsquos information technology networks and systems
Risks related to Dowrsquos separation from DowDuPont Inc include but are not limited to (i) Dowrsquos inability to achieve some or all of the benefits that it expects to receive from the separation from DowDuPont Inc (ii) certain tax risks associated with the separation (iii) the failure of Dowrsquos pro forma financial information to be a reliable indicator of Dowrsquos future results (iv) non-compete restrictions under the separation agreement (v) receipt of less favorable terms in the commercial agreements Dow entered into with DuPont and Corteva Inc (ldquoCortevardquo) including restrictions under intellectual property cross-license agreements than Dow would have received from an unaffiliated third party and (vi) Dowrsquos obligation to indemnify DuPont andor Corteva for certain liabilities
Where in any forward-looking statement an expectation or belief as to future results or events is expressed such expectation or belief is based on the current plans and expectations of management and expressed in good faith and believed to have a reasonable basis but there can be no assurance that the expectation or belief will result or be achieved or accomplished A detailed discussion of principal risks and uncertainties which may cause actual results and events to differ materially from such forward-looking statements is included in the section titled ldquoRisk Factorsrdquo contained in the Companyrsquos Annual Report on Form 10-K for the year ended December 31 2020 These are not the only risks and uncertainties that Dow faces There may be other risks and uncertainties that Dow is unable to identify at this time or that Dow does not currently expect to have a material impact on its business If any of those risks or uncertainties develops into an actual event it could have a material adverse effect on Dowrsquos business Dow assumes no obligation to update or revise publicly any forward-looking statements whether because of new information future events or otherwise except as required by securities and other applicable laws
31
Non-GAAP Financial MeasuresThis presentation includes information that does not conform to US GAAP and are considered non-GAAP measures Management uses these measures internally for planning forecasting and evaluating the performance of the Companys segments including allocating resources Dows management believes that these non-GAAP measures best reflect the ongoing performance of the Company during the periods presented and provide more relevant and meaningful information to investors as they provide insight with respect to ongoing operating results of the Company and a more useful comparison of year-over-year results These non-GAAP measures supplement the Companys US GAAP disclosures and should not be viewed as alternatives to US GAAP measures of performance Furthermore such non-GAAP measures may not be consistent with similar measures provided or used by other companies Dow does not provide forward-looking US GAAP financial measures or a reconciliation of forward-looking non-GAAP financial measures to the most comparable US GAAP financial measures on a forward-looking basis because the Company is unable to predict with reasonable certainty the ultimate outcome of pending litigation unusual gains and losses foreign currency exchange gains or losses and potential future asset impairments as well as discrete taxable events without unreasonable effort These items are uncertain depend on various factors and could have a material impact on US GAAP results for the guidance period
TrademarksThe Dow Diamond logo and all products unless otherwise noted denoted with trade or reg are trademarks service marks or registered trademarks of The Dow Chemical Company or its respective subsidiaries or affiliates Solely for convenience the trademarks service marks and trade names referred to in this communication may appear without the trade or reg symbols but such references are not intended to indicate in any way that we will not assert to the fullest extent under applicable law our rights or the right of the applicable licensor to these trademarks service marks and trade names This presentation may also contain trademarks service marks and trade names of certain third parties which are the property of their respective owners Our use or display of third partiesrsquo trademarks service marks trade names or products in this communication is not intended to and should not be read to imply a relationship with or endorsement or sponsorship of us
DefinitionsOperating EBIT is defined as earnings (ie ldquoIncome (loss) from continuing operations before taxesrdquo) before interest excluding the impact of significant itemsOperating EBITDA is defined as earnings (ie ldquoIncome (loss) from continuing operations before taxesrdquo) before interest depreciation and amortization excluding the impact of significant itemsOperating EBIT Margin is defined as Operating EBIT divided by net salesAdjusted Operating EBIT is defined as Operating EBIT less equity earningsAdjusted Operating EBIT Margin is defined as Operating EBIT less equity earnings divided by net salesAdjusted Operating EBITDA is defined as Operating EBITDA less equity earningsAdjusted Operating EBITDA Margin is defined as Adjusted Operating EBITDA divided by net sales excluding certain transactions with nonconsolidated affiliates Operating earnings per share is defined as Earnings (loss) per common share from continuing operations - dilutedldquo excluding the after-tax impact of significant items Operational Tax Rate is defined as the effective tax rate (ie GAAP ldquoProvision for income taxesrdquo divided by ldquoIncome (loss) from continuing operations before income taxesrdquo) excluding the impact of significant itemsFree cash flow (FCF) is defined as ldquoCash provided by (used for) operating activities - continuing operationsrdquo less capital expenditures Under this definition free cash flow represents the cash generated by the Company from operations after investing in its asset base Free cash flow combined with cash balances and other sources of liquidity represent the cash available to fund obligations and provide returns to shareholders Free cash flow is an integral financial measure used in the Companys financial planning processFree Cash Flow Yield is defined as Free cash flow divided by market capitalizationShareholder Remuneration is defined as Dividends paid to stockholders plus Purchases of treasury stockShareholder Yield is defined as Shareholder Remuneration divided by market capitalizationCash Flow Conversion is defined as ldquoCash provided by (used for) operating activities ndash continuing operationsrdquo divided by Operating EBITDA or Pro Forma Operating EBITDA Management believes cash flow conversion is an important financial metric as it helps the Company determine how efficiently it is converting its earnings to cash flowFree cash conversion is defined as Adjusted Operating EBITDA less capital expenditures divided by Adjusted Operating EBITDANet Debt is defined as ldquoNotes payablerdquo plus ldquoLong-term debt due within one yearrdquo plus ldquoLong-term debtrdquo less ldquoCash and cash equivalentsrdquo and ldquoMarketable securitiesrdquoKuwait Joint Ventures (JVs) refers to EQUATE Petrochemical Company KSCC The Kuwait Olefins Company KSCC and The Kuwait Styrene Company KSCCThai Joint Ventures (JVs) refers to Map Ta Phut Olefins Company Limited and The SCG-Dow Group (Siam Polyethylene Company Limited Siam Polystyrene Company Limited Siam Styrene Monomer Co Ltd Siam Synthetic Latex Company Limited)
1 Free cash flow is defined as Cash provided by (used for) operating activities - continuing operations less capital expenditures Under this definition free cash flow represents the cash generated by the Company from operations after investing in its asset base Free cash flow combined with cash balances and other sources of liquidity represent the cash available to fund obligations and provide returns to shareholders Free cash flow is an integral financial measure used in the Companys financial planning process
Net Sales by Segment
Three Months EndedDec 31 2020
Three Months Ended
In millions (Unaudited)
March 31 2021
March 31 2020
Packaging amp Specialty Plastics
$ 5126
$ 6082
$ 4609
Industrial Intermediates amp Infrastructure
3501
3607
3045
Performance Materials amp Coatings
2029
2123
2065
Corporate
50
70
51
Total
$ 10706
$ 11882
9770
Operating EBIT by Segment
Three Months EndedDec 31 2020
Three Months Ended
In millions (Unaudited)
March 31 2021
March 31 2020
Packaging amp Specialty Plastics
$ 780
$ 1228
$ 580
Industrial Intermediates amp Infrastructure
296
326
175
Performance Materials amp Coatings
50
62
162
Corporate
(72)
(62)
(74)
Total
$ 1054
$ 1554
843
Equity in Earnings (Losses) of Nonconsolidated Affiliates by Segment
Three Months EndedDec 31 2020
Three Months Ended
In millions (Unaudited)
March 31 2021
March 31 2020
Packaging amp Specialty Plastics
$ 77
$ 106
$ 5
Industrial Intermediates amp Infrastructure
36
115
(76)
Performance Materials amp Coatings
2
2
1
Corporate
(9)
1
(19)
Total
$ 106
$ 224
(89)
Adjusted Operating EBIT by Segment
Three Months EndedDec 31 2020
Three Months Ended
In millions (Unaudited)
March 31 2021
March 31 2020
Packaging amp Specialty Plastics
$ 703
$ 1122
$ 575
Industrial Intermediates amp Infrastructure
260
211
251
Performance Materials amp Coatings
48
60
161
Corporate
(63)
(63)
(55)
Total
$ 948
$ 1330
932
Operating Margin by Segment
Three Months EndedDec 31 2020
Three Months Ended
In millions (Unaudited)
March 31 2021
March 31 2020
Packaging amp Specialty Plastics
152
202
126
Industrial Intermediates amp Infrastructure
85
90
57
Performance Materials amp Coatings
25
29
78
Total
98
131
86
Adjusted Operating EBIT Margin by Segment
Three Months EndedDec 31 2020
Three Months Ended
In millions (Unaudited)
March 31 2021
March 31 2020
Packaging amp Specialty Plastics
137
184
125
Industrial Intermediates amp Infrastructure
74
58
82
Performance Materials amp Coatings
24
28
78
Total
89
112
95
Reconciliation of Income (loss) from continuing operations net of tax to Operating EBIT and Operating EBITDA
Three Months Ended
Nine Months Ended
March 31 2020
June 30 2020
September 30 2020
December 31 2020
March 31 2021
September 30 2020
September 30 2019
In millions (Unaudited)
As Reported
Pro Forma
Income (loss) from continuing operations net of tax
$ 258
$ (217)
$ (1)
$ 1254
$ 1006
$ 1006
$ 258
+ Provision for income taxes on continuing operations
138
34
43
562
317
317
138
Income (loss) from continuing operations before income taxes
$ 396
$ (183)
$ 42
$ 1816
$ 1323
$ 1323
$ 396
- Interest income
15
6
6
11
8
8
15
+ Interest expense and amortization of debt discount
1 Operating EBIT is defined as earnings (ie Income (loss) from continuing operations before income taxes) before interest excluding the impact of significant items
2 Operating EBITDA is defined as earnings (ie Income (loss) from continuing operations before income taxes) before interest depreciation and amortization excluding the impact of significant items
Significant Items Impacting Results for the Three Months Ended Mar 31 2021
In millions except per share amounts (Unaudited)
Pretax 1
Net Income 2
EPS 3
Reported results
$ 1323
$ 991
$ 132
Less Significant items
Restructuring implementation costs
(10)
(8)
(001)
Digitalization program costs
(33)
(25)
(003)
Total significant items
$ (43)
$ (33)
$ (004)
Operating results (non-GAAP)
$ 1366
$ 1024
$ 136
Significant Items Impacting Results for the Three Months Ended Mar 31 2020
In millions except per share amounts (Unaudited)
Pretax 1
Net Income 2
EPS 3
Reported results
$ 396
$ 239
$ 032
Less Significant items
Integration and separation costs
(65)
(51)
(007)
Restructuring and asset related charges - net
(96)
(79)
(011)
Loss on early extinguishment of debt
(86)
(70)
(009)
Total significant items
$ (247)
$ (200)
$ (027)
Operating results (non-GAAP)
$ 643
$ 439
$ 059
1 Income before income taxes
2 Net income (loss) available for Dow Inc common stockholders The income tax effect on significant items was calculated based upon the enacted tax laws and statutory income tax rates applicable in the tax jurisdiction(s) of the underlying non-GAAP adjustment
1 Free cash flow is defined as Cash provided by (used for) operating activities - continuing operations less capital expenditures Under this definition free cash flow represents the cash generated by the Company from operations after investing in its asset base Free cash flow combined with cash balances and other sources of liquidity represent the cash available to fund obligations and provide returns to shareholders Free cash flow is an integral financial measure used in the Companys financial planning process
2 Free cash flow in the first quarter of 2021 reflects a $1 billion elective pension contribution
Net Sales by Segment
Three Months EndedDec 31 2020
Three Months Ended
In millions (Unaudited)
March 31 2021
March 31 2020
Packaging amp Specialty Plastics
$ 5126
$ 6082
$ 4609
Industrial Intermediates amp Infrastructure
3501
3607
3045
Performance Materials amp Coatings
2029
2123
2065
Corporate
50
70
51
Total
$ 10706
$ 11882
9770
Operating EBIT by Segment
Three Months EndedDec 31 2020
Three Months Ended
In millions (Unaudited)
March 31 2021
March 31 2020
Packaging amp Specialty Plastics
$ 780
$ 1228
$ 580
Industrial Intermediates amp Infrastructure
296
326
175
Performance Materials amp Coatings
50
62
162
Corporate
(72)
(62)
(74)
Total
$ 1054
$ 1554
843
Equity in Earnings (Losses) of Nonconsolidated Affiliates by Segment
Three Months EndedDec 31 2020
Three Months Ended
In millions (Unaudited)
March 31 2021
March 31 2020
Packaging amp Specialty Plastics
$ 77
$ 106
$ 5
Industrial Intermediates amp Infrastructure
36
115
(76)
Performance Materials amp Coatings
2
2
1
Corporate
(9)
1
(19)
Total
$ 106
$ 224
(89)
Adjusted Operating EBIT by Segment
Three Months EndedDec 31 2020
Three Months Ended
In millions (Unaudited)
March 31 2021
March 31 2020
Packaging amp Specialty Plastics
$ 703
$ 1122
$ 575
Industrial Intermediates amp Infrastructure
260
211
251
Performance Materials amp Coatings
48
60
161
Corporate
(63)
(63)
(55)
Total
$ 948
$ 1330
932
Operating Margin by Segment
Three Months EndedDec 31 2020
Three Months Ended
In millions (Unaudited)
March 31 2021
March 31 2020
Packaging amp Specialty Plastics
152
202
126
Industrial Intermediates amp Infrastructure
85
90
57
Performance Materials amp Coatings
25
29
78
Total
98
131
86
Adjusted Operating EBIT Margin by Segment
Three Months EndedDec 31 2020
Three Months Ended
In millions (Unaudited)
March 31 2021
March 31 2020
Packaging amp Specialty Plastics
137
184
125
Industrial Intermediates amp Infrastructure
74
58
82
Performance Materials amp Coatings
24
28
78
Total
89
112
95
Reconciliation of Income (loss) from continuing operations net of tax to Operating EBIT and Operating EBITDA
Three Months Ended
Nine Months Ended
March 31 2020
June 30 2020
September 30 2020
December 31 2020
March 31 2021
September 30 2020
September 30 2019
In millions (Unaudited)
As Reported
Pro Forma
Income (loss) from continuing operations net of tax
$ 258
$ (217)
$ (1)
$ 1254
$ 1006
$ 1006
$ 258
+ Provision for income taxes on continuing operations
138
34
43
562
317
317
138
Income (loss) from continuing operations before income taxes
$ 396
$ (183)
$ 42
$ 1816
$ 1323
$ 1323
$ 396
- Interest income
15
6
6
11
8
8
15
+ Interest expense and amortization of debt discount
1 Operating EBIT is defined as earnings (ie Income (loss) from continuing operations before income taxes) before interest excluding the impact of significant items
2 Operating EBITDA is defined as earnings (ie Income (loss) from continuing operations before income taxes) before interest depreciation and amortization excluding the impact of significant items
Significant Items Impacting Results for the Three Months Ended Mar 31 2021
In millions except per share amounts (Unaudited)
Pretax 1
Net Income 2
EPS 3
Reported results
$ 1323
$ 991
$ 132
Less Significant items
Restructuring implementation costs
(10)
(8)
(001)
Digitalization program costs
(33)
(25)
(003)
Total significant items
$ (43)
$ (33)
$ (004)
Operating results (non-GAAP)
$ 1366
$ 1024
$ 136
Significant Items Impacting Results for the Three Months Ended Mar 31 2020
In millions except per share amounts (Unaudited)
Pretax 1
Net Income 2
EPS 3
Reported results
$ 396
$ 239
$ 032
Less Significant items
Integration and separation costs
(65)
(51)
(007)
Restructuring and asset related charges - net
(96)
(79)
(011)
Loss on early extinguishment of debt
(86)
(70)
(009)
Total significant items
$ (247)
$ (200)
$ (027)
Operating results (non-GAAP)
$ 643
$ 439
$ 059
1 Income before income taxes
2 Net income available for Dow Inc common stockholders The income tax effect on significant items was calculated based upon the enacted tax laws and statutory income tax rates applicable in the tax jurisdiction(s) of the underlying non-GAAP adjustment
1 Free cash flow is defined as Cash provided by (used for) operating activities - continuing operations less capital expenditures Under this definition free cash flow represents the cash generated by the Company from operations after investing in its asset base Free cash flow combined with cash balances and other sources of liquidity represent the cash available to fund obligations and provide returns to shareholders Free cash flow is an integral financial measure used in the Companys financial planning process
Net Sales by Segment
Three Months EndedDec 31 2020
Three Months Ended
In millions (Unaudited)
March 31 2021
March 31 2020
Packaging amp Specialty Plastics
$ 5126
$ 6082
$ 4609
Industrial Intermediates amp Infrastructure
3501
3607
3045
Performance Materials amp Coatings
2029
2123
2065
Corporate
50
70
51
Total
$ 10706
$ 11882
9770
Operating EBIT by Segment
Three Months EndedDec 31 2020
Three Months Ended
In millions (Unaudited)
March 31 2021
March 31 2020
Packaging amp Specialty Plastics
$ 780
$ 1228
$ 580
Industrial Intermediates amp Infrastructure
296
326
175
Performance Materials amp Coatings
50
62
162
Corporate
(72)
(62)
(74)
Total
$ 1054
$ 1554
843
Equity in Earnings (Losses) of Nonconsolidated Affiliates by Segment
Three Months EndedDec 31 2020
Three Months Ended
In millions (Unaudited)
March 31 2021
March 31 2020
Packaging amp Specialty Plastics
$ 77
$ 106
$ 5
Industrial Intermediates amp Infrastructure
36
115
(76)
Performance Materials amp Coatings
2
2
1
Corporate
(9)
1
(19)
Total
$ 106
$ 224
(89)
Adjusted Operating EBIT by Segment
Three Months EndedDec 31 2020
Three Months Ended
In millions (Unaudited)
March 31 2021
March 31 2020
Packaging amp Specialty Plastics
$ 703
$ 1122
$ 575
Industrial Intermediates amp Infrastructure
260
211
251
Performance Materials amp Coatings
48
60
161
Corporate
(63)
(63)
(55)
Total
$ 948
$ 1330
932
Operating Margin by Segment
Three Months EndedDec 31 2020
Three Months Ended
In millions (Unaudited)
March 31 2021
March 31 2020
Packaging amp Specialty Plastics
152
202
126
Industrial Intermediates amp Infrastructure
85
90
57
Performance Materials amp Coatings
25
29
78
Total
98
131
86
Adjusted Operating EBIT Margin by Segment
Three Months EndedDec 31 2020
Three Months Ended
In millions (Unaudited)
March 31 2021
March 31 2020
Packaging amp Specialty Plastics
137
184
125
Industrial Intermediates amp Infrastructure
74
58
82
Performance Materials amp Coatings
24
28
78
Total
89
112
95
Reconciliation of Income (loss) from continuing operations net of tax to Operating EBIT and Operating EBITDA
Three Months Ended
Nine Months Ended
March 31 2020
June 30 2020
September 30 2020
December 31 2020
March 31 2021
September 30 2020
September 30 2019
In millions (Unaudited)
As Reported
Pro Forma
Income (loss) from continuing operations net of tax
$ 258
$ (217)
$ (1)
$ 1254
$ 1006
$ 1006
$ 258
+ Provision for income taxes on continuing operations
138
34
43
562
317
317
138
Income (loss) from continuing operations before income taxes
$ 396
$ (183)
$ 42
$ 1816
$ 1323
$ 1323
$ 396
- Interest income
15
6
6
11
8
8
15
+ Interest expense and amortization of debt discount
1 Operating EBIT is defined as earnings (ie Income (loss) from continuing operations before income taxes) before interest excluding the impact of significant items
2 Operating EBITDA is defined as earnings (ie Income (loss) from continuing operations before income taxes) before interest depreciation and amortization excluding the impact of significant items
Significant Items Impacting Results for the Three Months Ended Mar 31 2021
In millions except per share amounts (Unaudited)
Pretax 1
Net Income 2
EPS 3
Reported results
$ 1323
$ 991
$ 132
Less Significant items
Restructuring implementation costs
(10)
(8)
(001)
Digitalization program costs
(33)
(25)
(003)
Total significant items
$ (43)
$ (33)
$ (004)
Operating results (non-GAAP)
$ 1366
$ 1024
$ 136
Significant Items Impacting Results for the Three Months Ended Mar 31 2020
In millions except per share amounts (Unaudited)
Pretax 1
Net Income 2
EPS 3
Reported results
$ 396
$ 239
$ 032
Less Significant items
Integration and separation costs
(65)
(51)
(007)
Restructuring and asset related charges - net
(96)
(79)
(011)
Loss on early extinguishment of debt
(86)
(70)
(009)
Total significant items
$ (247)
$ (200)
$ (027)
Operating results (non-GAAP)
$ 643
$ 439
$ 059
1 Income before income taxes
2 Net income (loss) available for Dow Inc common stockholders The income tax effect on significant items was calculated based upon the enacted tax laws and statutory income tax rates applicable in the tax jurisdiction(s) of the underlying non-GAAP adjustment
1 Free cash flow is defined as Cash provided by (used for) operating activities - continuing operations less capital expenditures Under this definition free cash flow represents the cash generated by the Company from operations after investing in its asset base Free cash flow combined with cash balances and other sources of liquidity represent the cash available to fund obligations and provide returns to shareholders Free cash flow is an integral financial measure used in the Companys financial planning process
Net Sales by Segment
Three Months EndedDec 31 2020
Three Months Ended
In millions (Unaudited)
March 31 2021
March 31 2020
Packaging amp Specialty Plastics
$ 5126
$ 6082
$ 4609
Industrial Intermediates amp Infrastructure
3501
3607
3045
Performance Materials amp Coatings
2029
2123
2065
Corporate
50
70
51
Total
$ 10706
$ 11882
9770
Operating EBIT by Segment
Three Months EndedDec 31 2020
Three Months Ended
In millions (Unaudited)
March 31 2021
March 31 2020
Packaging amp Specialty Plastics
$ 780
$ 1228
$ 580
Industrial Intermediates amp Infrastructure
296
326
175
Performance Materials amp Coatings
50
62
162
Corporate
(72)
(62)
(74)
Total
$ 1054
$ 1554
843
Equity in Earnings (Losses) of Nonconsolidated Affiliates by Segment
Three Months EndedDec 31 2020
Three Months Ended
In millions (Unaudited)
March 31 2021
March 31 2020
Packaging amp Specialty Plastics
$ 77
$ 106
$ 5
Industrial Intermediates amp Infrastructure
36
115
(76)
Performance Materials amp Coatings
2
2
1
Corporate
(9)
1
(19)
Total
$ 106
$ 224
(89)
Adjusted Operating EBIT by Segment
Three Months EndedDec 31 2020
Three Months Ended
In millions (Unaudited)
March 31 2021
March 31 2020
Packaging amp Specialty Plastics
$ 703
$ 1122
$ 575
Industrial Intermediates amp Infrastructure
260
211
251
Performance Materials amp Coatings
48
60
161
Corporate
(63)
(63)
(55)
Total
$ 948
$ 1330
932
Operating Margin by Segment
Three Months EndedDec 31 2020
Three Months Ended
In millions (Unaudited)
March 31 2021
March 31 2020
Packaging amp Specialty Plastics
152
202
126
Industrial Intermediates amp Infrastructure
85
90
57
Performance Materials amp Coatings
25
29
78
Total
98
131
86
Adjusted Operating EBIT Margin by Segment
Three Months EndedDec 31 2020
Three Months Ended
In millions (Unaudited)
March 31 2021
March 31 2020
Packaging amp Specialty Plastics
137
184
125
Industrial Intermediates amp Infrastructure
74
58
82
Performance Materials amp Coatings
24
28
78
Total
89
112
95
Reconciliation of Income (loss) from continuing operations net of tax to Operating EBIT and Operating EBITDA
Three Months Ended
Nine Months Ended
March 31 2020
June 30 2020
September 30 2020
December 31 2020
March 31 2021
September 30 2020
September 30 2019
In millions (Unaudited)
As Reported
Pro Forma
Income (loss) from continuing operations net of tax
$ 258
$ (217)
$ (1)
$ 1254
$ 1006
$ 1006
$ 258
+ Provision for income taxes on continuing operations
138
34
43
562
317
317
138
Income (loss) from continuing operations before income taxes
$ 396
$ (183)
$ 42
$ 1816
$ 1323
$ 1323
$ 396
- Interest income
15
6
6
11
8
8
15
+ Interest expense and amortization of debt discount
1 Operating EBIT is defined as earnings (ie Income (loss) from continuing operations before income taxes) before interest excluding the impact of significant items
2 Operating EBITDA is defined as earnings (ie Income (loss) from continuing operations before income taxes) before interest depreciation and amortization excluding the impact of significant items
Significant Items Impacting Results for the Three Months Ended Mar 31 2021
In millions except per share amounts (Unaudited)
Pretax 1
Net Income 2
EPS 3
Reported results
$ 1323
$ 991
$ 132
Less Significant items
Restructuring implementation costs
(10)
(8)
(001)
Digitalization program costs
(33)
(25)
(003)
Total significant items
$ (43)
$ (33)
$ (004)
Operating results (non-GAAP)
$ 1366
$ 1024
$ 136
Significant Items Impacting Results for the Three Months Ended Mar 31 2020
In millions except per share amounts (Unaudited)
Pretax 1
Net Income 2
EPS 3
Reported results
$ 396
$ 239
$ 032
Less Significant items
Integration and separation costs
(65)
(51)
(007)
Restructuring and asset related charges - net
(96)
(79)
(011)
Loss on early extinguishment of debt
(86)
(70)
(009)
Total significant items
$ (247)
$ (200)
$ (027)
Operating results (non-GAAP)
$ 643
$ 439
$ 059
1 Income before income taxes
2 Net income (loss) available for Dow Inc common stockholders The income tax effect on significant items was calculated based upon the enacted tax laws and statutory income tax rates applicable in the tax jurisdiction(s) of the underlying non-GAAP adjustment
1 Free cash flow is defined as Cash provided by (used for) operating activities - continuing operations less capital expenditures Under this definition free cash flow represents the cash generated by the Company from operations after investing in its asset base Free cash flow combined with cash balances and other sources of liquidity represent the cash available to fund obligations and provide returns to shareholders Free cash flow is an integral financial measure used in the Companys financial planning process
2 Free cash flow in the first quarter of 2021 reflects a $1 billion elective pension contribution
Net Sales by Segment
Three Months EndedDec 31 2020
Three Months Ended
In millions (Unaudited)
March 31 2021
March 31 2020
Packaging amp Specialty Plastics
$ 5126
$ 6082
$ 4609
Industrial Intermediates amp Infrastructure
3501
3607
3045
Performance Materials amp Coatings
2029
2123
2065
Corporate
50
70
51
Total
$ 10706
$ 11882
9770
Operating EBIT by Segment
Three Months EndedDec 31 2020
Three Months Ended
In millions (Unaudited)
March 31 2021
March 31 2020
Packaging amp Specialty Plastics
$ 780
$ 1228
$ 580
Industrial Intermediates amp Infrastructure
296
326
175
Performance Materials amp Coatings
50
62
162
Corporate
(72)
(62)
(74)
Total
$ 1054
$ 1554
843
Equity in Earnings (Losses) of Nonconsolidated Affiliates by Segment
Three Months EndedDec 31 2020
Three Months Ended
In millions (Unaudited)
March 31 2021
March 31 2020
Packaging amp Specialty Plastics
$ 77
$ 106
$ 5
Industrial Intermediates amp Infrastructure
36
115
(76)
Performance Materials amp Coatings
2
2
1
Corporate
(9)
1
(19)
Total
$ 106
$ 224
(89)
Adjusted Operating EBIT by Segment
Three Months EndedDec 31 2020
Three Months Ended
In millions (Unaudited)
March 31 2021
March 31 2020
Packaging amp Specialty Plastics
$ 703
$ 1122
$ 575
Industrial Intermediates amp Infrastructure
260
211
251
Performance Materials amp Coatings
48
60
161
Corporate
(63)
(63)
(55)
Total
$ 948
$ 1330
932
Operating Margin by Segment
Three Months EndedDec 31 2020
Three Months Ended
In millions (Unaudited)
March 31 2021
March 31 2020
Packaging amp Specialty Plastics
152
202
126
Industrial Intermediates amp Infrastructure
85
90
57
Performance Materials amp Coatings
25
29
78
Total
98
131
86
Adjusted Operating EBIT Margin by Segment
Three Months EndedDec 31 2020
Three Months Ended
In millions (Unaudited)
March 31 2021
March 31 2020
Packaging amp Specialty Plastics
137
184
125
Industrial Intermediates amp Infrastructure
74
58
82
Performance Materials amp Coatings
24
28
78
Total
89
112
95
Reconciliation of Net income (loss) to Operating EBIT and Operating EBITDA
Three Months Ended
Nine Months Ended
March 31 2020
June 30 2020
September 30 2020
December 31 2020
March 31 2021
September 30 2020
September 30 2019
In millions (Unaudited)
As Reported
Pro Forma
Net income (loss)
$ 258
$ (217)
$ (1)
$ 1254
$ 1006
$ 1006
$ 258
+ Provision for income taxes
138
34
43
562
317
317
138
Income (loss) before income taxes
$ 396
$ (183)
$ 42
$ 1816
$ 1323
$ 1323
$ 396
- Interest income
15
6
6
11
8
8
15
+ Interest expense and amortization of debt discount
1 Operating EBIT is defined as earnings (ie Income (loss) before income taxes) before interest excluding the impact of significant items
2 Operating EBITDA is defined as earnings (ie Income (loss) before income taxes) before interest depreciation and amortization excluding the impact of significant items
Significant Items Impacting Results for the Three Months Ended Mar 31 2021
In millions except per share amounts (Unaudited)
Pretax 1
Net Income 2
EPS 3
Reported results
$ 1323
$ 991
$ 132
Less Significant items
Restructuring implementation costs
(10)
(8)
(001)
Digitalization program costs
(33)
(25)
(003)
Total significant items
$ (43)
$ (33)
$ (004)
Operating results (non-GAAP)
$ 1366
$ 1024
$ 136
Significant Items Impacting Results for the Three Months Ended Mar 31 2020
In millions except per share amounts (Unaudited)
Pretax 1
Net Income 2
EPS 3
Reported results
$ 396
$ 239
$ 032
Less Significant items
Integration and separation costs
(65)
(51)
(007)
Restructuring and asset related charges - net
(96)
(79)
(011)
Loss on early extinguishment of debt
(86)
(70)
(009)
Total significant items
$ (247)
$ (200)
$ (027)
Operating results (non-GAAP)
$ 643
$ 439
$ 059
1 Income before income taxes
2 Net income available for Dow Inc common stockholders The income tax effect on significant items was calculated based upon the enacted tax laws and statutory income tax rates applicable in the tax jurisdiction(s) of the underlying non-GAAP adjustment
1 Free cash flow is defined as Cash provided by (used for) operating activities - continuing operations less capital expenditures Under this definition free cash flow represents the cash generated by the Company from operations after investing in its asset base Free cash flow combined with cash balances and other sources of liquidity represent the cash available to fund obligations and provide returns to shareholders Free cash flow is an integral financial measure used in the Companys financial planning process
Net Sales by Segment
Three Months EndedDec 31 2020
Three Months Ended
In millions (Unaudited)
March 31 2021
March 31 2020
Packaging amp Specialty Plastics
$ 5126
$ 6082
$ 4609
Industrial Intermediates amp Infrastructure
3501
3607
3045
Performance Materials amp Coatings
2029
2123
2065
Corporate
50
70
51
Total
$ 10706
$ 11882
9770
Operating EBIT by Segment
Three Months EndedDec 31 2020
Three Months Ended
In millions (Unaudited)
March 31 2021
March 31 2020
Packaging amp Specialty Plastics
$ 780
$ 1228
$ 580
Industrial Intermediates amp Infrastructure
296
326
175
Performance Materials amp Coatings
50
62
162
Corporate
(72)
(62)
(74)
Total
$ 1054
$ 1554
843
Equity in Earnings (Losses) of Nonconsolidated Affiliates by Segment
Three Months EndedDec 31 2020
Three Months Ended
In millions (Unaudited)
March 31 2021
March 31 2020
Packaging amp Specialty Plastics
$ 77
$ 106
$ 5
Industrial Intermediates amp Infrastructure
36
115
(76)
Performance Materials amp Coatings
2
2
1
Corporate
(9)
1
(19)
Total
$ 106
$ 224
(89)
Adjusted Operating EBIT by Segment
Three Months EndedDec 31 2020
Three Months Ended
In millions (Unaudited)
March 31 2021
March 31 2020
Packaging amp Specialty Plastics
$ 703
$ 1122
$ 575
Industrial Intermediates amp Infrastructure
260
211
251
Performance Materials amp Coatings
48
60
161
Corporate
(63)
(63)
(55)
Total
$ 948
$ 1330
932
Operating Margin by Segment
Three Months EndedDec 31 2020
Three Months Ended
In millions (Unaudited)
March 31 2021
March 31 2020
Packaging amp Specialty Plastics
152
202
126
Industrial Intermediates amp Infrastructure
85
90
57
Performance Materials amp Coatings
25
29
78
Total
98
131
86
Adjusted Operating EBIT Margin by Segment
Three Months EndedDec 31 2020
Three Months Ended
In millions (Unaudited)
March 31 2021
March 31 2020
Packaging amp Specialty Plastics
137
184
125
Industrial Intermediates amp Infrastructure
74
58
82
Performance Materials amp Coatings
24
28
78
Total
89
112
95
Reconciliation of Income (loss) from continuing operations net of tax to Operating EBIT and Operating EBITDA
Three Months Ended
Nine Months Ended
March 31 2020
June 30 2020
September 30 2020
December 31 2020
March 31 2021
September 30 2020
September 30 2019
In millions (Unaudited)
As Reported
Pro Forma
Income (loss) from continuing operations net of tax
$ 258
$ (217)
$ (1)
$ 1254
$ 1006
$ 1006
$ 258
+ Provision for income taxes on continuing operations
138
34
43
562
317
317
138
Income (loss) from continuing operations before income taxes
$ 396
$ (183)
$ 42
$ 1816
$ 1323
$ 1323
$ 396
- Interest income
15
6
6
11
8
8
15
+ Interest expense and amortization of debt discount
1 Operating EBIT is defined as earnings (ie Income (loss) from continuing operations before income taxes) before interest excluding the impact of significant items
2 Operating EBITDA is defined as earnings (ie Income (loss) from continuing operations before income taxes) before interest depreciation and amortization excluding the impact of significant items
Significant Items Impacting Results for the Three Months Ended Mar 31 2021
In millions except per share amounts (Unaudited)
Pretax 1
Net Income 2
EPS 3
Reported results
$ 1323
$ 991
$ 132
Less Significant items
Restructuring implementation costs
(10)
(8)
(001)
Digitalization program costs
(33)
(25)
(003)
Total significant items
$ (43)
$ (33)
$ (004)
Operating results (non-GAAP)
$ 1366
$ 1024
$ 136
Significant Items Impacting Results for the Three Months Ended Mar 31 2020
In millions except per share amounts (Unaudited)
Pretax 1
Net Income 2
EPS 3
Reported results
$ 396
$ 239
$ 032
Less Significant items
Integration and separation costs
(65)
(51)
(007)
Restructuring and asset related charges - net
(96)
(79)
(011)
Loss on early extinguishment of debt
(86)
(70)
(009)
Total significant items
$ (247)
$ (200)
$ (027)
Operating results (non-GAAP)
$ 643
$ 439
$ 059
1 Income before income taxes
2 Net income available for Dow Inc common stockholders The income tax effect on significant items was calculated based upon the enacted tax laws and statutory income tax rates applicable in the tax jurisdiction(s) of the underlying non-GAAP adjustment
3 Earnings per common share - diluted
2Q21 MODELING GUIDANCE
5
Net Sales ~$124 ndash $129B Depreciation amp Amortization ~$715MM
Quarterly Operational Tax Rate ~21 ndash 25 Net Interest Expense (Net of Int Income) ~$185MM
Net Income Attrib to Non-Controlling Int ~$20MM Share Count ~750MM
Top-Line Ranges (2Q21 vs 1Q21)
Base Case Op EBIT Drivers(2Q21 vs 1Q21)
Sales ∆ QoQ
Low High
Packaging amp Specialty Plastics +3 +7
Add-Back 1Q21 Winter Storm Uri Impact (~$200MM tailwind) Continued strong demand for packaging applications globally further supported by seasonal increases Low inventory levels tight supply from industry outages Increased spend entering turnaround season USGC cracker planned maintenance activity (~$175MM headwind)
IndustrialIntermediates amp Infrastructure
+5 +10
Add-Back 1Q21 Winter Storm Uri Impact (~$150MM tailwind) Durable goods demand remains robust with industrial construction auto and oil amp gas end-markets continuing to improve Impact from third-party outages (~$100MM headwind) Increased turnaround spending at USGC sites primarily in polyurethanes (~$50MM headwind)
Performance Materials amp Coatings +5 +10
Add-Back 1Q21 Winter Storm Uri Impact (~$50MM tailwind) Demand strength for electronics mobility and home care applications in silicones Continued sequential demand improvement for architectural coatings Add-Back Turnarounds completed in Deer Park and Zhangjiagang (~$100MM tailwind)
Corporate Sales of $50MM Op EBIT of $(75)MM and Op EBITDA of $(65)MM
Recovery from Winter Storm Uri and continuation of robust demand leading to favorable market fundamentals
Corporate Op EBIT of ~$(275)MM and Op EBITDA of ~$(250)MM
Turnaround Costs Up ~$500MM YoY incl JVs incremental $100MM increase due to Winter Storm Uri impacts
Restructuring ~$300MM expected to be substantially complete by YE21 ~50 by mid-2021
Cash Flow Considerations in 2021
Dividends from Equity Companies ~$200MM (down ~$200MM YoY)
Sadara No cash outflow (~$350MM tailwind YoY)
DWDP Integration Separation and Synergy Costs
No cash outflow ($350MM tailwind YoY)
Pension Contributions
~$12B total cash outflow ($10B elective contribution completed in 1Q21)
Liability Management
~$10B elective contribution to pension reduces rating agency adjusted leverage
CapEx ~$16B (~350MM higher YoY)
2020 Restructuring Program ~$350MM cash outflow
Digital Initiative ~$150MM cash outflow
Other Income Statement Considerations
Net Interest Expense ~$775MM
DampA ~$29B
Net Income Attribto Non-Controlling Int ~$75MM (reduction to reported Net Income)
Share Count ~750MM
Op Tax Rate 21-25
POINTS OF DISTINCTION ENABLE CONTINUED OUTPERFORMANCE
7
End-market recovery benefits Dowrsquos consumer-led portfolio further enhancing performance and shareholder returns
Leading Cash Flow and Shareholder Remuneration Yield Attractive End Market Growth
Dow Continues to be a Compelling Investment Opportunity
bull ~$9B in Free Cash Flow1 generated
bull Disciplined focus drove 93 op cash flow conversion17
bull Free cash flow yield27 of ~11 best-in-class and well ahead of peers sector and overall market average
bull Best-in-class shareholder yield vs peers3
bull Top quartile cost management amp margin performance
1
Packaging ~15x GDP
Addressable Market$650B
Infrastructure ~13x GDP
Consumer ~15x GDP
Mobility ~15x GDP
Dow Peer Range4 SampP 500 Chemicals SampP 500
EVEBITDA NTM56 79x 50x ndash 99x 133x 146x
Free Cash Flow Yield27 106 22 - 79 36 46
Dividend Yield6 45 23 - 48 19 15
Net Debt Change8 darr ~$5B darr ~$3B to uarr ~$5B - -
Differentiated Portfolio with Leading Positions
1 Siloxanes
1 Acrylic Binders
1 Propylene Oxide
1 Propylene Glycol
1 Polyols
1 Purified Ethylene Oxide
1 Amines
1 Solvents
1 Ethylene
2 Polyethylene
1 Ethylene Copolymers
1 Polyethylene Licensing
1 Polyolefins Elastomers
1 Polyolefins Plastomers
(1) 2019 and 2020 total(2) 2019-2020 average(3) 2020
(4) Benchmarking peer set includes Arkema BASF Covestro Eastman Huntsman Lyondell Wacker
(5) NTM is defined as Next Twelve Months
(6) As of 03312021 FactSet (7) 2019 Dow data is on a pro forma basis (8) YE2020 vs YE2018
0
300
600
900
1200
2020 2022 2024 2026 2028 2030
MM
Mill
ion
Tonn
es Mechanical Recycling OtherPartnershipsAdvanced Recycling
PLASTIC CIRCULARITY ROADMAP DRIVES NEAR- AND LONG-TERM GROWTH
Through innovation collaboration and partnerships Dow is leading the way for sustainability in plastics
By 2030 Dow will STOP THE WASTE by enabling 1 million metric tons of plastic to be collected reused or recycled through its direct actions and partnerships
By 2035 Dow will CLOSE THE LOOP by enabling 100 of Dow products sold into packaging applications to be reusable or recyclable
1MM mta Target Plastic collected reused recycled
80
90
100
2020 2025 2030 2035
P
rodu
cts S
old Advanced Recycling
Application Development
100 Target Packaging products reusable or recyclable
Collaborating to drive innovation
and action
Integrating recycled and bio-based
feedstocks
Demonstrating innovative applications
for recycled plastics
Helping customers design for
recyclability
Innovating new products with post-consumer material
Dow is uniquely advantaged by a broad and differentiated portfolio to capture favorable industry supply-demand dynamics
Consumer spending drives ~1-15x GDP demand growth for Industrial Solutions and Polyurethanes
Renewables amp energy efficiency are key growth drivers
Incremental investments in US Gulf Coast Europe and China expect ~$200MMyear EBITDA run-rate
Broad participation in industrial and infrastructure end markets support long-term growth
High value end markets growing ~15-2x GDP upstream capacity availability enables high-value derivative growth
Rapid adoption of EV 5G Cloud Computing drives demand for innovation products
Lower-cost higher-return expansions expected to enable downstream growth of gt$350MMyear EBITDA run-rate
Infrastructure plan COVID-19 recovery expansion benefits
Incremental investments keep pace with ~13-15x GDP demand growth
Continue product mix upgrade to higher return end markets and applications
Canada cracker expansion and debottlenecking PE capacity expect ~$400MMyear EBITDA run-rate
Functional Polymers for infrastructure automotive and photovoltaics delivers outperformance vs peers
0
10
20
30
40
50
60
70
80
90
100
2022E 2023E 2024E 2025E 2026E0
4000
8000
12000
16000
0
10
20
30
40
50
60
70
80
90
100
2022E 2023E 2024E 2025E 2026E0
1000
2000
3000
4000
5000
6000
lsquo000 MTs lsquo000 MTs lsquo000 MTs
Polyethylene MDI Siloxane
30
40
50
60
70
80
90
100
2022E 2023E 2024E 2025E 2026E0
50000
100000
150000
200000
250000
Constructive near-term supply-demand balances Further tightening with expected capacity delays cancellations and typical outages
Adjusted Operating Rate s include typical industry planned outages and delayedcancelled new capacity additions based on historical averages
IHS SAGSI and other company annual reports and disclosuresIndustry consultant views use industry nameplate capacity and include all announced capacity additionsNote Industry operating rate estimates are based on views as of April 2021 and subject to change
1Q 2021 FINANCIAL HIGHLIGHTS
YoY Operating EPS Reconciliation Key Drivers in the Quarter YoYbull Pricing momentum across all segments and
regions led by polyethylene and polyurethane applications
bull Resilient demand in packaging and demand growth in construction mobility electronics and consumer durables end markets
bull Improved equity earnings led by Sadara and the Kuwait joint ventures
bull Lower tax rate on earnings recovery and geographic mix
bull Lower DampA and interest expense offset share count increase
bull Increased turnaround spending on delays from 2020 due to impacts of the pandemic
bull Impact of supply constraints and repair expenses related to Winter Storm Uri on the US Gulf Coast
Financial Summary($ millions unless otherwise noted)
Operating EBITDA $2271 $1567 $704 $1780 $491Earnings per share ndash GAAP $132 $032 $100 $165 $(033)Operating earnings per share $136 $059 $077 $081 $055Cash Provided by (Used for) Op Activities ndashCont Ops1
Op EBITDA to CFFO (Cash Flow Conversion1 )
$(228)(10)
$123679
$(1464) $165693
$(1884)
$059
$136
1Q20 MarginExpansion
Winter Storm Uri Turnarounds Tax Rate Equity Earnings 1Q21
111 Cash Provided by (Used for) Operating Activities ndash Continuing Operations and Cash Flow Conversion include a $1 billion elective pension contribution in the first quarter of 2021
PRINCIPAL JOINT VENTURE DETAIL
1Q 2021 1Q 2020 4Q 2020
$ millions (unaudited)Sadara
KuwaitJVs
ThaiJVs Sadara
KuwaitJVs
ThaiJVs Sadara
KuwaitJVs
ThaiJVs
EBITDA $163 $183 $52 $9 $110 $4 $137 $152 $28
EBIT $106 $144 $44 $(78) $65 $(6) $34 $104 $19
Net IncomeEquity Earnings (Losses) to Dow $55 $119 $34 $(116) $40 $(9) $3 $86 $15
EBITDA in Excess of Eq Earnings $108 $64 $18 $125 $70 $13 $134 $66 $13
Dowrsquos Proportional Share of Principal JV Financial Results
Kuwait JVs Margin expansion from price increases in MEG
Thai JVs Polyethylene margin expansion
Sadara Margin expansion in polyurethane and polyethylene applications
Drivers of YoY and PQ Changes
12Note 4Q2020 values were revised to reflect audited JV financial statements for Sadara
Dow FY20 Benchmarking Update
14
BENCHMARKING PEERS
Benchmarking conducted against segment level peers if sufficient information disclosed otherwise corporate level
15
TOTAL DOW BENCHMARKING SUMMARY OF OBSERVATIONS
Benchmarking Strengths amp Gaps
TotalDow
FY20 YoY Adj Op EBITDA growth trailed the peer median as resilient demand for packaging applications and recovery in durable good end markets was more than offset by upstream pricing pressures in siloxanes and acrylic monomers along with lower relative participation for polyurethanes in Asia which experienced a shorter COVID-19 downturn
In-Flight Actions Implement faster payback higher ROIC expansions reduce merchant positions of intermediatesbull Expansion of FS-1 cracker is underway (+65KTA) that will feed downstream derivative PE demandbull South China Specialties Hub (~250KTA) specialty PU and alkoxylates to participate in Asia growth bull Downstream silicones expansions (~15 projects in 2021) to reduce merchant siloxane intermediates exposure
FY20 Adj Op EBITDA margin remained resilient and among the best in the peer group through the economic downturn and recovery from COVID-19
Cash Flow Conversion among highest in the peer group from a disciplined focus on cash generation and structural working capital efficiency gains
SGampA + RampD as of sales remained among best in peer group from continued cost discipline
Best-in-class Free Cash Flow yield above sector and market averages
Net debt reduced more than peers on strong cash generation and focused capital allocation priorities
Source Dow data CapitalIQ Company ReleasesUnless otherwise noted all 2018 and 2019 financial information for Dow is on a pro forma basisAdjusted Operating EBITDA is defined as Operating EBITDA excluding equity earnings
Adj Op EBITDA Margin excludes transactions with certain nonconsolidated affiliates Cash Flow Conversion is defined as Cash from Continuing Operations divided by Operating EBITDAFree Cash Flow is defined as Cash from Continuing Operations less Capital Expenditures
16
TOTAL DOW
(1) Adjusted Operating EBITDA is defined as Operating EBITDA excluding equity earnings Adj Op EBITDA Margin excludes transactions with certain nonconsolidated affiliates
(2) Benchmarking peer set range includes Arkema BASF Covestro Eastman Huntsman Lyondell Wacker(3) Cash Flow Conversion is defined as Cash From Continuing Operations divided by Operating EBITDA(4) Median excludes Dow
Adj Op EBITDA Growth
Adj Op EBITDA Margin Cash Flow Conversion SGampA + RampD
(as a of Sales)FY20 vs FY19
FY20
Median Excl Dow
Median Excl Dow
BENCHMARKING SNAPSHOT (1234)
FY20 UPDATE amp FY19
FY19
-60
-50
-40
-30
-20
-10
0
10
FY19 vs FY18
FY20 FY19 FY20 FY19
Median Excl Dow
Median Excl Dow
5
10
15
20
25
Median Excl Dow
Median Excl Dow
30
50
70
90
110
130
150
Median Excl Dow Median
Excl Dow
0
5
10
15
20
25
Median Excl Dow
Median Excl Dow
Source Dow data CapitalIQ Company disclosures
Unless otherwise noted all 2018 and 2019 financial information for Dow is on a pro forma basisFor further unaudited pro forma financial information refer to the Companyrsquos Current Report on Form 8-K dated June 3 2019 and 4Q20 Earnings materials included in the Current Report on Form 8-K dated January 28 2021
bull Hallmark safety performance and operational excellence
bull Focused portfolio with market leading positions in key value chains
bull Consumer tilted portfolio in growing end-market verticals
bull Global footprint with integrated value chains that provide differentiated product offerings
CORE STRENGTHSbull Maintain focus on cash
generation and low-cost curve position
bull Continued disciplined capital allocation
bull Use innovation pipeline to collaborate with customers and capture growth trends
bull Invest in incremental higher return faster payback growth opportunities
bull Deliver sustainable future through Industry leading ESG position
Average Annual Free Cash Flow (2019-2020)as of 2020 Market Cap
17
TOP-QUARTILE CASH REMUNERATION YIELD AND DEBT REDUCTION
Median Excl Dow
~84
Median Excl Dow
+02B
Median Excl Dow
~6
Median Excl Dow
~3
(1) Benchmarking peer set range includes Arkema BASF Covestro Eastman Huntsman Lyondell Wacker(2) Source Dow data FactSet and Company Releases for Peers(3) Dow Market Capitalization as of YE2020 was ~$412B
Unless otherwise noted all 2018 and 2019 financial information for Dow is on a pro forma basisFor further unaudited pro forma financial information refer to the Companyrsquos Current Report on Form 8-K dated June 3 2019 and 4Q20 Earnings materials included in the Current Report on Form 8-K dated January 28 2021
18
CULTURE OF BENCHMARKING SUMMARY OF OBSERVATIONS
Segment FY20 Benchmarking Strengths amp Gaps
PampSP
FY20 YoY Adj Op EBITDA growth tracked the peer median as peers with more exposure to naphtha rebounded from a lower 2019 performance from cost pressures
FY20 Adj Op EBITDA margin more resilient than most peers Op EBITDA per pound polyolefin capacity ahead of peers advantage continues to widen Free Cash Conversion continued to improve and is best-in-class among the peer set SGampA + RampD as of sales remained among lowest in the peer group
IIampI
FY20 YoY Adj Op EBITDA growth and Adj Op EBITDA margin trailed the peer median as strengthening durable good end-markets in 2H20 were offset by decisive actions taken earlier in 1H20 to match production to demand as well as lower relative participation in Asia which experienced a shorter COVID-19 demand downturn
Free Cash Conversion is best-in-class among the peer set SGampA + RampD as of sales remained among lowest in the peer group
PMampC
FY20 YoY Adj Op EBITDA growth trailed the peer median due to greater exposure to siloxanes and acrylic monomers that were more heavily impacted by demand downturn and competitive pricing actions
FY20 Adj Op EBITDA margin trailed the peer median as strong demand for home care and DIY coatings was more than offset by personal care and automotive applications that lagged broader recovery
Free Cash Conversion among highest in the peer group SGampA + RampD as of sales best-in-class expanded advantage vs next closest peer
Source Dow data CapitalIQ Company ReleasesAdjusted Operating EBITDA is defined as Operating EBITDA excluding equity earnings Adj Op EBITDA Margin excludes transactions with certain nonconsolidated affiliatesFree Cash Conversion for Dow is defined as Adj Op EBITDA less Capex divided by Adj Op EBITDA
Unless otherwise noted all 2018 and 2019 financial information for Dow is on a pro forma basisFor further unaudited pro forma financial information refer to the Companyrsquos Current Report on Form 8-K dated June 3 2019 and 4Q20 Earnings materials included in the Current Report on Form 8-K dated January 28 2021
19
PACKAGING amp SPECIALTY PLASTICS
Adj Op EBITDA Growth(7)
Adj Op EBITDA Margin Free Cash Conversion SGampA + RampD
(as a of Sales)bull World-class packaging
franchise
bull Most flexible feedstock capability in the industry
bull Flexible polyolefins assets
bull Proprietary catalyst and process technology
bull Differentiated co-monomer capability
bull Global low-cost footprint
bull Maintain focus on cash conversion and cost discipline
bull Leverage differentiated product offerings and innovation pipeline to meet growing demand
bull Accelerate sell-up opportunities of higher margin product mix
bull Incremental quick payback investments and capacity expansions
bull Plastics circularity energy intensity CO2 footprint
CORE STRENGTHS FOCUS AREASFY20 vs FY19
FY20
Median Excl Dow
Median Excl Dow
FY19
-80
-60
-40
-20
0
20
40
FY19 vs FY18
FY20 FY19 FY20 FY19
Median Excl Dow
Median Excl Dow
5
10
15
20
25
Median Excl Dow
Median Excl Dow
0
20
40
60
80
Median Excl Dow
Median Excl Dow
0
5
10
15
Median Excl Dow
Median Excl Dow
Source Dow data CapitalIQ Company disclosures
(1) Adjusted Operating EBITDA is defined as Operating EBITDA excluding equity earningsAdj Op EBITDA Margin excludes transactions with certain nonconsolidated affiliates
(2) Benchmarking peer set range includes LyondellBasell Olefins amp Polyolefins Chevron Phillip Chemical Borealis Polyolefins ExxonMobil Chemicals (entire segment)
(3) Free Cash Conversion for Dow is defined as Adj Op EBITDA less Capex divided by Adj Op EBITDA(4) Median excludes Dow(5) SGampA + RampD reflects corporate level for peers where segment level data is unavailable
BENCHMARKING SNAPSHOT (123456)
FY20 UPDATE amp FY19
(6) CPChem results are as of 3Q20 TTM(7) Adj Op EBITDA Growth chart capped for visual purposes top peer was ~90
Unless otherwise noted all 2018 and 2019 financial information for Dow is on a pro forma basisFor further unaudited pro forma financial information refer to the Companyrsquos Current Report on Form 8-K dated June 3 2019 and 4Q20 Earnings materials included in the Current Report on Form 8-K dated January 28 2021
bull Full feedstock-to-polymer integration continues to deliver enhanced value
(1) Segment Op EBITDA based on FY20 reported figures including equity income from affiliatesJVs Capacity based on latest company reported nameplate for PE and PP (2019 for Dow 2020 10-K for Lyondell) including share of JVs or ICIS reported capacity for 2019 including share of JVs if not available (Borealis)
(2) Borealis Polyolefins EBITDA adjusted for equity earnings from JVsUnless otherwise noted all 2018 and 2019 financial information for Dow is on a pro forma basisFor further unaudited pro forma financial information refer to the Companyrsquos Current Report on Form 8-K dated June 3 2019 and 4Q20 Earnings materials included in the Current Report on Form 8-K dated January 28 2021
21
INDUSTRIAL INTERMEDIATES amp INFRASTRUCTURE
bull Top global producer of key raw materials (EO PO)
bull Flexible manufacturing model through integration
bull Top 3 PU Systems House business
bull Industrial Solutions contains products with some of the highest returns to ethylene
bull Maintain focus on cash conversion and cost discipline
bull Drive PU mix towards higher margin Perf Polyols amp Systems
bull Implement faster payback higher ROIC expansions (China Specialties hub differentiated PU applications and DIS alkoxylates)
FOCUS AREASAdj Op EBITDA Growth
Adj Op EBITDA Margin Free Cash Conversion SGampA + RampD
(as a of Sales)
Median Excl Dow
Median Excl Dow Median
Excl Dow
Median Excl Dow
CORE STRENGTHS
Source Dow data CapitalIQ Company disclosures
FY20 vs FY19 FY20 FY19
FY19 vs FY18 FY20 FY19 FY20 FY19
-60
-40
-20
0
20
Median Excl Dow
Median Excl Dow
0
5
10
15
20
25
Median Excl Dow
Median Excl Dow
-10
10
30
50
70
90
Median Excl Dow Median
Excl Dow
0
5
10
15
20
Median Excl Dow Median
Excl Dow
(1) Adjusted Operating EBITDA is defined as Operating EBITDA excluding equity earnings Adj Op EBITDA Margin excludes transactions with certain nonconsolidated affiliates
(2) Benchmarking peer set range includes Eastman Huntsman Covestro LyondellBasell Intermediates amp Derivatives segment(3) Free Cash Conversion for Dow is defined as Adj Op EBITDA less Capex divided by Adj Op EBITDA(4) Median excludes Dow(5) SGampA + RampD reflects corporate level for peers where segment level data is unavailable
BENCHMARKING SNAPSHOT (12345)
FY20 UPDATE amp FY19
Unless otherwise noted all 2018 and 2019 financial information for Dow is on a pro forma basisFor further unaudited pro forma financial information refer to the Companyrsquos Current Report on Form 8-K dated June 3 2019 and 4Q20 Earnings materials included in the Current Report on Form 8-K dated January 28 2021
22
PERFORMANCE MATERIALS amp COATINGS
Adj Op EBITDA Growth
Adj Op EBITDA Margin
SGampA + RampD (as a of Sales) FOCUS AREAS
bull Maintain focus on cash conversion and cost discipline
bull Accelerate organic growth and explore bolt-on inorganic growth
bull Innovate with customers on sustainable solutions
bull Improve acrylic monomer and siloxane margins drive more captive use
bull Grow industrial coatings in prioritized end markets
bull World-class silicones franchise
bull Lowest cost siloxanes producer
bull Leading coatings solutions provider
bull World-scale acrylic monomer assets
bull One of the largest B2B digital platforms
bull Unique hybrid chemistry opportunities
bull Leading SGampA and RampD efficiency
Free Cash Conversion
Median Excl Dow
Median Excl Dow
Median Excl Dow
CORE STRENGTHSFY20 vs FY19 FY20 FY19
FY19 vs FY18 FY20 FY19 FY20 FY19
-40
-30
-20
-10
0
10
Median Excl Dow
Median Excl Dow
5
10
15
20
25
30
35
Median Excl Dow Median
Excl Dow
40
50
60
70
80
Median Excl Dow
Median Excl Dow
5
10
15
20
Median Excl Dow
Median Excl Dow
Source Dow data CapitalIQ Company disclosures
(1) Adjusted Operating EBITDA is defined as Operating EBITDA excluding equity earnings Adj Op EBITDA Margin excludes transactions with certain nonconsolidated affiliates
(2) Benchmarking peer set range includes Celanese Acetyl Chain Wacker Silicones segment Shin-Etsu Silicones segment Arkema Covestro Coatings segment
(3) Free Cash Conversion for Dow is defined as Adj Op EBITDA less Capex divided by Adj Op EBITDA(4) Median excludes Dow(5) SGampA + RampD reflects corporate level for peers where segment level data is unavailable
BENCHMARKING SNAPSHOT (1234)
FY20 UPDATE amp FY19
Unless otherwise noted all 2018 and 2019 financial information for Dow is on a pro forma basisFor further unaudited pro forma financial information refer to the Companyrsquos Current Report on Form 8-K dated June 3 2019 and 4Q20 Earnings materials included in the Current Report on Form 8-K dated January 28 2021
Appendix
OPERATING EARNINGS PER SHARE (EPS) RECONCILIATION
24
In millions except per share amounts (Unaudited) Pretax 1 Net Income 2 EPS 3
Significant Items Impacting Results for the Three Months Ended Mar 31 2021
Significant Items Impacting Results for the Three Months Ended Mar 31 2020
2 Net income available for Dow Inc common stockholders The income tax effect on signif icant items w as calculated based upon the enacted tax law s and statutory income tax rates applicable in the tax jurisdiction(s) of the underlying non-GAAP adjustment
1 Income before income taxes
3 Earnings per common share - diluted
Non-GAAP - Sig Items
DOW CONFIDENTIAL - Do not share without permission
Non-GAAP - EBITDA Recon
DOW CONFIDENTIAL - Do not share without permission
Non-GAAP - Segment Info
DOW CONFIDENTIAL - Do not share without permission
Non-GAAP - Cash Flow Measures
DOW CONFIDENTIAL - Do not share without permission
Non-GAAP - Net Debt
DOW CONFIDENTIAL - Do not share without permission
RECONCILIATION OF NET INCOME (LOSS) TO OPERATING EBIT amp OPERATING EBITDA
25
In millions (Unaudited)
Net income (loss) $ 258 $ (217) $ (1) $ 1254 $ 1006 + Provision for income taxes 138 34 43 562 317Income (loss) before income taxes $ 396 $ (183) $ 42 $ 1816 $ 1323 - Interest income 15 6 6 11 8+ Interest expense and amortization of debt discount 215 200 202 210 196- Significant items (247) (46) (523) 961 (43)Operating EBIT 1 $ 843 $ 57 $ 761 $ 1054 $ 1554 + Depreciation and amortization 724 700 724 726 717Operating EBITDA 2 $ 1567 $ 757 $ 1485 $ 1780 $ 2271 Operating EBITDA - Trailing Twelve Months (TTM) basis $ 6971 $ 5926 $ 5555 $ 5589 $ 6293 1 Operating EBIT is defined as earnings (ie Income (loss) before income taxes) before interest excluding the impact of signif icant items2 Operating EBITDA is defined as earnings (ie Income (loss) before income taxes) before interest depreciation and amortization excluding the impact of signif icant items
Reconciliation of Net income (loss) to Operating EBIT and Operating EBITDA
March 31 2020
Three Months Ended
September 30 2020June 30 2020 March 31 2021December 31 2020
Non-GAAP - Sig Items
DOW CONFIDENTIAL - Do not share without permission
Non-GAAP - EBITDA Recon
DOW CONFIDENTIAL - Do not share without permission
Non-GAAP - Segment Info
DOW CONFIDENTIAL - Do not share without permission
Non-GAAP - Cash Flow Measures
DOW CONFIDENTIAL - Do not share without permission
Non-GAAP - Net Debt
DOW CONFIDENTIAL - Do not share without permission
SEGMENT INFORMATION
26
Net Sales by Segment
In millions (Unaudited) March 31 2021 March 31 2020
2 Free cash f low in the f irst quarter of 2021 reflects a $1 billion elective pension contribution
Three Months Ended
1 Cash f low conversion is defined as Cash provided by (used for) operating activities - continuing operations divided by Operating EBITDA
Three Months Ended
1 Free cash f low is defined as Cash provided by (used for) operating activities - continuing operations less capital expenditures Under this definition free cash f low represents the cash generated by the Company from operations after investing in its asset base Free cash f low combined w ith cash balances and other sources of liquidity represent the cash available to fund obligations and provide returns to shareholders Free cash f low is an integral f inancial measure used in the Companys f inancial planning process
2 Cash f low conversion in the f irst quarter of 2021 reflects a $1 billion elective pension contribution
Non-GAAP - Sig Items
DOW CONFIDENTIAL - Do not share without permission
Non-GAAP - EBITDA Recon
DOW CONFIDENTIAL - Do not share without permission
Non-GAAP - Segment Info
DOW CONFIDENTIAL - Do not share without permission
Non-GAAP - Cash Flow Measures
DOW CONFIDENTIAL - Do not share without permission
Non-GAAP - Net Debt
DOW CONFIDENTIAL - Do not share without permission
RECONCILIATION OF NET DEBT
29
Reconciliation of Net Debt
In millions (Unaudited)Notes payable $ 152 $ 156 Long-term debt due within one year 492 460Long-term debt 16200 16491
DOW CONFIDENTIAL - Do not share without permission
Non-GAAP - EBITDA Recon
DOW CONFIDENTIAL - Do not share without permission
Non-GAAP - Segment Info
DOW CONFIDENTIAL - Do not share without permission
Non-GAAP - Cash Flow Measures
DOW CONFIDENTIAL - Do not share without permission
Non-GAAP - Net Debt
DOW CONFIDENTIAL - Do not share without permission
Background On April 1 2019 DowDuPont completed the separation of its materials science business and Dow Inc became the direct parent company of TDCC owning all of the outstanding common shares of TDCC For filings related to the period commencing April 1 2019 and thereafter TDCC was deemed the predecessor to Dow Inc and the historical results of TDCC are deemed the historical results of Dow Inc for periods prior to and including March 31 2019
The separation was contemplated by the merger of equals transaction effective August 31 2017 under the Agreement and Plan of Merger dated as of December 11 2015 as amended on March 31 2017 TDCC and Historical DuPont each merged with subsidiaries of DowDuPont and as a result TDCC and Historical DuPont became subsidiaries of DowDuPont (the ldquoMergerrdquo) Subsequent to the Merger TDCC and Historical DuPont engaged in a series of internal reorganization and realignment steps to realign their businesses into three subgroups agriculture materials science and specialty products Dow Inc was formed as a wholly owned subsidiary of DowDuPont to serve as the holding company for the materials science business
Unaudited Pro Forma Financial InformationIn order to provide the most meaningful comparison of results of operations and results by segment supplemental unaudited pro forma financial information has been included in the following financial schedules The unaudited pro forma financial information is based on the consolidated financial statements of TDCC adjusted to give effect to the separation from DowDuPont as if it had been consummated on January 1 2017 For the twelve months ended December 31 2019 and 2018 pro forma adjustments have been made for (1) the margin impact of various manufacturing supply and service related agreements entered into with DuPont and Corteva in connection with the separation which provide for different pricing than the historical intercompany and intracompany pricing practices of TDCC and Historical DuPont and (2) the elimination of the impact of events directly attributable to the Merger internal reorganization and business realignment separation distribution and other related transactions (eg one-time transaction costs)
The unaudited pro forma financial information has been presented for informational purposes only and is not necessarily indicative of what Dows results of operations actually would have been had the separation from DowDuPont been completed as of January 1 2017 nor is it indicative of the future operating results of Dow The unaudited pro forma information does not reflect restructuring or integration activities or other costs following the separation from DowDuPont that may be incurred to achieve cost or growth synergies of Dow For further information on the unaudited pro forma financial information please refer to the Companys Current Report on Form 8-K dated June 3 2019
General CommentsUnless otherwise specified all financial measures in this presentation where applicable exclude significant items
GENERAL COMMENTS
30
SAFE HARBORCautionary Statement about Forward-Looking Statements
This presentation contains ldquoforward-looking statementsrdquo within the meaning of the federal securities laws including Section 27A of the Securities Act of 1933 as amended and Section 21E of the Securities Exchange Act of 1934 as amended Such statements often address expected future business and financial performance financial condition and other matters and often contain words or phrases such as ldquoanticipaterdquo ldquobelieverdquo ldquoestimaterdquo ldquoexpectrdquo ldquointendrdquo ldquomayrdquo ldquoopportunityrdquo ldquooutlookrdquo ldquoplanrdquo ldquoprojectrdquo ldquoseekrdquo ldquoshouldrdquo ldquostrategyrdquo ldquotargetrdquo ldquowillrdquo ldquowill berdquo ldquowill continuerdquo ldquowill likely resultrdquo ldquowouldrdquo and similar expressions and variations or negatives of these words or phrases
Forward-looking statements are based on current assumptions and expectations of future events that are subject to risks uncertainties and other factors that are beyond Dowrsquos control which may cause actual results to differ materially from those projected anticipated or implied in the forward-looking statements and speak only as of the date the statements were made These factors include but are not limited to sales of Dowrsquos products Dowrsquos expenses future revenues and profitability the continuing global and regional economic impacts of the coronavirus disease 2019 (ldquoCOVID-19rdquo) pandemic and other public health-related risks and events on Dowrsquos business capital requirements and need for and availability of financing size of the markets for Dowrsquos products and services and ability to compete in such markets failure to develop and market new products and optimally manage product life cycles the rate and degree of market acceptance of Dowrsquos products significant litigation and environmental matters and related contingencies and unexpected expenses the success of competing technologies that are or may become available the ability to protect Dowrsquos intellectual property in the United States and abroad developments related to contemplated restructuring activities and proposed divestitures or acquisitions such as workforce reduction manufacturing facility andor asset closure and related exit and disposal activities and the benefits and costs associated with each of the foregoing fluctuations in energy and raw material prices management of process safety and product stewardship changes in relationships with Dowrsquos significant customers and suppliers changes in consumer preferences and demand changes in laws and regulations political conditions or industry development global economic and capital markets conditions such as inflation market uncertainty interest and currency exchange rates and equity and commodity prices business or supply disruptions security threats such as acts of sabotage terrorism or war weather events and natural disasters and disruptions in Dowrsquos information technology networks and systems
Risks related to Dowrsquos separation from DowDuPont Inc include but are not limited to (i) Dowrsquos inability to achieve some or all of the benefits that it expects to receive from the separation from DowDuPont Inc (ii) certain tax risks associated with the separation (iii) the failure of Dowrsquos pro forma financial information to be a reliable indicator of Dowrsquos future results (iv) non-compete restrictions under the separation agreement (v) receipt of less favorable terms in the commercial agreements Dow entered into with DuPont and Corteva Inc (ldquoCortevardquo) including restrictions under intellectual property cross-license agreements than Dow would have received from an unaffiliated third party and (vi) Dowrsquos obligation to indemnify DuPont andor Corteva for certain liabilities
Where in any forward-looking statement an expectation or belief as to future results or events is expressed such expectation or belief is based on the current plans and expectations of management and expressed in good faith and believed to have a reasonable basis but there can be no assurance that the expectation or belief will result or be achieved or accomplished A detailed discussion of principal risks and uncertainties which may cause actual results and events to differ materially from such forward-looking statements is included in the section titled ldquoRisk Factorsrdquo contained in the Companyrsquos Annual Report on Form 10-K for the year ended December 31 2020 These are not the only risks and uncertainties that Dow faces There may be other risks and uncertainties that Dow is unable to identify at this time or that Dow does not currently expect to have a material impact on its business If any of those risks or uncertainties develops into an actual event it could have a material adverse effect on Dowrsquos business Dow assumes no obligation to update or revise publicly any forward-looking statements whether because of new information future events or otherwise except as required by securities and other applicable laws
31
Non-GAAP Financial MeasuresThis presentation includes information that does not conform to US GAAP and are considered non-GAAP measures Management uses these measures internally for planning forecasting and evaluating the performance of the Companys segments including allocating resources Dows management believes that these non-GAAP measures best reflect the ongoing performance of the Company during the periods presented and provide more relevant and meaningful information to investors as they provide insight with respect to ongoing operating results of the Company and a more useful comparison of year-over-year results These non-GAAP measures supplement the Companys US GAAP disclosures and should not be viewed as alternatives to US GAAP measures of performance Furthermore such non-GAAP measures may not be consistent with similar measures provided or used by other companies Dow does not provide forward-looking US GAAP financial measures or a reconciliation of forward-looking non-GAAP financial measures to the most comparable US GAAP financial measures on a forward-looking basis because the Company is unable to predict with reasonable certainty the ultimate outcome of pending litigation unusual gains and losses foreign currency exchange gains or losses and potential future asset impairments as well as discrete taxable events without unreasonable effort These items are uncertain depend on various factors and could have a material impact on US GAAP results for the guidance period
TrademarksThe Dow Diamond logo and all products unless otherwise noted denoted with trade or reg are trademarks service marks or registered trademarks of The Dow Chemical Company or its respective subsidiaries or affiliates Solely for convenience the trademarks service marks and trade names referred to in this communication may appear without the trade or reg symbols but such references are not intended to indicate in any way that we will not assert to the fullest extent under applicable law our rights or the right of the applicable licensor to these trademarks service marks and trade names This presentation may also contain trademarks service marks and trade names of certain third parties which are the property of their respective owners Our use or display of third partiesrsquo trademarks service marks trade names or products in this communication is not intended to and should not be read to imply a relationship with or endorsement or sponsorship of us
DefinitionsOperating EBIT is defined as earnings (ie ldquoIncome (loss) from continuing operations before taxesrdquo) before interest excluding the impact of significant itemsOperating EBITDA is defined as earnings (ie ldquoIncome (loss) from continuing operations before taxesrdquo) before interest depreciation and amortization excluding the impact of significant itemsOperating EBIT Margin is defined as Operating EBIT divided by net salesAdjusted Operating EBIT is defined as Operating EBIT less equity earningsAdjusted Operating EBIT Margin is defined as Operating EBIT less equity earnings divided by net salesAdjusted Operating EBITDA is defined as Operating EBITDA less equity earningsAdjusted Operating EBITDA Margin is defined as Adjusted Operating EBITDA divided by net sales excluding certain transactions with nonconsolidated affiliates Operating earnings per share is defined as Earnings (loss) per common share from continuing operations - dilutedldquo excluding the after-tax impact of significant items Operational Tax Rate is defined as the effective tax rate (ie GAAP ldquoProvision for income taxesrdquo divided by ldquoIncome (loss) from continuing operations before income taxesrdquo) excluding the impact of significant itemsFree cash flow (FCF) is defined as ldquoCash provided by (used for) operating activities - continuing operationsrdquo less capital expenditures Under this definition free cash flow represents the cash generated by the Company from operations after investing in its asset base Free cash flow combined with cash balances and other sources of liquidity represent the cash available to fund obligations and provide returns to shareholders Free cash flow is an integral financial measure used in the Companys financial planning processFree Cash Flow Yield is defined as Free cash flow divided by market capitalizationShareholder Remuneration is defined as Dividends paid to stockholders plus Purchases of treasury stockShareholder Yield is defined as Shareholder Remuneration divided by market capitalizationCash Flow Conversion is defined as ldquoCash provided by (used for) operating activities ndash continuing operationsrdquo divided by Operating EBITDA or Pro Forma Operating EBITDA Management believes cash flow conversion is an important financial metric as it helps the Company determine how efficiently it is converting its earnings to cash flowFree cash conversion is defined as Adjusted Operating EBITDA less capital expenditures divided by Adjusted Operating EBITDANet Debt is defined as ldquoNotes payablerdquo plus ldquoLong-term debt due within one yearrdquo plus ldquoLong-term debtrdquo less ldquoCash and cash equivalentsrdquo and ldquoMarketable securitiesrdquoKuwait Joint Ventures (JVs) refers to EQUATE Petrochemical Company KSCC The Kuwait Olefins Company KSCC and The Kuwait Styrene Company KSCCThai Joint Ventures (JVs) refers to Map Ta Phut Olefins Company Limited and The SCG-Dow Group (Siam Polyethylene Company Limited Siam Polystyrene Company Limited Siam Styrene Monomer Co Ltd Siam Synthetic Latex Company Limited)
1 Free cash flow is defined as Cash provided by (used for) operating activities - continuing operations less capital expenditures Under this definition free cash flow represents the cash generated by the Company from operations after investing in its asset base Free cash flow combined with cash balances and other sources of liquidity represent the cash available to fund obligations and provide returns to shareholders Free cash flow is an integral financial measure used in the Companys financial planning process
Net Sales by Segment
Three Months EndedDec 31 2020
Three Months Ended
In millions (Unaudited)
March 31 2021
March 31 2020
Packaging amp Specialty Plastics
$ 5126
$ 6082
$ 4609
Industrial Intermediates amp Infrastructure
3501
3607
3045
Performance Materials amp Coatings
2029
2123
2065
Corporate
50
70
51
Total
$ 10706
$ 11882
9770
Operating EBIT by Segment
Three Months EndedDec 31 2020
Three Months Ended
In millions (Unaudited)
March 31 2021
March 31 2020
Packaging amp Specialty Plastics
$ 780
$ 1228
$ 580
Industrial Intermediates amp Infrastructure
296
326
175
Performance Materials amp Coatings
50
62
162
Corporate
(72)
(62)
(74)
Total
$ 1054
$ 1554
843
Equity in Earnings (Losses) of Nonconsolidated Affiliates by Segment
Three Months EndedDec 31 2020
Three Months Ended
In millions (Unaudited)
March 31 2021
March 31 2020
Packaging amp Specialty Plastics
$ 77
$ 106
$ 5
Industrial Intermediates amp Infrastructure
36
115
(76)
Performance Materials amp Coatings
2
2
1
Corporate
(9)
1
(19)
Total
$ 106
$ 224
(89)
Adjusted Operating EBIT by Segment
Three Months EndedDec 31 2020
Three Months Ended
In millions (Unaudited)
March 31 2021
March 31 2020
Packaging amp Specialty Plastics
$ 703
$ 1122
$ 575
Industrial Intermediates amp Infrastructure
260
211
251
Performance Materials amp Coatings
48
60
161
Corporate
(63)
(63)
(55)
Total
$ 948
$ 1330
932
Operating Margin by Segment
Three Months EndedDec 31 2020
Three Months Ended
In millions (Unaudited)
March 31 2021
March 31 2020
Packaging amp Specialty Plastics
152
202
126
Industrial Intermediates amp Infrastructure
85
90
57
Performance Materials amp Coatings
25
29
78
Total
98
131
86
Adjusted Operating EBIT Margin by Segment
Three Months EndedDec 31 2020
Three Months Ended
In millions (Unaudited)
March 31 2021
March 31 2020
Packaging amp Specialty Plastics
137
184
125
Industrial Intermediates amp Infrastructure
74
58
82
Performance Materials amp Coatings
24
28
78
Total
89
112
95
Reconciliation of Income (loss) from continuing operations net of tax to Operating EBIT and Operating EBITDA
Three Months Ended
Nine Months Ended
March 31 2020
June 30 2020
September 30 2020
December 31 2020
March 31 2021
September 30 2020
September 30 2019
In millions (Unaudited)
As Reported
Pro Forma
Income (loss) from continuing operations net of tax
$ 258
$ (217)
$ (1)
$ 1254
$ 1006
$ 1006
$ 258
+ Provision for income taxes on continuing operations
138
34
43
562
317
317
138
Income (loss) from continuing operations before income taxes
$ 396
$ (183)
$ 42
$ 1816
$ 1323
$ 1323
$ 396
- Interest income
15
6
6
11
8
8
15
+ Interest expense and amortization of debt discount
1 Operating EBIT is defined as earnings (ie Income (loss) from continuing operations before income taxes) before interest excluding the impact of significant items
2 Operating EBITDA is defined as earnings (ie Income (loss) from continuing operations before income taxes) before interest depreciation and amortization excluding the impact of significant items
Significant Items Impacting Results for the Three Months Ended Mar 31 2021
In millions except per share amounts (Unaudited)
Pretax 1
Net Income 2
EPS 3
Reported results
$ 1323
$ 991
$ 132
Less Significant items
Restructuring implementation costs
(10)
(8)
(001)
Digitalization program costs
(33)
(25)
(003)
Total significant items
$ (43)
$ (33)
$ (004)
Operating results (non-GAAP)
$ 1366
$ 1024
$ 136
Significant Items Impacting Results for the Three Months Ended Mar 31 2020
In millions except per share amounts (Unaudited)
Pretax 1
Net Income 2
EPS 3
Reported results
$ 396
$ 239
$ 032
Less Significant items
Integration and separation costs
(65)
(51)
(007)
Restructuring and asset related charges - net
(96)
(79)
(011)
Loss on early extinguishment of debt
(86)
(70)
(009)
Total significant items
$ (247)
$ (200)
$ (027)
Operating results (non-GAAP)
$ 643
$ 439
$ 059
1 Income before income taxes
2 Net income (loss) available for Dow Inc common stockholders The income tax effect on significant items was calculated based upon the enacted tax laws and statutory income tax rates applicable in the tax jurisdiction(s) of the underlying non-GAAP adjustment
1 Free cash flow is defined as Cash provided by (used for) operating activities - continuing operations less capital expenditures Under this definition free cash flow represents the cash generated by the Company from operations after investing in its asset base Free cash flow combined with cash balances and other sources of liquidity represent the cash available to fund obligations and provide returns to shareholders Free cash flow is an integral financial measure used in the Companys financial planning process
2 Free cash flow in the first quarter of 2021 reflects a $1 billion elective pension contribution
Net Sales by Segment
Three Months EndedDec 31 2020
Three Months Ended
In millions (Unaudited)
March 31 2021
March 31 2020
Packaging amp Specialty Plastics
$ 5126
$ 6082
$ 4609
Industrial Intermediates amp Infrastructure
3501
3607
3045
Performance Materials amp Coatings
2029
2123
2065
Corporate
50
70
51
Total
$ 10706
$ 11882
9770
Operating EBIT by Segment
Three Months EndedDec 31 2020
Three Months Ended
In millions (Unaudited)
March 31 2021
March 31 2020
Packaging amp Specialty Plastics
$ 780
$ 1228
$ 580
Industrial Intermediates amp Infrastructure
296
326
175
Performance Materials amp Coatings
50
62
162
Corporate
(72)
(62)
(74)
Total
$ 1054
$ 1554
843
Equity in Earnings (Losses) of Nonconsolidated Affiliates by Segment
Three Months EndedDec 31 2020
Three Months Ended
In millions (Unaudited)
March 31 2021
March 31 2020
Packaging amp Specialty Plastics
$ 77
$ 106
$ 5
Industrial Intermediates amp Infrastructure
36
115
(76)
Performance Materials amp Coatings
2
2
1
Corporate
(9)
1
(19)
Total
$ 106
$ 224
(89)
Adjusted Operating EBIT by Segment
Three Months EndedDec 31 2020
Three Months Ended
In millions (Unaudited)
March 31 2021
March 31 2020
Packaging amp Specialty Plastics
$ 703
$ 1122
$ 575
Industrial Intermediates amp Infrastructure
260
211
251
Performance Materials amp Coatings
48
60
161
Corporate
(63)
(63)
(55)
Total
$ 948
$ 1330
932
Operating Margin by Segment
Three Months EndedDec 31 2020
Three Months Ended
In millions (Unaudited)
March 31 2021
March 31 2020
Packaging amp Specialty Plastics
152
202
126
Industrial Intermediates amp Infrastructure
85
90
57
Performance Materials amp Coatings
25
29
78
Total
98
131
86
Adjusted Operating EBIT Margin by Segment
Three Months EndedDec 31 2020
Three Months Ended
In millions (Unaudited)
March 31 2021
March 31 2020
Packaging amp Specialty Plastics
137
184
125
Industrial Intermediates amp Infrastructure
74
58
82
Performance Materials amp Coatings
24
28
78
Total
89
112
95
Reconciliation of Income (loss) from continuing operations net of tax to Operating EBIT and Operating EBITDA
Three Months Ended
Nine Months Ended
March 31 2020
June 30 2020
September 30 2020
December 31 2020
March 31 2021
September 30 2020
September 30 2019
In millions (Unaudited)
As Reported
Pro Forma
Income (loss) from continuing operations net of tax
$ 258
$ (217)
$ (1)
$ 1254
$ 1006
$ 1006
$ 258
+ Provision for income taxes on continuing operations
138
34
43
562
317
317
138
Income (loss) from continuing operations before income taxes
$ 396
$ (183)
$ 42
$ 1816
$ 1323
$ 1323
$ 396
- Interest income
15
6
6
11
8
8
15
+ Interest expense and amortization of debt discount
1 Operating EBIT is defined as earnings (ie Income (loss) from continuing operations before income taxes) before interest excluding the impact of significant items
2 Operating EBITDA is defined as earnings (ie Income (loss) from continuing operations before income taxes) before interest depreciation and amortization excluding the impact of significant items
Significant Items Impacting Results for the Three Months Ended Mar 31 2021
In millions except per share amounts (Unaudited)
Pretax 1
Net Income 2
EPS 3
Reported results
$ 1323
$ 991
$ 132
Less Significant items
Restructuring implementation costs
(10)
(8)
(001)
Digitalization program costs
(33)
(25)
(003)
Total significant items
$ (43)
$ (33)
$ (004)
Operating results (non-GAAP)
$ 1366
$ 1024
$ 136
Significant Items Impacting Results for the Three Months Ended Mar 31 2020
In millions except per share amounts (Unaudited)
Pretax 1
Net Income 2
EPS 3
Reported results
$ 396
$ 239
$ 032
Less Significant items
Integration and separation costs
(65)
(51)
(007)
Restructuring and asset related charges - net
(96)
(79)
(011)
Loss on early extinguishment of debt
(86)
(70)
(009)
Total significant items
$ (247)
$ (200)
$ (027)
Operating results (non-GAAP)
$ 643
$ 439
$ 059
1 Income before income taxes
2 Net income available for Dow Inc common stockholders The income tax effect on significant items was calculated based upon the enacted tax laws and statutory income tax rates applicable in the tax jurisdiction(s) of the underlying non-GAAP adjustment
1 Free cash flow is defined as Cash provided by (used for) operating activities - continuing operations less capital expenditures Under this definition free cash flow represents the cash generated by the Company from operations after investing in its asset base Free cash flow combined with cash balances and other sources of liquidity represent the cash available to fund obligations and provide returns to shareholders Free cash flow is an integral financial measure used in the Companys financial planning process
Net Sales by Segment
Three Months EndedDec 31 2020
Three Months Ended
In millions (Unaudited)
March 31 2021
March 31 2020
Packaging amp Specialty Plastics
$ 5126
$ 6082
$ 4609
Industrial Intermediates amp Infrastructure
3501
3607
3045
Performance Materials amp Coatings
2029
2123
2065
Corporate
50
70
51
Total
$ 10706
$ 11882
9770
Operating EBIT by Segment
Three Months EndedDec 31 2020
Three Months Ended
In millions (Unaudited)
March 31 2021
March 31 2020
Packaging amp Specialty Plastics
$ 780
$ 1228
$ 580
Industrial Intermediates amp Infrastructure
296
326
175
Performance Materials amp Coatings
50
62
162
Corporate
(72)
(62)
(74)
Total
$ 1054
$ 1554
843
Equity in Earnings (Losses) of Nonconsolidated Affiliates by Segment
Three Months EndedDec 31 2020
Three Months Ended
In millions (Unaudited)
March 31 2021
March 31 2020
Packaging amp Specialty Plastics
$ 77
$ 106
$ 5
Industrial Intermediates amp Infrastructure
36
115
(76)
Performance Materials amp Coatings
2
2
1
Corporate
(9)
1
(19)
Total
$ 106
$ 224
(89)
Adjusted Operating EBIT by Segment
Three Months EndedDec 31 2020
Three Months Ended
In millions (Unaudited)
March 31 2021
March 31 2020
Packaging amp Specialty Plastics
$ 703
$ 1122
$ 575
Industrial Intermediates amp Infrastructure
260
211
251
Performance Materials amp Coatings
48
60
161
Corporate
(63)
(63)
(55)
Total
$ 948
$ 1330
932
Operating Margin by Segment
Three Months EndedDec 31 2020
Three Months Ended
In millions (Unaudited)
March 31 2021
March 31 2020
Packaging amp Specialty Plastics
152
202
126
Industrial Intermediates amp Infrastructure
85
90
57
Performance Materials amp Coatings
25
29
78
Total
98
131
86
Adjusted Operating EBIT Margin by Segment
Three Months EndedDec 31 2020
Three Months Ended
In millions (Unaudited)
March 31 2021
March 31 2020
Packaging amp Specialty Plastics
137
184
125
Industrial Intermediates amp Infrastructure
74
58
82
Performance Materials amp Coatings
24
28
78
Total
89
112
95
Reconciliation of Income (loss) from continuing operations net of tax to Operating EBIT and Operating EBITDA
Three Months Ended
Nine Months Ended
March 31 2020
June 30 2020
September 30 2020
December 31 2020
March 31 2021
September 30 2020
September 30 2019
In millions (Unaudited)
As Reported
Pro Forma
Income (loss) from continuing operations net of tax
$ 258
$ (217)
$ (1)
$ 1254
$ 1006
$ 1006
$ 258
+ Provision for income taxes on continuing operations
138
34
43
562
317
317
138
Income (loss) from continuing operations before income taxes
$ 396
$ (183)
$ 42
$ 1816
$ 1323
$ 1323
$ 396
- Interest income
15
6
6
11
8
8
15
+ Interest expense and amortization of debt discount
1 Operating EBIT is defined as earnings (ie Income (loss) from continuing operations before income taxes) before interest excluding the impact of significant items
2 Operating EBITDA is defined as earnings (ie Income (loss) from continuing operations before income taxes) before interest depreciation and amortization excluding the impact of significant items
Significant Items Impacting Results for the Three Months Ended Mar 31 2021
In millions except per share amounts (Unaudited)
Pretax 1
Net Income 2
EPS 3
Reported results
$ 1323
$ 991
$ 132
Less Significant items
Restructuring implementation costs
(10)
(8)
(001)
Digitalization program costs
(33)
(25)
(003)
Total significant items
$ (43)
$ (33)
$ (004)
Operating results (non-GAAP)
$ 1366
$ 1024
$ 136
Significant Items Impacting Results for the Three Months Ended Mar 31 2020
In millions except per share amounts (Unaudited)
Pretax 1
Net Income 2
EPS 3
Reported results
$ 396
$ 239
$ 032
Less Significant items
Integration and separation costs
(65)
(51)
(007)
Restructuring and asset related charges - net
(96)
(79)
(011)
Loss on early extinguishment of debt
(86)
(70)
(009)
Total significant items
$ (247)
$ (200)
$ (027)
Operating results (non-GAAP)
$ 643
$ 439
$ 059
1 Income before income taxes
2 Net income (loss) available for Dow Inc common stockholders The income tax effect on significant items was calculated based upon the enacted tax laws and statutory income tax rates applicable in the tax jurisdiction(s) of the underlying non-GAAP adjustment
1 Free cash flow is defined as Cash provided by (used for) operating activities - continuing operations less capital expenditures Under this definition free cash flow represents the cash generated by the Company from operations after investing in its asset base Free cash flow combined with cash balances and other sources of liquidity represent the cash available to fund obligations and provide returns to shareholders Free cash flow is an integral financial measure used in the Companys financial planning process
Net Sales by Segment
Three Months EndedDec 31 2020
Three Months Ended
In millions (Unaudited)
March 31 2021
March 31 2020
Packaging amp Specialty Plastics
$ 5126
$ 6082
$ 4609
Industrial Intermediates amp Infrastructure
3501
3607
3045
Performance Materials amp Coatings
2029
2123
2065
Corporate
50
70
51
Total
$ 10706
$ 11882
9770
Operating EBIT by Segment
Three Months EndedDec 31 2020
Three Months Ended
In millions (Unaudited)
March 31 2021
March 31 2020
Packaging amp Specialty Plastics
$ 780
$ 1228
$ 580
Industrial Intermediates amp Infrastructure
296
326
175
Performance Materials amp Coatings
50
62
162
Corporate
(72)
(62)
(74)
Total
$ 1054
$ 1554
843
Equity in Earnings (Losses) of Nonconsolidated Affiliates by Segment
Three Months EndedDec 31 2020
Three Months Ended
In millions (Unaudited)
March 31 2021
March 31 2020
Packaging amp Specialty Plastics
$ 77
$ 106
$ 5
Industrial Intermediates amp Infrastructure
36
115
(76)
Performance Materials amp Coatings
2
2
1
Corporate
(9)
1
(19)
Total
$ 106
$ 224
(89)
Adjusted Operating EBIT by Segment
Three Months EndedDec 31 2020
Three Months Ended
In millions (Unaudited)
March 31 2021
March 31 2020
Packaging amp Specialty Plastics
$ 703
$ 1122
$ 575
Industrial Intermediates amp Infrastructure
260
211
251
Performance Materials amp Coatings
48
60
161
Corporate
(63)
(63)
(55)
Total
$ 948
$ 1330
932
Operating Margin by Segment
Three Months EndedDec 31 2020
Three Months Ended
In millions (Unaudited)
March 31 2021
March 31 2020
Packaging amp Specialty Plastics
152
202
126
Industrial Intermediates amp Infrastructure
85
90
57
Performance Materials amp Coatings
25
29
78
Total
98
131
86
Adjusted Operating EBIT Margin by Segment
Three Months EndedDec 31 2020
Three Months Ended
In millions (Unaudited)
March 31 2021
March 31 2020
Packaging amp Specialty Plastics
137
184
125
Industrial Intermediates amp Infrastructure
74
58
82
Performance Materials amp Coatings
24
28
78
Total
89
112
95
Reconciliation of Income (loss) from continuing operations net of tax to Operating EBIT and Operating EBITDA
Three Months Ended
Nine Months Ended
March 31 2020
June 30 2020
September 30 2020
December 31 2020
March 31 2021
September 30 2020
September 30 2019
In millions (Unaudited)
As Reported
Pro Forma
Income (loss) from continuing operations net of tax
$ 258
$ (217)
$ (1)
$ 1254
$ 1006
$ 1006
$ 258
+ Provision for income taxes on continuing operations
138
34
43
562
317
317
138
Income (loss) from continuing operations before income taxes
$ 396
$ (183)
$ 42
$ 1816
$ 1323
$ 1323
$ 396
- Interest income
15
6
6
11
8
8
15
+ Interest expense and amortization of debt discount
1 Operating EBIT is defined as earnings (ie Income (loss) from continuing operations before income taxes) before interest excluding the impact of significant items
2 Operating EBITDA is defined as earnings (ie Income (loss) from continuing operations before income taxes) before interest depreciation and amortization excluding the impact of significant items
Significant Items Impacting Results for the Three Months Ended Mar 31 2021
In millions except per share amounts (Unaudited)
Pretax 1
Net Income 2
EPS 3
Reported results
$ 1323
$ 991
$ 132
Less Significant items
Restructuring implementation costs
(10)
(8)
(001)
Digitalization program costs
(33)
(25)
(003)
Total significant items
$ (43)
$ (33)
$ (004)
Operating results (non-GAAP)
$ 1366
$ 1024
$ 136
Significant Items Impacting Results for the Three Months Ended Mar 31 2020
In millions except per share amounts (Unaudited)
Pretax 1
Net Income 2
EPS 3
Reported results
$ 396
$ 239
$ 032
Less Significant items
Integration and separation costs
(65)
(51)
(007)
Restructuring and asset related charges - net
(96)
(79)
(011)
Loss on early extinguishment of debt
(86)
(70)
(009)
Total significant items
$ (247)
$ (200)
$ (027)
Operating results (non-GAAP)
$ 643
$ 439
$ 059
1 Income before income taxes
2 Net income (loss) available for Dow Inc common stockholders The income tax effect on significant items was calculated based upon the enacted tax laws and statutory income tax rates applicable in the tax jurisdiction(s) of the underlying non-GAAP adjustment
1 Free cash flow is defined as Cash provided by (used for) operating activities - continuing operations less capital expenditures Under this definition free cash flow represents the cash generated by the Company from operations after investing in its asset base Free cash flow combined with cash balances and other sources of liquidity represent the cash available to fund obligations and provide returns to shareholders Free cash flow is an integral financial measure used in the Companys financial planning process
2 Free cash flow in the first quarter of 2021 reflects a $1 billion elective pension contribution
Net Sales by Segment
Three Months EndedDec 31 2020
Three Months Ended
In millions (Unaudited)
March 31 2021
March 31 2020
Packaging amp Specialty Plastics
$ 5126
$ 6082
$ 4609
Industrial Intermediates amp Infrastructure
3501
3607
3045
Performance Materials amp Coatings
2029
2123
2065
Corporate
50
70
51
Total
$ 10706
$ 11882
9770
Operating EBIT by Segment
Three Months EndedDec 31 2020
Three Months Ended
In millions (Unaudited)
March 31 2021
March 31 2020
Packaging amp Specialty Plastics
$ 780
$ 1228
$ 580
Industrial Intermediates amp Infrastructure
296
326
175
Performance Materials amp Coatings
50
62
162
Corporate
(72)
(62)
(74)
Total
$ 1054
$ 1554
843
Equity in Earnings (Losses) of Nonconsolidated Affiliates by Segment
Three Months EndedDec 31 2020
Three Months Ended
In millions (Unaudited)
March 31 2021
March 31 2020
Packaging amp Specialty Plastics
$ 77
$ 106
$ 5
Industrial Intermediates amp Infrastructure
36
115
(76)
Performance Materials amp Coatings
2
2
1
Corporate
(9)
1
(19)
Total
$ 106
$ 224
(89)
Adjusted Operating EBIT by Segment
Three Months EndedDec 31 2020
Three Months Ended
In millions (Unaudited)
March 31 2021
March 31 2020
Packaging amp Specialty Plastics
$ 703
$ 1122
$ 575
Industrial Intermediates amp Infrastructure
260
211
251
Performance Materials amp Coatings
48
60
161
Corporate
(63)
(63)
(55)
Total
$ 948
$ 1330
932
Operating Margin by Segment
Three Months EndedDec 31 2020
Three Months Ended
In millions (Unaudited)
March 31 2021
March 31 2020
Packaging amp Specialty Plastics
152
202
126
Industrial Intermediates amp Infrastructure
85
90
57
Performance Materials amp Coatings
25
29
78
Total
98
131
86
Adjusted Operating EBIT Margin by Segment
Three Months EndedDec 31 2020
Three Months Ended
In millions (Unaudited)
March 31 2021
March 31 2020
Packaging amp Specialty Plastics
137
184
125
Industrial Intermediates amp Infrastructure
74
58
82
Performance Materials amp Coatings
24
28
78
Total
89
112
95
Reconciliation of Net income (loss) to Operating EBIT and Operating EBITDA
Three Months Ended
Nine Months Ended
March 31 2020
June 30 2020
September 30 2020
December 31 2020
March 31 2021
September 30 2020
September 30 2019
In millions (Unaudited)
As Reported
Pro Forma
Net income (loss)
$ 258
$ (217)
$ (1)
$ 1254
$ 1006
$ 1006
$ 258
+ Provision for income taxes
138
34
43
562
317
317
138
Income (loss) before income taxes
$ 396
$ (183)
$ 42
$ 1816
$ 1323
$ 1323
$ 396
- Interest income
15
6
6
11
8
8
15
+ Interest expense and amortization of debt discount
1 Operating EBIT is defined as earnings (ie Income (loss) before income taxes) before interest excluding the impact of significant items
2 Operating EBITDA is defined as earnings (ie Income (loss) before income taxes) before interest depreciation and amortization excluding the impact of significant items
Significant Items Impacting Results for the Three Months Ended Mar 31 2021
In millions except per share amounts (Unaudited)
Pretax 1
Net Income 2
EPS 3
Reported results
$ 1323
$ 991
$ 132
Less Significant items
Restructuring implementation costs
(10)
(8)
(001)
Digitalization program costs
(33)
(25)
(003)
Total significant items
$ (43)
$ (33)
$ (004)
Operating results (non-GAAP)
$ 1366
$ 1024
$ 136
Significant Items Impacting Results for the Three Months Ended Mar 31 2020
In millions except per share amounts (Unaudited)
Pretax 1
Net Income 2
EPS 3
Reported results
$ 396
$ 239
$ 032
Less Significant items
Integration and separation costs
(65)
(51)
(007)
Restructuring and asset related charges - net
(96)
(79)
(011)
Loss on early extinguishment of debt
(86)
(70)
(009)
Total significant items
$ (247)
$ (200)
$ (027)
Operating results (non-GAAP)
$ 643
$ 439
$ 059
1 Income before income taxes
2 Net income available for Dow Inc common stockholders The income tax effect on significant items was calculated based upon the enacted tax laws and statutory income tax rates applicable in the tax jurisdiction(s) of the underlying non-GAAP adjustment
1 Free cash flow is defined as Cash provided by (used for) operating activities - continuing operations less capital expenditures Under this definition free cash flow represents the cash generated by the Company from operations after investing in its asset base Free cash flow combined with cash balances and other sources of liquidity represent the cash available to fund obligations and provide returns to shareholders Free cash flow is an integral financial measure used in the Companys financial planning process
Net Sales by Segment
Three Months EndedDec 31 2020
Three Months Ended
In millions (Unaudited)
March 31 2021
March 31 2020
Packaging amp Specialty Plastics
$ 5126
$ 6082
$ 4609
Industrial Intermediates amp Infrastructure
3501
3607
3045
Performance Materials amp Coatings
2029
2123
2065
Corporate
50
70
51
Total
$ 10706
$ 11882
9770
Operating EBIT by Segment
Three Months EndedDec 31 2020
Three Months Ended
In millions (Unaudited)
March 31 2021
March 31 2020
Packaging amp Specialty Plastics
$ 780
$ 1228
$ 580
Industrial Intermediates amp Infrastructure
296
326
175
Performance Materials amp Coatings
50
62
162
Corporate
(72)
(62)
(74)
Total
$ 1054
$ 1554
843
Equity in Earnings (Losses) of Nonconsolidated Affiliates by Segment
Three Months EndedDec 31 2020
Three Months Ended
In millions (Unaudited)
March 31 2021
March 31 2020
Packaging amp Specialty Plastics
$ 77
$ 106
$ 5
Industrial Intermediates amp Infrastructure
36
115
(76)
Performance Materials amp Coatings
2
2
1
Corporate
(9)
1
(19)
Total
$ 106
$ 224
(89)
Adjusted Operating EBIT by Segment
Three Months EndedDec 31 2020
Three Months Ended
In millions (Unaudited)
March 31 2021
March 31 2020
Packaging amp Specialty Plastics
$ 703
$ 1122
$ 575
Industrial Intermediates amp Infrastructure
260
211
251
Performance Materials amp Coatings
48
60
161
Corporate
(63)
(63)
(55)
Total
$ 948
$ 1330
932
Operating Margin by Segment
Three Months EndedDec 31 2020
Three Months Ended
In millions (Unaudited)
March 31 2021
March 31 2020
Packaging amp Specialty Plastics
152
202
126
Industrial Intermediates amp Infrastructure
85
90
57
Performance Materials amp Coatings
25
29
78
Total
98
131
86
Adjusted Operating EBIT Margin by Segment
Three Months EndedDec 31 2020
Three Months Ended
In millions (Unaudited)
March 31 2021
March 31 2020
Packaging amp Specialty Plastics
137
184
125
Industrial Intermediates amp Infrastructure
74
58
82
Performance Materials amp Coatings
24
28
78
Total
89
112
95
Reconciliation of Income (loss) from continuing operations net of tax to Operating EBIT and Operating EBITDA
Three Months Ended
Nine Months Ended
March 31 2020
June 30 2020
September 30 2020
December 31 2020
March 31 2021
September 30 2020
September 30 2019
In millions (Unaudited)
As Reported
Pro Forma
Income (loss) from continuing operations net of tax
$ 258
$ (217)
$ (1)
$ 1254
$ 1006
$ 1006
$ 258
+ Provision for income taxes on continuing operations
138
34
43
562
317
317
138
Income (loss) from continuing operations before income taxes
$ 396
$ (183)
$ 42
$ 1816
$ 1323
$ 1323
$ 396
- Interest income
15
6
6
11
8
8
15
+ Interest expense and amortization of debt discount
1 Operating EBIT is defined as earnings (ie Income (loss) from continuing operations before income taxes) before interest excluding the impact of significant items
2 Operating EBITDA is defined as earnings (ie Income (loss) from continuing operations before income taxes) before interest depreciation and amortization excluding the impact of significant items
Significant Items Impacting Results for the Three Months Ended Mar 31 2021
In millions except per share amounts (Unaudited)
Pretax 1
Net Income 2
EPS 3
Reported results
$ 1323
$ 991
$ 132
Less Significant items
Restructuring implementation costs
(10)
(8)
(001)
Digitalization program costs
(33)
(25)
(003)
Total significant items
$ (43)
$ (33)
$ (004)
Operating results (non-GAAP)
$ 1366
$ 1024
$ 136
Significant Items Impacting Results for the Three Months Ended Mar 31 2020
In millions except per share amounts (Unaudited)
Pretax 1
Net Income 2
EPS 3
Reported results
$ 396
$ 239
$ 032
Less Significant items
Integration and separation costs
(65)
(51)
(007)
Restructuring and asset related charges - net
(96)
(79)
(011)
Loss on early extinguishment of debt
(86)
(70)
(009)
Total significant items
$ (247)
$ (200)
$ (027)
Operating results (non-GAAP)
$ 643
$ 439
$ 059
1 Income before income taxes
2 Net income available for Dow Inc common stockholders The income tax effect on significant items was calculated based upon the enacted tax laws and statutory income tax rates applicable in the tax jurisdiction(s) of the underlying non-GAAP adjustment
3 Earnings per common share - diluted
0
300
600
900
1200
2020 2022 2024 2026 2028 2030
MM
Mill
ion
Tonn
es Mechanical Recycling OtherPartnershipsAdvanced Recycling
PLASTIC CIRCULARITY ROADMAP DRIVES NEAR- AND LONG-TERM GROWTH
Through innovation collaboration and partnerships Dow is leading the way for sustainability in plastics
By 2030 Dow will STOP THE WASTE by enabling 1 million metric tons of plastic to be collected reused or recycled through its direct actions and partnerships
By 2035 Dow will CLOSE THE LOOP by enabling 100 of Dow products sold into packaging applications to be reusable or recyclable
1MM mta Target Plastic collected reused recycled
80
90
100
2020 2025 2030 2035
P
rodu
cts S
old Advanced Recycling
Application Development
100 Target Packaging products reusable or recyclable
Collaborating to drive innovation
and action
Integrating recycled and bio-based
feedstocks
Demonstrating innovative applications
for recycled plastics
Helping customers design for
recyclability
Innovating new products with post-consumer material
Dow is uniquely advantaged by a broad and differentiated portfolio to capture favorable industry supply-demand dynamics
Consumer spending drives ~1-15x GDP demand growth for Industrial Solutions and Polyurethanes
Renewables amp energy efficiency are key growth drivers
Incremental investments in US Gulf Coast Europe and China expect ~$200MMyear EBITDA run-rate
Broad participation in industrial and infrastructure end markets support long-term growth
High value end markets growing ~15-2x GDP upstream capacity availability enables high-value derivative growth
Rapid adoption of EV 5G Cloud Computing drives demand for innovation products
Lower-cost higher-return expansions expected to enable downstream growth of gt$350MMyear EBITDA run-rate
Infrastructure plan COVID-19 recovery expansion benefits
Incremental investments keep pace with ~13-15x GDP demand growth
Continue product mix upgrade to higher return end markets and applications
Canada cracker expansion and debottlenecking PE capacity expect ~$400MMyear EBITDA run-rate
Functional Polymers for infrastructure automotive and photovoltaics delivers outperformance vs peers
0
10
20
30
40
50
60
70
80
90
100
2022E 2023E 2024E 2025E 2026E0
4000
8000
12000
16000
0
10
20
30
40
50
60
70
80
90
100
2022E 2023E 2024E 2025E 2026E0
1000
2000
3000
4000
5000
6000
lsquo000 MTs lsquo000 MTs lsquo000 MTs
Polyethylene MDI Siloxane
30
40
50
60
70
80
90
100
2022E 2023E 2024E 2025E 2026E0
50000
100000
150000
200000
250000
Constructive near-term supply-demand balances Further tightening with expected capacity delays cancellations and typical outages
Adjusted Operating Rate s include typical industry planned outages and delayedcancelled new capacity additions based on historical averages
IHS SAGSI and other company annual reports and disclosuresIndustry consultant views use industry nameplate capacity and include all announced capacity additionsNote Industry operating rate estimates are based on views as of April 2021 and subject to change
1Q 2021 FINANCIAL HIGHLIGHTS
YoY Operating EPS Reconciliation Key Drivers in the Quarter YoYbull Pricing momentum across all segments and
regions led by polyethylene and polyurethane applications
bull Resilient demand in packaging and demand growth in construction mobility electronics and consumer durables end markets
bull Improved equity earnings led by Sadara and the Kuwait joint ventures
bull Lower tax rate on earnings recovery and geographic mix
bull Lower DampA and interest expense offset share count increase
bull Increased turnaround spending on delays from 2020 due to impacts of the pandemic
bull Impact of supply constraints and repair expenses related to Winter Storm Uri on the US Gulf Coast
Financial Summary($ millions unless otherwise noted)
Operating EBITDA $2271 $1567 $704 $1780 $491Earnings per share ndash GAAP $132 $032 $100 $165 $(033)Operating earnings per share $136 $059 $077 $081 $055Cash Provided by (Used for) Op Activities ndashCont Ops1
Op EBITDA to CFFO (Cash Flow Conversion1 )
$(228)(10)
$123679
$(1464) $165693
$(1884)
$059
$136
1Q20 MarginExpansion
Winter Storm Uri Turnarounds Tax Rate Equity Earnings 1Q21
111 Cash Provided by (Used for) Operating Activities ndash Continuing Operations and Cash Flow Conversion include a $1 billion elective pension contribution in the first quarter of 2021
PRINCIPAL JOINT VENTURE DETAIL
1Q 2021 1Q 2020 4Q 2020
$ millions (unaudited)Sadara
KuwaitJVs
ThaiJVs Sadara
KuwaitJVs
ThaiJVs Sadara
KuwaitJVs
ThaiJVs
EBITDA $163 $183 $52 $9 $110 $4 $137 $152 $28
EBIT $106 $144 $44 $(78) $65 $(6) $34 $104 $19
Net IncomeEquity Earnings (Losses) to Dow $55 $119 $34 $(116) $40 $(9) $3 $86 $15
EBITDA in Excess of Eq Earnings $108 $64 $18 $125 $70 $13 $134 $66 $13
Dowrsquos Proportional Share of Principal JV Financial Results
Kuwait JVs Margin expansion from price increases in MEG
Thai JVs Polyethylene margin expansion
Sadara Margin expansion in polyurethane and polyethylene applications
Drivers of YoY and PQ Changes
12Note 4Q2020 values were revised to reflect audited JV financial statements for Sadara
Dow FY20 Benchmarking Update
14
BENCHMARKING PEERS
Benchmarking conducted against segment level peers if sufficient information disclosed otherwise corporate level
15
TOTAL DOW BENCHMARKING SUMMARY OF OBSERVATIONS
Benchmarking Strengths amp Gaps
TotalDow
FY20 YoY Adj Op EBITDA growth trailed the peer median as resilient demand for packaging applications and recovery in durable good end markets was more than offset by upstream pricing pressures in siloxanes and acrylic monomers along with lower relative participation for polyurethanes in Asia which experienced a shorter COVID-19 downturn
In-Flight Actions Implement faster payback higher ROIC expansions reduce merchant positions of intermediatesbull Expansion of FS-1 cracker is underway (+65KTA) that will feed downstream derivative PE demandbull South China Specialties Hub (~250KTA) specialty PU and alkoxylates to participate in Asia growth bull Downstream silicones expansions (~15 projects in 2021) to reduce merchant siloxane intermediates exposure
FY20 Adj Op EBITDA margin remained resilient and among the best in the peer group through the economic downturn and recovery from COVID-19
Cash Flow Conversion among highest in the peer group from a disciplined focus on cash generation and structural working capital efficiency gains
SGampA + RampD as of sales remained among best in peer group from continued cost discipline
Best-in-class Free Cash Flow yield above sector and market averages
Net debt reduced more than peers on strong cash generation and focused capital allocation priorities
Source Dow data CapitalIQ Company ReleasesUnless otherwise noted all 2018 and 2019 financial information for Dow is on a pro forma basisAdjusted Operating EBITDA is defined as Operating EBITDA excluding equity earnings
Adj Op EBITDA Margin excludes transactions with certain nonconsolidated affiliates Cash Flow Conversion is defined as Cash from Continuing Operations divided by Operating EBITDAFree Cash Flow is defined as Cash from Continuing Operations less Capital Expenditures
16
TOTAL DOW
(1) Adjusted Operating EBITDA is defined as Operating EBITDA excluding equity earnings Adj Op EBITDA Margin excludes transactions with certain nonconsolidated affiliates
(2) Benchmarking peer set range includes Arkema BASF Covestro Eastman Huntsman Lyondell Wacker(3) Cash Flow Conversion is defined as Cash From Continuing Operations divided by Operating EBITDA(4) Median excludes Dow
Adj Op EBITDA Growth
Adj Op EBITDA Margin Cash Flow Conversion SGampA + RampD
(as a of Sales)FY20 vs FY19
FY20
Median Excl Dow
Median Excl Dow
BENCHMARKING SNAPSHOT (1234)
FY20 UPDATE amp FY19
FY19
-60
-50
-40
-30
-20
-10
0
10
FY19 vs FY18
FY20 FY19 FY20 FY19
Median Excl Dow
Median Excl Dow
5
10
15
20
25
Median Excl Dow
Median Excl Dow
30
50
70
90
110
130
150
Median Excl Dow Median
Excl Dow
0
5
10
15
20
25
Median Excl Dow
Median Excl Dow
Source Dow data CapitalIQ Company disclosures
Unless otherwise noted all 2018 and 2019 financial information for Dow is on a pro forma basisFor further unaudited pro forma financial information refer to the Companyrsquos Current Report on Form 8-K dated June 3 2019 and 4Q20 Earnings materials included in the Current Report on Form 8-K dated January 28 2021
bull Hallmark safety performance and operational excellence
bull Focused portfolio with market leading positions in key value chains
bull Consumer tilted portfolio in growing end-market verticals
bull Global footprint with integrated value chains that provide differentiated product offerings
CORE STRENGTHSbull Maintain focus on cash
generation and low-cost curve position
bull Continued disciplined capital allocation
bull Use innovation pipeline to collaborate with customers and capture growth trends
bull Invest in incremental higher return faster payback growth opportunities
bull Deliver sustainable future through Industry leading ESG position
Average Annual Free Cash Flow (2019-2020)as of 2020 Market Cap
17
TOP-QUARTILE CASH REMUNERATION YIELD AND DEBT REDUCTION
Median Excl Dow
~84
Median Excl Dow
+02B
Median Excl Dow
~6
Median Excl Dow
~3
(1) Benchmarking peer set range includes Arkema BASF Covestro Eastman Huntsman Lyondell Wacker(2) Source Dow data FactSet and Company Releases for Peers(3) Dow Market Capitalization as of YE2020 was ~$412B
Unless otherwise noted all 2018 and 2019 financial information for Dow is on a pro forma basisFor further unaudited pro forma financial information refer to the Companyrsquos Current Report on Form 8-K dated June 3 2019 and 4Q20 Earnings materials included in the Current Report on Form 8-K dated January 28 2021
18
CULTURE OF BENCHMARKING SUMMARY OF OBSERVATIONS
Segment FY20 Benchmarking Strengths amp Gaps
PampSP
FY20 YoY Adj Op EBITDA growth tracked the peer median as peers with more exposure to naphtha rebounded from a lower 2019 performance from cost pressures
FY20 Adj Op EBITDA margin more resilient than most peers Op EBITDA per pound polyolefin capacity ahead of peers advantage continues to widen Free Cash Conversion continued to improve and is best-in-class among the peer set SGampA + RampD as of sales remained among lowest in the peer group
IIampI
FY20 YoY Adj Op EBITDA growth and Adj Op EBITDA margin trailed the peer median as strengthening durable good end-markets in 2H20 were offset by decisive actions taken earlier in 1H20 to match production to demand as well as lower relative participation in Asia which experienced a shorter COVID-19 demand downturn
Free Cash Conversion is best-in-class among the peer set SGampA + RampD as of sales remained among lowest in the peer group
PMampC
FY20 YoY Adj Op EBITDA growth trailed the peer median due to greater exposure to siloxanes and acrylic monomers that were more heavily impacted by demand downturn and competitive pricing actions
FY20 Adj Op EBITDA margin trailed the peer median as strong demand for home care and DIY coatings was more than offset by personal care and automotive applications that lagged broader recovery
Free Cash Conversion among highest in the peer group SGampA + RampD as of sales best-in-class expanded advantage vs next closest peer
Source Dow data CapitalIQ Company ReleasesAdjusted Operating EBITDA is defined as Operating EBITDA excluding equity earnings Adj Op EBITDA Margin excludes transactions with certain nonconsolidated affiliatesFree Cash Conversion for Dow is defined as Adj Op EBITDA less Capex divided by Adj Op EBITDA
Unless otherwise noted all 2018 and 2019 financial information for Dow is on a pro forma basisFor further unaudited pro forma financial information refer to the Companyrsquos Current Report on Form 8-K dated June 3 2019 and 4Q20 Earnings materials included in the Current Report on Form 8-K dated January 28 2021
19
PACKAGING amp SPECIALTY PLASTICS
Adj Op EBITDA Growth(7)
Adj Op EBITDA Margin Free Cash Conversion SGampA + RampD
(as a of Sales)bull World-class packaging
franchise
bull Most flexible feedstock capability in the industry
bull Flexible polyolefins assets
bull Proprietary catalyst and process technology
bull Differentiated co-monomer capability
bull Global low-cost footprint
bull Maintain focus on cash conversion and cost discipline
bull Leverage differentiated product offerings and innovation pipeline to meet growing demand
bull Accelerate sell-up opportunities of higher margin product mix
bull Incremental quick payback investments and capacity expansions
bull Plastics circularity energy intensity CO2 footprint
CORE STRENGTHS FOCUS AREASFY20 vs FY19
FY20
Median Excl Dow
Median Excl Dow
FY19
-80
-60
-40
-20
0
20
40
FY19 vs FY18
FY20 FY19 FY20 FY19
Median Excl Dow
Median Excl Dow
5
10
15
20
25
Median Excl Dow
Median Excl Dow
0
20
40
60
80
Median Excl Dow
Median Excl Dow
0
5
10
15
Median Excl Dow
Median Excl Dow
Source Dow data CapitalIQ Company disclosures
(1) Adjusted Operating EBITDA is defined as Operating EBITDA excluding equity earningsAdj Op EBITDA Margin excludes transactions with certain nonconsolidated affiliates
(2) Benchmarking peer set range includes LyondellBasell Olefins amp Polyolefins Chevron Phillip Chemical Borealis Polyolefins ExxonMobil Chemicals (entire segment)
(3) Free Cash Conversion for Dow is defined as Adj Op EBITDA less Capex divided by Adj Op EBITDA(4) Median excludes Dow(5) SGampA + RampD reflects corporate level for peers where segment level data is unavailable
BENCHMARKING SNAPSHOT (123456)
FY20 UPDATE amp FY19
(6) CPChem results are as of 3Q20 TTM(7) Adj Op EBITDA Growth chart capped for visual purposes top peer was ~90
Unless otherwise noted all 2018 and 2019 financial information for Dow is on a pro forma basisFor further unaudited pro forma financial information refer to the Companyrsquos Current Report on Form 8-K dated June 3 2019 and 4Q20 Earnings materials included in the Current Report on Form 8-K dated January 28 2021
bull Full feedstock-to-polymer integration continues to deliver enhanced value
(1) Segment Op EBITDA based on FY20 reported figures including equity income from affiliatesJVs Capacity based on latest company reported nameplate for PE and PP (2019 for Dow 2020 10-K for Lyondell) including share of JVs or ICIS reported capacity for 2019 including share of JVs if not available (Borealis)
(2) Borealis Polyolefins EBITDA adjusted for equity earnings from JVsUnless otherwise noted all 2018 and 2019 financial information for Dow is on a pro forma basisFor further unaudited pro forma financial information refer to the Companyrsquos Current Report on Form 8-K dated June 3 2019 and 4Q20 Earnings materials included in the Current Report on Form 8-K dated January 28 2021
21
INDUSTRIAL INTERMEDIATES amp INFRASTRUCTURE
bull Top global producer of key raw materials (EO PO)
bull Flexible manufacturing model through integration
bull Top 3 PU Systems House business
bull Industrial Solutions contains products with some of the highest returns to ethylene
bull Maintain focus on cash conversion and cost discipline
bull Drive PU mix towards higher margin Perf Polyols amp Systems
bull Implement faster payback higher ROIC expansions (China Specialties hub differentiated PU applications and DIS alkoxylates)
FOCUS AREASAdj Op EBITDA Growth
Adj Op EBITDA Margin Free Cash Conversion SGampA + RampD
(as a of Sales)
Median Excl Dow
Median Excl Dow Median
Excl Dow
Median Excl Dow
CORE STRENGTHS
Source Dow data CapitalIQ Company disclosures
FY20 vs FY19 FY20 FY19
FY19 vs FY18 FY20 FY19 FY20 FY19
-60
-40
-20
0
20
Median Excl Dow
Median Excl Dow
0
5
10
15
20
25
Median Excl Dow
Median Excl Dow
-10
10
30
50
70
90
Median Excl Dow Median
Excl Dow
0
5
10
15
20
Median Excl Dow Median
Excl Dow
(1) Adjusted Operating EBITDA is defined as Operating EBITDA excluding equity earnings Adj Op EBITDA Margin excludes transactions with certain nonconsolidated affiliates
(2) Benchmarking peer set range includes Eastman Huntsman Covestro LyondellBasell Intermediates amp Derivatives segment(3) Free Cash Conversion for Dow is defined as Adj Op EBITDA less Capex divided by Adj Op EBITDA(4) Median excludes Dow(5) SGampA + RampD reflects corporate level for peers where segment level data is unavailable
BENCHMARKING SNAPSHOT (12345)
FY20 UPDATE amp FY19
Unless otherwise noted all 2018 and 2019 financial information for Dow is on a pro forma basisFor further unaudited pro forma financial information refer to the Companyrsquos Current Report on Form 8-K dated June 3 2019 and 4Q20 Earnings materials included in the Current Report on Form 8-K dated January 28 2021
22
PERFORMANCE MATERIALS amp COATINGS
Adj Op EBITDA Growth
Adj Op EBITDA Margin
SGampA + RampD (as a of Sales) FOCUS AREAS
bull Maintain focus on cash conversion and cost discipline
bull Accelerate organic growth and explore bolt-on inorganic growth
bull Innovate with customers on sustainable solutions
bull Improve acrylic monomer and siloxane margins drive more captive use
bull Grow industrial coatings in prioritized end markets
bull World-class silicones franchise
bull Lowest cost siloxanes producer
bull Leading coatings solutions provider
bull World-scale acrylic monomer assets
bull One of the largest B2B digital platforms
bull Unique hybrid chemistry opportunities
bull Leading SGampA and RampD efficiency
Free Cash Conversion
Median Excl Dow
Median Excl Dow
Median Excl Dow
CORE STRENGTHSFY20 vs FY19 FY20 FY19
FY19 vs FY18 FY20 FY19 FY20 FY19
-40
-30
-20
-10
0
10
Median Excl Dow
Median Excl Dow
5
10
15
20
25
30
35
Median Excl Dow Median
Excl Dow
40
50
60
70
80
Median Excl Dow
Median Excl Dow
5
10
15
20
Median Excl Dow
Median Excl Dow
Source Dow data CapitalIQ Company disclosures
(1) Adjusted Operating EBITDA is defined as Operating EBITDA excluding equity earnings Adj Op EBITDA Margin excludes transactions with certain nonconsolidated affiliates
(2) Benchmarking peer set range includes Celanese Acetyl Chain Wacker Silicones segment Shin-Etsu Silicones segment Arkema Covestro Coatings segment
(3) Free Cash Conversion for Dow is defined as Adj Op EBITDA less Capex divided by Adj Op EBITDA(4) Median excludes Dow(5) SGampA + RampD reflects corporate level for peers where segment level data is unavailable
BENCHMARKING SNAPSHOT (1234)
FY20 UPDATE amp FY19
Unless otherwise noted all 2018 and 2019 financial information for Dow is on a pro forma basisFor further unaudited pro forma financial information refer to the Companyrsquos Current Report on Form 8-K dated June 3 2019 and 4Q20 Earnings materials included in the Current Report on Form 8-K dated January 28 2021
Appendix
OPERATING EARNINGS PER SHARE (EPS) RECONCILIATION
24
In millions except per share amounts (Unaudited) Pretax 1 Net Income 2 EPS 3
Significant Items Impacting Results for the Three Months Ended Mar 31 2021
Significant Items Impacting Results for the Three Months Ended Mar 31 2020
2 Net income available for Dow Inc common stockholders The income tax effect on signif icant items w as calculated based upon the enacted tax law s and statutory income tax rates applicable in the tax jurisdiction(s) of the underlying non-GAAP adjustment
1 Income before income taxes
3 Earnings per common share - diluted
Non-GAAP - Sig Items
DOW CONFIDENTIAL - Do not share without permission
Non-GAAP - EBITDA Recon
DOW CONFIDENTIAL - Do not share without permission
Non-GAAP - Segment Info
DOW CONFIDENTIAL - Do not share without permission
Non-GAAP - Cash Flow Measures
DOW CONFIDENTIAL - Do not share without permission
Non-GAAP - Net Debt
DOW CONFIDENTIAL - Do not share without permission
RECONCILIATION OF NET INCOME (LOSS) TO OPERATING EBIT amp OPERATING EBITDA
25
In millions (Unaudited)
Net income (loss) $ 258 $ (217) $ (1) $ 1254 $ 1006 + Provision for income taxes 138 34 43 562 317Income (loss) before income taxes $ 396 $ (183) $ 42 $ 1816 $ 1323 - Interest income 15 6 6 11 8+ Interest expense and amortization of debt discount 215 200 202 210 196- Significant items (247) (46) (523) 961 (43)Operating EBIT 1 $ 843 $ 57 $ 761 $ 1054 $ 1554 + Depreciation and amortization 724 700 724 726 717Operating EBITDA 2 $ 1567 $ 757 $ 1485 $ 1780 $ 2271 Operating EBITDA - Trailing Twelve Months (TTM) basis $ 6971 $ 5926 $ 5555 $ 5589 $ 6293 1 Operating EBIT is defined as earnings (ie Income (loss) before income taxes) before interest excluding the impact of signif icant items2 Operating EBITDA is defined as earnings (ie Income (loss) before income taxes) before interest depreciation and amortization excluding the impact of signif icant items
Reconciliation of Net income (loss) to Operating EBIT and Operating EBITDA
March 31 2020
Three Months Ended
September 30 2020June 30 2020 March 31 2021December 31 2020
Non-GAAP - Sig Items
DOW CONFIDENTIAL - Do not share without permission
Non-GAAP - EBITDA Recon
DOW CONFIDENTIAL - Do not share without permission
Non-GAAP - Segment Info
DOW CONFIDENTIAL - Do not share without permission
Non-GAAP - Cash Flow Measures
DOW CONFIDENTIAL - Do not share without permission
Non-GAAP - Net Debt
DOW CONFIDENTIAL - Do not share without permission
SEGMENT INFORMATION
26
Net Sales by Segment
In millions (Unaudited) March 31 2021 March 31 2020
2 Free cash f low in the f irst quarter of 2021 reflects a $1 billion elective pension contribution
Three Months Ended
1 Cash f low conversion is defined as Cash provided by (used for) operating activities - continuing operations divided by Operating EBITDA
Three Months Ended
1 Free cash f low is defined as Cash provided by (used for) operating activities - continuing operations less capital expenditures Under this definition free cash f low represents the cash generated by the Company from operations after investing in its asset base Free cash f low combined w ith cash balances and other sources of liquidity represent the cash available to fund obligations and provide returns to shareholders Free cash f low is an integral f inancial measure used in the Companys f inancial planning process
2 Cash f low conversion in the f irst quarter of 2021 reflects a $1 billion elective pension contribution
Non-GAAP - Sig Items
DOW CONFIDENTIAL - Do not share without permission
Non-GAAP - EBITDA Recon
DOW CONFIDENTIAL - Do not share without permission
Non-GAAP - Segment Info
DOW CONFIDENTIAL - Do not share without permission
Non-GAAP - Cash Flow Measures
DOW CONFIDENTIAL - Do not share without permission
Non-GAAP - Net Debt
DOW CONFIDENTIAL - Do not share without permission
RECONCILIATION OF NET DEBT
29
Reconciliation of Net Debt
In millions (Unaudited)Notes payable $ 152 $ 156 Long-term debt due within one year 492 460Long-term debt 16200 16491
DOW CONFIDENTIAL - Do not share without permission
Non-GAAP - EBITDA Recon
DOW CONFIDENTIAL - Do not share without permission
Non-GAAP - Segment Info
DOW CONFIDENTIAL - Do not share without permission
Non-GAAP - Cash Flow Measures
DOW CONFIDENTIAL - Do not share without permission
Non-GAAP - Net Debt
DOW CONFIDENTIAL - Do not share without permission
Background On April 1 2019 DowDuPont completed the separation of its materials science business and Dow Inc became the direct parent company of TDCC owning all of the outstanding common shares of TDCC For filings related to the period commencing April 1 2019 and thereafter TDCC was deemed the predecessor to Dow Inc and the historical results of TDCC are deemed the historical results of Dow Inc for periods prior to and including March 31 2019
The separation was contemplated by the merger of equals transaction effective August 31 2017 under the Agreement and Plan of Merger dated as of December 11 2015 as amended on March 31 2017 TDCC and Historical DuPont each merged with subsidiaries of DowDuPont and as a result TDCC and Historical DuPont became subsidiaries of DowDuPont (the ldquoMergerrdquo) Subsequent to the Merger TDCC and Historical DuPont engaged in a series of internal reorganization and realignment steps to realign their businesses into three subgroups agriculture materials science and specialty products Dow Inc was formed as a wholly owned subsidiary of DowDuPont to serve as the holding company for the materials science business
Unaudited Pro Forma Financial InformationIn order to provide the most meaningful comparison of results of operations and results by segment supplemental unaudited pro forma financial information has been included in the following financial schedules The unaudited pro forma financial information is based on the consolidated financial statements of TDCC adjusted to give effect to the separation from DowDuPont as if it had been consummated on January 1 2017 For the twelve months ended December 31 2019 and 2018 pro forma adjustments have been made for (1) the margin impact of various manufacturing supply and service related agreements entered into with DuPont and Corteva in connection with the separation which provide for different pricing than the historical intercompany and intracompany pricing practices of TDCC and Historical DuPont and (2) the elimination of the impact of events directly attributable to the Merger internal reorganization and business realignment separation distribution and other related transactions (eg one-time transaction costs)
The unaudited pro forma financial information has been presented for informational purposes only and is not necessarily indicative of what Dows results of operations actually would have been had the separation from DowDuPont been completed as of January 1 2017 nor is it indicative of the future operating results of Dow The unaudited pro forma information does not reflect restructuring or integration activities or other costs following the separation from DowDuPont that may be incurred to achieve cost or growth synergies of Dow For further information on the unaudited pro forma financial information please refer to the Companys Current Report on Form 8-K dated June 3 2019
General CommentsUnless otherwise specified all financial measures in this presentation where applicable exclude significant items
GENERAL COMMENTS
30
SAFE HARBORCautionary Statement about Forward-Looking Statements
This presentation contains ldquoforward-looking statementsrdquo within the meaning of the federal securities laws including Section 27A of the Securities Act of 1933 as amended and Section 21E of the Securities Exchange Act of 1934 as amended Such statements often address expected future business and financial performance financial condition and other matters and often contain words or phrases such as ldquoanticipaterdquo ldquobelieverdquo ldquoestimaterdquo ldquoexpectrdquo ldquointendrdquo ldquomayrdquo ldquoopportunityrdquo ldquooutlookrdquo ldquoplanrdquo ldquoprojectrdquo ldquoseekrdquo ldquoshouldrdquo ldquostrategyrdquo ldquotargetrdquo ldquowillrdquo ldquowill berdquo ldquowill continuerdquo ldquowill likely resultrdquo ldquowouldrdquo and similar expressions and variations or negatives of these words or phrases
Forward-looking statements are based on current assumptions and expectations of future events that are subject to risks uncertainties and other factors that are beyond Dowrsquos control which may cause actual results to differ materially from those projected anticipated or implied in the forward-looking statements and speak only as of the date the statements were made These factors include but are not limited to sales of Dowrsquos products Dowrsquos expenses future revenues and profitability the continuing global and regional economic impacts of the coronavirus disease 2019 (ldquoCOVID-19rdquo) pandemic and other public health-related risks and events on Dowrsquos business capital requirements and need for and availability of financing size of the markets for Dowrsquos products and services and ability to compete in such markets failure to develop and market new products and optimally manage product life cycles the rate and degree of market acceptance of Dowrsquos products significant litigation and environmental matters and related contingencies and unexpected expenses the success of competing technologies that are or may become available the ability to protect Dowrsquos intellectual property in the United States and abroad developments related to contemplated restructuring activities and proposed divestitures or acquisitions such as workforce reduction manufacturing facility andor asset closure and related exit and disposal activities and the benefits and costs associated with each of the foregoing fluctuations in energy and raw material prices management of process safety and product stewardship changes in relationships with Dowrsquos significant customers and suppliers changes in consumer preferences and demand changes in laws and regulations political conditions or industry development global economic and capital markets conditions such as inflation market uncertainty interest and currency exchange rates and equity and commodity prices business or supply disruptions security threats such as acts of sabotage terrorism or war weather events and natural disasters and disruptions in Dowrsquos information technology networks and systems
Risks related to Dowrsquos separation from DowDuPont Inc include but are not limited to (i) Dowrsquos inability to achieve some or all of the benefits that it expects to receive from the separation from DowDuPont Inc (ii) certain tax risks associated with the separation (iii) the failure of Dowrsquos pro forma financial information to be a reliable indicator of Dowrsquos future results (iv) non-compete restrictions under the separation agreement (v) receipt of less favorable terms in the commercial agreements Dow entered into with DuPont and Corteva Inc (ldquoCortevardquo) including restrictions under intellectual property cross-license agreements than Dow would have received from an unaffiliated third party and (vi) Dowrsquos obligation to indemnify DuPont andor Corteva for certain liabilities
Where in any forward-looking statement an expectation or belief as to future results or events is expressed such expectation or belief is based on the current plans and expectations of management and expressed in good faith and believed to have a reasonable basis but there can be no assurance that the expectation or belief will result or be achieved or accomplished A detailed discussion of principal risks and uncertainties which may cause actual results and events to differ materially from such forward-looking statements is included in the section titled ldquoRisk Factorsrdquo contained in the Companyrsquos Annual Report on Form 10-K for the year ended December 31 2020 These are not the only risks and uncertainties that Dow faces There may be other risks and uncertainties that Dow is unable to identify at this time or that Dow does not currently expect to have a material impact on its business If any of those risks or uncertainties develops into an actual event it could have a material adverse effect on Dowrsquos business Dow assumes no obligation to update or revise publicly any forward-looking statements whether because of new information future events or otherwise except as required by securities and other applicable laws
31
Non-GAAP Financial MeasuresThis presentation includes information that does not conform to US GAAP and are considered non-GAAP measures Management uses these measures internally for planning forecasting and evaluating the performance of the Companys segments including allocating resources Dows management believes that these non-GAAP measures best reflect the ongoing performance of the Company during the periods presented and provide more relevant and meaningful information to investors as they provide insight with respect to ongoing operating results of the Company and a more useful comparison of year-over-year results These non-GAAP measures supplement the Companys US GAAP disclosures and should not be viewed as alternatives to US GAAP measures of performance Furthermore such non-GAAP measures may not be consistent with similar measures provided or used by other companies Dow does not provide forward-looking US GAAP financial measures or a reconciliation of forward-looking non-GAAP financial measures to the most comparable US GAAP financial measures on a forward-looking basis because the Company is unable to predict with reasonable certainty the ultimate outcome of pending litigation unusual gains and losses foreign currency exchange gains or losses and potential future asset impairments as well as discrete taxable events without unreasonable effort These items are uncertain depend on various factors and could have a material impact on US GAAP results for the guidance period
TrademarksThe Dow Diamond logo and all products unless otherwise noted denoted with trade or reg are trademarks service marks or registered trademarks of The Dow Chemical Company or its respective subsidiaries or affiliates Solely for convenience the trademarks service marks and trade names referred to in this communication may appear without the trade or reg symbols but such references are not intended to indicate in any way that we will not assert to the fullest extent under applicable law our rights or the right of the applicable licensor to these trademarks service marks and trade names This presentation may also contain trademarks service marks and trade names of certain third parties which are the property of their respective owners Our use or display of third partiesrsquo trademarks service marks trade names or products in this communication is not intended to and should not be read to imply a relationship with or endorsement or sponsorship of us
DefinitionsOperating EBIT is defined as earnings (ie ldquoIncome (loss) from continuing operations before taxesrdquo) before interest excluding the impact of significant itemsOperating EBITDA is defined as earnings (ie ldquoIncome (loss) from continuing operations before taxesrdquo) before interest depreciation and amortization excluding the impact of significant itemsOperating EBIT Margin is defined as Operating EBIT divided by net salesAdjusted Operating EBIT is defined as Operating EBIT less equity earningsAdjusted Operating EBIT Margin is defined as Operating EBIT less equity earnings divided by net salesAdjusted Operating EBITDA is defined as Operating EBITDA less equity earningsAdjusted Operating EBITDA Margin is defined as Adjusted Operating EBITDA divided by net sales excluding certain transactions with nonconsolidated affiliates Operating earnings per share is defined as Earnings (loss) per common share from continuing operations - dilutedldquo excluding the after-tax impact of significant items Operational Tax Rate is defined as the effective tax rate (ie GAAP ldquoProvision for income taxesrdquo divided by ldquoIncome (loss) from continuing operations before income taxesrdquo) excluding the impact of significant itemsFree cash flow (FCF) is defined as ldquoCash provided by (used for) operating activities - continuing operationsrdquo less capital expenditures Under this definition free cash flow represents the cash generated by the Company from operations after investing in its asset base Free cash flow combined with cash balances and other sources of liquidity represent the cash available to fund obligations and provide returns to shareholders Free cash flow is an integral financial measure used in the Companys financial planning processFree Cash Flow Yield is defined as Free cash flow divided by market capitalizationShareholder Remuneration is defined as Dividends paid to stockholders plus Purchases of treasury stockShareholder Yield is defined as Shareholder Remuneration divided by market capitalizationCash Flow Conversion is defined as ldquoCash provided by (used for) operating activities ndash continuing operationsrdquo divided by Operating EBITDA or Pro Forma Operating EBITDA Management believes cash flow conversion is an important financial metric as it helps the Company determine how efficiently it is converting its earnings to cash flowFree cash conversion is defined as Adjusted Operating EBITDA less capital expenditures divided by Adjusted Operating EBITDANet Debt is defined as ldquoNotes payablerdquo plus ldquoLong-term debt due within one yearrdquo plus ldquoLong-term debtrdquo less ldquoCash and cash equivalentsrdquo and ldquoMarketable securitiesrdquoKuwait Joint Ventures (JVs) refers to EQUATE Petrochemical Company KSCC The Kuwait Olefins Company KSCC and The Kuwait Styrene Company KSCCThai Joint Ventures (JVs) refers to Map Ta Phut Olefins Company Limited and The SCG-Dow Group (Siam Polyethylene Company Limited Siam Polystyrene Company Limited Siam Styrene Monomer Co Ltd Siam Synthetic Latex Company Limited)
1 Free cash flow is defined as Cash provided by (used for) operating activities - continuing operations less capital expenditures Under this definition free cash flow represents the cash generated by the Company from operations after investing in its asset base Free cash flow combined with cash balances and other sources of liquidity represent the cash available to fund obligations and provide returns to shareholders Free cash flow is an integral financial measure used in the Companys financial planning process
Net Sales by Segment
Three Months EndedDec 31 2020
Three Months Ended
In millions (Unaudited)
March 31 2021
March 31 2020
Packaging amp Specialty Plastics
$ 5126
$ 6082
$ 4609
Industrial Intermediates amp Infrastructure
3501
3607
3045
Performance Materials amp Coatings
2029
2123
2065
Corporate
50
70
51
Total
$ 10706
$ 11882
9770
Operating EBIT by Segment
Three Months EndedDec 31 2020
Three Months Ended
In millions (Unaudited)
March 31 2021
March 31 2020
Packaging amp Specialty Plastics
$ 780
$ 1228
$ 580
Industrial Intermediates amp Infrastructure
296
326
175
Performance Materials amp Coatings
50
62
162
Corporate
(72)
(62)
(74)
Total
$ 1054
$ 1554
843
Equity in Earnings (Losses) of Nonconsolidated Affiliates by Segment
Three Months EndedDec 31 2020
Three Months Ended
In millions (Unaudited)
March 31 2021
March 31 2020
Packaging amp Specialty Plastics
$ 77
$ 106
$ 5
Industrial Intermediates amp Infrastructure
36
115
(76)
Performance Materials amp Coatings
2
2
1
Corporate
(9)
1
(19)
Total
$ 106
$ 224
(89)
Adjusted Operating EBIT by Segment
Three Months EndedDec 31 2020
Three Months Ended
In millions (Unaudited)
March 31 2021
March 31 2020
Packaging amp Specialty Plastics
$ 703
$ 1122
$ 575
Industrial Intermediates amp Infrastructure
260
211
251
Performance Materials amp Coatings
48
60
161
Corporate
(63)
(63)
(55)
Total
$ 948
$ 1330
932
Operating Margin by Segment
Three Months EndedDec 31 2020
Three Months Ended
In millions (Unaudited)
March 31 2021
March 31 2020
Packaging amp Specialty Plastics
152
202
126
Industrial Intermediates amp Infrastructure
85
90
57
Performance Materials amp Coatings
25
29
78
Total
98
131
86
Adjusted Operating EBIT Margin by Segment
Three Months EndedDec 31 2020
Three Months Ended
In millions (Unaudited)
March 31 2021
March 31 2020
Packaging amp Specialty Plastics
137
184
125
Industrial Intermediates amp Infrastructure
74
58
82
Performance Materials amp Coatings
24
28
78
Total
89
112
95
Reconciliation of Income (loss) from continuing operations net of tax to Operating EBIT and Operating EBITDA
Three Months Ended
Nine Months Ended
March 31 2020
June 30 2020
September 30 2020
December 31 2020
March 31 2021
September 30 2020
September 30 2019
In millions (Unaudited)
As Reported
Pro Forma
Income (loss) from continuing operations net of tax
$ 258
$ (217)
$ (1)
$ 1254
$ 1006
$ 1006
$ 258
+ Provision for income taxes on continuing operations
138
34
43
562
317
317
138
Income (loss) from continuing operations before income taxes
$ 396
$ (183)
$ 42
$ 1816
$ 1323
$ 1323
$ 396
- Interest income
15
6
6
11
8
8
15
+ Interest expense and amortization of debt discount
1 Operating EBIT is defined as earnings (ie Income (loss) from continuing operations before income taxes) before interest excluding the impact of significant items
2 Operating EBITDA is defined as earnings (ie Income (loss) from continuing operations before income taxes) before interest depreciation and amortization excluding the impact of significant items
Significant Items Impacting Results for the Three Months Ended Mar 31 2021
In millions except per share amounts (Unaudited)
Pretax 1
Net Income 2
EPS 3
Reported results
$ 1323
$ 991
$ 132
Less Significant items
Restructuring implementation costs
(10)
(8)
(001)
Digitalization program costs
(33)
(25)
(003)
Total significant items
$ (43)
$ (33)
$ (004)
Operating results (non-GAAP)
$ 1366
$ 1024
$ 136
Significant Items Impacting Results for the Three Months Ended Mar 31 2020
In millions except per share amounts (Unaudited)
Pretax 1
Net Income 2
EPS 3
Reported results
$ 396
$ 239
$ 032
Less Significant items
Integration and separation costs
(65)
(51)
(007)
Restructuring and asset related charges - net
(96)
(79)
(011)
Loss on early extinguishment of debt
(86)
(70)
(009)
Total significant items
$ (247)
$ (200)
$ (027)
Operating results (non-GAAP)
$ 643
$ 439
$ 059
1 Income before income taxes
2 Net income (loss) available for Dow Inc common stockholders The income tax effect on significant items was calculated based upon the enacted tax laws and statutory income tax rates applicable in the tax jurisdiction(s) of the underlying non-GAAP adjustment
1 Free cash flow is defined as Cash provided by (used for) operating activities - continuing operations less capital expenditures Under this definition free cash flow represents the cash generated by the Company from operations after investing in its asset base Free cash flow combined with cash balances and other sources of liquidity represent the cash available to fund obligations and provide returns to shareholders Free cash flow is an integral financial measure used in the Companys financial planning process
2 Free cash flow in the first quarter of 2021 reflects a $1 billion elective pension contribution
Net Sales by Segment
Three Months EndedDec 31 2020
Three Months Ended
In millions (Unaudited)
March 31 2021
March 31 2020
Packaging amp Specialty Plastics
$ 5126
$ 6082
$ 4609
Industrial Intermediates amp Infrastructure
3501
3607
3045
Performance Materials amp Coatings
2029
2123
2065
Corporate
50
70
51
Total
$ 10706
$ 11882
9770
Operating EBIT by Segment
Three Months EndedDec 31 2020
Three Months Ended
In millions (Unaudited)
March 31 2021
March 31 2020
Packaging amp Specialty Plastics
$ 780
$ 1228
$ 580
Industrial Intermediates amp Infrastructure
296
326
175
Performance Materials amp Coatings
50
62
162
Corporate
(72)
(62)
(74)
Total
$ 1054
$ 1554
843
Equity in Earnings (Losses) of Nonconsolidated Affiliates by Segment
Three Months EndedDec 31 2020
Three Months Ended
In millions (Unaudited)
March 31 2021
March 31 2020
Packaging amp Specialty Plastics
$ 77
$ 106
$ 5
Industrial Intermediates amp Infrastructure
36
115
(76)
Performance Materials amp Coatings
2
2
1
Corporate
(9)
1
(19)
Total
$ 106
$ 224
(89)
Adjusted Operating EBIT by Segment
Three Months EndedDec 31 2020
Three Months Ended
In millions (Unaudited)
March 31 2021
March 31 2020
Packaging amp Specialty Plastics
$ 703
$ 1122
$ 575
Industrial Intermediates amp Infrastructure
260
211
251
Performance Materials amp Coatings
48
60
161
Corporate
(63)
(63)
(55)
Total
$ 948
$ 1330
932
Operating Margin by Segment
Three Months EndedDec 31 2020
Three Months Ended
In millions (Unaudited)
March 31 2021
March 31 2020
Packaging amp Specialty Plastics
152
202
126
Industrial Intermediates amp Infrastructure
85
90
57
Performance Materials amp Coatings
25
29
78
Total
98
131
86
Adjusted Operating EBIT Margin by Segment
Three Months EndedDec 31 2020
Three Months Ended
In millions (Unaudited)
March 31 2021
March 31 2020
Packaging amp Specialty Plastics
137
184
125
Industrial Intermediates amp Infrastructure
74
58
82
Performance Materials amp Coatings
24
28
78
Total
89
112
95
Reconciliation of Income (loss) from continuing operations net of tax to Operating EBIT and Operating EBITDA
Three Months Ended
Nine Months Ended
March 31 2020
June 30 2020
September 30 2020
December 31 2020
March 31 2021
September 30 2020
September 30 2019
In millions (Unaudited)
As Reported
Pro Forma
Income (loss) from continuing operations net of tax
$ 258
$ (217)
$ (1)
$ 1254
$ 1006
$ 1006
$ 258
+ Provision for income taxes on continuing operations
138
34
43
562
317
317
138
Income (loss) from continuing operations before income taxes
$ 396
$ (183)
$ 42
$ 1816
$ 1323
$ 1323
$ 396
- Interest income
15
6
6
11
8
8
15
+ Interest expense and amortization of debt discount
1 Operating EBIT is defined as earnings (ie Income (loss) from continuing operations before income taxes) before interest excluding the impact of significant items
2 Operating EBITDA is defined as earnings (ie Income (loss) from continuing operations before income taxes) before interest depreciation and amortization excluding the impact of significant items
Significant Items Impacting Results for the Three Months Ended Mar 31 2021
In millions except per share amounts (Unaudited)
Pretax 1
Net Income 2
EPS 3
Reported results
$ 1323
$ 991
$ 132
Less Significant items
Restructuring implementation costs
(10)
(8)
(001)
Digitalization program costs
(33)
(25)
(003)
Total significant items
$ (43)
$ (33)
$ (004)
Operating results (non-GAAP)
$ 1366
$ 1024
$ 136
Significant Items Impacting Results for the Three Months Ended Mar 31 2020
In millions except per share amounts (Unaudited)
Pretax 1
Net Income 2
EPS 3
Reported results
$ 396
$ 239
$ 032
Less Significant items
Integration and separation costs
(65)
(51)
(007)
Restructuring and asset related charges - net
(96)
(79)
(011)
Loss on early extinguishment of debt
(86)
(70)
(009)
Total significant items
$ (247)
$ (200)
$ (027)
Operating results (non-GAAP)
$ 643
$ 439
$ 059
1 Income before income taxes
2 Net income available for Dow Inc common stockholders The income tax effect on significant items was calculated based upon the enacted tax laws and statutory income tax rates applicable in the tax jurisdiction(s) of the underlying non-GAAP adjustment
1 Free cash flow is defined as Cash provided by (used for) operating activities - continuing operations less capital expenditures Under this definition free cash flow represents the cash generated by the Company from operations after investing in its asset base Free cash flow combined with cash balances and other sources of liquidity represent the cash available to fund obligations and provide returns to shareholders Free cash flow is an integral financial measure used in the Companys financial planning process
Net Sales by Segment
Three Months EndedDec 31 2020
Three Months Ended
In millions (Unaudited)
March 31 2021
March 31 2020
Packaging amp Specialty Plastics
$ 5126
$ 6082
$ 4609
Industrial Intermediates amp Infrastructure
3501
3607
3045
Performance Materials amp Coatings
2029
2123
2065
Corporate
50
70
51
Total
$ 10706
$ 11882
9770
Operating EBIT by Segment
Three Months EndedDec 31 2020
Three Months Ended
In millions (Unaudited)
March 31 2021
March 31 2020
Packaging amp Specialty Plastics
$ 780
$ 1228
$ 580
Industrial Intermediates amp Infrastructure
296
326
175
Performance Materials amp Coatings
50
62
162
Corporate
(72)
(62)
(74)
Total
$ 1054
$ 1554
843
Equity in Earnings (Losses) of Nonconsolidated Affiliates by Segment
Three Months EndedDec 31 2020
Three Months Ended
In millions (Unaudited)
March 31 2021
March 31 2020
Packaging amp Specialty Plastics
$ 77
$ 106
$ 5
Industrial Intermediates amp Infrastructure
36
115
(76)
Performance Materials amp Coatings
2
2
1
Corporate
(9)
1
(19)
Total
$ 106
$ 224
(89)
Adjusted Operating EBIT by Segment
Three Months EndedDec 31 2020
Three Months Ended
In millions (Unaudited)
March 31 2021
March 31 2020
Packaging amp Specialty Plastics
$ 703
$ 1122
$ 575
Industrial Intermediates amp Infrastructure
260
211
251
Performance Materials amp Coatings
48
60
161
Corporate
(63)
(63)
(55)
Total
$ 948
$ 1330
932
Operating Margin by Segment
Three Months EndedDec 31 2020
Three Months Ended
In millions (Unaudited)
March 31 2021
March 31 2020
Packaging amp Specialty Plastics
152
202
126
Industrial Intermediates amp Infrastructure
85
90
57
Performance Materials amp Coatings
25
29
78
Total
98
131
86
Adjusted Operating EBIT Margin by Segment
Three Months EndedDec 31 2020
Three Months Ended
In millions (Unaudited)
March 31 2021
March 31 2020
Packaging amp Specialty Plastics
137
184
125
Industrial Intermediates amp Infrastructure
74
58
82
Performance Materials amp Coatings
24
28
78
Total
89
112
95
Reconciliation of Income (loss) from continuing operations net of tax to Operating EBIT and Operating EBITDA
Three Months Ended
Nine Months Ended
March 31 2020
June 30 2020
September 30 2020
December 31 2020
March 31 2021
September 30 2020
September 30 2019
In millions (Unaudited)
As Reported
Pro Forma
Income (loss) from continuing operations net of tax
$ 258
$ (217)
$ (1)
$ 1254
$ 1006
$ 1006
$ 258
+ Provision for income taxes on continuing operations
138
34
43
562
317
317
138
Income (loss) from continuing operations before income taxes
$ 396
$ (183)
$ 42
$ 1816
$ 1323
$ 1323
$ 396
- Interest income
15
6
6
11
8
8
15
+ Interest expense and amortization of debt discount
1 Operating EBIT is defined as earnings (ie Income (loss) from continuing operations before income taxes) before interest excluding the impact of significant items
2 Operating EBITDA is defined as earnings (ie Income (loss) from continuing operations before income taxes) before interest depreciation and amortization excluding the impact of significant items
Significant Items Impacting Results for the Three Months Ended Mar 31 2021
In millions except per share amounts (Unaudited)
Pretax 1
Net Income 2
EPS 3
Reported results
$ 1323
$ 991
$ 132
Less Significant items
Restructuring implementation costs
(10)
(8)
(001)
Digitalization program costs
(33)
(25)
(003)
Total significant items
$ (43)
$ (33)
$ (004)
Operating results (non-GAAP)
$ 1366
$ 1024
$ 136
Significant Items Impacting Results for the Three Months Ended Mar 31 2020
In millions except per share amounts (Unaudited)
Pretax 1
Net Income 2
EPS 3
Reported results
$ 396
$ 239
$ 032
Less Significant items
Integration and separation costs
(65)
(51)
(007)
Restructuring and asset related charges - net
(96)
(79)
(011)
Loss on early extinguishment of debt
(86)
(70)
(009)
Total significant items
$ (247)
$ (200)
$ (027)
Operating results (non-GAAP)
$ 643
$ 439
$ 059
1 Income before income taxes
2 Net income (loss) available for Dow Inc common stockholders The income tax effect on significant items was calculated based upon the enacted tax laws and statutory income tax rates applicable in the tax jurisdiction(s) of the underlying non-GAAP adjustment
1 Free cash flow is defined as Cash provided by (used for) operating activities - continuing operations less capital expenditures Under this definition free cash flow represents the cash generated by the Company from operations after investing in its asset base Free cash flow combined with cash balances and other sources of liquidity represent the cash available to fund obligations and provide returns to shareholders Free cash flow is an integral financial measure used in the Companys financial planning process
Net Sales by Segment
Three Months EndedDec 31 2020
Three Months Ended
In millions (Unaudited)
March 31 2021
March 31 2020
Packaging amp Specialty Plastics
$ 5126
$ 6082
$ 4609
Industrial Intermediates amp Infrastructure
3501
3607
3045
Performance Materials amp Coatings
2029
2123
2065
Corporate
50
70
51
Total
$ 10706
$ 11882
9770
Operating EBIT by Segment
Three Months EndedDec 31 2020
Three Months Ended
In millions (Unaudited)
March 31 2021
March 31 2020
Packaging amp Specialty Plastics
$ 780
$ 1228
$ 580
Industrial Intermediates amp Infrastructure
296
326
175
Performance Materials amp Coatings
50
62
162
Corporate
(72)
(62)
(74)
Total
$ 1054
$ 1554
843
Equity in Earnings (Losses) of Nonconsolidated Affiliates by Segment
Three Months EndedDec 31 2020
Three Months Ended
In millions (Unaudited)
March 31 2021
March 31 2020
Packaging amp Specialty Plastics
$ 77
$ 106
$ 5
Industrial Intermediates amp Infrastructure
36
115
(76)
Performance Materials amp Coatings
2
2
1
Corporate
(9)
1
(19)
Total
$ 106
$ 224
(89)
Adjusted Operating EBIT by Segment
Three Months EndedDec 31 2020
Three Months Ended
In millions (Unaudited)
March 31 2021
March 31 2020
Packaging amp Specialty Plastics
$ 703
$ 1122
$ 575
Industrial Intermediates amp Infrastructure
260
211
251
Performance Materials amp Coatings
48
60
161
Corporate
(63)
(63)
(55)
Total
$ 948
$ 1330
932
Operating Margin by Segment
Three Months EndedDec 31 2020
Three Months Ended
In millions (Unaudited)
March 31 2021
March 31 2020
Packaging amp Specialty Plastics
152
202
126
Industrial Intermediates amp Infrastructure
85
90
57
Performance Materials amp Coatings
25
29
78
Total
98
131
86
Adjusted Operating EBIT Margin by Segment
Three Months EndedDec 31 2020
Three Months Ended
In millions (Unaudited)
March 31 2021
March 31 2020
Packaging amp Specialty Plastics
137
184
125
Industrial Intermediates amp Infrastructure
74
58
82
Performance Materials amp Coatings
24
28
78
Total
89
112
95
Reconciliation of Income (loss) from continuing operations net of tax to Operating EBIT and Operating EBITDA
Three Months Ended
Nine Months Ended
March 31 2020
June 30 2020
September 30 2020
December 31 2020
March 31 2021
September 30 2020
September 30 2019
In millions (Unaudited)
As Reported
Pro Forma
Income (loss) from continuing operations net of tax
$ 258
$ (217)
$ (1)
$ 1254
$ 1006
$ 1006
$ 258
+ Provision for income taxes on continuing operations
138
34
43
562
317
317
138
Income (loss) from continuing operations before income taxes
$ 396
$ (183)
$ 42
$ 1816
$ 1323
$ 1323
$ 396
- Interest income
15
6
6
11
8
8
15
+ Interest expense and amortization of debt discount
1 Operating EBIT is defined as earnings (ie Income (loss) from continuing operations before income taxes) before interest excluding the impact of significant items
2 Operating EBITDA is defined as earnings (ie Income (loss) from continuing operations before income taxes) before interest depreciation and amortization excluding the impact of significant items
Significant Items Impacting Results for the Three Months Ended Mar 31 2021
In millions except per share amounts (Unaudited)
Pretax 1
Net Income 2
EPS 3
Reported results
$ 1323
$ 991
$ 132
Less Significant items
Restructuring implementation costs
(10)
(8)
(001)
Digitalization program costs
(33)
(25)
(003)
Total significant items
$ (43)
$ (33)
$ (004)
Operating results (non-GAAP)
$ 1366
$ 1024
$ 136
Significant Items Impacting Results for the Three Months Ended Mar 31 2020
In millions except per share amounts (Unaudited)
Pretax 1
Net Income 2
EPS 3
Reported results
$ 396
$ 239
$ 032
Less Significant items
Integration and separation costs
(65)
(51)
(007)
Restructuring and asset related charges - net
(96)
(79)
(011)
Loss on early extinguishment of debt
(86)
(70)
(009)
Total significant items
$ (247)
$ (200)
$ (027)
Operating results (non-GAAP)
$ 643
$ 439
$ 059
1 Income before income taxes
2 Net income (loss) available for Dow Inc common stockholders The income tax effect on significant items was calculated based upon the enacted tax laws and statutory income tax rates applicable in the tax jurisdiction(s) of the underlying non-GAAP adjustment
1 Free cash flow is defined as Cash provided by (used for) operating activities - continuing operations less capital expenditures Under this definition free cash flow represents the cash generated by the Company from operations after investing in its asset base Free cash flow combined with cash balances and other sources of liquidity represent the cash available to fund obligations and provide returns to shareholders Free cash flow is an integral financial measure used in the Companys financial planning process
2 Free cash flow in the first quarter of 2021 reflects a $1 billion elective pension contribution
Net Sales by Segment
Three Months EndedDec 31 2020
Three Months Ended
In millions (Unaudited)
March 31 2021
March 31 2020
Packaging amp Specialty Plastics
$ 5126
$ 6082
$ 4609
Industrial Intermediates amp Infrastructure
3501
3607
3045
Performance Materials amp Coatings
2029
2123
2065
Corporate
50
70
51
Total
$ 10706
$ 11882
9770
Operating EBIT by Segment
Three Months EndedDec 31 2020
Three Months Ended
In millions (Unaudited)
March 31 2021
March 31 2020
Packaging amp Specialty Plastics
$ 780
$ 1228
$ 580
Industrial Intermediates amp Infrastructure
296
326
175
Performance Materials amp Coatings
50
62
162
Corporate
(72)
(62)
(74)
Total
$ 1054
$ 1554
843
Equity in Earnings (Losses) of Nonconsolidated Affiliates by Segment
Three Months EndedDec 31 2020
Three Months Ended
In millions (Unaudited)
March 31 2021
March 31 2020
Packaging amp Specialty Plastics
$ 77
$ 106
$ 5
Industrial Intermediates amp Infrastructure
36
115
(76)
Performance Materials amp Coatings
2
2
1
Corporate
(9)
1
(19)
Total
$ 106
$ 224
(89)
Adjusted Operating EBIT by Segment
Three Months EndedDec 31 2020
Three Months Ended
In millions (Unaudited)
March 31 2021
March 31 2020
Packaging amp Specialty Plastics
$ 703
$ 1122
$ 575
Industrial Intermediates amp Infrastructure
260
211
251
Performance Materials amp Coatings
48
60
161
Corporate
(63)
(63)
(55)
Total
$ 948
$ 1330
932
Operating Margin by Segment
Three Months EndedDec 31 2020
Three Months Ended
In millions (Unaudited)
March 31 2021
March 31 2020
Packaging amp Specialty Plastics
152
202
126
Industrial Intermediates amp Infrastructure
85
90
57
Performance Materials amp Coatings
25
29
78
Total
98
131
86
Adjusted Operating EBIT Margin by Segment
Three Months EndedDec 31 2020
Three Months Ended
In millions (Unaudited)
March 31 2021
March 31 2020
Packaging amp Specialty Plastics
137
184
125
Industrial Intermediates amp Infrastructure
74
58
82
Performance Materials amp Coatings
24
28
78
Total
89
112
95
Reconciliation of Net income (loss) to Operating EBIT and Operating EBITDA
Three Months Ended
Nine Months Ended
March 31 2020
June 30 2020
September 30 2020
December 31 2020
March 31 2021
September 30 2020
September 30 2019
In millions (Unaudited)
As Reported
Pro Forma
Net income (loss)
$ 258
$ (217)
$ (1)
$ 1254
$ 1006
$ 1006
$ 258
+ Provision for income taxes
138
34
43
562
317
317
138
Income (loss) before income taxes
$ 396
$ (183)
$ 42
$ 1816
$ 1323
$ 1323
$ 396
- Interest income
15
6
6
11
8
8
15
+ Interest expense and amortization of debt discount
1 Operating EBIT is defined as earnings (ie Income (loss) before income taxes) before interest excluding the impact of significant items
2 Operating EBITDA is defined as earnings (ie Income (loss) before income taxes) before interest depreciation and amortization excluding the impact of significant items
Significant Items Impacting Results for the Three Months Ended Mar 31 2021
In millions except per share amounts (Unaudited)
Pretax 1
Net Income 2
EPS 3
Reported results
$ 1323
$ 991
$ 132
Less Significant items
Restructuring implementation costs
(10)
(8)
(001)
Digitalization program costs
(33)
(25)
(003)
Total significant items
$ (43)
$ (33)
$ (004)
Operating results (non-GAAP)
$ 1366
$ 1024
$ 136
Significant Items Impacting Results for the Three Months Ended Mar 31 2020
In millions except per share amounts (Unaudited)
Pretax 1
Net Income 2
EPS 3
Reported results
$ 396
$ 239
$ 032
Less Significant items
Integration and separation costs
(65)
(51)
(007)
Restructuring and asset related charges - net
(96)
(79)
(011)
Loss on early extinguishment of debt
(86)
(70)
(009)
Total significant items
$ (247)
$ (200)
$ (027)
Operating results (non-GAAP)
$ 643
$ 439
$ 059
1 Income before income taxes
2 Net income available for Dow Inc common stockholders The income tax effect on significant items was calculated based upon the enacted tax laws and statutory income tax rates applicable in the tax jurisdiction(s) of the underlying non-GAAP adjustment
1 Free cash flow is defined as Cash provided by (used for) operating activities - continuing operations less capital expenditures Under this definition free cash flow represents the cash generated by the Company from operations after investing in its asset base Free cash flow combined with cash balances and other sources of liquidity represent the cash available to fund obligations and provide returns to shareholders Free cash flow is an integral financial measure used in the Companys financial planning process
Net Sales by Segment
Three Months EndedDec 31 2020
Three Months Ended
In millions (Unaudited)
March 31 2021
March 31 2020
Packaging amp Specialty Plastics
$ 5126
$ 6082
$ 4609
Industrial Intermediates amp Infrastructure
3501
3607
3045
Performance Materials amp Coatings
2029
2123
2065
Corporate
50
70
51
Total
$ 10706
$ 11882
9770
Operating EBIT by Segment
Three Months EndedDec 31 2020
Three Months Ended
In millions (Unaudited)
March 31 2021
March 31 2020
Packaging amp Specialty Plastics
$ 780
$ 1228
$ 580
Industrial Intermediates amp Infrastructure
296
326
175
Performance Materials amp Coatings
50
62
162
Corporate
(72)
(62)
(74)
Total
$ 1054
$ 1554
843
Equity in Earnings (Losses) of Nonconsolidated Affiliates by Segment
Three Months EndedDec 31 2020
Three Months Ended
In millions (Unaudited)
March 31 2021
March 31 2020
Packaging amp Specialty Plastics
$ 77
$ 106
$ 5
Industrial Intermediates amp Infrastructure
36
115
(76)
Performance Materials amp Coatings
2
2
1
Corporate
(9)
1
(19)
Total
$ 106
$ 224
(89)
Adjusted Operating EBIT by Segment
Three Months EndedDec 31 2020
Three Months Ended
In millions (Unaudited)
March 31 2021
March 31 2020
Packaging amp Specialty Plastics
$ 703
$ 1122
$ 575
Industrial Intermediates amp Infrastructure
260
211
251
Performance Materials amp Coatings
48
60
161
Corporate
(63)
(63)
(55)
Total
$ 948
$ 1330
932
Operating Margin by Segment
Three Months EndedDec 31 2020
Three Months Ended
In millions (Unaudited)
March 31 2021
March 31 2020
Packaging amp Specialty Plastics
152
202
126
Industrial Intermediates amp Infrastructure
85
90
57
Performance Materials amp Coatings
25
29
78
Total
98
131
86
Adjusted Operating EBIT Margin by Segment
Three Months EndedDec 31 2020
Three Months Ended
In millions (Unaudited)
March 31 2021
March 31 2020
Packaging amp Specialty Plastics
137
184
125
Industrial Intermediates amp Infrastructure
74
58
82
Performance Materials amp Coatings
24
28
78
Total
89
112
95
Reconciliation of Income (loss) from continuing operations net of tax to Operating EBIT and Operating EBITDA
Three Months Ended
Nine Months Ended
March 31 2020
June 30 2020
September 30 2020
December 31 2020
March 31 2021
September 30 2020
September 30 2019
In millions (Unaudited)
As Reported
Pro Forma
Income (loss) from continuing operations net of tax
$ 258
$ (217)
$ (1)
$ 1254
$ 1006
$ 1006
$ 258
+ Provision for income taxes on continuing operations
138
34
43
562
317
317
138
Income (loss) from continuing operations before income taxes
$ 396
$ (183)
$ 42
$ 1816
$ 1323
$ 1323
$ 396
- Interest income
15
6
6
11
8
8
15
+ Interest expense and amortization of debt discount
1 Operating EBIT is defined as earnings (ie Income (loss) from continuing operations before income taxes) before interest excluding the impact of significant items
2 Operating EBITDA is defined as earnings (ie Income (loss) from continuing operations before income taxes) before interest depreciation and amortization excluding the impact of significant items
Significant Items Impacting Results for the Three Months Ended Mar 31 2021
In millions except per share amounts (Unaudited)
Pretax 1
Net Income 2
EPS 3
Reported results
$ 1323
$ 991
$ 132
Less Significant items
Restructuring implementation costs
(10)
(8)
(001)
Digitalization program costs
(33)
(25)
(003)
Total significant items
$ (43)
$ (33)
$ (004)
Operating results (non-GAAP)
$ 1366
$ 1024
$ 136
Significant Items Impacting Results for the Three Months Ended Mar 31 2020
In millions except per share amounts (Unaudited)
Pretax 1
Net Income 2
EPS 3
Reported results
$ 396
$ 239
$ 032
Less Significant items
Integration and separation costs
(65)
(51)
(007)
Restructuring and asset related charges - net
(96)
(79)
(011)
Loss on early extinguishment of debt
(86)
(70)
(009)
Total significant items
$ (247)
$ (200)
$ (027)
Operating results (non-GAAP)
$ 643
$ 439
$ 059
1 Income before income taxes
2 Net income available for Dow Inc common stockholders The income tax effect on significant items was calculated based upon the enacted tax laws and statutory income tax rates applicable in the tax jurisdiction(s) of the underlying non-GAAP adjustment
3 Earnings per common share - diluted
Dow FY20 Benchmarking Update
14
BENCHMARKING PEERS
Benchmarking conducted against segment level peers if sufficient information disclosed otherwise corporate level
15
TOTAL DOW BENCHMARKING SUMMARY OF OBSERVATIONS
Benchmarking Strengths amp Gaps
TotalDow
FY20 YoY Adj Op EBITDA growth trailed the peer median as resilient demand for packaging applications and recovery in durable good end markets was more than offset by upstream pricing pressures in siloxanes and acrylic monomers along with lower relative participation for polyurethanes in Asia which experienced a shorter COVID-19 downturn
In-Flight Actions Implement faster payback higher ROIC expansions reduce merchant positions of intermediatesbull Expansion of FS-1 cracker is underway (+65KTA) that will feed downstream derivative PE demandbull South China Specialties Hub (~250KTA) specialty PU and alkoxylates to participate in Asia growth bull Downstream silicones expansions (~15 projects in 2021) to reduce merchant siloxane intermediates exposure
FY20 Adj Op EBITDA margin remained resilient and among the best in the peer group through the economic downturn and recovery from COVID-19
Cash Flow Conversion among highest in the peer group from a disciplined focus on cash generation and structural working capital efficiency gains
SGampA + RampD as of sales remained among best in peer group from continued cost discipline
Best-in-class Free Cash Flow yield above sector and market averages
Net debt reduced more than peers on strong cash generation and focused capital allocation priorities
Source Dow data CapitalIQ Company ReleasesUnless otherwise noted all 2018 and 2019 financial information for Dow is on a pro forma basisAdjusted Operating EBITDA is defined as Operating EBITDA excluding equity earnings
Adj Op EBITDA Margin excludes transactions with certain nonconsolidated affiliates Cash Flow Conversion is defined as Cash from Continuing Operations divided by Operating EBITDAFree Cash Flow is defined as Cash from Continuing Operations less Capital Expenditures
16
TOTAL DOW
(1) Adjusted Operating EBITDA is defined as Operating EBITDA excluding equity earnings Adj Op EBITDA Margin excludes transactions with certain nonconsolidated affiliates
(2) Benchmarking peer set range includes Arkema BASF Covestro Eastman Huntsman Lyondell Wacker(3) Cash Flow Conversion is defined as Cash From Continuing Operations divided by Operating EBITDA(4) Median excludes Dow
Adj Op EBITDA Growth
Adj Op EBITDA Margin Cash Flow Conversion SGampA + RampD
(as a of Sales)FY20 vs FY19
FY20
Median Excl Dow
Median Excl Dow
BENCHMARKING SNAPSHOT (1234)
FY20 UPDATE amp FY19
FY19
-60
-50
-40
-30
-20
-10
0
10
FY19 vs FY18
FY20 FY19 FY20 FY19
Median Excl Dow
Median Excl Dow
5
10
15
20
25
Median Excl Dow
Median Excl Dow
30
50
70
90
110
130
150
Median Excl Dow Median
Excl Dow
0
5
10
15
20
25
Median Excl Dow
Median Excl Dow
Source Dow data CapitalIQ Company disclosures
Unless otherwise noted all 2018 and 2019 financial information for Dow is on a pro forma basisFor further unaudited pro forma financial information refer to the Companyrsquos Current Report on Form 8-K dated June 3 2019 and 4Q20 Earnings materials included in the Current Report on Form 8-K dated January 28 2021
bull Hallmark safety performance and operational excellence
bull Focused portfolio with market leading positions in key value chains
bull Consumer tilted portfolio in growing end-market verticals
bull Global footprint with integrated value chains that provide differentiated product offerings
CORE STRENGTHSbull Maintain focus on cash
generation and low-cost curve position
bull Continued disciplined capital allocation
bull Use innovation pipeline to collaborate with customers and capture growth trends
bull Invest in incremental higher return faster payback growth opportunities
bull Deliver sustainable future through Industry leading ESG position
Average Annual Free Cash Flow (2019-2020)as of 2020 Market Cap
17
TOP-QUARTILE CASH REMUNERATION YIELD AND DEBT REDUCTION
Median Excl Dow
~84
Median Excl Dow
+02B
Median Excl Dow
~6
Median Excl Dow
~3
(1) Benchmarking peer set range includes Arkema BASF Covestro Eastman Huntsman Lyondell Wacker(2) Source Dow data FactSet and Company Releases for Peers(3) Dow Market Capitalization as of YE2020 was ~$412B
Unless otherwise noted all 2018 and 2019 financial information for Dow is on a pro forma basisFor further unaudited pro forma financial information refer to the Companyrsquos Current Report on Form 8-K dated June 3 2019 and 4Q20 Earnings materials included in the Current Report on Form 8-K dated January 28 2021
18
CULTURE OF BENCHMARKING SUMMARY OF OBSERVATIONS
Segment FY20 Benchmarking Strengths amp Gaps
PampSP
FY20 YoY Adj Op EBITDA growth tracked the peer median as peers with more exposure to naphtha rebounded from a lower 2019 performance from cost pressures
FY20 Adj Op EBITDA margin more resilient than most peers Op EBITDA per pound polyolefin capacity ahead of peers advantage continues to widen Free Cash Conversion continued to improve and is best-in-class among the peer set SGampA + RampD as of sales remained among lowest in the peer group
IIampI
FY20 YoY Adj Op EBITDA growth and Adj Op EBITDA margin trailed the peer median as strengthening durable good end-markets in 2H20 were offset by decisive actions taken earlier in 1H20 to match production to demand as well as lower relative participation in Asia which experienced a shorter COVID-19 demand downturn
Free Cash Conversion is best-in-class among the peer set SGampA + RampD as of sales remained among lowest in the peer group
PMampC
FY20 YoY Adj Op EBITDA growth trailed the peer median due to greater exposure to siloxanes and acrylic monomers that were more heavily impacted by demand downturn and competitive pricing actions
FY20 Adj Op EBITDA margin trailed the peer median as strong demand for home care and DIY coatings was more than offset by personal care and automotive applications that lagged broader recovery
Free Cash Conversion among highest in the peer group SGampA + RampD as of sales best-in-class expanded advantage vs next closest peer
Source Dow data CapitalIQ Company ReleasesAdjusted Operating EBITDA is defined as Operating EBITDA excluding equity earnings Adj Op EBITDA Margin excludes transactions with certain nonconsolidated affiliatesFree Cash Conversion for Dow is defined as Adj Op EBITDA less Capex divided by Adj Op EBITDA
Unless otherwise noted all 2018 and 2019 financial information for Dow is on a pro forma basisFor further unaudited pro forma financial information refer to the Companyrsquos Current Report on Form 8-K dated June 3 2019 and 4Q20 Earnings materials included in the Current Report on Form 8-K dated January 28 2021
19
PACKAGING amp SPECIALTY PLASTICS
Adj Op EBITDA Growth(7)
Adj Op EBITDA Margin Free Cash Conversion SGampA + RampD
(as a of Sales)bull World-class packaging
franchise
bull Most flexible feedstock capability in the industry
bull Flexible polyolefins assets
bull Proprietary catalyst and process technology
bull Differentiated co-monomer capability
bull Global low-cost footprint
bull Maintain focus on cash conversion and cost discipline
bull Leverage differentiated product offerings and innovation pipeline to meet growing demand
bull Accelerate sell-up opportunities of higher margin product mix
bull Incremental quick payback investments and capacity expansions
bull Plastics circularity energy intensity CO2 footprint
CORE STRENGTHS FOCUS AREASFY20 vs FY19
FY20
Median Excl Dow
Median Excl Dow
FY19
-80
-60
-40
-20
0
20
40
FY19 vs FY18
FY20 FY19 FY20 FY19
Median Excl Dow
Median Excl Dow
5
10
15
20
25
Median Excl Dow
Median Excl Dow
0
20
40
60
80
Median Excl Dow
Median Excl Dow
0
5
10
15
Median Excl Dow
Median Excl Dow
Source Dow data CapitalIQ Company disclosures
(1) Adjusted Operating EBITDA is defined as Operating EBITDA excluding equity earningsAdj Op EBITDA Margin excludes transactions with certain nonconsolidated affiliates
(2) Benchmarking peer set range includes LyondellBasell Olefins amp Polyolefins Chevron Phillip Chemical Borealis Polyolefins ExxonMobil Chemicals (entire segment)
(3) Free Cash Conversion for Dow is defined as Adj Op EBITDA less Capex divided by Adj Op EBITDA(4) Median excludes Dow(5) SGampA + RampD reflects corporate level for peers where segment level data is unavailable
BENCHMARKING SNAPSHOT (123456)
FY20 UPDATE amp FY19
(6) CPChem results are as of 3Q20 TTM(7) Adj Op EBITDA Growth chart capped for visual purposes top peer was ~90
Unless otherwise noted all 2018 and 2019 financial information for Dow is on a pro forma basisFor further unaudited pro forma financial information refer to the Companyrsquos Current Report on Form 8-K dated June 3 2019 and 4Q20 Earnings materials included in the Current Report on Form 8-K dated January 28 2021
bull Full feedstock-to-polymer integration continues to deliver enhanced value
(1) Segment Op EBITDA based on FY20 reported figures including equity income from affiliatesJVs Capacity based on latest company reported nameplate for PE and PP (2019 for Dow 2020 10-K for Lyondell) including share of JVs or ICIS reported capacity for 2019 including share of JVs if not available (Borealis)
(2) Borealis Polyolefins EBITDA adjusted for equity earnings from JVsUnless otherwise noted all 2018 and 2019 financial information for Dow is on a pro forma basisFor further unaudited pro forma financial information refer to the Companyrsquos Current Report on Form 8-K dated June 3 2019 and 4Q20 Earnings materials included in the Current Report on Form 8-K dated January 28 2021
21
INDUSTRIAL INTERMEDIATES amp INFRASTRUCTURE
bull Top global producer of key raw materials (EO PO)
bull Flexible manufacturing model through integration
bull Top 3 PU Systems House business
bull Industrial Solutions contains products with some of the highest returns to ethylene
bull Maintain focus on cash conversion and cost discipline
bull Drive PU mix towards higher margin Perf Polyols amp Systems
bull Implement faster payback higher ROIC expansions (China Specialties hub differentiated PU applications and DIS alkoxylates)
FOCUS AREASAdj Op EBITDA Growth
Adj Op EBITDA Margin Free Cash Conversion SGampA + RampD
(as a of Sales)
Median Excl Dow
Median Excl Dow Median
Excl Dow
Median Excl Dow
CORE STRENGTHS
Source Dow data CapitalIQ Company disclosures
FY20 vs FY19 FY20 FY19
FY19 vs FY18 FY20 FY19 FY20 FY19
-60
-40
-20
0
20
Median Excl Dow
Median Excl Dow
0
5
10
15
20
25
Median Excl Dow
Median Excl Dow
-10
10
30
50
70
90
Median Excl Dow Median
Excl Dow
0
5
10
15
20
Median Excl Dow Median
Excl Dow
(1) Adjusted Operating EBITDA is defined as Operating EBITDA excluding equity earnings Adj Op EBITDA Margin excludes transactions with certain nonconsolidated affiliates
(2) Benchmarking peer set range includes Eastman Huntsman Covestro LyondellBasell Intermediates amp Derivatives segment(3) Free Cash Conversion for Dow is defined as Adj Op EBITDA less Capex divided by Adj Op EBITDA(4) Median excludes Dow(5) SGampA + RampD reflects corporate level for peers where segment level data is unavailable
BENCHMARKING SNAPSHOT (12345)
FY20 UPDATE amp FY19
Unless otherwise noted all 2018 and 2019 financial information for Dow is on a pro forma basisFor further unaudited pro forma financial information refer to the Companyrsquos Current Report on Form 8-K dated June 3 2019 and 4Q20 Earnings materials included in the Current Report on Form 8-K dated January 28 2021
22
PERFORMANCE MATERIALS amp COATINGS
Adj Op EBITDA Growth
Adj Op EBITDA Margin
SGampA + RampD (as a of Sales) FOCUS AREAS
bull Maintain focus on cash conversion and cost discipline
bull Accelerate organic growth and explore bolt-on inorganic growth
bull Innovate with customers on sustainable solutions
bull Improve acrylic monomer and siloxane margins drive more captive use
bull Grow industrial coatings in prioritized end markets
bull World-class silicones franchise
bull Lowest cost siloxanes producer
bull Leading coatings solutions provider
bull World-scale acrylic monomer assets
bull One of the largest B2B digital platforms
bull Unique hybrid chemistry opportunities
bull Leading SGampA and RampD efficiency
Free Cash Conversion
Median Excl Dow
Median Excl Dow
Median Excl Dow
CORE STRENGTHSFY20 vs FY19 FY20 FY19
FY19 vs FY18 FY20 FY19 FY20 FY19
-40
-30
-20
-10
0
10
Median Excl Dow
Median Excl Dow
5
10
15
20
25
30
35
Median Excl Dow Median
Excl Dow
40
50
60
70
80
Median Excl Dow
Median Excl Dow
5
10
15
20
Median Excl Dow
Median Excl Dow
Source Dow data CapitalIQ Company disclosures
(1) Adjusted Operating EBITDA is defined as Operating EBITDA excluding equity earnings Adj Op EBITDA Margin excludes transactions with certain nonconsolidated affiliates
(2) Benchmarking peer set range includes Celanese Acetyl Chain Wacker Silicones segment Shin-Etsu Silicones segment Arkema Covestro Coatings segment
(3) Free Cash Conversion for Dow is defined as Adj Op EBITDA less Capex divided by Adj Op EBITDA(4) Median excludes Dow(5) SGampA + RampD reflects corporate level for peers where segment level data is unavailable
BENCHMARKING SNAPSHOT (1234)
FY20 UPDATE amp FY19
Unless otherwise noted all 2018 and 2019 financial information for Dow is on a pro forma basisFor further unaudited pro forma financial information refer to the Companyrsquos Current Report on Form 8-K dated June 3 2019 and 4Q20 Earnings materials included in the Current Report on Form 8-K dated January 28 2021
Appendix
OPERATING EARNINGS PER SHARE (EPS) RECONCILIATION
24
In millions except per share amounts (Unaudited) Pretax 1 Net Income 2 EPS 3
Significant Items Impacting Results for the Three Months Ended Mar 31 2021
Significant Items Impacting Results for the Three Months Ended Mar 31 2020
2 Net income available for Dow Inc common stockholders The income tax effect on signif icant items w as calculated based upon the enacted tax law s and statutory income tax rates applicable in the tax jurisdiction(s) of the underlying non-GAAP adjustment
1 Income before income taxes
3 Earnings per common share - diluted
Non-GAAP - Sig Items
DOW CONFIDENTIAL - Do not share without permission
Non-GAAP - EBITDA Recon
DOW CONFIDENTIAL - Do not share without permission
Non-GAAP - Segment Info
DOW CONFIDENTIAL - Do not share without permission
Non-GAAP - Cash Flow Measures
DOW CONFIDENTIAL - Do not share without permission
Non-GAAP - Net Debt
DOW CONFIDENTIAL - Do not share without permission
RECONCILIATION OF NET INCOME (LOSS) TO OPERATING EBIT amp OPERATING EBITDA
25
In millions (Unaudited)
Net income (loss) $ 258 $ (217) $ (1) $ 1254 $ 1006 + Provision for income taxes 138 34 43 562 317Income (loss) before income taxes $ 396 $ (183) $ 42 $ 1816 $ 1323 - Interest income 15 6 6 11 8+ Interest expense and amortization of debt discount 215 200 202 210 196- Significant items (247) (46) (523) 961 (43)Operating EBIT 1 $ 843 $ 57 $ 761 $ 1054 $ 1554 + Depreciation and amortization 724 700 724 726 717Operating EBITDA 2 $ 1567 $ 757 $ 1485 $ 1780 $ 2271 Operating EBITDA - Trailing Twelve Months (TTM) basis $ 6971 $ 5926 $ 5555 $ 5589 $ 6293 1 Operating EBIT is defined as earnings (ie Income (loss) before income taxes) before interest excluding the impact of signif icant items2 Operating EBITDA is defined as earnings (ie Income (loss) before income taxes) before interest depreciation and amortization excluding the impact of signif icant items
Reconciliation of Net income (loss) to Operating EBIT and Operating EBITDA
March 31 2020
Three Months Ended
September 30 2020June 30 2020 March 31 2021December 31 2020
Non-GAAP - Sig Items
DOW CONFIDENTIAL - Do not share without permission
Non-GAAP - EBITDA Recon
DOW CONFIDENTIAL - Do not share without permission
Non-GAAP - Segment Info
DOW CONFIDENTIAL - Do not share without permission
Non-GAAP - Cash Flow Measures
DOW CONFIDENTIAL - Do not share without permission
Non-GAAP - Net Debt
DOW CONFIDENTIAL - Do not share without permission
SEGMENT INFORMATION
26
Net Sales by Segment
In millions (Unaudited) March 31 2021 March 31 2020
2 Free cash f low in the f irst quarter of 2021 reflects a $1 billion elective pension contribution
Three Months Ended
1 Cash f low conversion is defined as Cash provided by (used for) operating activities - continuing operations divided by Operating EBITDA
Three Months Ended
1 Free cash f low is defined as Cash provided by (used for) operating activities - continuing operations less capital expenditures Under this definition free cash f low represents the cash generated by the Company from operations after investing in its asset base Free cash f low combined w ith cash balances and other sources of liquidity represent the cash available to fund obligations and provide returns to shareholders Free cash f low is an integral f inancial measure used in the Companys f inancial planning process
2 Cash f low conversion in the f irst quarter of 2021 reflects a $1 billion elective pension contribution
Non-GAAP - Sig Items
DOW CONFIDENTIAL - Do not share without permission
Non-GAAP - EBITDA Recon
DOW CONFIDENTIAL - Do not share without permission
Non-GAAP - Segment Info
DOW CONFIDENTIAL - Do not share without permission
Non-GAAP - Cash Flow Measures
DOW CONFIDENTIAL - Do not share without permission
Non-GAAP - Net Debt
DOW CONFIDENTIAL - Do not share without permission
RECONCILIATION OF NET DEBT
29
Reconciliation of Net Debt
In millions (Unaudited)Notes payable $ 152 $ 156 Long-term debt due within one year 492 460Long-term debt 16200 16491
DOW CONFIDENTIAL - Do not share without permission
Non-GAAP - EBITDA Recon
DOW CONFIDENTIAL - Do not share without permission
Non-GAAP - Segment Info
DOW CONFIDENTIAL - Do not share without permission
Non-GAAP - Cash Flow Measures
DOW CONFIDENTIAL - Do not share without permission
Non-GAAP - Net Debt
DOW CONFIDENTIAL - Do not share without permission
Background On April 1 2019 DowDuPont completed the separation of its materials science business and Dow Inc became the direct parent company of TDCC owning all of the outstanding common shares of TDCC For filings related to the period commencing April 1 2019 and thereafter TDCC was deemed the predecessor to Dow Inc and the historical results of TDCC are deemed the historical results of Dow Inc for periods prior to and including March 31 2019
The separation was contemplated by the merger of equals transaction effective August 31 2017 under the Agreement and Plan of Merger dated as of December 11 2015 as amended on March 31 2017 TDCC and Historical DuPont each merged with subsidiaries of DowDuPont and as a result TDCC and Historical DuPont became subsidiaries of DowDuPont (the ldquoMergerrdquo) Subsequent to the Merger TDCC and Historical DuPont engaged in a series of internal reorganization and realignment steps to realign their businesses into three subgroups agriculture materials science and specialty products Dow Inc was formed as a wholly owned subsidiary of DowDuPont to serve as the holding company for the materials science business
Unaudited Pro Forma Financial InformationIn order to provide the most meaningful comparison of results of operations and results by segment supplemental unaudited pro forma financial information has been included in the following financial schedules The unaudited pro forma financial information is based on the consolidated financial statements of TDCC adjusted to give effect to the separation from DowDuPont as if it had been consummated on January 1 2017 For the twelve months ended December 31 2019 and 2018 pro forma adjustments have been made for (1) the margin impact of various manufacturing supply and service related agreements entered into with DuPont and Corteva in connection with the separation which provide for different pricing than the historical intercompany and intracompany pricing practices of TDCC and Historical DuPont and (2) the elimination of the impact of events directly attributable to the Merger internal reorganization and business realignment separation distribution and other related transactions (eg one-time transaction costs)
The unaudited pro forma financial information has been presented for informational purposes only and is not necessarily indicative of what Dows results of operations actually would have been had the separation from DowDuPont been completed as of January 1 2017 nor is it indicative of the future operating results of Dow The unaudited pro forma information does not reflect restructuring or integration activities or other costs following the separation from DowDuPont that may be incurred to achieve cost or growth synergies of Dow For further information on the unaudited pro forma financial information please refer to the Companys Current Report on Form 8-K dated June 3 2019
General CommentsUnless otherwise specified all financial measures in this presentation where applicable exclude significant items
GENERAL COMMENTS
30
SAFE HARBORCautionary Statement about Forward-Looking Statements
This presentation contains ldquoforward-looking statementsrdquo within the meaning of the federal securities laws including Section 27A of the Securities Act of 1933 as amended and Section 21E of the Securities Exchange Act of 1934 as amended Such statements often address expected future business and financial performance financial condition and other matters and often contain words or phrases such as ldquoanticipaterdquo ldquobelieverdquo ldquoestimaterdquo ldquoexpectrdquo ldquointendrdquo ldquomayrdquo ldquoopportunityrdquo ldquooutlookrdquo ldquoplanrdquo ldquoprojectrdquo ldquoseekrdquo ldquoshouldrdquo ldquostrategyrdquo ldquotargetrdquo ldquowillrdquo ldquowill berdquo ldquowill continuerdquo ldquowill likely resultrdquo ldquowouldrdquo and similar expressions and variations or negatives of these words or phrases
Forward-looking statements are based on current assumptions and expectations of future events that are subject to risks uncertainties and other factors that are beyond Dowrsquos control which may cause actual results to differ materially from those projected anticipated or implied in the forward-looking statements and speak only as of the date the statements were made These factors include but are not limited to sales of Dowrsquos products Dowrsquos expenses future revenues and profitability the continuing global and regional economic impacts of the coronavirus disease 2019 (ldquoCOVID-19rdquo) pandemic and other public health-related risks and events on Dowrsquos business capital requirements and need for and availability of financing size of the markets for Dowrsquos products and services and ability to compete in such markets failure to develop and market new products and optimally manage product life cycles the rate and degree of market acceptance of Dowrsquos products significant litigation and environmental matters and related contingencies and unexpected expenses the success of competing technologies that are or may become available the ability to protect Dowrsquos intellectual property in the United States and abroad developments related to contemplated restructuring activities and proposed divestitures or acquisitions such as workforce reduction manufacturing facility andor asset closure and related exit and disposal activities and the benefits and costs associated with each of the foregoing fluctuations in energy and raw material prices management of process safety and product stewardship changes in relationships with Dowrsquos significant customers and suppliers changes in consumer preferences and demand changes in laws and regulations political conditions or industry development global economic and capital markets conditions such as inflation market uncertainty interest and currency exchange rates and equity and commodity prices business or supply disruptions security threats such as acts of sabotage terrorism or war weather events and natural disasters and disruptions in Dowrsquos information technology networks and systems
Risks related to Dowrsquos separation from DowDuPont Inc include but are not limited to (i) Dowrsquos inability to achieve some or all of the benefits that it expects to receive from the separation from DowDuPont Inc (ii) certain tax risks associated with the separation (iii) the failure of Dowrsquos pro forma financial information to be a reliable indicator of Dowrsquos future results (iv) non-compete restrictions under the separation agreement (v) receipt of less favorable terms in the commercial agreements Dow entered into with DuPont and Corteva Inc (ldquoCortevardquo) including restrictions under intellectual property cross-license agreements than Dow would have received from an unaffiliated third party and (vi) Dowrsquos obligation to indemnify DuPont andor Corteva for certain liabilities
Where in any forward-looking statement an expectation or belief as to future results or events is expressed such expectation or belief is based on the current plans and expectations of management and expressed in good faith and believed to have a reasonable basis but there can be no assurance that the expectation or belief will result or be achieved or accomplished A detailed discussion of principal risks and uncertainties which may cause actual results and events to differ materially from such forward-looking statements is included in the section titled ldquoRisk Factorsrdquo contained in the Companyrsquos Annual Report on Form 10-K for the year ended December 31 2020 These are not the only risks and uncertainties that Dow faces There may be other risks and uncertainties that Dow is unable to identify at this time or that Dow does not currently expect to have a material impact on its business If any of those risks or uncertainties develops into an actual event it could have a material adverse effect on Dowrsquos business Dow assumes no obligation to update or revise publicly any forward-looking statements whether because of new information future events or otherwise except as required by securities and other applicable laws
31
Non-GAAP Financial MeasuresThis presentation includes information that does not conform to US GAAP and are considered non-GAAP measures Management uses these measures internally for planning forecasting and evaluating the performance of the Companys segments including allocating resources Dows management believes that these non-GAAP measures best reflect the ongoing performance of the Company during the periods presented and provide more relevant and meaningful information to investors as they provide insight with respect to ongoing operating results of the Company and a more useful comparison of year-over-year results These non-GAAP measures supplement the Companys US GAAP disclosures and should not be viewed as alternatives to US GAAP measures of performance Furthermore such non-GAAP measures may not be consistent with similar measures provided or used by other companies Dow does not provide forward-looking US GAAP financial measures or a reconciliation of forward-looking non-GAAP financial measures to the most comparable US GAAP financial measures on a forward-looking basis because the Company is unable to predict with reasonable certainty the ultimate outcome of pending litigation unusual gains and losses foreign currency exchange gains or losses and potential future asset impairments as well as discrete taxable events without unreasonable effort These items are uncertain depend on various factors and could have a material impact on US GAAP results for the guidance period
TrademarksThe Dow Diamond logo and all products unless otherwise noted denoted with trade or reg are trademarks service marks or registered trademarks of The Dow Chemical Company or its respective subsidiaries or affiliates Solely for convenience the trademarks service marks and trade names referred to in this communication may appear without the trade or reg symbols but such references are not intended to indicate in any way that we will not assert to the fullest extent under applicable law our rights or the right of the applicable licensor to these trademarks service marks and trade names This presentation may also contain trademarks service marks and trade names of certain third parties which are the property of their respective owners Our use or display of third partiesrsquo trademarks service marks trade names or products in this communication is not intended to and should not be read to imply a relationship with or endorsement or sponsorship of us
DefinitionsOperating EBIT is defined as earnings (ie ldquoIncome (loss) from continuing operations before taxesrdquo) before interest excluding the impact of significant itemsOperating EBITDA is defined as earnings (ie ldquoIncome (loss) from continuing operations before taxesrdquo) before interest depreciation and amortization excluding the impact of significant itemsOperating EBIT Margin is defined as Operating EBIT divided by net salesAdjusted Operating EBIT is defined as Operating EBIT less equity earningsAdjusted Operating EBIT Margin is defined as Operating EBIT less equity earnings divided by net salesAdjusted Operating EBITDA is defined as Operating EBITDA less equity earningsAdjusted Operating EBITDA Margin is defined as Adjusted Operating EBITDA divided by net sales excluding certain transactions with nonconsolidated affiliates Operating earnings per share is defined as Earnings (loss) per common share from continuing operations - dilutedldquo excluding the after-tax impact of significant items Operational Tax Rate is defined as the effective tax rate (ie GAAP ldquoProvision for income taxesrdquo divided by ldquoIncome (loss) from continuing operations before income taxesrdquo) excluding the impact of significant itemsFree cash flow (FCF) is defined as ldquoCash provided by (used for) operating activities - continuing operationsrdquo less capital expenditures Under this definition free cash flow represents the cash generated by the Company from operations after investing in its asset base Free cash flow combined with cash balances and other sources of liquidity represent the cash available to fund obligations and provide returns to shareholders Free cash flow is an integral financial measure used in the Companys financial planning processFree Cash Flow Yield is defined as Free cash flow divided by market capitalizationShareholder Remuneration is defined as Dividends paid to stockholders plus Purchases of treasury stockShareholder Yield is defined as Shareholder Remuneration divided by market capitalizationCash Flow Conversion is defined as ldquoCash provided by (used for) operating activities ndash continuing operationsrdquo divided by Operating EBITDA or Pro Forma Operating EBITDA Management believes cash flow conversion is an important financial metric as it helps the Company determine how efficiently it is converting its earnings to cash flowFree cash conversion is defined as Adjusted Operating EBITDA less capital expenditures divided by Adjusted Operating EBITDANet Debt is defined as ldquoNotes payablerdquo plus ldquoLong-term debt due within one yearrdquo plus ldquoLong-term debtrdquo less ldquoCash and cash equivalentsrdquo and ldquoMarketable securitiesrdquoKuwait Joint Ventures (JVs) refers to EQUATE Petrochemical Company KSCC The Kuwait Olefins Company KSCC and The Kuwait Styrene Company KSCCThai Joint Ventures (JVs) refers to Map Ta Phut Olefins Company Limited and The SCG-Dow Group (Siam Polyethylene Company Limited Siam Polystyrene Company Limited Siam Styrene Monomer Co Ltd Siam Synthetic Latex Company Limited)
1 Free cash flow is defined as Cash provided by (used for) operating activities - continuing operations less capital expenditures Under this definition free cash flow represents the cash generated by the Company from operations after investing in its asset base Free cash flow combined with cash balances and other sources of liquidity represent the cash available to fund obligations and provide returns to shareholders Free cash flow is an integral financial measure used in the Companys financial planning process
Net Sales by Segment
Three Months EndedDec 31 2020
Three Months Ended
In millions (Unaudited)
March 31 2021
March 31 2020
Packaging amp Specialty Plastics
$ 5126
$ 6082
$ 4609
Industrial Intermediates amp Infrastructure
3501
3607
3045
Performance Materials amp Coatings
2029
2123
2065
Corporate
50
70
51
Total
$ 10706
$ 11882
9770
Operating EBIT by Segment
Three Months EndedDec 31 2020
Three Months Ended
In millions (Unaudited)
March 31 2021
March 31 2020
Packaging amp Specialty Plastics
$ 780
$ 1228
$ 580
Industrial Intermediates amp Infrastructure
296
326
175
Performance Materials amp Coatings
50
62
162
Corporate
(72)
(62)
(74)
Total
$ 1054
$ 1554
843
Equity in Earnings (Losses) of Nonconsolidated Affiliates by Segment
Three Months EndedDec 31 2020
Three Months Ended
In millions (Unaudited)
March 31 2021
March 31 2020
Packaging amp Specialty Plastics
$ 77
$ 106
$ 5
Industrial Intermediates amp Infrastructure
36
115
(76)
Performance Materials amp Coatings
2
2
1
Corporate
(9)
1
(19)
Total
$ 106
$ 224
(89)
Adjusted Operating EBIT by Segment
Three Months EndedDec 31 2020
Three Months Ended
In millions (Unaudited)
March 31 2021
March 31 2020
Packaging amp Specialty Plastics
$ 703
$ 1122
$ 575
Industrial Intermediates amp Infrastructure
260
211
251
Performance Materials amp Coatings
48
60
161
Corporate
(63)
(63)
(55)
Total
$ 948
$ 1330
932
Operating Margin by Segment
Three Months EndedDec 31 2020
Three Months Ended
In millions (Unaudited)
March 31 2021
March 31 2020
Packaging amp Specialty Plastics
152
202
126
Industrial Intermediates amp Infrastructure
85
90
57
Performance Materials amp Coatings
25
29
78
Total
98
131
86
Adjusted Operating EBIT Margin by Segment
Three Months EndedDec 31 2020
Three Months Ended
In millions (Unaudited)
March 31 2021
March 31 2020
Packaging amp Specialty Plastics
137
184
125
Industrial Intermediates amp Infrastructure
74
58
82
Performance Materials amp Coatings
24
28
78
Total
89
112
95
Reconciliation of Income (loss) from continuing operations net of tax to Operating EBIT and Operating EBITDA
Three Months Ended
Nine Months Ended
March 31 2020
June 30 2020
September 30 2020
December 31 2020
March 31 2021
September 30 2020
September 30 2019
In millions (Unaudited)
As Reported
Pro Forma
Income (loss) from continuing operations net of tax
$ 258
$ (217)
$ (1)
$ 1254
$ 1006
$ 1006
$ 258
+ Provision for income taxes on continuing operations
138
34
43
562
317
317
138
Income (loss) from continuing operations before income taxes
$ 396
$ (183)
$ 42
$ 1816
$ 1323
$ 1323
$ 396
- Interest income
15
6
6
11
8
8
15
+ Interest expense and amortization of debt discount
1 Operating EBIT is defined as earnings (ie Income (loss) from continuing operations before income taxes) before interest excluding the impact of significant items
2 Operating EBITDA is defined as earnings (ie Income (loss) from continuing operations before income taxes) before interest depreciation and amortization excluding the impact of significant items
Significant Items Impacting Results for the Three Months Ended Mar 31 2021
In millions except per share amounts (Unaudited)
Pretax 1
Net Income 2
EPS 3
Reported results
$ 1323
$ 991
$ 132
Less Significant items
Restructuring implementation costs
(10)
(8)
(001)
Digitalization program costs
(33)
(25)
(003)
Total significant items
$ (43)
$ (33)
$ (004)
Operating results (non-GAAP)
$ 1366
$ 1024
$ 136
Significant Items Impacting Results for the Three Months Ended Mar 31 2020
In millions except per share amounts (Unaudited)
Pretax 1
Net Income 2
EPS 3
Reported results
$ 396
$ 239
$ 032
Less Significant items
Integration and separation costs
(65)
(51)
(007)
Restructuring and asset related charges - net
(96)
(79)
(011)
Loss on early extinguishment of debt
(86)
(70)
(009)
Total significant items
$ (247)
$ (200)
$ (027)
Operating results (non-GAAP)
$ 643
$ 439
$ 059
1 Income before income taxes
2 Net income (loss) available for Dow Inc common stockholders The income tax effect on significant items was calculated based upon the enacted tax laws and statutory income tax rates applicable in the tax jurisdiction(s) of the underlying non-GAAP adjustment
1 Free cash flow is defined as Cash provided by (used for) operating activities - continuing operations less capital expenditures Under this definition free cash flow represents the cash generated by the Company from operations after investing in its asset base Free cash flow combined with cash balances and other sources of liquidity represent the cash available to fund obligations and provide returns to shareholders Free cash flow is an integral financial measure used in the Companys financial planning process
2 Free cash flow in the first quarter of 2021 reflects a $1 billion elective pension contribution
Net Sales by Segment
Three Months EndedDec 31 2020
Three Months Ended
In millions (Unaudited)
March 31 2021
March 31 2020
Packaging amp Specialty Plastics
$ 5126
$ 6082
$ 4609
Industrial Intermediates amp Infrastructure
3501
3607
3045
Performance Materials amp Coatings
2029
2123
2065
Corporate
50
70
51
Total
$ 10706
$ 11882
9770
Operating EBIT by Segment
Three Months EndedDec 31 2020
Three Months Ended
In millions (Unaudited)
March 31 2021
March 31 2020
Packaging amp Specialty Plastics
$ 780
$ 1228
$ 580
Industrial Intermediates amp Infrastructure
296
326
175
Performance Materials amp Coatings
50
62
162
Corporate
(72)
(62)
(74)
Total
$ 1054
$ 1554
843
Equity in Earnings (Losses) of Nonconsolidated Affiliates by Segment
Three Months EndedDec 31 2020
Three Months Ended
In millions (Unaudited)
March 31 2021
March 31 2020
Packaging amp Specialty Plastics
$ 77
$ 106
$ 5
Industrial Intermediates amp Infrastructure
36
115
(76)
Performance Materials amp Coatings
2
2
1
Corporate
(9)
1
(19)
Total
$ 106
$ 224
(89)
Adjusted Operating EBIT by Segment
Three Months EndedDec 31 2020
Three Months Ended
In millions (Unaudited)
March 31 2021
March 31 2020
Packaging amp Specialty Plastics
$ 703
$ 1122
$ 575
Industrial Intermediates amp Infrastructure
260
211
251
Performance Materials amp Coatings
48
60
161
Corporate
(63)
(63)
(55)
Total
$ 948
$ 1330
932
Operating Margin by Segment
Three Months EndedDec 31 2020
Three Months Ended
In millions (Unaudited)
March 31 2021
March 31 2020
Packaging amp Specialty Plastics
152
202
126
Industrial Intermediates amp Infrastructure
85
90
57
Performance Materials amp Coatings
25
29
78
Total
98
131
86
Adjusted Operating EBIT Margin by Segment
Three Months EndedDec 31 2020
Three Months Ended
In millions (Unaudited)
March 31 2021
March 31 2020
Packaging amp Specialty Plastics
137
184
125
Industrial Intermediates amp Infrastructure
74
58
82
Performance Materials amp Coatings
24
28
78
Total
89
112
95
Reconciliation of Income (loss) from continuing operations net of tax to Operating EBIT and Operating EBITDA
Three Months Ended
Nine Months Ended
March 31 2020
June 30 2020
September 30 2020
December 31 2020
March 31 2021
September 30 2020
September 30 2019
In millions (Unaudited)
As Reported
Pro Forma
Income (loss) from continuing operations net of tax
$ 258
$ (217)
$ (1)
$ 1254
$ 1006
$ 1006
$ 258
+ Provision for income taxes on continuing operations
138
34
43
562
317
317
138
Income (loss) from continuing operations before income taxes
$ 396
$ (183)
$ 42
$ 1816
$ 1323
$ 1323
$ 396
- Interest income
15
6
6
11
8
8
15
+ Interest expense and amortization of debt discount
1 Operating EBIT is defined as earnings (ie Income (loss) from continuing operations before income taxes) before interest excluding the impact of significant items
2 Operating EBITDA is defined as earnings (ie Income (loss) from continuing operations before income taxes) before interest depreciation and amortization excluding the impact of significant items
Significant Items Impacting Results for the Three Months Ended Mar 31 2021
In millions except per share amounts (Unaudited)
Pretax 1
Net Income 2
EPS 3
Reported results
$ 1323
$ 991
$ 132
Less Significant items
Restructuring implementation costs
(10)
(8)
(001)
Digitalization program costs
(33)
(25)
(003)
Total significant items
$ (43)
$ (33)
$ (004)
Operating results (non-GAAP)
$ 1366
$ 1024
$ 136
Significant Items Impacting Results for the Three Months Ended Mar 31 2020
In millions except per share amounts (Unaudited)
Pretax 1
Net Income 2
EPS 3
Reported results
$ 396
$ 239
$ 032
Less Significant items
Integration and separation costs
(65)
(51)
(007)
Restructuring and asset related charges - net
(96)
(79)
(011)
Loss on early extinguishment of debt
(86)
(70)
(009)
Total significant items
$ (247)
$ (200)
$ (027)
Operating results (non-GAAP)
$ 643
$ 439
$ 059
1 Income before income taxes
2 Net income available for Dow Inc common stockholders The income tax effect on significant items was calculated based upon the enacted tax laws and statutory income tax rates applicable in the tax jurisdiction(s) of the underlying non-GAAP adjustment
1 Free cash flow is defined as Cash provided by (used for) operating activities - continuing operations less capital expenditures Under this definition free cash flow represents the cash generated by the Company from operations after investing in its asset base Free cash flow combined with cash balances and other sources of liquidity represent the cash available to fund obligations and provide returns to shareholders Free cash flow is an integral financial measure used in the Companys financial planning process
Net Sales by Segment
Three Months EndedDec 31 2020
Three Months Ended
In millions (Unaudited)
March 31 2021
March 31 2020
Packaging amp Specialty Plastics
$ 5126
$ 6082
$ 4609
Industrial Intermediates amp Infrastructure
3501
3607
3045
Performance Materials amp Coatings
2029
2123
2065
Corporate
50
70
51
Total
$ 10706
$ 11882
9770
Operating EBIT by Segment
Three Months EndedDec 31 2020
Three Months Ended
In millions (Unaudited)
March 31 2021
March 31 2020
Packaging amp Specialty Plastics
$ 780
$ 1228
$ 580
Industrial Intermediates amp Infrastructure
296
326
175
Performance Materials amp Coatings
50
62
162
Corporate
(72)
(62)
(74)
Total
$ 1054
$ 1554
843
Equity in Earnings (Losses) of Nonconsolidated Affiliates by Segment
Three Months EndedDec 31 2020
Three Months Ended
In millions (Unaudited)
March 31 2021
March 31 2020
Packaging amp Specialty Plastics
$ 77
$ 106
$ 5
Industrial Intermediates amp Infrastructure
36
115
(76)
Performance Materials amp Coatings
2
2
1
Corporate
(9)
1
(19)
Total
$ 106
$ 224
(89)
Adjusted Operating EBIT by Segment
Three Months EndedDec 31 2020
Three Months Ended
In millions (Unaudited)
March 31 2021
March 31 2020
Packaging amp Specialty Plastics
$ 703
$ 1122
$ 575
Industrial Intermediates amp Infrastructure
260
211
251
Performance Materials amp Coatings
48
60
161
Corporate
(63)
(63)
(55)
Total
$ 948
$ 1330
932
Operating Margin by Segment
Three Months EndedDec 31 2020
Three Months Ended
In millions (Unaudited)
March 31 2021
March 31 2020
Packaging amp Specialty Plastics
152
202
126
Industrial Intermediates amp Infrastructure
85
90
57
Performance Materials amp Coatings
25
29
78
Total
98
131
86
Adjusted Operating EBIT Margin by Segment
Three Months EndedDec 31 2020
Three Months Ended
In millions (Unaudited)
March 31 2021
March 31 2020
Packaging amp Specialty Plastics
137
184
125
Industrial Intermediates amp Infrastructure
74
58
82
Performance Materials amp Coatings
24
28
78
Total
89
112
95
Reconciliation of Income (loss) from continuing operations net of tax to Operating EBIT and Operating EBITDA
Three Months Ended
Nine Months Ended
March 31 2020
June 30 2020
September 30 2020
December 31 2020
March 31 2021
September 30 2020
September 30 2019
In millions (Unaudited)
As Reported
Pro Forma
Income (loss) from continuing operations net of tax
$ 258
$ (217)
$ (1)
$ 1254
$ 1006
$ 1006
$ 258
+ Provision for income taxes on continuing operations
138
34
43
562
317
317
138
Income (loss) from continuing operations before income taxes
$ 396
$ (183)
$ 42
$ 1816
$ 1323
$ 1323
$ 396
- Interest income
15
6
6
11
8
8
15
+ Interest expense and amortization of debt discount
1 Operating EBIT is defined as earnings (ie Income (loss) from continuing operations before income taxes) before interest excluding the impact of significant items
2 Operating EBITDA is defined as earnings (ie Income (loss) from continuing operations before income taxes) before interest depreciation and amortization excluding the impact of significant items
Significant Items Impacting Results for the Three Months Ended Mar 31 2021
In millions except per share amounts (Unaudited)
Pretax 1
Net Income 2
EPS 3
Reported results
$ 1323
$ 991
$ 132
Less Significant items
Restructuring implementation costs
(10)
(8)
(001)
Digitalization program costs
(33)
(25)
(003)
Total significant items
$ (43)
$ (33)
$ (004)
Operating results (non-GAAP)
$ 1366
$ 1024
$ 136
Significant Items Impacting Results for the Three Months Ended Mar 31 2020
In millions except per share amounts (Unaudited)
Pretax 1
Net Income 2
EPS 3
Reported results
$ 396
$ 239
$ 032
Less Significant items
Integration and separation costs
(65)
(51)
(007)
Restructuring and asset related charges - net
(96)
(79)
(011)
Loss on early extinguishment of debt
(86)
(70)
(009)
Total significant items
$ (247)
$ (200)
$ (027)
Operating results (non-GAAP)
$ 643
$ 439
$ 059
1 Income before income taxes
2 Net income (loss) available for Dow Inc common stockholders The income tax effect on significant items was calculated based upon the enacted tax laws and statutory income tax rates applicable in the tax jurisdiction(s) of the underlying non-GAAP adjustment
1 Free cash flow is defined as Cash provided by (used for) operating activities - continuing operations less capital expenditures Under this definition free cash flow represents the cash generated by the Company from operations after investing in its asset base Free cash flow combined with cash balances and other sources of liquidity represent the cash available to fund obligations and provide returns to shareholders Free cash flow is an integral financial measure used in the Companys financial planning process
Net Sales by Segment
Three Months EndedDec 31 2020
Three Months Ended
In millions (Unaudited)
March 31 2021
March 31 2020
Packaging amp Specialty Plastics
$ 5126
$ 6082
$ 4609
Industrial Intermediates amp Infrastructure
3501
3607
3045
Performance Materials amp Coatings
2029
2123
2065
Corporate
50
70
51
Total
$ 10706
$ 11882
9770
Operating EBIT by Segment
Three Months EndedDec 31 2020
Three Months Ended
In millions (Unaudited)
March 31 2021
March 31 2020
Packaging amp Specialty Plastics
$ 780
$ 1228
$ 580
Industrial Intermediates amp Infrastructure
296
326
175
Performance Materials amp Coatings
50
62
162
Corporate
(72)
(62)
(74)
Total
$ 1054
$ 1554
843
Equity in Earnings (Losses) of Nonconsolidated Affiliates by Segment
Three Months EndedDec 31 2020
Three Months Ended
In millions (Unaudited)
March 31 2021
March 31 2020
Packaging amp Specialty Plastics
$ 77
$ 106
$ 5
Industrial Intermediates amp Infrastructure
36
115
(76)
Performance Materials amp Coatings
2
2
1
Corporate
(9)
1
(19)
Total
$ 106
$ 224
(89)
Adjusted Operating EBIT by Segment
Three Months EndedDec 31 2020
Three Months Ended
In millions (Unaudited)
March 31 2021
March 31 2020
Packaging amp Specialty Plastics
$ 703
$ 1122
$ 575
Industrial Intermediates amp Infrastructure
260
211
251
Performance Materials amp Coatings
48
60
161
Corporate
(63)
(63)
(55)
Total
$ 948
$ 1330
932
Operating Margin by Segment
Three Months EndedDec 31 2020
Three Months Ended
In millions (Unaudited)
March 31 2021
March 31 2020
Packaging amp Specialty Plastics
152
202
126
Industrial Intermediates amp Infrastructure
85
90
57
Performance Materials amp Coatings
25
29
78
Total
98
131
86
Adjusted Operating EBIT Margin by Segment
Three Months EndedDec 31 2020
Three Months Ended
In millions (Unaudited)
March 31 2021
March 31 2020
Packaging amp Specialty Plastics
137
184
125
Industrial Intermediates amp Infrastructure
74
58
82
Performance Materials amp Coatings
24
28
78
Total
89
112
95
Reconciliation of Income (loss) from continuing operations net of tax to Operating EBIT and Operating EBITDA
Three Months Ended
Nine Months Ended
March 31 2020
June 30 2020
September 30 2020
December 31 2020
March 31 2021
September 30 2020
September 30 2019
In millions (Unaudited)
As Reported
Pro Forma
Income (loss) from continuing operations net of tax
$ 258
$ (217)
$ (1)
$ 1254
$ 1006
$ 1006
$ 258
+ Provision for income taxes on continuing operations
138
34
43
562
317
317
138
Income (loss) from continuing operations before income taxes
$ 396
$ (183)
$ 42
$ 1816
$ 1323
$ 1323
$ 396
- Interest income
15
6
6
11
8
8
15
+ Interest expense and amortization of debt discount
1 Operating EBIT is defined as earnings (ie Income (loss) from continuing operations before income taxes) before interest excluding the impact of significant items
2 Operating EBITDA is defined as earnings (ie Income (loss) from continuing operations before income taxes) before interest depreciation and amortization excluding the impact of significant items
Significant Items Impacting Results for the Three Months Ended Mar 31 2021
In millions except per share amounts (Unaudited)
Pretax 1
Net Income 2
EPS 3
Reported results
$ 1323
$ 991
$ 132
Less Significant items
Restructuring implementation costs
(10)
(8)
(001)
Digitalization program costs
(33)
(25)
(003)
Total significant items
$ (43)
$ (33)
$ (004)
Operating results (non-GAAP)
$ 1366
$ 1024
$ 136
Significant Items Impacting Results for the Three Months Ended Mar 31 2020
In millions except per share amounts (Unaudited)
Pretax 1
Net Income 2
EPS 3
Reported results
$ 396
$ 239
$ 032
Less Significant items
Integration and separation costs
(65)
(51)
(007)
Restructuring and asset related charges - net
(96)
(79)
(011)
Loss on early extinguishment of debt
(86)
(70)
(009)
Total significant items
$ (247)
$ (200)
$ (027)
Operating results (non-GAAP)
$ 643
$ 439
$ 059
1 Income before income taxes
2 Net income (loss) available for Dow Inc common stockholders The income tax effect on significant items was calculated based upon the enacted tax laws and statutory income tax rates applicable in the tax jurisdiction(s) of the underlying non-GAAP adjustment
1 Free cash flow is defined as Cash provided by (used for) operating activities - continuing operations less capital expenditures Under this definition free cash flow represents the cash generated by the Company from operations after investing in its asset base Free cash flow combined with cash balances and other sources of liquidity represent the cash available to fund obligations and provide returns to shareholders Free cash flow is an integral financial measure used in the Companys financial planning process
2 Free cash flow in the first quarter of 2021 reflects a $1 billion elective pension contribution
Net Sales by Segment
Three Months EndedDec 31 2020
Three Months Ended
In millions (Unaudited)
March 31 2021
March 31 2020
Packaging amp Specialty Plastics
$ 5126
$ 6082
$ 4609
Industrial Intermediates amp Infrastructure
3501
3607
3045
Performance Materials amp Coatings
2029
2123
2065
Corporate
50
70
51
Total
$ 10706
$ 11882
9770
Operating EBIT by Segment
Three Months EndedDec 31 2020
Three Months Ended
In millions (Unaudited)
March 31 2021
March 31 2020
Packaging amp Specialty Plastics
$ 780
$ 1228
$ 580
Industrial Intermediates amp Infrastructure
296
326
175
Performance Materials amp Coatings
50
62
162
Corporate
(72)
(62)
(74)
Total
$ 1054
$ 1554
843
Equity in Earnings (Losses) of Nonconsolidated Affiliates by Segment
Three Months EndedDec 31 2020
Three Months Ended
In millions (Unaudited)
March 31 2021
March 31 2020
Packaging amp Specialty Plastics
$ 77
$ 106
$ 5
Industrial Intermediates amp Infrastructure
36
115
(76)
Performance Materials amp Coatings
2
2
1
Corporate
(9)
1
(19)
Total
$ 106
$ 224
(89)
Adjusted Operating EBIT by Segment
Three Months EndedDec 31 2020
Three Months Ended
In millions (Unaudited)
March 31 2021
March 31 2020
Packaging amp Specialty Plastics
$ 703
$ 1122
$ 575
Industrial Intermediates amp Infrastructure
260
211
251
Performance Materials amp Coatings
48
60
161
Corporate
(63)
(63)
(55)
Total
$ 948
$ 1330
932
Operating Margin by Segment
Three Months EndedDec 31 2020
Three Months Ended
In millions (Unaudited)
March 31 2021
March 31 2020
Packaging amp Specialty Plastics
152
202
126
Industrial Intermediates amp Infrastructure
85
90
57
Performance Materials amp Coatings
25
29
78
Total
98
131
86
Adjusted Operating EBIT Margin by Segment
Three Months EndedDec 31 2020
Three Months Ended
In millions (Unaudited)
March 31 2021
March 31 2020
Packaging amp Specialty Plastics
137
184
125
Industrial Intermediates amp Infrastructure
74
58
82
Performance Materials amp Coatings
24
28
78
Total
89
112
95
Reconciliation of Net income (loss) to Operating EBIT and Operating EBITDA
Three Months Ended
Nine Months Ended
March 31 2020
June 30 2020
September 30 2020
December 31 2020
March 31 2021
September 30 2020
September 30 2019
In millions (Unaudited)
As Reported
Pro Forma
Net income (loss)
$ 258
$ (217)
$ (1)
$ 1254
$ 1006
$ 1006
$ 258
+ Provision for income taxes
138
34
43
562
317
317
138
Income (loss) before income taxes
$ 396
$ (183)
$ 42
$ 1816
$ 1323
$ 1323
$ 396
- Interest income
15
6
6
11
8
8
15
+ Interest expense and amortization of debt discount
1 Operating EBIT is defined as earnings (ie Income (loss) before income taxes) before interest excluding the impact of significant items
2 Operating EBITDA is defined as earnings (ie Income (loss) before income taxes) before interest depreciation and amortization excluding the impact of significant items
Significant Items Impacting Results for the Three Months Ended Mar 31 2021
In millions except per share amounts (Unaudited)
Pretax 1
Net Income 2
EPS 3
Reported results
$ 1323
$ 991
$ 132
Less Significant items
Restructuring implementation costs
(10)
(8)
(001)
Digitalization program costs
(33)
(25)
(003)
Total significant items
$ (43)
$ (33)
$ (004)
Operating results (non-GAAP)
$ 1366
$ 1024
$ 136
Significant Items Impacting Results for the Three Months Ended Mar 31 2020
In millions except per share amounts (Unaudited)
Pretax 1
Net Income 2
EPS 3
Reported results
$ 396
$ 239
$ 032
Less Significant items
Integration and separation costs
(65)
(51)
(007)
Restructuring and asset related charges - net
(96)
(79)
(011)
Loss on early extinguishment of debt
(86)
(70)
(009)
Total significant items
$ (247)
$ (200)
$ (027)
Operating results (non-GAAP)
$ 643
$ 439
$ 059
1 Income before income taxes
2 Net income available for Dow Inc common stockholders The income tax effect on significant items was calculated based upon the enacted tax laws and statutory income tax rates applicable in the tax jurisdiction(s) of the underlying non-GAAP adjustment
1 Free cash flow is defined as Cash provided by (used for) operating activities - continuing operations less capital expenditures Under this definition free cash flow represents the cash generated by the Company from operations after investing in its asset base Free cash flow combined with cash balances and other sources of liquidity represent the cash available to fund obligations and provide returns to shareholders Free cash flow is an integral financial measure used in the Companys financial planning process
Net Sales by Segment
Three Months EndedDec 31 2020
Three Months Ended
In millions (Unaudited)
March 31 2021
March 31 2020
Packaging amp Specialty Plastics
$ 5126
$ 6082
$ 4609
Industrial Intermediates amp Infrastructure
3501
3607
3045
Performance Materials amp Coatings
2029
2123
2065
Corporate
50
70
51
Total
$ 10706
$ 11882
9770
Operating EBIT by Segment
Three Months EndedDec 31 2020
Three Months Ended
In millions (Unaudited)
March 31 2021
March 31 2020
Packaging amp Specialty Plastics
$ 780
$ 1228
$ 580
Industrial Intermediates amp Infrastructure
296
326
175
Performance Materials amp Coatings
50
62
162
Corporate
(72)
(62)
(74)
Total
$ 1054
$ 1554
843
Equity in Earnings (Losses) of Nonconsolidated Affiliates by Segment
Three Months EndedDec 31 2020
Three Months Ended
In millions (Unaudited)
March 31 2021
March 31 2020
Packaging amp Specialty Plastics
$ 77
$ 106
$ 5
Industrial Intermediates amp Infrastructure
36
115
(76)
Performance Materials amp Coatings
2
2
1
Corporate
(9)
1
(19)
Total
$ 106
$ 224
(89)
Adjusted Operating EBIT by Segment
Three Months EndedDec 31 2020
Three Months Ended
In millions (Unaudited)
March 31 2021
March 31 2020
Packaging amp Specialty Plastics
$ 703
$ 1122
$ 575
Industrial Intermediates amp Infrastructure
260
211
251
Performance Materials amp Coatings
48
60
161
Corporate
(63)
(63)
(55)
Total
$ 948
$ 1330
932
Operating Margin by Segment
Three Months EndedDec 31 2020
Three Months Ended
In millions (Unaudited)
March 31 2021
March 31 2020
Packaging amp Specialty Plastics
152
202
126
Industrial Intermediates amp Infrastructure
85
90
57
Performance Materials amp Coatings
25
29
78
Total
98
131
86
Adjusted Operating EBIT Margin by Segment
Three Months EndedDec 31 2020
Three Months Ended
In millions (Unaudited)
March 31 2021
March 31 2020
Packaging amp Specialty Plastics
137
184
125
Industrial Intermediates amp Infrastructure
74
58
82
Performance Materials amp Coatings
24
28
78
Total
89
112
95
Reconciliation of Income (loss) from continuing operations net of tax to Operating EBIT and Operating EBITDA
Three Months Ended
Nine Months Ended
March 31 2020
June 30 2020
September 30 2020
December 31 2020
March 31 2021
September 30 2020
September 30 2019
In millions (Unaudited)
As Reported
Pro Forma
Income (loss) from continuing operations net of tax
$ 258
$ (217)
$ (1)
$ 1254
$ 1006
$ 1006
$ 258
+ Provision for income taxes on continuing operations
138
34
43
562
317
317
138
Income (loss) from continuing operations before income taxes
$ 396
$ (183)
$ 42
$ 1816
$ 1323
$ 1323
$ 396
- Interest income
15
6
6
11
8
8
15
+ Interest expense and amortization of debt discount
1 Operating EBIT is defined as earnings (ie Income (loss) from continuing operations before income taxes) before interest excluding the impact of significant items
2 Operating EBITDA is defined as earnings (ie Income (loss) from continuing operations before income taxes) before interest depreciation and amortization excluding the impact of significant items
Significant Items Impacting Results for the Three Months Ended Mar 31 2021
In millions except per share amounts (Unaudited)
Pretax 1
Net Income 2
EPS 3
Reported results
$ 1323
$ 991
$ 132
Less Significant items
Restructuring implementation costs
(10)
(8)
(001)
Digitalization program costs
(33)
(25)
(003)
Total significant items
$ (43)
$ (33)
$ (004)
Operating results (non-GAAP)
$ 1366
$ 1024
$ 136
Significant Items Impacting Results for the Three Months Ended Mar 31 2020
In millions except per share amounts (Unaudited)
Pretax 1
Net Income 2
EPS 3
Reported results
$ 396
$ 239
$ 032
Less Significant items
Integration and separation costs
(65)
(51)
(007)
Restructuring and asset related charges - net
(96)
(79)
(011)
Loss on early extinguishment of debt
(86)
(70)
(009)
Total significant items
$ (247)
$ (200)
$ (027)
Operating results (non-GAAP)
$ 643
$ 439
$ 059
1 Income before income taxes
2 Net income available for Dow Inc common stockholders The income tax effect on significant items was calculated based upon the enacted tax laws and statutory income tax rates applicable in the tax jurisdiction(s) of the underlying non-GAAP adjustment