Embed Size (px)
Citation preview

Company overview and 1Q2006 management accounts

1
Important informationThis presentation is strictly confidential to the recipient, may not be distributed to the press or any other person, and may not be reproduced in any form. Failure to comply with thisrestriction may constitute a violation of applicable securities laws.This presentation does not constitute or form part of and should not be construed as, an offer to sell or issue or the solicitation of an offer to buy or acquire securities of OJSC “Magnit” (the“Company”) or any of its subsidiaries in any jurisdiction or an inducement to enter into investment activity. No part of this presentation, nor the fact of its distribution, should form the basis of,or be relied on in connection with, any contract or commitment or investment decision whatsoever.The information contained in this presentation has not been independently verified. No representation, warranty or undertaking, express or implied, is made as to, and no reliance should beplaced on, the fairness, accuracy, completeness or correctness of the information or the opinions contained herein. None of the Company, nor any shareholder of the Company, nor any ofits or their affiliates, advisors or representatives shall have any liability whatsoever (in negligence or otherwise) for any loss howsoever arising from any use of this presentation or itscontents or otherwise arising in connection with the presentation.This presentation is intended only for persons having professional experience in matters relating to investments being Relevant Persons (as defined below). Solicitations resulting from thispresentation will only be responded to if the person concerned is a Relevant Person.Neither the presentation nor any copy of it may be taken or transmitted into the United States of America, its territories or possessions, or distributed, directly or indirectly, in the UnitedStates of America, its territories or possessions. Any failure to comply with this restriction may constitute a violation of United States securities laws. The presentation is not an offer ofsecurities for sale in the United States. The Company’s securities have not been and will not be registered under the Securities Act and may not be offered and sold in the United Statesexcept in reliance on an exemption from, or in a transaction not subject to, the registration requirements of the Securities Act.Neither this presentation nor any copy of it may be taken or transmitted into Australia, Canada or Japan or to Canadian persons or to any person in any of those jurisdictions. Any failure tocomply with this restriction may constitute a violation of Australian, Canadian or Japanese securities law. The distribution of this presentation in other jurisdictions may be restricted by lawand persons into whose possession this document comes should inform themselves about, and observe, any such restrictions. The Company has not registered and does not intend toregister any portion the Offering under the applicable securities laws of Canada, Australia or Japan and, subject to certain exceptions, the shares may not be offered or sold within Canada,Australia or Japan or to any national, resident or citizen of Canada, Australia or Japan.This presentation is made to and directed only at persons in the United Kingdom having professional experience in matters relating to investments who fall within the definition of“investment professionals” in Article 19(5) of the Financial Services and Markets Act 2000 (Financial Promotions) Order 2005 (the “Order”), and to those persons to whom it can otherwiselawfully be distributed (such persons being referred to as “Relevant Persons”).Matters discussed in this presentation may constitute forward-looking statements. Forward-looking statements include statements concerning plans, objectives, goals, strategies, futureevents or performance, and underlying assumptions and other statements, which are other than statements of historical facts. The words “believe,” “expect,” “anticipate,” “intends,” “targets,”“estimate,” “forecast,” “project,” “will,” “may,” “should” and similar expressions identify forward-looking statements. Forward-looking statements include statements regarding: strategies,outlook and growth prospects; future plans and potential for future growth; liquidity, capital resources and capital expenditures; growth in demand for products; economic outlook andindustry trends; developments of markets; the impact of regulatory initiatives; and the strength of competitors.The forward-looking statements in this presentation are based upon various assumptions, many of which are based, in turn, upon further assumptions, including without limitation,management's examination of historical operating trends, data contained in our records and other data available from third parties. Although the Company believes that these assumptionswere reasonable when made, these assumptions are inherently subject to significant uncertainties and contingencies which are difficult or impossible to predict and are beyond its controland it may not achieve or accomplish these expectations, beliefs or projections. In addition, important factors that, in the view of the Company, could cause actual results to differ materiallyfrom those discussed in the forward-looking statements include the achievement of the anticipated levels of profitability, growth, cost and synergy of its recent acquisitions, the timelydevelopment and acceptance of new products, the impact of competitive pricing, the ability to obtain necessary regulatory approvals, the condition of the economy and political stability inRussia and the other markets of operations and the impact of general business and global economic conditions.Some of the information in the presentation is still in draft form and has not been legally verified and will only be finalised at the time of the Offering.Neither the Company, nor any of its agents, employees or advisors intend or have any duty or obligation to supplement, amend, update or revise any of the forward-looking statementscontained in this presentation or to update or to keep current any other information contained in this presentation.The information and opinions contained in this document are provided as at the date of this presentation and are subject to change without notice.By attending this presentation and/or accepting a copy of this document, you agree to be bound by the foregoing limitations and conditions.

2
Today Magnit is:� The leading Russian food retailer by sales and number of stores
� 1,574 stores in discounter format as of March 31, 2006
� More than 492 cities and towns in European Russia as of March 31, 2006
� Over 411 thousand sq. m of selling space as of March 31, 2006
� Significant share in discounters
� In-house logistics including 5 distribution centres with total warehousing space of 62 thousand sq. m and over 487
vehicles
� Approximately 34 thousand employees as at March 31, 2006
� Strong centralised management
� 469.3 mn customers in 2005
� 137.9 mn customers in 1Q2006
� Net sales, 1Q2006 - 493,8 mln. USD
Note: * management accounts

3
Strong regional coverage 1Q2006
Volga Federal district:
404 stores
2 Distribution centres
North-Western Federaldistrict:
67 storesCentral Federal district:
396 stores
2 Distribution centres
Southern Federal district:
696 stores
1 Distribution centre
Urals Federal district:
11 stores
Volga; 26%
Southern;44%
Urals; 1%
Central; 25%
North-Western,
4%
Demographical breakdown of store locations
Store portfolio by Federal district
1 million +residents; 9%
500 - 1000thousandresidents;
24%
100-500thousandresidents;
26%
up to 100thousandresidents;
41%
Source: Company data
Source: Company data

4
Assortment selection
12,6%13,0%
13,5%14,3%
28,8%
42,8%64,3%
98,5%
0% 20% 40% 60% 80% 100%
Fresh categories
Salads
Chilled chickenFish
Grilled chicken and meatChilled meat
Bakery
Ready made meals
2,95%
0,90%
1,42%
1,40%
2,32%
3,66%
3,51%
5,79%
7,61%
6,85%
9,83%
15,47%
15,00%
23,29%
0% 5% 10% 15% 20% 25%
Non-core products
Eggs
Other householdgoods
Baby food andinstant meals
Fat products
Fish and fishproducts
Householdchemistry
Bread and flour
Fruit andvegetables
Cosmetics
Confectionary
Dairy products
Meat and meatproducts
Alcohol, soft-drinksand beverages
Assortment structure, 1Q2006Share of stores offering fresh andvalue-added products
Source: Company data
Source: Company data
Assortment correlates with customers’purchasing power
Source: Company data
Dry and frozenproducts,
vegetables, fruit
Shorter life products,salads, grill, bakery
Shorter life products,salads, grill, bakery
Shorter life products,salads, grill, bakery Ready meals, fresh
meatSemi-finished
products, cakes
Semi-finishedproducts, cakes
up to 4000 roubles
4000 - 4500 roubles
4500 - 5000 roubles
5000 + roubles
Mon
thly
hous
ehol
dsp
endi
ngon
food
and
beve
rage
s
Dry and frozenproducts,
vegetables, fruit
Dry and frozenproducts,
vegetables, fruit
Dry and frozenproducts,
vegetables, fruit

5
Suppliers, purchasing and Private Label productsMagnit is the largest customer for many domestic andinternational FMCG producers.
� Over 2,000 suppliers with the 20 largest accounting for less than 20%of purchases
� Weekly Assortment Committee consisting of senior management,purchasing director and category managers approves changes toassortment and suppliers
� Direct purchasing and delivery contracts
� Large national suppliers account for approximately 60% of cost ofgoods sold
� Leveraging scale and wide geographical presence to obtain the bestprices and favourable contract term– Volume discounts– Compensation of external and internal logistics costs– Average credit term in 2005 – 34 days and can be as high as 60 days– for national suppliers– Contract term is typically 1 year– Often can be unilaterally terminated by Magnit with no penalties
� Supplier bonuses– For meeting sales targets– For store promotions– For loyalty
Private Label products are designed to substitute thecheapest SKUs to maximise returns on each metre ofshelving space:
� 519 Private Label SKUs as of 31 March 2006� Private Label products accounted for an 10.42% share of retail
revenue in 1Q2006 and 14.54% of total SKUs� Management’s target is to double the share of Private Label sales
in retail revenue by 2015� Approximately 88.9% of Private Label products are food stuffs� The gross margin of Private Label products is 5-15 percentage
points higher than for similar product categories
162265
508 519
46
10,42%
5,1%6,3%
8,2%
2,2%
0100200300400500600700
2002 2003 2004 2005 1q20060,0%
2,0%
4,0%
6,0%
8,0%
10,0%
12,0%
Number of items Share in retail sales
Share of Private Label products in revenue
Source: Company data

6
Well trained dedicated personnel� As of March 31, 2005, the Group employed approximately
34,186 staff, including:– 26,541 in-store personnel,– 4, 524 people engaged in distribution,– 2,589 people in regional branches and– 532 people employed by head office
� The average age of Magnit employees is approximately 28years
� The gross average monthly salary in 2005 was 8,505roubles, of which approximately 75% was basic salary
� All levels of employees are highly motivated by performance-linked bonuses and incentives
� Key members of the management team own stock� Performance evaluation on a regular basis� Training system provides:� Career development programmes for all levels to ensure
– Lower staff turnover– Increased motivation– Higher productivity
� Personnel training– 48 classrooms for entry level staff training– Managerial training for middle management– Regular meetings and seminars between mid-level managers
to exchange best practices– Coaching for top-management
� Strong corporate culture aimed at increasing loyalty ofemployees– The Company publishes a corporate newspaper every two
months– Team building events to ensure integrity of the team
Average personnel headcount vs averagesalary, 2004-2005
13,33124,870
8,5057,378
05,000
10,00015,00020,00025,00030,000
2004 200501,5003,0004,5006,0007,5009,000
in R
UB
Average headcount Average monthly salary
Source: audited IFRS Financial Statements, Management estimates

7
Summary Magnit store statistics
48664550
1,5008613683796842005
2934177220ClosingsNet openings
New openingsTotalUralsNorth-WesternVolgaCentralSouthern
1
11998
19
1920
2
181999
8
1028
1
272000
125
127153
119
1332001
215
222368
553402702002
242
259610
91141003872003
404
4381,014
262142245502004
74
1031,574
1167404396696
31 Mar 06
Owned; 12%
Leased,88% 1460
1480
1500
1520
1540
1560
1580
2005 1Q2006365000
370000
375000
380000
385000
390000
395000
400000
405000
410000
415000
Number of stores Selling space
Store portfolio as at 31 March 2006
Store openings
Source: Company data
Owned and leased storesbreakdown
Number of stores andSelling space, sq. m
Owned;11,4%
Leased,88,6%
2005 1Q2006

8
Store information
266 258 257 252 255 261
050
100150200250300350400450
2001 2002 2003 2004 2005 1q2006
sq. m
Average selling space per store, 2001-1Q2006
153368
610
1014
1500 1574
0
500
1000
1500
2000
2001 2002 2003 2004 2005 1q2006
387 374 368 365 376 387
050
100150200250300350400450
2001 2002 2003 2004 2005 1q2006
sq m
Total number of stores, 2001-1Q2006 Average total space per store, 2001-1Q2006
Source: Company data
Source: Company data
Source: Company data
9
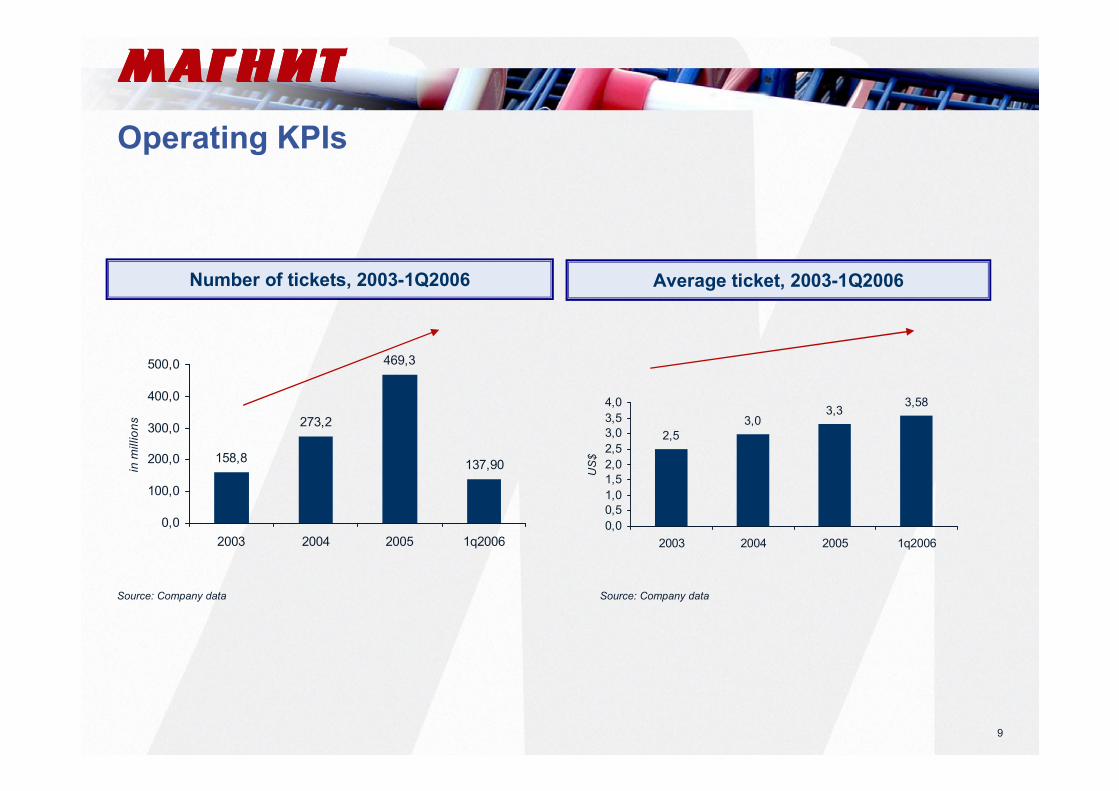
Operating KPIs
2,53,0
3,33,58
0,00,51,01,52,02,53,03,54,0
2003 2004 2005 1q2006
US
$
Average ticket, 2003-1Q2006
158,8
273,2
469,3
137,90
0,0
100,0
200,0
300,0
400,0
500,0
2003 2004 2005 1q2006
in m
illio
ns
Number of tickets, 2003-1Q2006
Source: Company data Source: Company data

10
Regional store performance
484
628
871
757
1,159
737
773
1,053
1,358
1,781
476
813
970
1,031
1,270
1,621
2,195
0 500 1,000 1,500 2,000 2,500
Urals
North-Western***
Central**
Volga
Southern
St. Petersburg
Moscow
US$ thousand per annum
2003 2004 2005
1,969
2,605
3,305
2,901
4,046
3,026
3,310
4,089
4,527
6,097
2,052
3,122
3,877
4,326
4,938
5,415
7,705
0 1,000 2,000 3,000 4,000 5,000 6,000 7,000 8,000
Urals
North-Western***
Central**
Volga
Southern
St. Petersburg
Moscow
$ / per annum
2003 2004 2005
Sales per store*, 2003-2005 Sales per sq. m*, 2003-2005
Source: Company data
Note: * calculated as retail revenue in a year divided by weighted average number of stores andselling space in the same year
** excluding Moscow and Moscow region
*** excluding St. Petersburg and Leningrad region
Source: Company data

11
Improved operating efficiency
1. Increase in number of stores
2. Sales per square metre growth thanks to:
� Traffic growth:– Macroeconomic factors– Increased market share due to outflow of customers from open
markets to discounters– More attractive assortment and pricing– Improved quality of service– Increased attractiveness of stores to consumers
� Ticket growth:– Macroeconomic factors: inflation in consumer basket staples– More expensive SKUs in the assortment
3. Cost efficiencies
� Better terms from suppliers due to growing purchasing power
� Less costly expansion into existing markets with already highrecognition
� Increased efficiency of in-house logistics
� Increased share of Private Label products
� Optimisation of assortment by replacing slow-moving SKUs
� Labour productivity growth
� Streamlined business processes26%232%Effective tax rate
2.3%-0.2%Net margin, %
36.8(1.7)Net income
(13.2)(3.0)Taxes
50.01.3Profit before tax
(12.9)(5.3)Net finance costs
854%62.96.6EBIT
(15.1)(6.1)Depreciation
4.9%1.5%EBITDA margin, %
513%78.012.7EBITDA
(1.3)(3.1)Other income/(expense)
100%(185.5)(92.9)SG&A
16.8%12.8%Gross margin, %
144%264.8108.7Gross profit
77%(1,312.9)(739.8)Cost of goods sold
86%1,577.7848.5Net sales
YoY, %FY 2005FY 2004In US$m
Source: audited IFRS Financial Statements

12
LFL sales analysis
Source: Companies’ data
+11.1%
+13.9%
Tickets perstore, LFL
growth
Averageticket, LFL
growth
LFL revenuegrowth
+26%
Note: for stores opened before July 2003 and not closed down permanently, expanded or downsized by the end of 2005, i.e. 399 stores
Sales dynamics, 2004-2005
813,5
1 552,6
1 014
1 500
0200400600800
1 0001 2001 4001 6001 800
2004 2005
US
$m
02004006008001000120014001600
Num
ber o
f sto
res,
eop
Retail sales Number of stores
Source: Management estimates
LFL 2004 to 2005

13
LFL sales analysis
Source: Companies’ data
+11.11%
+3.91%
Tickets per store, LFLgrowth
Average ticket, LFL growth
LFL revenue growth
+15.45%
Note: for stores opened before July 2003 and not closed down permanently, expanded or downsized by the end of 2005, i.e. 399 stores
LFL 1Q2006 to 1Q2005

14
Gross margin improvement factors
Source: audited IFRS Financial Statements
0%
2%
4%
6%
8%
10%
12%
14%
16%
18%
GM 2004 Tradingmargin
Transportationcosts
Inventoryshortages
Rebates GM 2005
as %
of s
ales
12.8%
+ 3.3%+ 0.4% + 0.4% -0.1% 16.8%

15
Profitability analysis
92.9
185.5
11.8%
10.9%
0
50
100
150
200
2004 2005
SG
&A
exp
ense
s, U
S$
m
0%
3%
6%
9%
12%
15%
as %
of S
ales
12.7
78.0
4.9%
1.5%
0102030405060708090
2004 2005
EB
ITD
A, U
S$
m
0%
1%
2%
3%
4%
5%
6%
EB
ITD
A m
argi
n, %
4.8% 5.7%
2.3%2.6%
1.4%
0.4%1.1%0.9%
1.6%
0.7%0.6%0.5%
0%
2%
4%
6%
8%
10%
12%
2004 2005
as %
of s
ales
Other
Package materials
Repair & maintenance
Pension contributions
Rent & utilities
Payroll and relatedtaxes
Net profit dynamics, 2004-2005
EBITDA dynamics, 2004-2005
Changes in SG&A expense structure
SG&A expense dynamics, 2004-2005
Source: audited IFRS Financial Statements
-1.7
36.8
2.3%
-0.2%
-10
0
10
20
30
40
2004 2005
Net
inco
me,
US
$ m
-1%
0%
1%
1%
2%
2%
3%
Net
mar
gin,
%
Source: audited IFRS Financial Statements
Source: audited IFRS Financial Statements
Source: audited IFRS Financial Statements

16
Summary consolidated balance sheet, 2004-2005
Source: audited IFRS Financial Statements
In US$m 31-Dec-04 31-Dec-05P,P&E 93.9 160.1Intangible assets 0.2 0.4Other non-current assets 0.0 -Total non-current assets 94.1 160.5
Merchandise 77.9 151.3Trade accounts receivable 4.5 1.0Taxes receivable 14.5 19.2Advances paid 6.1 23.6Other receivables 2.8 6.3Short-term investments 0.3 -Cash 19.7 45.8Total current assets 125.8 247.1Total assets 219.9 407.6
Charter capital 0.0 0.0Reserves 1.7 0.1Retained earnings 13.4 49.0Shareholder's equity 15.1 49.2
Long-term loans and borrowings 3.2 79.4Long-term capital leases 0.9 3.5Other long-term liabilities 8.3 11.0Total long-term liabilities 12.4 93.8
Trade accounts payable 108.3 132.2Other accounts payable 10.6 52.5Short-term capital leases 0.6 5.0Short-term loans and borrowings 72.9 74.8Total short-term liabilities 192.5 264.6Total Equity and Liabilities 219.9 407.6

17
Summary consolidated cash flow statement, 2004-2005
Source: audited IFRS Financial Statements
in US$m 2004 2005OPERATING ACTIVITIES:Profit before income tax 1.3 50.0Adjustments for:
Depreciation 6.1 15.1(Loss)/gain on disposal of property, plant and equipment (0.0) 0.1Change in provisions for doubtful receivables 0.5 0.5Other adjustments (0.7) (0.4)Finance costs, net 5.3 12.9
Operating cash flow before movements in working capital 12.4 78.3(Increase)/decrease in working capital 10.3 (30.2)
Cash provided by operations 22.7 48.0Income tax paid (0.3) (3.2)Interest paid (5.3) (11.4)
Net cash provided by operating activities 17.0 33.4
INVESTING ACTIVITIES:Purchase of property, plant and equipment (59.0) (78.3)Purchase of intangible assets (0.2) (0.2)Proceeds on disposal of property, plant and equipment 0.9 1.2Purchase of investments (25.0) (5.6)Proceeds from sale of investments 27.5 5.9Cash cost of shares acquired during the Group reorganization - (1.5)Net cash provided by investing activities (55.8) (78.5)
FINANCING ACTIVITIES:Proceeds from borrowings 384.0 679.3Repayment of borrowings (334.6) (597.9)Payment of bond issue costs - (0.5)Repayment of obligations under financial lease (1.0) (8.6)Net cash from financing activities 48.4 72.4
EFFECT OF FOREIGN EXCHANGE RATES ON CASH AND CASH EQUIVALENTS 0.9 (1.2)
NET INCREASE IN CASH AND CASH EQUIVALENTS 10.5 26.0
CASH AND CASH EQUIVALENTS, beginning of year 9.2 19.7
CASH AND CASH EQUIVALENTS, end of year 19.7 45.8