Embed Size (px)
Citation preview

Erythropoiesis stimulating agent dosing, haemoglobin and ferritin levels in UK haemodialysis patients
2005-2013
Kate Birnie PhD1
Fergus Caskey MD1, 2, 3
Yoav Ben-Shlomo PhD1
Jonathan AC Sterne PhD1
Julie Gilg PhD 2
Dorothea Nitsch MSc MD 4
Charles Tomson FRCP5
1. School of Social and Community Medicine, University of Bristol, Canynge Hall, 39 Whatley Road, Clifton,
Bristol BS8 2PS, UK
2. UK Renal Registry, Southmead Hospital, Bristol, UK
3. Renal Unit, Southmead Hospital, North Bristol NHS Trust, Bristol, UK
4. Department of Non-communicable Disease Epidemiology, London School of Hygiene & Tropical Medicine,
London, UK
5. Department of Renal Medicine, Freeman Hospital, Newcastle upon Tyne, UK
Corresponding author: Dr Kate Birnie, School of Social and Community Medicine, University of Bristol,
Canynge Hall, 39 Whatley Road, Bristol BS8 2PS, UK
Telephone: +44 117 331 4577, fax: +44 117 928 7325, email [email protected]
1

Abstract
Background: Erythropoiesis stimulating agents (ESAs), with intravenous iron supplementation, are the main
treatment for anaemia in patients with chronic kidney disease. Although observational studies suggest better
outcomes for patients who achieve higher haemoglobin (Hb) levels, randomized controlled trials comparing
higher and lower Hb targets have led to safety concerns over higher targets, and to changes in treatment
guidelines.
Methods: Quarterly data from 2005-2013 were obtained on 28,936 haemodialysis patients from the UK
Renal Registry. We examined trends in ESA use and average dose, Hb and ferritin values over time, and Hb
according to the Renal Association guideline range.
Results: Average ESA dose declined over time, with sharper decreases of Erythropoietin epoetin seen
towards the end of 2006, and from 2009. Average Hb for patients on ESAs was 114.1 g/L (95% CI 113.7,
114.6) in the first quarter of 2005, which decreased to 109.6 g/L (95% CI 109.3, 109.9) by the end of 2013.
Average serum ferritin was 353 µg/L (95% CI 345, 360) at the start of 2005, increasing to 386 µg/L (95% CI
380, 392) in the final quarter of 2013. The percentage of patients with Hb in the range of 100-120 g/L
increased from 46.1% at the start of 2005, to 57.6% at the end of 2013.
Conclusions: Anaemia management patterns for haemodialysis patients have changed in the UK between
2005 and 2013. These patterns most likely reflect clinician response to emerging trial evidence and practice
guidelines. Registries play an important role in continued observation of anaemia management and will
monitor further change as new evidence on optimal care emerges.
2

Key words: Anaemia management, Erythropoiesis stimulating agents, ESA, Haemodialysis, Haemoglobin
Short summary: Recent evidence from major clinical trials of erythropoiesis stimulating agents (ESA) raised
safety concerns. We examined trends in ESA dosing, haemoglobin and ferritin levels in over 28,000 UK
haemodialysis patients between 2005 and 2013. Average haemoglobin decreased over time, ferritin levels
increased sharply from 2008-2011, coinciding with decreases in ESA use. These patterns most likely reflect
clinician response to emerging trial evidence and resulting clinical practice guidelines.
Word counts: Abstract 261, Main text 3180, Total 3441
3

Introduction
Nearly 57,000 adult patients were receiving renal replacement therapy (RRT) in the UK at the end of 2013
(prevalence 888/million), and demand for RRT is rising.(1) Anaemia is a common complication for patients
with chronic kidney disease (CKD), resulting in reduced quality of life, fatigue, decreased exercise capacity
and shortness of breath. Erythropoiesis stimulating agents (ESAs) are the main treatment for CKD patients
with anaemia (2) and are effective in correcting and maintaining haemoglobin (Hb) levels and decreasing the
need for blood transfusions. Intravenous iron supplements are an important adjunct in the treatment of
anaemia in patients on haemodialysis.
Even partial treatment of anaemia with ESAs is expensive, and full correction of Hb requires much higher
doses than partial correction. When ESAs were first introduced into clinical practice, randomised controlled
trials were not performed, as it was thought unnecessary and even unethical to leave a control group with
untreated anaemia. However, the question of whether full correction of anaemia is preferable to partial
correction has now been tested in several randomized controlled trials (RCTs). Besarab et al. randomized
haemodialysis patients with cardiovascular co-morbidity to full or partial correction of anaemia: this trial was
terminated early when it became clear that benefit from full correction was highly improbable.(3) The Food
and Drug Administration (FDA) later classified the trial results as showing increased risk of all-cause mortality
for the group randomized to the higher Hb target (4) and a later re-analysis of the full trial report showed no
improvement in quality of life (5) . Three large RCTs in patients with CKD not yet on dialysis have been
completed (6-8) and found no evidence of benefits of a higher (compared with lower) Hb target on
cardiovascular events or a composite outcome of death, myocardial infarction, hospitalisation for congestive
heart failure and stroke, or they found increased risk of adverse events. These conclusions are difficult to
reconcile with data from numerous observational studies which demonstrate that the best outcomes are in
patients who have high Hb concentrations but require only low doses of ESAs (130-140 g/L).(9-11) One
interpretation is that ESA-sensitive patients derive survival benefit from full correction of anaemia, but that
patients with ESA-resistance (which is a predictor of poor survival) may be harmed by the high doses of ESAs
4
prescribed under the trial protocols in the (often unsuccessful) attempt to normalise haemoglobin
concentration.
The target Hb for patients with CKD in the UK Renal Association Clinical Practice Guidelines was >100 g/L
with no suggested maximum in 2002-2007 (3rd edition).(12) These were altered to 105-125 g/L (4th edition
2007-2009) (13) and lowered to 100-120 g/L in the latest version (5th edition published in 2010) (2) following
publication of the RCTs in 2006 (6, 8) and 2009.(7) The impact of these guideline changes on ESA dosing and
hence on achieved Hb levels remains unclear. We therefore examined trends in ESA dosing in UK
haemodialysis patients between 2005 and 2013 and corresponding trends in achieved Hb levels. We related
these trends to changes in the national guidelines for management of anaemia.
Methods
We identified RCTs and treatment guidelines with the potential to affect anaemia management for patients
on haemodialysis during the period 2005-13. These were used to construct a timeline depicting when
changes in management were expected.
The UK Renal Registry (UKRR) collects clinical and biochemical data from all patients aged 18 years or over
receiving renal replacement therapy (RRT) in the UK. Data are extracted electronically, on a quarterly basis,
and are validated and cleaned prior to analysis.(14) Some centres submit data extracts that include ESA
doses. All patients who received haemodialysis in 2005-2013 in centres submitting ESA doses were included
in analyses. Centres reporting fewer than 60% of haemodialysis patients being treated with ESAs were
considered to have incomplete data and their data for that quarter were excluded. Patients from 37 centres
across England, Wales and Northern Ireland were included in the analyses (from a total of 62 centres in
these regions). A patient was considered to be incident during their first year of haemodialysis.
5

Patients were defined as being on an ESA if a drug type (Darboepoietin, Erythropoietin epoetin-alpha, -beta,
or -not otherwise specified, or Methoxy polyethylene glycol-epoetin beta) and/or a dose was recorded. ESA
dose is presented as weekly Erythropoietin epoetin dose in our analysis. Doses of ≤ 150 IU/week (likely to be
Darbepoietin) were harmonised with Erythropoietin epoetin data by multiplying by 200. No adjustments
were made with respect to route or frequency of administration. The measurement of Hb (g/L) that was
closest to the end of the quarter was extracted. Serum ferritin was measured in µg/L. Data were also
extracted on age, sex, race (White, South Asian, Black, Chinese, other, or missing), year of starting renal
replacement therapy and primary renal disease (diabetes, glomerulonephritis, hypertension, polycystic
kidneys, pyelonephritis, renal vascular disease, other or uncertain (15)).
Statistical methods
For each calendar year, we derived descriptive statistics summarising the demographic and clinical
characteristics of the cohort. ESA dose and ferritin were log transformed as they had positively skewed
distributions. The percentage of patients on the different ESA drug types were calculated for each quarter.
To examine trends in anaemia management over time, we calculated geometric mean of ESA dose (with 95%
confidence interval (CI)) per quarter, stratified by drug type ((1)Darboepoietin and (2) Erythropoietin
epoetin-alpha, -beta, or -not otherwise specified; there were not enough numbers to also include a Methoxy
polyethylene glycol-epoetin beta group). The doses were also examined restricting to incident patients.
Mean achieved Hb levels were calculated separately for ESA treated and non-treated patients. We calculated
the proportion of all patients on ESA treatment over time, and the proportion of patients with Hb in the
categories: <100, 100-120 and >120 g/L. Patients were also put into categories according to their ESA status:
those always receiving ESAs over the time period, patients changing on/off ESAs over the time, and those
never receiving ESAs. Trends in these statistics over time were compared with the timeline of events with
the potential to affect anaemia management. All means and proportions were standardized by year using
direct standardization, according to the age, sex, race and primary renal disease distribution for all years of
data combined. The numbers with missing values for these factors were reported and people with missing
6

values were excluded from analyses. We carried out a sensitivity analysis including only the 21 centres that
contributed data for all years. All analyses were carried out using StataTM version 13.
Results
Timeline of events that may have impacted on anaemia management
Events that may have impacted on anaemia management in the UK are summarized in Figure 1. The CHOIR
trial, published in 2006 (8), randomized 1,432 patients with CKD not on RRT to a Hb target of 135 g/L or 113
g/L. There was evidence of increased risk of the primary outcome (a composite of death, MI and
hospitalization for heart failure or stroke) in the high- compared with the low-haemoglobin group (hazard
ratio [HR] 1.34; 95% CI 1.03, 1.74). In the CREATE trial, also published in 2006 (6), 603 patients with CKD not
on RRT were randomized to a target Hb of 130-150 or 105-115 g/L. Early complete correction of anaemia did
not reduce the risk of cardiovascular events. In the TREAT trial, which was the largest RCT and was published
in 2009 (7), 4,038 patients with diabetes, CKD and anaemia were randomly assigned to achieve a
haemoglobin level of approximately 130 g/L with the use of Darbepoetin alfa or placebo (patients in the
placebo group received Darbepoetin alfa as a rescue agent if Hb <90 g/L). The risk of a composite outcome of
death or cardiovascular event was similar in the two groups (HR for Darbepoetin alfa vs. placebo 1.05; 95%
CI 0.94, 1.17), but there was a higher incidence of stroke in the Darbepoetin alfa arm (HR 1.92; 95% CI, 1.38
to 2.68). Following publication of these RCTs, the target Hb for patients with CKD was lowered to 100-120
g/L in UK Renal Association and NICE treatment guidelines.(2, 16) The Kidney Disease: Improving Global
Outcomes (KDIGO) 2012 guidelines suggest that ESA therapy should be started when Hb is between 90-100
g/L for adult dialysis patients and that ESAs should not be used to maintain Hb concentration above 115 g/L
in adult patients with CKD, but that individualisation of therapy will be necessary as some patients may have
improvements in quality of life at Hb concentration above 115 g/L and will be prepared to accept the risks.
(17)
Characteristics of study cohort
7

A total of 28,936 haemodialysis patients were included in the cohort. 1,695 (5.9%) never received ESAs
within the study period 2005-2013, 6,648 (23.0%) changed on/off ESAs over the time period and 20,593
(71.2%) always received ESA therapy. Darboepoietin was the drug used most frequently (51.3%), followed by
Erythropoietin epoetin-beta (21.8%), Erythropoietin epoetin-alpha (17.3%), Erythropoietin epoetin-not
otherwise specified (7.4%) and Methoxy polyethylene glycol-epoetin beta (2.3%). Demographic
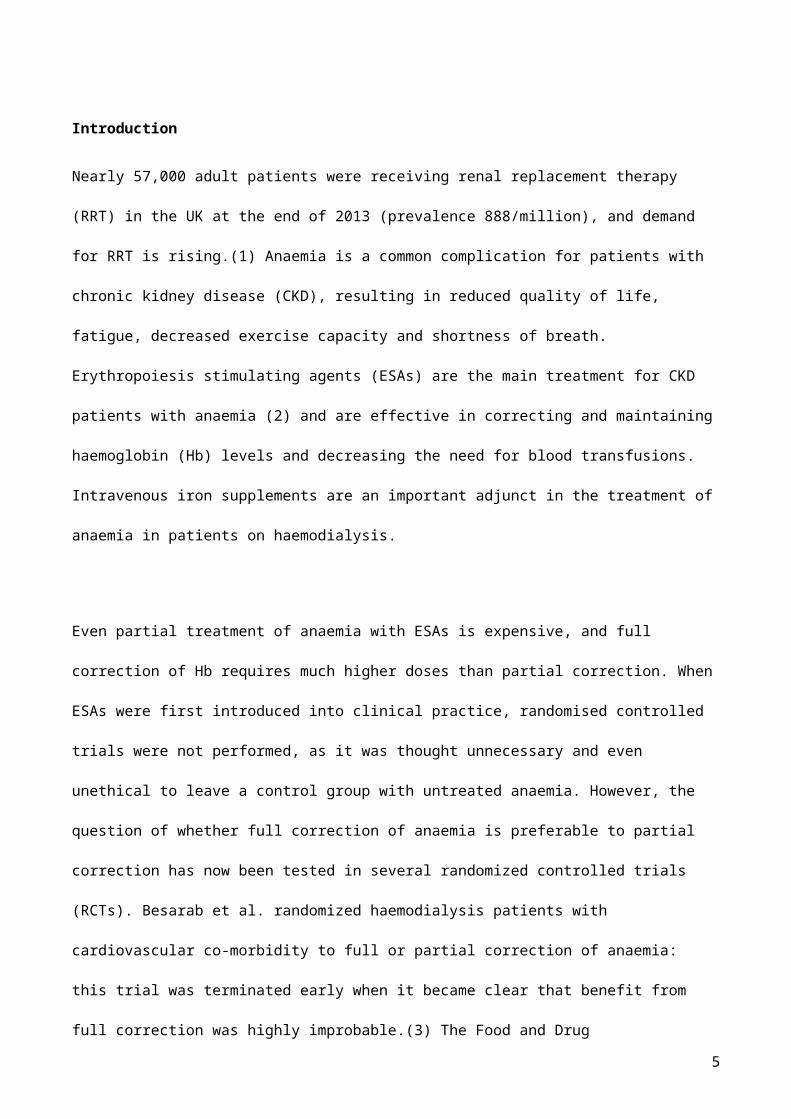
characteristics of the yearly cohorts are shown in Table 1. The number of patients included in the cohort
almost doubled over time, but the age, sex and race distributions changed very little. In 2013 the median age
of patients was 66.9 years (interquartile range 54.1 to 76.8 years), with 7,726 (61.3%) male, and 10,095
(80.7%) of White race. The proportion of patients with diabetes as the primary renal disease increased over
time, from 16.9% of patients in 2005 to 21.7% in 2013. The number of incident patients included increased
steadily over time from N=1,457 in 2005 to N=2,234 in 2013.
Use of ESAs 2005-2013
Prior to 2007, when existing guidelines had no upper limit to Hb levels, the geometric mean dose of ESA
remained stable for Erythropoietin epoetin-drugs and showed a steady increase for Darbepoetin (Figure 2)
whilst the proportion of patients on ESAs remained relatively constant (Figure 3). Near the end of 2006 and
in early 2007 there appears to be a decline in the proportion of patients on ESA with a modest dose
reduction, most likely in response to the joint publication of the NICE guideline (39) and the CHOIR and
CREATE trials (4, 6) (see Figure 1). The decline in patients treated with ESAs continues until 2013
(percentage of patients receiving ESAs decreases from 92.4% (95% CI 91.7%, 93.1%) in the first quarter of
2005 to 87.3% (95% CI 86.7%, 87.9%) in the final quarter of 2013). There is an overall decline in average
Darbepoetin dose from mid-2006. Average doses of Erythropoietin epoetin-drugs declined from 2006,
followed by a rise in 2008-2009, followed by a second decline from around 2010 after the publication of the
TREAT trial (7) and further published guidelines. The average Darbepoetin dose declined from 64231
IU/week (95% CI 6221, 6649 IU/week) in the first quarter of 2005 to 5921 IU/week (95% CI 5780, 6066
IU/week) in the last quarter of 2013. The average Erythropoietin epoetin dose declined from 6421 8107
IU/week (95% CI 6221 7884, 6649 8336 IU/week) in the first quarter of 2005 to 5921 7310 IU/week (95% CI
8

5780 7133, 6066 7491 IU/week) in the last quarter of 2013. The percentage of patients on the different ESA
drug types is shown in the online supplement. Similar ESA dose patterns were observed in incident patients
(online supplement).
Achieved haemoglobin and ferritin 2005-2013
The Hb patterns for patients on ESAs mirror what is seen with ESA dosage so that we observe an initial small
increase in mean Hb until end of 2006 followed by a steady decline (Figure 4). Mean Hb for patients on ESA
in the first quarter of 2005 was 114.1 g/L (95% CI 113.7, 114.6 g/L) and was 109.6 g/L (95% CI 109.3, 109.9)
by the end of 2013. The decline in mean Hb appears to start in 2007, following NICE guidelines (18) and the
publication of the CHOIR (8) and CREATE (6) trials in 2006. The decrease in average Hb levels is then
observed for many years – when further guidelines and the TREAT trial (7), were published - until a settling
of Hb levels in 2012 and 2013. The lowering in Hb was seen for patients who were receiving ESAs, those not
on treatment, and across treatment groups (always on ESAs, changing on/off ESAs, never on ESAs; Figure 5),
although the numbers never receiving ESAs were small and the pattern showed large fluctuations. The
percentage of patients with Hb >120 g/L has decreased over time from 36.3% at the start of 2005, to 22.4%
at the end of 2013 (Figure 6). The percentage of patients with Hb in the range of 100-120 g/L has increased
from 46.1% at the start of 2005, to 57.6% at the end of 2013. From the second quarter of 2011 onwards,
over 55% of haemodialysis patients have had Hb in the range of 100-120 g/L. In contrast to average Hb
levels, there has been a sharp increase in ferritin levels from 2008-2011 (Figure 7), with a decline at around
the beginning of 2011 after which levels appear to have stabilised. Average serum ferritin was 353 µg/L (95%
CI 345, 360 µg/L) in the first quarter of 2005, and 386 µg/L (95% CI 380, 392 µg/L) in the final quarter of
2013.
Discussion
Summary of findings
We examined ESA dose and Hb levels in haemodialysis patients from 2005 to 2013 in the UK. This period
included publications of major clinical trials and changes to treatment practice guidelines. The use of ESAs
9

has decreased over time, but it is not possible to unpick which events had most influence on dosing, as
results from RCTs and anaemia management guidelines were published in close proximity. Average Hb
decreased over time, with levels after 2011 largely compliant with the Renal Association 2010 target range of
100-120 g/L. A decrease in Hb levels over time was observed for both patients that were treated by ESAs and
those not receiving ESAs, suggesting that after the reduction in the Hb target thresholds, patients were
started on ESAs at lower levels of Hb. A small, but sharp increase in ferritin levels was seen from 2008-2011,
coinciding with decreases in ESA use. This pattern cannot be directly explained by adherence to revised
anaemia management guidelines. Serum ferritin is a marker of iron balance i.e. iron loss from occult
bleeding, blood sampling and loss of blood in the dialysis machine, versus dietary absorption plus
intravenous supplementation. The observed pattern of ferritin may have been driven by coincident
economic pressures to improve the cost-effectiveness of ESA use as well as by emerging evidence that
intravenous iron was safe and effective.(19) Alternatively, it could be that clinicians are administrating the
same amount of iron to patients, but it is not being used up so quickly because of reduced ESA doses.
Interestingly, the last two years have seen a stable pattern with no increase or decrease in levels.
Comparison with other studies
Results from RCTs and clinical practice patterns in the USA have influenced anaemia management in recent
years. A study of US non-dialysis chronic kidney disease patients found that the emergence of safety
concerns following RCTs and the subsequent changes in product labelling, restrictions to reimbursement for
ESAs and changes to clinical practice guidelines all appeared to influence physician dosing practices resulting
in less frequent use of ESAs, lower ESA doses and lower achieved Hb levels.(20) A study of US haemodialysis
patients from the United States Renal Data System (USRDS) found that ESA dosing decreased from 2007, and
that Hb levels mirrored ESA dosing trends.(21) The Dialysis Outcomes and Practice Patterns Study (DOPPS)
Practice Monitor (DPM) was developed to detect and report on trends in dialysis care before, during, and
after implementation of the end-stage renal disease prospective payment system (PPS), which was initiated
by the US Centers for Medicare and Medicaid Services in January 2011. The percentage of patients with Hb
> 120 g/L declined from 32% in August 2010 to 14% in December 2012. The mean prescribed dose of
10

patients receiving IV Epoetin decreased from 20,500 U/week in August 2010 to 13,300 U/week in December
2012, with the greatest decline occurring during June to August 2011. An increase of iron use was observed
in 2011 and serum measures of iron stores increased.(22) However, the rise in average IV iron dose did not
persist beyond 2011. The sustained rise in ferritin levels in United States dialysis patients after policy changes
in 2011 appeared to be partly due to reductions in ESA dosing and not solely IV iron dosing practices.(23) In
Germany, dialysis procedure rates were changed in 2002 from per-session to weekly flat rate payments, and
quality assurance was introduced in 2009 with defined treatment targets for different indices including
haemoglobin. DOPPS phases 1–4, (1998–2011) found that haemoglobin levels increased since 1998 and
remained consistent since 2005, with only 8–10% of patients below 100 g/L. Around 90% of patients were
prescribed ESAs, with the dose declining since peaking in 2006. Intravenous iron use was highest in 2011.(24)
Strengths and weaknesses
The UK Renal Registry is a large and highly representative database allowing trends in clinical practice
patterns to be captured.(11) This study gives an indication that clinicians are responding to changes in
guidelines important for patient safety. The analysis of ESA usage is however limited by incomplete data
returns, as some renal centres do not routinely record computerised data on ESA dose or drug type. Centres
reporting fewer than 60% of haemodialysis patients being treated with ESAs were considered to have
incomplete data and were excluded from the analysis. These exclusion criteria are relatively arbitrary but
they are in part based upon the frequency distribution graph of centres’ ESA use as it appears in the data.
The percentage of patients on ESAs is calculated from these data and incomplete data returns risk impacting
on any conclusions drawn. The dose conversion used for Darbepoetin may not accurately estimate weekly
Erythropoietin epoetin dose. There is no information on how much iron therapy was being used to treat
anaemia in this population, however data were available on ferritin levels giving an indication of achieved
iron stores over the period. Data were only obtained from haemodialysis patients and are not generalizable
to peritoneal dialysis patients or other CKD populations.
11

Conclusions
Anaemia management patterns for haemodialysis patients have changed in the UK between 2005 and 2013,
with these changes likely to have been in response to results from RCTs and changing clinical practice
guidelines. There has been a decrease in ESA use, dose and average achieved Hb levels in recent years, with
fewer patients having Hb levels >120 g/L and more patients having Hb within the 100-120 g/L target range.
Average serum ferritin levels have increased in the same time period. Previous research suggests clinicians
are responsive to clinical guidelines though the degree that new practice is adopted can vary considerably
depending on the context.(25, 26) It is likely that in this case, economic considerations due to the price of
ESAs further facilitated adoption of the guidelines as clinicians could reduce unit expenditure by reducing
ESA dosage and treating fewer patients. The continued monitoring of anaemia management through
Registry data is important for patient safety and enhancing patient quality of life and enables us to ensure
that any new evidence on the optimal use of ESA therapy for haemodialysis patients is translated into every
day clinical care.
Acknowledgements
We thank all the UK renal centres for providing data to the UK Renal Registry.
Funding
KB was supported by a Medical Research Council (MRC) UK fellowship (RD1826). JS was supported by
National Institute for Health Research (NIHR) Senior Investigator Award NF-SI-0611-10168. YB-S was
supported by the National Institute for Health Research (NIHR) Collaboration for Leadership in Applied
Health Research and Care West (CLAHRC West) at University Hospitals Bristol NHS Foundation Trust. The
views expressed are those of the authors and not necessarily those of the NHS, NIHR, MRC or Department of
Health.
12

Conflict of interest statement
None to declare
13

References
1. Rao A, Casula A, Castledine C. UK Renal Registry 17th Annual Report: Chapter 2 UK Renal Replacement Therapy Prevalence in 2013: National and Centre-specific Analyses. Nephron. 2015;129 Suppl 1:31-56.2. Mikhail A, Shrivastava R, Richardson D. Clinical Pracitice Guidelines. Anaemia of CKD. 5th 2009-2012 ed. www.renal.org/guidelines: UK Renal Association; 2010.3. Besarab A, Bolton WK, Browne JK, Egrie JC, Nissenson AR, Okamoto DM, et al. The effects of normal as compared with low hematocrit values in patients with cardiac disease who are receiving hemodialysis and epoetin. N Engl J Med. 1998;339(9):584-90.4. FDA Drug Safety Communication: Modified dosing recommendations to improve the safe use of Erythropoiesis-Stimulating Agents (ESAs) in chronic kidney disease http://www.fda.gov/Drugs/DrugSafety/ucm259639.htm2011 [11/08/2015].5. Coyne DW. The health-related quality of life was not improved by targeting higher hemoglobin in the Normal Hematocrit Trial. Kidney Int. 2012;82(2):235-41.6. Drueke TB, Locatelli F, Clyne N, Eckardt KU, Macdougall IC, Tsakiris D, et al. Normalization of hemoglobin level in patients with chronic kidney disease and anemia. N Engl J Med. 2006;355(20):2071-84.7. Pfeffer MA, Burdmann EA, Chen CY, Cooper ME, de ZD, Eckardt KU, et al. A trial of darbepoetin alfa in type 2 diabetes and chronic kidney disease. N Engl J Med. 2009;361(21):2019-32.8. Singh AK, Szczech L, Tang KL, Barnhart H, Sapp S, Wolfson M, et al. Correction of anemia with epoetin alfa in chronic kidney disease. N Engl J Med. 2006;355(20):2085-98.9. Levin A, Djurdjev O, Duncan J, Rosenbaum D, Werb R. Haemoglobin at time of referral prior to dialysis predicts survival: an association of haemoglobin with long-term outcomes. Nephrol Dial Transplant. 2006;21(2):370-7.10. Regidor DL, Kopple JD, Kovesdy CP, Kilpatrick RD, McAllister CJ, Aronovitz J, et al. Associations between changes in hemoglobin and administered erythropoiesis-stimulating agent and survival in hemodialysis patients. J Am Soc Nephrol. 2006;17(4):1181-91.11. Macdougall IC, Tomson CR, Steenkamp M, Ansell D. Relative risk of death in UK haemodialysis patients in relation to achieved haemoglobin from 1999 to 2005: an observational study using UK Renal Registry data incorporating 30,040 patient-years of follow-up. Nephrol Dial Transplant. 2010;25(3):914-9.12. The Standards and Audit Subcommittee of the Renal Association. Treatment of adults and children with renal failure. Standards and audit measures. 3rd ed: The Renal Association; 2002.13. Cassidy M, Richardson D, Jones C. Cinical Practice Guidelines. Module 2: Complications. 4th 2007 ed. www.renal.org/guidelines: UK Renal Association; 2007.14. Ansell D, Tomson CR. UK Renal Registry 11th Annual Report (December 2008): Chapter 15 The UK Renal Registry, UKRR database, validation and methodology. Nephron Clin Pract. 2009;111 Suppl 1:c277-85.15. UK Renal Registry 17th Annual Report: Appendices. Nephron. 2015;129 Suppl 1:267-322.16. National Institute for Health and Clinical Excellence. Anaemia management in people with chronic kidney disease. NICE clinical guideline 114. http://www.nice.org.uk/guidance/cg114. 2011.17. Kidney Disease: Improving Global Outcomes (KDIGO) Anemia Work Group. KDIGO Clinical Practice Guideline for Anemia in Chronic Kidney Disease. Kidney International Supplements. 2012;2(5):279-335.18. National Institute for Health and Clinical Excellence. Anaemia management in people with chronic kidney disease. NICE clinical guideline 39. https://www.nice.org.uk/guidance/cg39. 2006.19. Susantitaphong P, Alqahtani F, Jaber BL. Efficacy and safety of intravenous iron therapy for functional iron deficiency anemia in hemodialysis patients: a meta-analysis. American journal of nephrology. 2014;39(2):130-41.20. Regidor D, McClellan WM, Kewalramani R, Sharma A, Bradbury BD. Changes in erythropoiesis-stimulating agent (ESA) dosing and haemoglobin levels in US non-dialysis chronic kidney disease patients between 2005 and 2009. Nephrol Dial Transplant. 2011;26(5):1583-91.21. Freburger JK, Ng LJ, Bradbury BD, Kshirsagar AV, Brookhart MA. Changing Patterns of Anemia Management in US Hemodialysis Patients. Am J Med. 2012;125(9):906-U204.22. Fuller DS, Pisoni RL, Bieber BA, Port FK, Robinson BM. The DOPPS practice monitor for U.S. dialysis care: update on trends in anemia management 2 years into the bundle. Am J Kidney Dis. 2013;62(6):1213-6.
14

23. Karaboyas A, Zee J, Morgenstern H, Nolen JG, Hakim R, Kalantar-Zadeh K, et al. Understanding the Recent Increase in Ferritin Levels in United States Dialysis Patients: Potential Impact of Changes in Intravenous Iron and Erythropoiesis-Stimulating Agent Dosing. Clinical journal of the American Society of Nephrology : CJASN. 2015.24. Kleophas W, Karaboyas A, Li Y, Bommer J, Reichel H, Walter A, et al. Changes in dialysis treatment modalities during institution of flat rate reimbursement and quality assurance programs. Kidney Int. 2013;84(3):578-84.25. Grimshaw JM, Russell IT. Effect of clinical guidelines on medical practice: a systematic review of rigorous evaluations. Lancet. 1993;342(8883):1317-22.26. Grol R, Dalhuijsen J, Thomas S, Veld C, Rutten G, Mokkink H. Attributes of clinical guidelines that influence use of guidelines in general practice: observational study. Bmj. 1998;317(7162):858-61.
15

Table 1 Characteristics of the cohort by year
2005 2006 2007 2008 2009 2010 2011 2012 2013Number of patients Incident 1457 1694 1736 1895 1946 1921 1864 2006 2234 Total (including incident) 6930 7896 8637 9419 10326 10648 10824 11462 12609Age, years: median (IQR)
65.5(51.5, 75)
66.0(52.1, 75.4)
65.9(52.4,75.5)
66.1(52.9,75.7)
66.4(53.2, 5.9)
66.7(53.7, 6.2)
66.8(53.5,76.5)
67.0(53.9, 76.6)
66.9(54.1, 76.8)
Sex, N (%) Male 4,216 (60.8%) 4,880 (61.8%) 5,346 (61.9%) 5,784 (61.4%) 6,262 (60.6%) 6,471 (60.8%) 6,579 (60.8%) 7,037 (61.4%) 7,726 (61.3%) Female 2,714 (39.2%) 3,016 (38.2%) 3,291 (38.1%) 3,635 (38.6%) 4,064 (39.4%) 4,177 (39.2%) 4,245 (39.2%) 4,425 (38.6%) 4,883 (38.7%)Race, N White 5,477 (83.6%) 6,286 (84.1%) 6,884 (83.4%) 7,580 (83.4%) 8,419 (83.2%) 8,783 (83.2%) 8,822 (81.9) 9,489 (82.9%) 10,095 (80.7%) Black 295 (4.5%) 328 (4.4%) 367 (4.5%) 400 (4.4%) 467 (4.6%) 457 (4.3%) 514 (4.8%) 499 (4.4%) 779 (6.2%) Asian 677 (10.3%) 751 (10.1%) 882 (10.7%) 983 (10.8%) 1,073 (10.6%) 1,143 (10.8%) 1,263 (11.7%) 1,266 (11.1%) 1,403 (11.2%) Chinese 39 (0.6%) 41 (0.6%) 46 (0.6%) 45 (0.5%) 50 (0.5%) 55 (0.5%) 51 (0.5%) 49 (0.4%) 68 (0.5%) Other 64 (1.0%) 70 (0.9%) 75 (0.9%) 81 (0.9%) 105 (1.0%) 125 (1.2%) 128 (1.2%) 138 (1.2%) 160 (1.3%) Missing 378 420 383 330 212 85 46 21 104Primary renal disease:N (%) Diabetes 3684 (16.9) 4417 (17.5) 4948 (18.1) 5678 (19.2) 6541 (19.5) 6701 (19.3) 7102 (20.1) 7778 (20.5) 8832 (21.7) Glomerulonephritis 3330 (15.3) 3933 (15.6) 4223 (15.5) 4509 (15.2) 5005 (15.0) 5242 (15.1) 5219 (14.8) 5735 (15.1) 6186 (15.2) Hypertension 1239 (5.7) 1339 (5.3) 1458 (5.3) 1666 (5.6) 1999 (6.0) 2154 (6.2) 2139 (6.1) 2533 (6.7) 2856 (7.0) Polycystic kidneys 1646 (7.6) 1881 (7.5) 1999 (7.3) 2101 (7.1) 2335 (7.0) 2415 (7.0) 2382 (6.7) 2596 (6.9) 2737 (6.7) Pyelonephritis 2389 (11.0) 2766 (11.0) 3075 (11.3) 3271 (11.1) 3537 (10.6) 3518 (10.2) 3473 (9.8) 3601 (9.5) 3794 (9.3) Renal vascular disease 1768 (8.1) 2095 (8.3) 2201 (8.1) 2247 (7.6) 2436 (7.3) 2515 (7.3) 2517 (7.1) 2586 (6.8) 2532 (6.2) Other 2988 (13.7) 3519 (13.9) 3766 (13.8) 4139 (14) 4776 (14.3) 5137 (14.8) 5405 (15.3) 5755 (15.2) 6116 (15.0) Uncertain 4712 (21.7) 5309 (21.0) 5658 (20.7) 5981 (20.2) 6847 (20.5) 6979 (20.1) 7110 (20.1) 7321 (19.3) 7657 (18.8) Missing 241 305 375 434 424 287 257 267 388
16

Figure 1 Timeline of events
2005 2006 2007 2008 2009 2010 2011 2012 2013
CHOIR and CREATE trials published(Nov 2006)
TREAT trial published(Nov 2009)
Renal Association 4th
guidelines (Dec 2007):target Hb 105-125 g/L
KDIGO guidelines (Aug 2012): Start ESA when Hb 90-100 g/L, ESAs should not be used to maintain Hb above 115 g/L
NICE guideline 114 (Feb 2011):Aspirational Hbrange 100-120 g/L
Renal Association 5th
guidelines (final version published Nov 2010):target Hb 100-120 g/L
NICE clinical guideline 39 (Sept 2006): aspirational Hbrange 105-125 g/L
Renal Association 3rd guidelines (Aug 2002 onwards): target Hb >100 g/L with no suggested maximum
17

Figure 2 Geometric mean ESA weekly dose and 95% confidence interval
6000
7000
8000
ES
A d
ose
2005 2006 2007 2008 2009 2010 2011 2012 2013
Darboepoietin
6000
7000
8000
ES
A d
ose
2005 2006 2007 2008 2009 2010 2011 2012 2013
Epoetin-alpha, -beta, or -not specified
The dashed vertical lines indicate the publication of the CHOIR and CREATE RCTs (2006) and TREAT (2009)
18

Figure 3 Percentage use of ESAs with 95% confidence intervals, in all haemodialysis patients80
8590
9510
0P
erce
ntag
e
2005 2006 2007 2008 2009 2010 2011 2012 2013Year
The dashed vertical lines indicate the publication of the CHOIR and CREATE RCTs (2006) and TREAT (2009)
Figure 4 Mean haemoglobin levels over time with 95% confidence intervals, in all haemodialysis patients
105
110
115
120
125
Hae
mog
lobi
n g/
L
2005 2006 2007 2008 2009 2010 2011 2012 2013Year
Circles represent patients not receiving ESAs; triangles represent patients receiving ESAsThe dashed vertical lines indicate the publication of the CHOIR and CREATE RCTs (2006) and TREAT (2009)
19

Figure 5 Mean haemoglobin levels over time in all haemodialysis patients, by ESA status
105
110
115
120
Hae
mog
lobi
n g/
L
2005 2006 2007 2008 2009 2010 2011 2012 2013Year
Crosses represent patients always receiving ESAs; triangles represent patients changing on/off ESAs over the time period; circles represent patients never receiving ESAs. The dashed vertical lines indicate the publication of the CHOIR and CREATE RCTs (2006) and TREAT (2009)
Figure 6 Percentages in the haemoglobin in groups (<100, 100-120, >120 g/L), in all haemodialysis patients
Dark-grey represents Hb<100 g/L; mid-grey represents Hb 100-120 g/L; light grey represents Hb>120 g/L
20
Figure 7 Geometric mean ferritin with 95% confidence interval, in all haemodialysis patients
340
360
380
400
Ferr
itin
ug/L
2005 2006 2007 2008 2009 2010 2011 2012 2013
The dashed vertical lines indicate the publication of the CHOIR and CREATE RCTs (2006) and TREAT (2009)
21