Embed Size (px)
Citation preview

Ancient TL Vol. 30 No.2 2012 41
Dose response curve of the ESR signal of the Aluminum
center in quartz grains extracted from sediment
M. Duval
Centro nacional de investigación sobre la evolución humana (CENIEH), Paseo de Atapuerca s/n,
09002-Burgos, Spain (e-mail: [email protected]) (Received 11 May 2012; in final form 31 October 2012)
_____________________________________________________________________________________________
Abstract
A single saturating exponential (SSE) function is
classically used in ESR dating to fit the experimental
ESR data points derived from the aluminum (Al)
center in quartz. However, this function has some
obvious limits as it does not accurately fit the data
points of the dose response curve. This results in
unreliable equivalent dose (DE) values which are
highly dependent on the maximum irradiation dose.
Dose response curves of Al center in quartz show
that the dose response data contain at least two
components: a first one dominating at low dose
(usually < 5 kGy) and saturating quite quickly and a
second one dominating at higher doses with an
almost linear behavior. These data are more
appropriately fitted with a function combining an
exponential with a linear term (EXP+LIN). Two
variations of the EXP+LIN function were studied,
each one corresponding to distinct physical
assumptions. Since it is still unclear which one
should be preferred, the mean DE value extracted
from the fitting of the two equations may be
reasonably considered as the most reliable estimate of
the true DE value. In addition, to ensure accurate
fitting of the linear part, it is important to have at
least three data points at high doses (>10 kGy). It is
also suggested to pool all the ESR intensities derived
from repeated ESR measurements of each aliquot in
the fitting process, in order to reduce the error in the
DE value.
Introduction
In ESR as well as in luminescence dating, the
selection of the mathematical function to fit the
experimental data point has a direct impact on the
calculated equivalent dose (DE) value. This is even
more crucial when working with the additive dose
method, which requires back extrapolation of the data
to the X-axis. In the field of ESR dating, this topic
has been widely discussed for carbonates (e.g. Grün
et al., 1990; Barabas et al., 1992; Walther et al.,
1992; Hoffmann et al., 2003) and fossil tooth enamel
(Lee et al., 1997; Rink and Schwarcz, 1994; Duval et
al., 2009). In contrast, there is little information
available about the mathematical description of the
dose response curves of the aluminum (Al) center in
sedimentary quartz.
Since the first applications of ESR to date optically
bleached quartz grains extracted from sediment (e.g.
Yokoyama et al., 1985), a single saturating
exponential (SSE) function has been systematically
used to fit the experimental Al-ESR dose response
data (e.g. Rink et al., 2007; Liu et al., 2010; Voinchet
et al., 2010). However, this function does not
accurately describe the behavior of the Al-ESR signal
with the absorbed dose, since it shows systematic
deviations from experimental data sets. In addition,
studies on the optical bleaching kinetics of the Al
signal show that at least two components are
involved in the process (Voinchet et al., 2003). It is
therefore reasonable to explore the potential of a
similar approach including more than one component
to describe the creation of Al centers with absorbed
dose. In this paper, the limits of the SSE function are
discussed and the appropriateness of an alternative
fitting approach combining the SSE function with a
linear term (EXP+LIN) is assessed.
Material and method
The dose response curves (DRCs) of the Al center
from 15 quartz samples were selected. The sediment
samples were collected in diverse Plio-Pleistocene
geological contexts from various areas of the Iberian
Peninsula. Quartz grains were extracted according to
a protocol similar to that described in Voinchet et al.
(2007). Depending on the sample, irradiation
involved 11 to 14 dose steps with maximum
irradiation doses (Dmax) between 23,100 and 40,000
Gy (Table 1). The residual ESR intensity of the
artificially bleached component was first subtracted
from the DRC values and then each DRC was
normalized to the ESR intensity of the corresponding
natural aliquot, to obtain comparable data. All ESR
data are available in supplementary information. Two
fitting functions were tested:
Single saturating exponential (SSE) function
The SSE function was first proposed by Apers et al.
(1981), to account for saturation effects of the ESR

42 Ancient TL Vol. 30 No.2 2012
Sample Site/Outrop, Location
Number
of dose
steps
Dmax
(Gy)
1 Huescár-1, Guadix-Baza
basin (Southern Spain) 14 40000
2 Huescár-1, Guadix-Baza
basin (Southern Spain) 13 40000
3 Fuente Nueva-3, Guadix-
Baza basin (Southern Spain) 11 25000
4 Vallparadís, Terrassa (Eastern
Spain) 11 25000
5 Vallparadís, Terrassa (Eastern
Spain) 11 25000
6 Villarroya, Ebro basin
(Northern Spain) 12 25000
7 Villarroya, Ebro basin
(Northern Spain) 12 25000
8 Tejares, Duero basin
(Northern Spain) 12 25000
9 Tejares, Duero basin
(Northern Spain) 12 25000
10 Barranco León, Guadix-Baza
basin (Southern Spain) 11 24000
11 Atapuerca Sima del Elefante,
Duero basin (Northern Spain) 11 23300
12 Atapuerca Sima del Elefante,
Duero basin (Northern Spain) 11 22100
13 Maresa, Tajo basin (Central
Spain) 11 22900
14 Valdocarros, Tajo basin
(Central Spain) 11 22700
15 Cúllar de Baza, Guadix-Baza
basin (Southern Spain) 11 23100
Table 1: Details of the fifteen ESR samples.
signal at high irradiation dose. By using this function,
it is usually assumed that the ESR signal is
dominated by a single paramagnetic center. The SSE
function may be written as follows:
𝐼 𝐷 = 𝐼𝑠𝑎𝑡 1 − 𝑒𝑥𝑝 − 𝐷+𝐷𝐸
𝐷0 (1) 1
where D is the absorbed dose (Gy), I is the ESR
intensity (in a.u.). Three parameters are fitted: the
equivalent dose (DE), the saturation ESR intensity
(Isat) and the characteristic saturation dose (D0).
Sometimes 1/D0 is used to express the radiation
sensitivity of the sample.
Exponential+linear (EXP+LIN) function
This function is made by the sum of a SSE function
and a linear term. This function was first introduced
by Goldberg et al. (1973) and then taken up by Levy
(1985) in order to describe the formation of radiation
induced species for a system where several
components are involved. This function was
previously used in luminescence dating (Berger,
1990; Fattahi et al., 2004), in ESR studies of corals
(Grün, 1990; Walther et al., 1992) and enamel (Duval
et al., 2009), but not for quartz, until the work by
Duval et al (2011). Basically, the use of this kind of
function suggests that the ESR signal is the result of
two main components, one dominating at low
irradiation doses and saturating at relatively low
doses while the other is dominating at high doses.
The EXP+LIN is usually considered appropriate for
systems where traps are generated during irradiation
(Levy, 1985). However, it can be also interpreted as a
sum of two different saturation functions, including
one with such a high saturation level that it may be
approximated by a straight line (Walter et al., 1992).
Following the second hypothesis, the equation may
be writen as follows:
𝐼 𝐷 = 𝐼𝑠𝑎𝑡 1 − 𝑒𝑥𝑝 − 𝐷 + 𝐷𝐸
𝐷0
+ 𝑚 𝐷 + 𝐷𝐸 (2)
There are four fitted parameters with this function:
DE, Isat, D0 and m. The latter may be considered as an
estimation of the radiation sensitivity of the second
component.
The fitting procedures were carried out with the
Microcal OriginPro 8.5 software using a Levenberg-
Marquardt algorithm by chi-square minimization.
Further details can be found in the Origin 8 User
Guide (2007). The data points were weighted by the
inverse of the squared ESR intensity (1/I2). For a
discussion of the weighting of luminescence and ESR
data points, see Grün and Brumby (1994) and
references therein. The goodness of fit is assessed
through the adjusted r-square (r2) value, which
accounts for the degrees of freedom of the system,
contrary to the classical coefficient of determination
r2 (for further details see the Origin 8 User Guide).
Apparent limitations of the SSE function
Fig. 1 shows a couple of examples of DRCs
(samples #1 and #6). It is already visually obvious
that the SSE function does not correctly fit the ESR
data points. For sample #1, the SSE function is not
only inappropriate in the high dose region (D > 25
kGy), with modelled ESR intensities significantly
lower than the experimental ones, but also in the
intermediate dose region (~6 kGy< D < ~25 kGy), in
the maximum curvature area of the SSE where
experimental data are not fitted at all. Lastly, in the
low dose region (D< ~6kGy), the curve goes through
almost none of the points, and the SSE passes above
the natural point. A similar trend is observed for
sample #6. Other examples may also be found in
Duval et al. (2011).
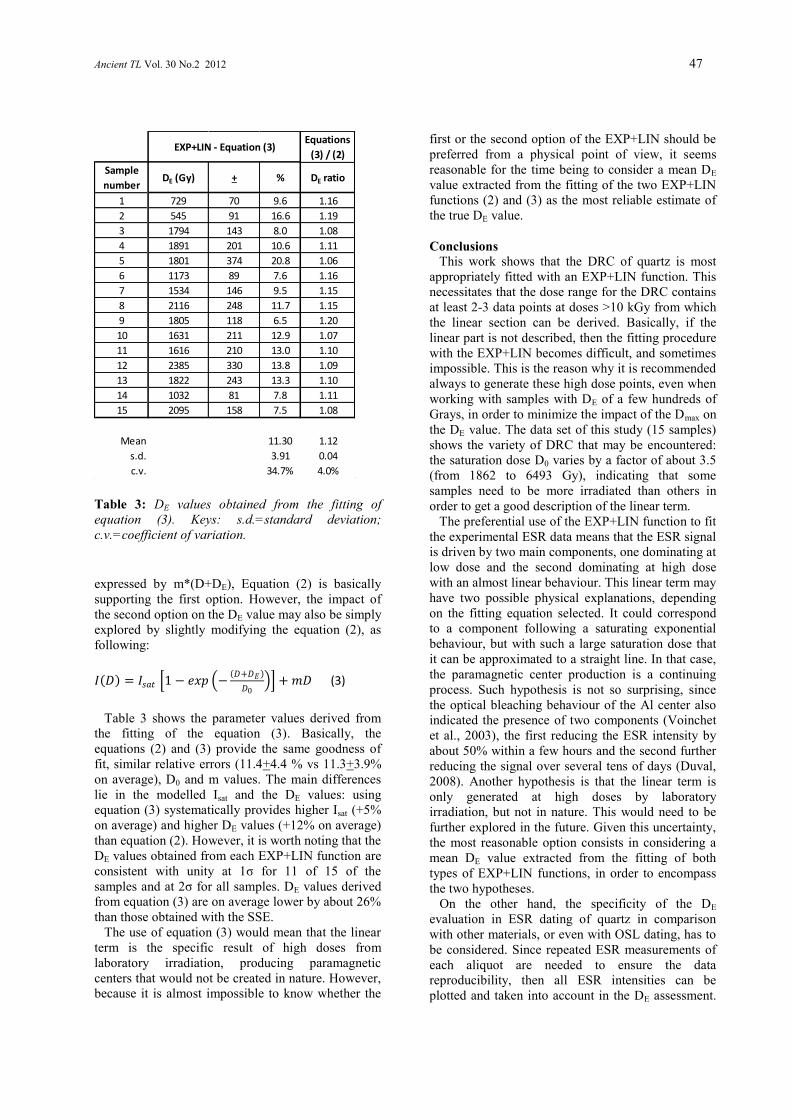
Sometimes, the SSE function resulted in a good fit
(adjusted r2> 0.99) of the experimental data, but this
applied only to two samples of the present data set:
samples #3 and #9 (Table 2). The corresponding

Ancient TL Vol. 30 No.2 2012 43
Figure 1: Examples of dose response curves (Samples #1 and #6). Mean ESR intensities were calculated from
repeated ESR measurements of each sample. Errors on the ESR intensities correspond to 1 standard deviation.
Sample
numberDE + %
Adjusted
r2 DE + % Isat D0 mAdjusted
r2 DE
Adjusted
r2
1 1166 180 15.4 0.97544 631 56 8.9 4.12 2639 0.000247 0.99708 0.54 1.022
2 742 131 17.7 0.97059 458 70 15.3 5.58 2707 0.000405 0.99060 0.62 1.021
3 1975 140 7.1 0.99446 1665 143 8.6 2.96 4541 0.000051 0.99773 0.84 1.003
4 2696 319 11.8 0.98489 1699 172 10.1 1.98 2982 0.000078 0.99781 0.63 1.013
5 4694 748 15.9 0.97292 1703 339 19.9 1.43 1862 0.000052 0.99137 0.36 1.019
6 1951 261 13.4 0.97736 1012 70 6.9 2.10 1986 0.000176 0.99903 0.52 1.022
7 1990 190 9.5 0.98841 1340 121 9.0 2.42 3114 0.000116 0.99783 0.67 1.010
8 3155 322 10.2 0.98691 1841 195 10.6 1.77 2820 0.000098 0.99792 0.58 1.011
9 2157 173 8.0 0.99172 1506 91 6.0 2.31 3492 0.000137 0.99915 0.70 1.007
10 1879 191 10.2 0.98874 1526 205 13.4 2.76 3719 0.000051 0.99432 0.81 1.006
11 1611 166 10.3 0.98918 1474 236 16.0 3.99 6093 0.000064 0.98876 0.91 1.000
12 2385 248 10.4 0.98783 2193 411 18.7 3.24 6463 0.000045 0.98674 0.92 0.999
13 2587 298 11.5 0.98502 1659 213 12.8 1.99 2745 0.000073 0.99637 0.64 1.012
14 1488 199 13.4 0.98083 933 70 7.5 2.61 2200 0.000129 0.99846 0.63 1.018
15 3228 364 11.3 0.98581 1937 141 7.3 1.73 2625 0.000056 0.99891 0.60 1.013
Mean 2247 11.7 0.98401 1438 11.4 2.73 3333 0.000118 0.99547 0.67 1.012
s.d. 960 2.9 0.00705 485 4.4 1.11 1375 0.000097 0.00410 0.15 0.008
c.v. 42.7% 25.0% 0.7% 33.7% 38.6% 40.8% 41.3% 82.1% 0.4% 22.9% 0.8%
SSE - Equation (1) EXP+LIN - Equation (2) (EXP+LIN)/(SSE)
Table 2: DE values and other data associated to the fitting of both SSE and EXP+LIN functions. Keys:
s.d.=standard deviation; c.v.=coefficient of variation.

44 Ancient TL Vol. 30 No.2 2012
Figure 2: Dose response curves of samples #3 and #9, for which the SSE shows the best fitting of the data set
(Adjusted r2> 0.99). Mean ESR intensities were calculated from repeated ESR measurements of each sample. Errors
on the ESR intensities correspond to 1 standard deviation.
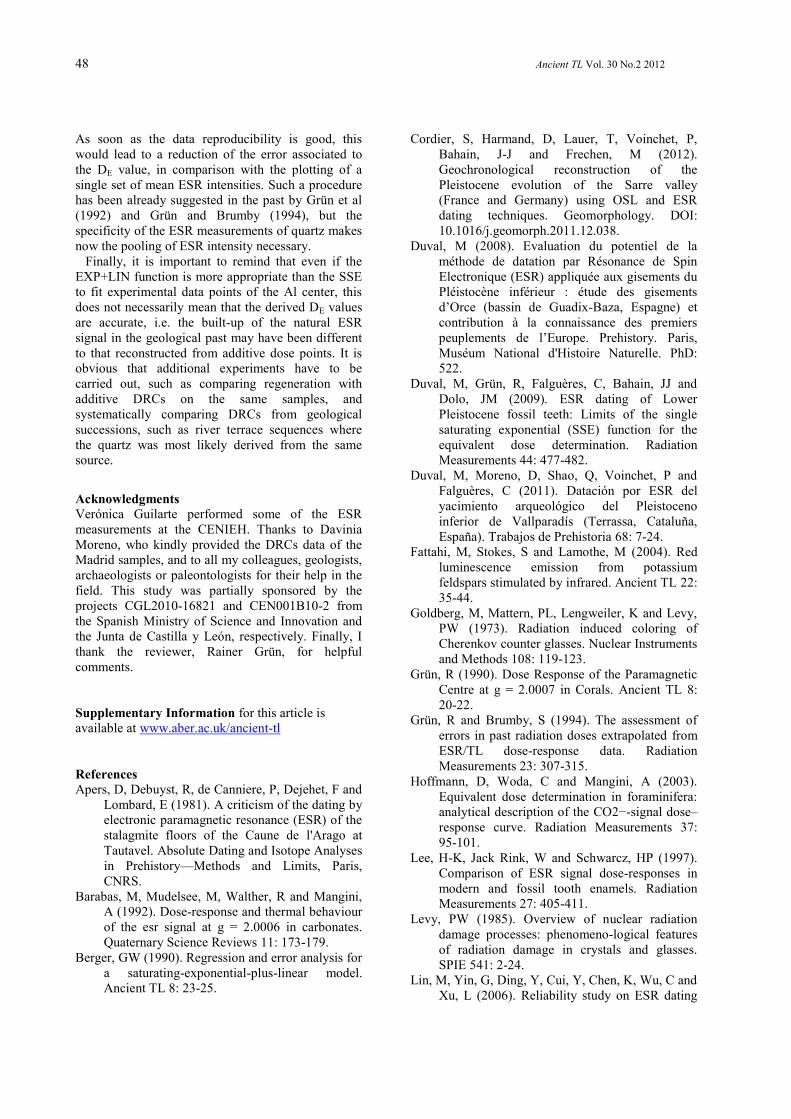
Figure 3: Example of a DRC with a high D0 (6093 Gy): sample #11.Both SSE and EXP+LIN functions show close
goodness of fit and DE values. Mean ESR intensities were calculated from repeated ESR measurements of each
sample. Errors on the ESR intensities correspond to 1 standard deviation.
DRCs are shown in Fig. 2. However, despite the
apparent tight fit, one may observe that the
experimental points are not particularly well fitted at
doses higher than ~5 kGy. These observations
suggest that the DRCs of the Al center in quartz
cannot be correctly fitted with the SSE function.
Potential of the EXP+LIN function in comparison
with the SSE
Two distinct domains can be identified in the DRCs
shown in Fig. 1. First, the ESR signals increase quite
rapidly with the dose in a few kGy, i.e. the natural
ESR intensities are multiplied by a factor of ~3-4 up
from 0 to 4 kGy. Then the DRC grows more slowly
at higher doses, with the ESR intensities multiplied
by a factor of ~2 between 4 kGy and 25 kGy. Perhaps
the most striking observation is that there is almost
no apparent saturation of the Al center at high doses
(up to 40 kGy). This is in agreement with the data
shown by Lin et al. (2006). The ESR signal grows
almost linearly with the absorbed dose at irradiation
doses in excess of ~4-5 kGy (see also the DRCs
shown in Duval et al. (2011) and Cordier et al
(2012)). Consequently, the hypothesis of a single
component building the ESR signal, one of the basic
assumption of the SSE function, is not valid. It seems
that at least two components contribute to the ESR
signal: the first saturates at low doses and the second
shows no apparent saturation at high dose, with an
almost linear behavior, justifying thus the use of an
EXP+LIN function.

Ancient TL Vol. 30 No.2 2012 45
Like the SSE function, the EXP+LIN was fitted
through the experimental data points of the 15
samples (see Table 2). Visually, the EXP+LIN
function fits the data points much better than the SSE
function (e.g. Fig. 1 and 2). This is confirmed by the
adjusted r-square values: the EXP+LIN function
provides a better fit than the SSE for 13 of 15
samples, even for those that were already well fitted
with the SSE (#3 and #9). The two remaining
samples (#11 and #12) show very close adjusted r-
square values (Table 2). These were collected at the
same cave site, Atapuerca Sima del Elefante, and
show DRCs with the highest D0 values of the data set
(> 6 kGy). Consequently, it seems that a linear term
could not be identified within the dose range used for
the DRCs (Fig. 3). Here, at least a couple of
additional irradiation steps at doses >25 kGy would
be useful to identify the linear term and to reduce the
large DE errors (>15%). In addition, the various ESR
measurements of sample #11 show an especially
quite poor precision, as indicated by the large errors
in the ESR intensities (Fig. 3). This may explain why
the adjusted r2 values are < 0.99 for both functions,
and suggest that the experimental data are not
perfectly fitted for this specific sample. Basically, the
best fits with the SSE are obtained for samples
showing high D0 values (e.g. samples #3, #9, #10,
#11 and #12) but even there, the fitting with the
EXP+LIN remains still very close or even better. In
contrast, the DRCs from samples #5 and #6 have the
lowest D0 values of the data set, and the fitting of the
SSE is totally inappropriate (adjusted r2 < 0.98; e.g.
Fig. 1).
Similarly to the previous results by Duval et al.
(2009), DE values calculated with the EXP+LIN
function are systematically lower (on average by
37%) than those obtained with the SSE. The
minimum deviations between the DE derived from
each function are around -8 % for the samples #11
and #12, i.e. those with the highest D0. The maximum
deviation is obtained for samples with D0<2000 Gy
(samples #5 and #6), i.e. DRCs where the first
exponential component saturates quite quickly and
the second linear component takes over the former at
relatively low dose values.
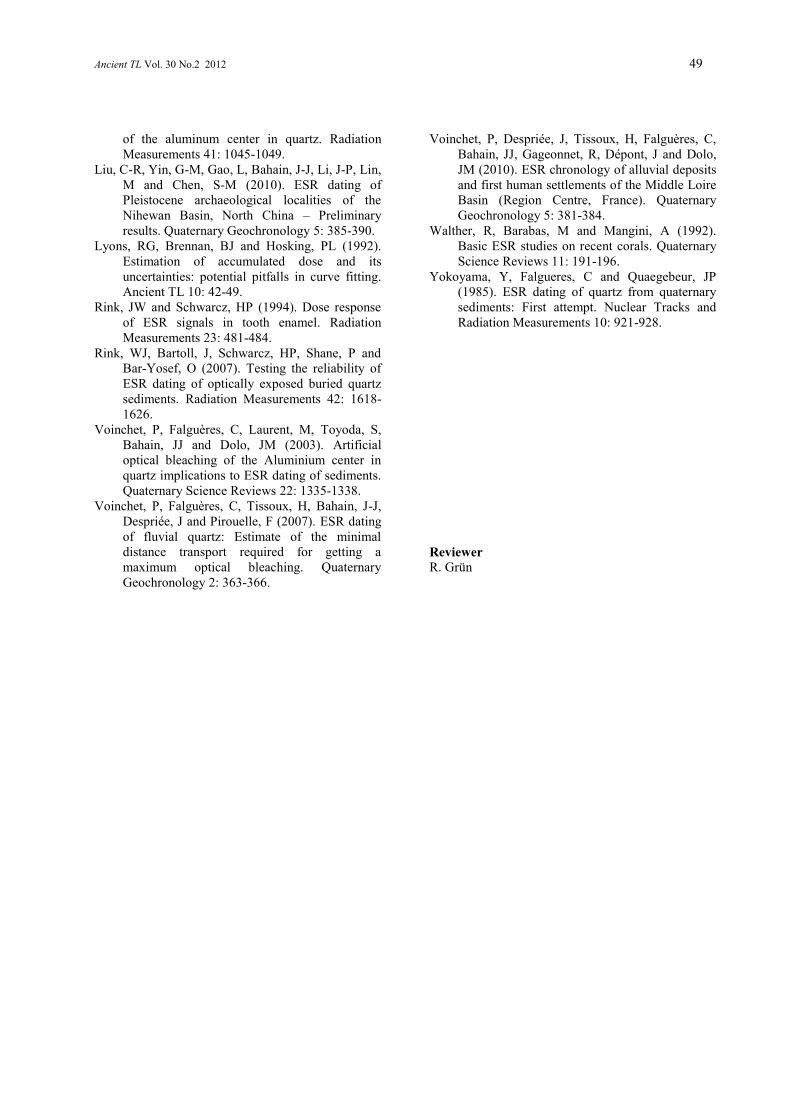
The impact of Dmax on the fitting results for both
functions is illustrated by Fig. 4 for samples #1 and
#2 which had the largest number of data points
(Table 1). Fig. 4A shows the evolution of the DE
values relative to the DE values obtained at Dmax=40
kGy. The application of the SSE function results in
an almost linear increase of the DE values: between
Dmax =12 kGy and Dmax = 40 kGy, the DE value
increases by a factor of ~1.4-1.6 for both samples.
Such a strong correlation was one of the arguments
against the use of the SSE function for tooth enamel
Figure 4: Influence of Dmax on the fitting results: a
couple of examples with samples #1 and #2. (A)
Evolution of the DE with Dmax, from Dmax=12 kGy to
Dmax=40 kGy. Current DE values are normalized to
the DE obtained at Dmax=40 kGy. (B) Evolution of the
relative DE error with Dmax. (C) Evolution of the
adjusted r-square with Dmax.
samples (Duval et al., 2009; Chen et al., 1997). With
the EXP+LIN function, DE values have a similar
increase between Dmax =12 kGy and Dmax =25 kGy.
However, from Dmax = 25 kGy to Dmax =40 kGy, the
DE values remain almost constant with only a slight
increase of <5% over 15 kGy. Contrary to the SSE

46 Ancient TL Vol. 30 No.2 2012
function, the EXP+LIN function is much less
dependent on the Dmax, but it is critically dependent
on having sufficient data points to define correctly
the linear term at high doses. Similar trends were
observed with other samples of the data set: the
EXP+LIN DE values remain almost constant when
progressively removing the last 3-4 points, while SSE
DE values significantly decrease. Fig. 4B shows the
evolution of the relative DE errors with Dmax. For the
EXP+LIN, the errors are constantly decreasing when
Dmax increases. In contrast, DE errors from SSE
remain either constant or increase when adding
additional dose steps, as a result of the fitting
becoming more and more problematic. This trend is
also widely observed on the other DRCs of the data
set. Fig. 4C shows that the goodness of fit of the
EXP+LIN is systematically better than that of the
SSE for a given sample and a given Dmax. In the case
of the EXP+LIN function, the adjusted r2 value
increases or remains almost constant when the Dmax
increases, contrary to the SSE.
Reducing the error in the DE with the EXP+LIN
function
The application of the EXP+LIN function results in
larger errors than using the SSE because four instead
of three independent parameters are optimized (see
samples #10, #11 and #12 which have similar
EXP+LIN and SSE DE values, Table 2). This can be
addressed by increasing the number of dose steps.
Usually one considers that 3-4 points per fitted
parameter are necessary (Lyons, 1992).
Consequently, between 12 and 16 dose steps should
be used to fit the EXP+LIN function, making sure
that there are at least 3 to 4 points to describe the
almost linear behavior of the ESR signal at high
doses (> 10 kGy).
In addition to selecting an appropriate dose range
for the DRCs, the precision of the measurements can
be increased through repeated ESR measurements of
the same aliquot. ESR measurements of quartz are
complex since several parameters have an influence
on the data reproducibility. They may be
experimental, such as the temperature of the room,
cooling water or the cavity (the ESR signal of Al
center is only visible at liquid nitrogen temperature).
Other error sources are intrinsic to the sample, like its
homogeneity (the standard analytical procedure is
usually based on multiple grains and multiple aliquot
measurements) or the angular dependence of the ESR
signal in the ESR resonator. To ensure precision of
the data, it is necessary to carry out a series of
repeated measurements of a given aliquot after
various rotations in the cavity and over several days.
For example, each aliquot from samples #1 and #2
were measured 3 times after a ~120º rotation in the
resonator over 4 and 3 days, respectively. Then, the
Figure 5: Influence of ESR data pooling on the DE
estimate (see comparison data from Table 2).
mean ESR intensities were extracted from each day
of measurement and all these data may be plotted,
making a data set of 51 and 39 data points for
samples #1 and #2, respectively (Fig. 5). When
comparing the results of the fitting with those derived
from the initial fitting with one ESR data point for
each aliquot, one may conclude that the impact on the
DE value is negligible (<< 1%, see Table 2), but the
relative errors are much smaller by around 60% and
50%, respectively. These results are in agreement
with the work by Grün and Brumby (1994) and Grün
and Rhodes (1991, 1992) who showed that pooling of
dose response points improve the random error in the
DE estimation.
Exploring a variation of the EXP+LIN function
As previously commented, the linear term may
either correspond to the case where the second
component saturates at such a high level that it may
be approximated by a straight line (Walter et al.,
1992), or where traps are generated during irradiation
(Berger, 1990; Grün, 1990). With a linear term
Ancient TL Vol. 30 No.2 2012 47
Equations
(3) / (2)
Sample
numberDE (Gy) + % DE ratio
1 729 70 9.6 1.16
2 545 91 16.6 1.19
3 1794 143 8.0 1.08
4 1891 201 10.6 1.11
5 1801 374 20.8 1.06
6 1173 89 7.6 1.16
7 1534 146 9.5 1.15
8 2116 248 11.7 1.15
9 1805 118 6.5 1.20
10 1631 211 12.9 1.07
11 1616 210 13.0 1.10
12 2385 330 13.8 1.09
13 1822 243 13.3 1.10
14 1032 81 7.8 1.11
15 2095 158 7.5 1.08
Mean 11.30 1.12
s.d. 3.91 0.04
c.v. 34.7% 4.0%
EXP+LIN - Equation (3)
Table 3: DE values obtained from the fitting of
equation (3). Keys: s.d.=standard deviation;
c.v.=coefficient of variation.
expressed by m*(D+DE), Equation (2) is basically
supporting the first option. However, the impact of
the second option on the DE value may also be simply
explored by slightly modifying the equation (2), as
following:
𝐼 𝐷 = 𝐼𝑠𝑎𝑡 1 − 𝑒𝑥𝑝 − 𝐷+𝐷𝐸
𝐷0 + 𝑚𝐷 (3) 1
Table 3 shows the parameter values derived from
the fitting of the equation (3). Basically, the
equations (2) and (3) provide the same goodness of
fit, similar relative errors (11.4+4.4 % vs 11.3+3.9%
on average), D0 and m values. The main differences
lie in the modelled Isat and the DE values: using
equation (3) systematically provides higher Isat (+5%
on average) and higher DE values (+12% on average)
than equation (2). However, it is worth noting that the
DE values obtained from each EXP+LIN function are
consistent with unity at 1σ for 11 of 15 of the
samples and at 2σ for all samples. DE values derived
from equation (3) are on average lower by about 26%
than those obtained with the SSE.
The use of equation (3) would mean that the linear
term is the specific result of high doses from
laboratory irradiation, producing paramagnetic
centers that would not be created in nature. However,
because it is almost impossible to know whether the
first or the second option of the EXP+LIN should be
preferred from a physical point of view, it seems
reasonable for the time being to consider a mean DE
value extracted from the fitting of the two EXP+LIN
functions (2) and (3) as the most reliable estimate of
the true DE value.
Conclusions
This work shows that the DRC of quartz is most
appropriately fitted with an EXP+LIN function. This
necessitates that the dose range for the DRC contains
at least 2-3 data points at doses >10 kGy from which
the linear section can be derived. Basically, if the
linear part is not described, then the fitting procedure
with the EXP+LIN becomes difficult, and sometimes
impossible. This is the reason why it is recommended
always to generate these high dose points, even when
working with samples with DE of a few hundreds of
Grays, in order to minimize the impact of the Dmax on
the DE value. The data set of this study (15 samples)
shows the variety of DRC that may be encountered:
the saturation dose D0 varies by a factor of about 3.5
(from 1862 to 6493 Gy), indicating that some
samples need to be more irradiated than others in
order to get a good description of the linear term.
The preferential use of the EXP+LIN function to fit
the experimental ESR data means that the ESR signal
is driven by two main components, one dominating at
low dose and the second dominating at high dose
with an almost linear behaviour. This linear term may
have two possible physical explanations, depending
on the fitting equation selected. It could correspond
to a component following a saturating exponential
behaviour, but with such a large saturation dose that
it can be approximated to a straight line. In that case,
the paramagnetic center production is a continuing
process. Such hypothesis is not so surprising, since
the optical bleaching behaviour of the Al center also
indicated the presence of two components (Voinchet
et al., 2003), the first reducing the ESR intensity by
about 50% within a few hours and the second further
reducing the signal over several tens of days (Duval,
2008). Another hypothesis is that the linear term is
only generated at high doses by laboratory
irradiation, but not in nature. This would need to be
further explored in the future. Given this uncertainty,
the most reasonable option consists in considering a
mean DE value extracted from the fitting of both
types of EXP+LIN functions, in order to encompass
the two hypotheses.
On the other hand, the specificity of the DE
evaluation in ESR dating of quartz in comparison
with other materials, or even with OSL dating, has to
be considered. Since repeated ESR measurements of
each aliquot are needed to ensure the data
reproducibility, then all ESR intensities can be
plotted and taken into account in the DE assessment.
48 Ancient TL Vol. 30 No.2 2012
As soon as the data reproducibility is good, this
would lead to a reduction of the error associated to
the DE value, in comparison with the plotting of a
single set of mean ESR intensities. Such a procedure
has been already suggested in the past by Grün et al
(1992) and Grün and Brumby (1994), but the
specificity of the ESR measurements of quartz makes
now the pooling of ESR intensity necessary.
Finally, it is important to remind that even if the
EXP+LIN function is more appropriate than the SSE
to fit experimental data points of the Al center, this
does not necessarily mean that the derived DE values
are accurate, i.e. the built-up of the natural ESR
signal in the geological past may have been different
to that reconstructed from additive dose points. It is
obvious that additional experiments have to be
carried out, such as comparing regeneration with
additive DRCs on the same samples, and
systematically comparing DRCs from geological
successions, such as river terrace sequences where
the quartz was most likely derived from the same
source.
Acknowledgments
Verónica Guilarte performed some of the ESR
measurements at the CENIEH. Thanks to Davinia
Moreno, who kindly provided the DRCs data of the
Madrid samples, and to all my colleagues, geologists,
archaeologists or paleontologists for their help in the
field. This study was partially sponsored by the
projects CGL2010-16821 and CEN001B10-2 from
the Spanish Ministry of Science and Innovation and
the Junta de Castilla y León, respectively. Finally, I
thank the reviewer, Rainer Grün, for helpful
comments.
Supplementary Information for this article is
available at www.aber.ac.uk/ancient-tl
References
Apers, D, Debuyst, R, de Canniere, P, Dejehet, F and
Lombard, E (1981). A criticism of the dating by
electronic paramagnetic resonance (ESR) of the
stalagmite floors of the Caune de l'Arago at
Tautavel. Absolute Dating and Isotope Analyses
in Prehistory—Methods and Limits, Paris,
CNRS.
Barabas, M, Mudelsee, M, Walther, R and Mangini,
A (1992). Dose-response and thermal behaviour
of the esr signal at g = 2.0006 in carbonates.
Quaternary Science Reviews 11: 173-179.
Berger, GW (1990). Regression and error analysis for
a saturating-exponential-plus-linear model.
Ancient TL 8: 23-25.
Cordier, S, Harmand, D, Lauer, T, Voinchet, P,
Bahain, J-J and Frechen, M (2012).
Geochronological reconstruction of the
Pleistocene evolution of the Sarre valley
(France and Germany) using OSL and ESR
dating techniques. Geomorphology. DOI:
10.1016/j.geomorph.2011.12.038.
Duval, M (2008). Evaluation du potentiel de la
méthode de datation par Résonance de Spin
Electronique (ESR) appliquée aux gisements du
Pléistocène inférieur : étude des gisements
d’Orce (bassin de Guadix-Baza, Espagne) et
contribution à la connaissance des premiers
peuplements de l’Europe. Prehistory. Paris,
Muséum National d'Histoire Naturelle. PhD:
522.
Duval, M, Grün, R, Falguères, C, Bahain, JJ and
Dolo, JM (2009). ESR dating of Lower
Pleistocene fossil teeth: Limits of the single
saturating exponential (SSE) function for the
equivalent dose determination. Radiation
Measurements 44: 477-482.
Duval, M, Moreno, D, Shao, Q, Voinchet, P and
Falguères, C (2011). Datación por ESR del
yacimiento arqueológico del Pleistoceno
inferior de Vallparadís (Terrassa, Cataluña,
España). Trabajos de Prehistoria 68: 7-24.
Fattahi, M, Stokes, S and Lamothe, M (2004). Red
luminescence emission from potassium
feldspars stimulated by infrared. Ancient TL 22:
35-44.
Goldberg, M, Mattern, PL, Lengweiler, K and Levy,
PW (1973). Radiation induced coloring of
Cherenkov counter glasses. Nuclear Instruments
and Methods 108: 119-123.
Grün, R (1990). Dose Response of the Paramagnetic
Centre at g = 2.0007 in Corals. Ancient TL 8:
20-22.
Grün, R and Brumby, S (1994). The assessment of
errors in past radiation doses extrapolated from
ESR/TL dose-response data. Radiation
Measurements 23: 307-315.
Hoffmann, D, Woda, C and Mangini, A (2003).
Equivalent dose determination in foraminifera:
analytical description of the CO2−-signal dose–
response curve. Radiation Measurements 37:
95-101.
Lee, H-K, Jack Rink, W and Schwarcz, HP (1997).
Comparison of ESR signal dose-responses in
modern and fossil tooth enamels. Radiation
Measurements 27: 405-411.
Levy, PW (1985). Overview of nuclear radiation
damage processes: phenomeno-logical features
of radiation damage in crystals and glasses.
SPIE 541: 2-24.
Lin, M, Yin, G, Ding, Y, Cui, Y, Chen, K, Wu, C and
Xu, L (2006). Reliability study on ESR dating
Ancient TL Vol. 30 No.2 2012 49
of the aluminum center in quartz. Radiation
Measurements 41: 1045-1049.
Liu, C-R, Yin, G-M, Gao, L, Bahain, J-J, Li, J-P, Lin,
M and Chen, S-M (2010). ESR dating of
Pleistocene archaeological localities of the
Nihewan Basin, North China – Preliminary
results. Quaternary Geochronology 5: 385-390.
Lyons, RG, Brennan, BJ and Hosking, PL (1992).
Estimation of accumulated dose and its
uncertainties: potential pitfalls in curve fitting.
Ancient TL 10: 42-49.
Rink, JW and Schwarcz, HP (1994). Dose response
of ESR signals in tooth enamel. Radiation
Measurements 23: 481-484.
Rink, WJ, Bartoll, J, Schwarcz, HP, Shane, P and
Bar-Yosef, O (2007). Testing the reliability of
ESR dating of optically exposed buried quartz
sediments. Radiation Measurements 42: 1618-
1626.
Voinchet, P, Falguères, C, Laurent, M, Toyoda, S,
Bahain, JJ and Dolo, JM (2003). Artificial
optical bleaching of the Aluminium center in
quartz implications to ESR dating of sediments.
Quaternary Science Reviews 22: 1335-1338.
Voinchet, P, Falguères, C, Tissoux, H, Bahain, J-J,
Despriée, J and Pirouelle, F (2007). ESR dating
of fluvial quartz: Estimate of the minimal
distance transport required for getting a
maximum optical bleaching. Quaternary
Geochronology 2: 363-366.
Voinchet, P, Despriée, J, Tissoux, H, Falguères, C,
Bahain, JJ, Gageonnet, R, Dépont, J and Dolo,
JM (2010). ESR chronology of alluvial deposits
and first human settlements of the Middle Loire
Basin (Region Centre, France). Quaternary
Geochronology 5: 381-384.
Walther, R, Barabas, M and Mangini, A (1992).
Basic ESR studies on recent corals. Quaternary
Science Reviews 11: 191-196.
Yokoyama, Y, Falgueres, C and Quaegebeur, JP
(1985). ESR dating of quartz from quaternary
sediments: First attempt. Nuclear Tracks and
Radiation Measurements 10: 921-928.
Reviewer
R. Grün

50 Ancient TL Vol. 30 No.2 2012